RMON Events on 200/300 Series Managed Switches
Available Languages
Objective
Remote Networking Monitoring (RMON) allows a switch to proactively monitor traffic statistics and send an alarm if traffic exceeds a predefined threshold. The advantage of RMON is that the switch does not need a request from the SNMP manager to send information, it can send information when it needs to. This decreases traffic between the manager and the switch.
On the 200/300 Series Managed Switches, you can determine what events trigger an alarm and what type of response occurs when an alarm is triggered. The event log records the alarms that have been set off. This article explains how to create an event (actions that occur when an alarm is triggered), determine the criteria that trigger an alarm, and view the event log.
Applicable Devices
• SF/SG 200 and SF/SG 300 Series Managed Switches
Software Version
• 1.3.0.62
Create RMON Event
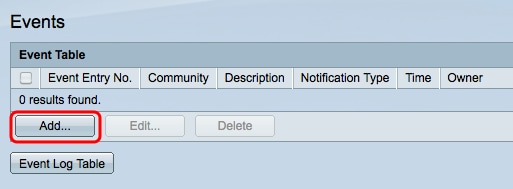
Step 1. Log in to the web configuration utility and choose Status and Statistics > RMON > Events. The Events page opens:

Step 2. Click Add to create a new event in the Event Table. The Add RMON Events window appears.

Step 3. (Optional) Enter the SNMP community string to be included when alarm messages are sent in the Community field.
Step 4. Enter a description of the event that will trigger the alarm in the Description field. This is the name used to attach an alarm to the event.
Step 5. Click the radio button that corresponds to the action that results from this event in the Notification Type field. The available options are:
• None — No action occurs when the alarm for the event goes off.
• Log (Event Log Table) — Add a log entry to the Event Log table when the alarm goes off.
• Trap (SNMP Manager and Syslog Server) — Send a trap (alarm message) to the remote log server when the alarm goes off.
• Log and Trap — Add a log entry to the Event Log table and send a trap to the remote log server when the alarm goes off.
Step 6. Enter the name of the device or the user that configured the event in the Owner field.
Step 7. Click Apply to save the settings and then click Close to exit the Add RMON Events window.

Step 8. (Optional) Check an event check box in the Event Table and click Edit to edit the event.
Step 9. (Optional) Check an event check box in the Event Table and click Delete to delete the event.
Define an RMON Alarm
Step 1. Log in to the web configuration utility and choose Status and Statistics > RMON > Alarms. The Alarms page opens:

Step 2. Click Add to create a new alarm. The Add Alarm Entry window appears.

Step 3. In the Interface field, click the appropriate radio button to define the interface that the alarm is set to and then choose the interface from the appropriate drop-down list.
• Port — The physical port on the switch.
• LAG — A group of ports that act as a single port.
Step 4. From the Counter Name drop-down list, choose the variable to be measured.
Step 5. In the Sample type field, click the radio button that corresponds to the sampling method to generate an alarm.
• Absolute — Alarm is triggered when the threshold is crossed.
• Delta — The last sampled value is subtracted from the current value. The alarm is triggered if the difference in the values exceeds the threshold.
Step 6. In the Rising Threshold field, enter the value that triggers the rising threshold alarm.
Step 7. From the Rising Event drop-down list, choose an event to be performed when a rising event is triggered. This event will have been created in the Events page and is explained in the section above.
Step 8. In the Falling Threshold field, enter the value that triggers the falling threshold alarm.
Note: After a rising threshold is crossed, no additional rising alarms will occur until the falling threshold is also crossed. Once the falling threshold has been crossed, the rising threshold alarm will again be activated.
Step 9. From the Falling Event drop-down list, choose an event to be performed when a falling event is triggered.
Step 10. In the Startup Alarm field, click the radio button that corresponds to the method that triggers the event.
• Rising Alarm — A rising value triggers the rising threshold alarm.
• Falling Alarm — A falling value triggers the falling threshold alarm.
• Rising and Falling — Both the rising and falling values trigger the alarm.
Step 11. In the Interval field, enter the alarm interval time (in seconds). This is the amount of time that the alarm waits before it checks to see if the conditions are met to trigger the alarm.
Step 12. In the Owner field, enter the name of the network management system that receives the alarm or the name of the user that created the alarm.
Step 13. Click Apply to save the changes and then click Close to exit the Add Alarm Entry window.

Check RMON Event Log Table
Step 1. Log in to the web configuration utility and choose Status and Statistics > RMON > Events. The Events page opens:

Step 2. Click Event Log Table. The Event Log Table page opens and displays the following information:

Note: Entries are only written in the event log table if Log was chosen in Step 5 of the Create RMON Event section.
• Event Entry No. — The log entry number of the event.
• Log No. — Log number within the event.
• Log Time — The time of the log entry.
• Description — Description of the event that triggered the alarm.
Revision History
| Revision | Publish Date | Comments |
|---|---|---|
1.0 |
12-Dec-2018 |
Initial Release |
 Feedback