View Quality of Service (QoS) Single Policer Statistics on 300 Series Managed Switches
Available Languages
Objective
QoS policing is used to limit traffic flow. A single policer applies a QoS policy to a single class map. The single policer applies the QoS policy to only one flow of traffic. Incoming traffic is selected with an access list (ACL) and if there is a single policer attached to that traffic class, then that traffic is acted on by the QoS policy applied to that interface. Traffic that meets the conditions of the class map of a policy for that interface and falls within the rate limit of that policy will show up as In-Profile Bytes if an entry has been added to monitor that specific combination of interface, policy, and class map under the Single Policer Statistics page. Matched traffic that exceeds the rate limit defined in the QoS policy for that interface will show up as Out-of-Profile Bytes. Out-of-profile traffic may be dropped, modified, or left alone depending on how the policy is configured.
A request to track single policer statistics on a given interface, policy, and class map must be made before any statistics are recorded and available for viewing.
This article explains how to view single policer statistics on the 300 Series Managed Switches.
Note: Several setting must be configured before you can monitor single policer statistics.
• The switch must be in layer two mode. Refer to the article System Settings Configuration on 200/300 Series Managed Switches for more information.
• The switch must be set to QoS advanced mode. Refer to the article QoS Advanced Mode Configuration on 300 Series Managed Switches for more information.
• You must have an ACL created and in use.
• You must create a Class Map.
• You must create a QoS Policy.
• You must create a a Policy Class Map that uses a single policer.
• You must bind the policy to a port.
Applicable Devices
• SF/SG 300 Series Managed Switches
Software Version
• v1.2.7.76
Track Single Policer Statistics on an Interface
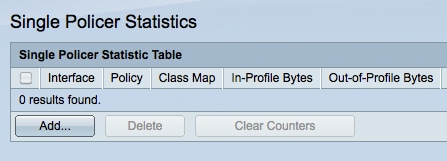
Step 1. Log in to the web configuration utility and choose Quality of Service > QoS Statistics > Single Policer Statistics. The Single Policer Statistics page opens.

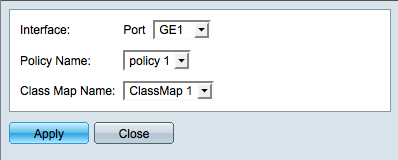
Step 2. Click Add to create a request for statistics to be tracked on an interface. A pop-up window opens.
Note: Single policer statistics are not tracked unless a request for statistics for a given policy and class name on an interface is setup.

Step 3. In the pop-up window, choose the interface for statistics to be tracked on from the Interface drop-down list.
Step 4. Choose the policy for statistics to be tracked on from the Policy Name drop-down list.
Note: A request to track statistics on a policy can only be made if the chosen Policy Name has been bound to the chosen Interface.
Step 5. Choose a class name for statistics to be tracked on from the Class Map Name drop-down list.
Note: Class names will only show up that have been mapped to the chosen Policy Name.
Step 6. Click Apply to begin tracking statistics for the chosen interface on the policy and class name provided. The pop-up window closes.
View Single Policer Statistics
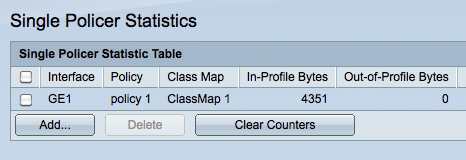
Step 1. Access the Web based graphical user interface of the switch by entering the IP address of the device into a Web browser. Choose Quality of Service > QoS Statistics > Single Policer Statistics. The Single Policer Statistics page opens.

Step 2. Each interface that has a request for statistics to be tracked will display the following information:
• Interace — The interface that statistics are being tracked on.
• Policy — The name of the policy that statistics are being tracked on.
• Class Map — The name of the class map that statistics are being tracked on.
• In-Profile Bytes — The number of bytes that meet the conditions defined by the class map of the policy and fall within the specified rate limit of the policy.
• Out-of-Profile Bytes — The number of bytes that meet the conditions defined by the class map of the policy and exceed the specified rate limit of the policy.
Step 3. (Optional) Click Clear Counters to reset In-Profile bytes and Out-of-Profile bytes statistics to zero.
Revision History
| Revision | Publish Date | Comments |
|---|---|---|
1.0 |
10-Dec-2018 |
Initial Release |
 Feedback