Introduction
This document describes the new Device Health monitoring feature added in 6.7 and 7.0 releases.
Background Info
The problem:
The health monitoring system provides visibility into device’s performance for reactive debugging and proactive actions.
Comprehensive visibility and analysis is obtained by:
- Trend charts for key metrics
- Event Overlay
- Customizable dashboards
- Unified health monitoring architecture – see same data for all managers
- Lot of new metrics and extensibility of metrics to add many more
What’s New in 7.0 release
What’s new or different compared to FP 7.0
- FMC Dashboard with HA support
- 110+ new metrics for FTD
- Health alert for FTD split brain scenario
- Custom run time interval for newer health metrics
Benefits
- Aids in system debugging by providing ability to correlate data from different sub-systems and resources on device
- Visibility to various system performance metrics
- Capacity planning
New on 6.7
New or different compared to the release immediately preceding (high-level):
- New user interface for device health monitoring on FMC
- FTD Device REST API: device-metric API: A lot of new metrics added
- FMC APIs: New APIs: health alerts, health metrics and deployment details
- High-level marketplace overview, real world applications
- Aids in system debugging by providing ability to correlate data from different sub-systems and resources on device
- Visibility
- Capacity planning
Feature Overview
How it Works
- Device Health Monitoring in FP 7.0
- New health dashboard for FMC which provides Trend charts, overlays and custom dashboards
- New FTD metrics available in FTD dashboards
- 110+ metrics covering 12 categories
- FTD APIs: makes metrics available to query by external entities
Under the hood,
- Collects the health of a device with Telegraf (an open-source metric collection framework)
Additional Notes
Health monitoring data is available
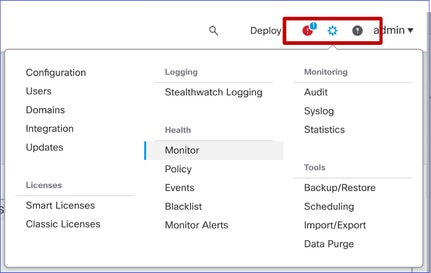
- In the FMC Health Dashboard, accessible from the system menu (System > Health > Monitor)
- From the FMC REST API
- When the device is managed by FDM, via the FTD Device REST API
Some of the metrics (both FMC and FTD) are disabled by default
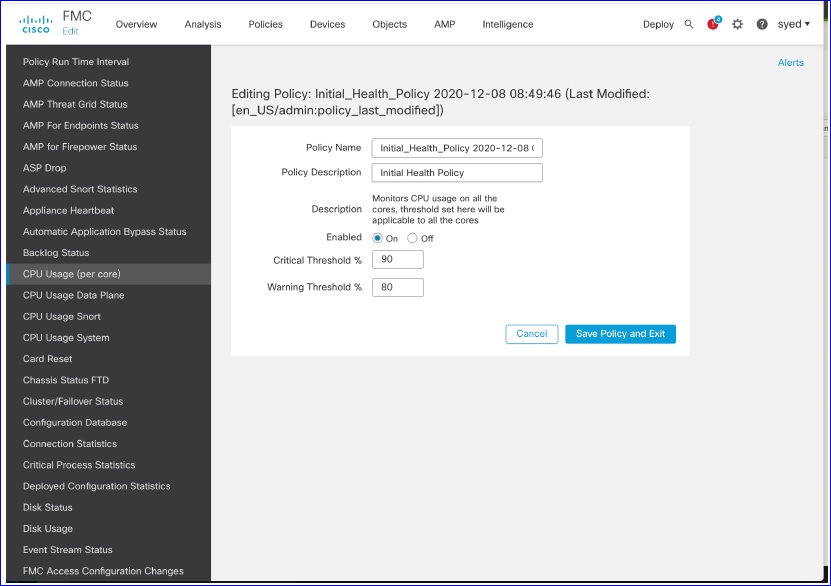
- Health modules in Health Policy need to be enabled and deployed for some metrics to appear.
Implementation of enhancements requested by FP 6.7 IFT’ers
- Auto refresh by default
- Filter with custom time range on dashboard
- Select interfaces by user-defined name (as well as physical interface name) in the interface selector
- Cross launch device dashboard from Health Monitor 'Home' page
Device Health Monitoring in FP 6.7
- New UI on FMC which provides Trend charts, overlays and custom dashboards.
- FTD APIs: makes same metrics available to query by external entities
Summary of Limitations:
- The feature is not supported on FDM GUI or CDO
- Monitoring FMC itself within the new health monitoring UI is not supported.
- Poll intervals are not configurable. You cannot configure different poll intervals for different devices. All are polled at fixed one-minute interval.
Deployment Examples
- No Specific deployment needed to test the feature. Just upgrade FMC and device to FP 6.7.
- Health monitoring data is available in the FMC health dashboard, accessible from system tab.
Prerequisites and Supported Platforms
Minimum Supported Software and Hardware Platforms
|
Min Supported Manager Version
|
Managed Devices
|
Min Supported Managed Device Version Required
|
Notes
|
|
FMC 6.7
|
FTD 6.7
|
FXOS 2.9.1
FTD 6.7
|
Supported only on FTDs
|
|
FTD Device REST API
|
FTD 6.7
|
FXOS 2.9.1
FTD 6.7
|
FTD Device REST API only
(not FDM or CDO GUIs)
|
Interoperability
No specific requirements for interoperability.
Feature Details 7.0
FMC UI: Standalone and HA Support
Health Monitoring Page Navigation

- Standalone FMC is shown as a single node
- FMC HA shown as a pair of nodes
- Each FMC is shown with health status
Health Status
- FMC HA is shown in twin-hexagon.
- FMC Active and Standby devices are listed in the alert table as well.
FMC Dashboard
FMC Health Monitoring Dashboard in 7.0

Summary view of:
- High Availability
- Event Rate and Capacity
- Process Health
- CPU
- Memory
- Interface
- Disk
This dashboard is available to both Active and Standby FMCs. User can create custom dashboards to monitor metrics of their choice.
FMC Dashboard: FMC HA Panel
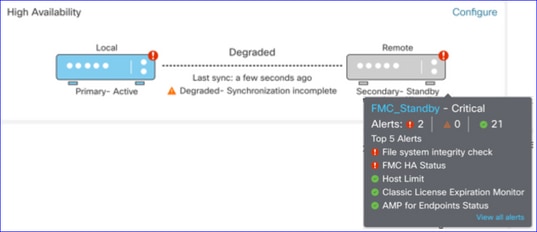
HA Panel shows
- Current HA status
- Active vs. Standby
- Last sync time
- Device Health
FMC Dashboard: Event Rate and Capacity
Event Rate
- Maximum event rate as base line
- Overall event rate FMC receives
Event Capacity
- Current consumption by event categories
- Retention time of events
- Current vs. Maximum
event capacity

FMC Dashboard: Event Capacity
Normal Event Capacity Consumption State

Overflow scenario, when events are stored beyond the configured maximum capacity.
- Bold text indicates overflow
- A warning icon highlights the capacity overflow
FMC Dashboard: FMC Process Panel
Critical processes panel shows
- Process current state
- Process restart count

The process panel shows these metrics for all ‘pmconfig’ processes:
- Current State
- CPU Usage
- Memory Usage

FMC Dashboard: FMC CPU
CPU Panel shows
- Average CPU (default)
- All Cores

FMC Dashboard: Other Panels
Memory panel shows overall memory usage on FMC

Interface panel shows input/output rate of average of all interfaces

Disk panel shows
- Entire disk capacity
- Critical partition capacity where FMC data is stored

Run Time Interval
- Run time interval for old health module is renamed as ‘Legacy Run Time Interval’
- ‘Run Time Interval’ targets the new Telegraf based health modules
- Global setting, affects all devices

Available Metrics
Metrics Available for Custom Dashboards
- If a user wants to make a custom dashboard, these slides are a guide to available metrics.
- Some metrics have to be enabled in Health Policy before they can used in a Custom Health Dashboard
FMC UI: FMC Custom Dashboard
New FMC Monitoring Metrics categories in 7.0
- CPU
- Memory
- Interface
- Disk
- Event
- Process
- RabbitMQ
- Sybase
- MySQL
FMC UI: FMC Metrics
40 metrics added across different categories (available in custom dashboard). In order enable the disabled metrics, enable the corresponding health module in the associated health policy (System > Health > Policy).
|
Metric Group Name
|
Enabled by default
|
Description
|
|
CPU
|
No
|
Monitors FMC CPU
|
|
Memory
|
Yes
|
Monitors FMC Memory
|
|
Disk
|
Yes
|
Monitors FMC Disk Usage
|
|
Interface
|
Yes
|
Monitors FMC Interface
|
|
Process
|
Yes
|
Monitors FMC processes
|
|
Event
|
Yes
|
Monitors Event Rate
|
|
MySQL
|
No
|
Monitors MySQL
|
|
RabbitMQ
|
No
|
Monitors RabbitMQ
|
|
Sybase
|
No
|
Monitors Sybase
|
FTD: Metrics Introduced in FP 7.0
Enabled by default: Metrics are collected by default. In order enable the disabled metrics, enable the corresponding health module in the associated health policy (System > Health > Policy).
|
Metric Group Name
|
Enabled by default
|
Description
|
Platform
|
|
Chassis Status
|
Yes
|
Monitors different Chassis parameters like Fan speed, and temperature.
|
Applicable to only FPR2100 and FPR1000 platforms
|
|
Flow offload
|
Yes
|
Monitors hardware flow offload statistics
|
Applicable to FPR9300
and FPR4100 platforms
|
|
ASP drops
|
Yes
|
Monitors Lina side packet drops
|
All
|
|
Hit counts
|
No
|
Monitors hit counts for Access Control Policy Rules
|
All
|
|
AMP Threat Grid Status
|
Yes
|
Monitors connectivity to AMP
ThreatGrid
|
All
|
|
AMP Connectivity Status
|
No
|
Monitors AMP cloud connectivity from the FTD
|
All
|
|
SSE connector status
|
No
|
Monitors SSE cloud connectivity from the FTD
|
All
|
|
NTP Status
|
No
|
Monitors NTP clock synchronization parameters on
the FTD
|
All
|
|
VPN statistics
|
Yes
|
Monitors S2S and RA VPN Tunnel statistics
|
All
|
|
Route statistics
|
Yes
|
Monitors Lina side packet drops
|
All
|
|
Snort 3 perf stats
|
Yes
|
Monitors certain Snort3 performance statistics (perfstats)
|
All
|
|
xTLS counters
|
No
|
Monitors xTLS/SSL flows, memory and cache effectiveness
|
All
|
REST APIs, Syslog, SNMP
No new FMC or FTD Device REST APIs have been introduced in 7.0. The existing REST APIs support new metrics added in 7.0.
Syslog and SNMP
Syslog
- No change in syslog for health monitor
SNMP
- Separate TOI for ”SNMP Device Health Monitoring”
SAL/CTR/3rd Party product integration
- Separate TOI for ‘Azure Application Insights’ support
- No specific change done to support integrating ‘Health Monitoring’ with SAL/CTR/SecureX
- REST API can be leveraged for 3rd party integration
Software Technology
Feature Details 6.7
New NGFW Health Monitoring for FTD Health and Performance
Helps users with
- Reactive debugging, like root cause analysis the problem after it has happened
- Proactive actions such as monitoring usage and saturation levels to identify potential capacity issues and thereby helping users to do capacity enhancements or refactoring.
Highlights
- Trend charts: Trend charts make it very easy to detect anomalies and determine a root cause of issues. With visual inspection trends can be spotted and correlations can be plotted between different metrics to find causal relation between them.
- Event overlays: Event overlays show important information, such as config deployment and SRU updates on trend charts to indicate causal relationships.
- Customizable dashboards: Users can make their own dashboards to group metrics they wish to see together on one page.
- Unified Health monitoring architecture: Single point of collection and export for metrics irrespective of which manager is “interested” in the metrics. FTD APIs as well as the FMC use data from the same metrics collector.
- Extensibility of metrics: One of the goals of the architecture for the platform was to be able to easily add new metrics. This is achieved by using Open Source metrics collection and storage tools and with customizable dashboards.
FMC GUI
FMC UI: Navigate to Health Status
On FMC, click on the System icon > Health > Monitor to navigate to the Health Status page.

FMC UI: New Health Status Page
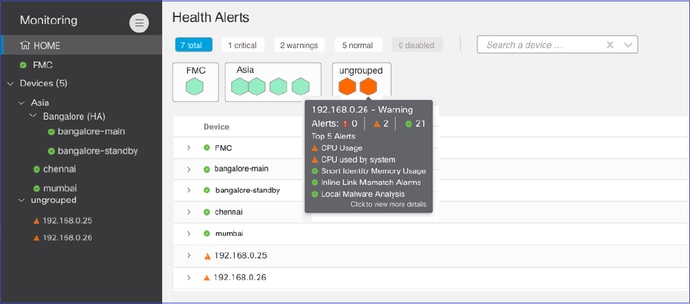
The Health Status page is designed to show a health overview of all the devices that the FMC manages, including the health of the FMC.
- Devices are grouped as per their group/ha/cluster.
- A dot to the left of the device indicates its health
- Green – no alarms
- Orange – at least one health warning
- Red – at least one critical health alarm
- Health summary is shown when hovering at the hexagon that represents the device health.
- Thresholds for warningand critical can be configured in health policy, in the same way it was done pre-FP 6.7.
FMC UI: Device Health Events
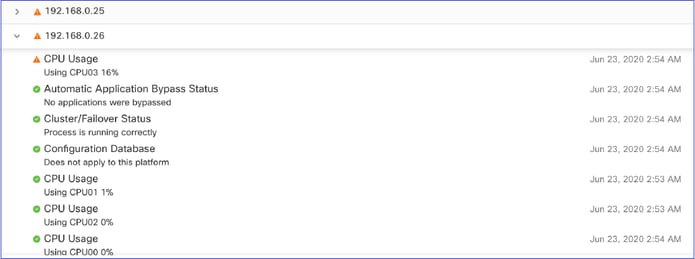
Click the device in the bottom panel to display the health events associated with the device Alerts are sorted by their health status (severity).
Health monitoring page
FMC UI: FMC Health Monitoring is Unchanged
The FMC health page is still the legacy page. The new UI is supported only for FTD with 6.7+

FMC UI: New! Device Dashboards
- Click the device name in the left pane to get to the device’s health overview page.
- The health overview has all the key health metrics trend charts.
- Various time ranges are available (default to last 1 hour)
- Auto-refresh to reload the graph

FMC UI: Deployment data overlay
Click the deployment icon to show deployment overlay details on the graph w.r.t selected time range
- Icon indicates the number of deployments during the selected time-range
- Band appears to indicate deployment start and end time.
- In case of multiple deployments, multiple bands/lines appear
- Click the icon on top of the dotted line to show the details

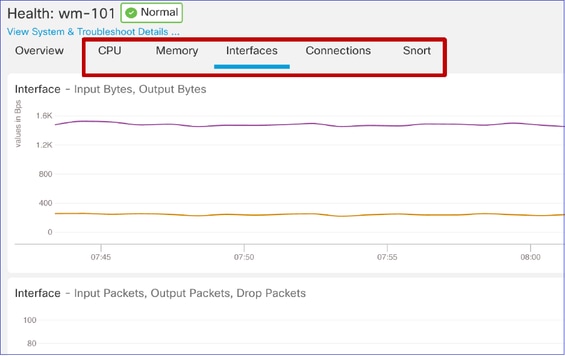
FMC UI: Device Pre-Built Dashboards
- There are pre-built health dashboards present in the FMC UI.
- These pre-built dashboards come with related metrics grouped together.
- The interface dashboard has trend chart for all interface-related metrics such as input/output bytes, packets, and average packet size for different interfaces.
FTD Snort Memory - From where does it originate?

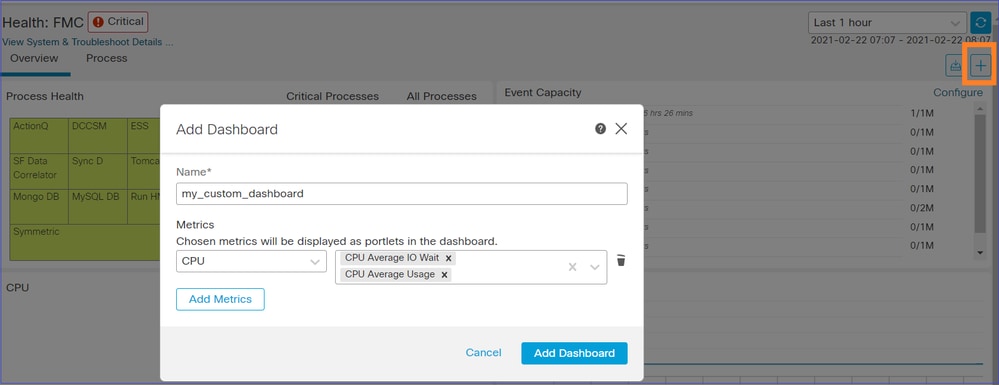
FMC UI: Custom Dashboards Can Be Created
Users can create their own Custom dashboard
- In addition to pre-built dashboards, a user can also create custom dashboards.
- In custom dashboard, any number of metrics can be added.
- Typically, a custom dashboard would be created if metrics from different metric groups could be correlated to arrive at the root cause of a problem.
- In case of high Lina CPU, one is able to see incoming Connection Per Second (CPS), interface stats (and so on) which can cause the CPU to go high.

FMC UI: Create a Custom Dashboard
Correlate Metrics Dialog
- When a user clicks “+” to create a custom dashboard, the Correlate Metrics window opens.
- A user can add different metrics which the user wants to monitor together.

Gathering Data from (device) - GUI
Data for a Time Range Showing in GUI
When the Health Monitor does not have data for the selected time range, GUI shows ‘No Data Available’ in the dashboard panel:

In case of data available, graph appears like this:

Use the Browser’s Console and Network Tabs
Browser Console log and Network call log
- In this example, the Chrome browser developer console is shown
- In case of error, exception details are shown in the console log

Browser Console Log Example

References
FMC Health Monitoring - 6.7


 Feedback