Troubleshoot Layer-2 Loops on Catalyst 9000 Series Switches
Available Languages
Download Options
Bias-Free Language
The documentation set for this product strives to use bias-free language. For the purposes of this documentation set, bias-free is defined as language that does not imply discrimination based on age, disability, gender, racial identity, ethnic identity, sexual orientation, socioeconomic status, and intersectionality. Exceptions may be present in the documentation due to language that is hardcoded in the user interfaces of the product software, language used based on RFP documentation, or language that is used by a referenced third-party product. Learn more about how Cisco is using Inclusive Language.
Introduction
This document describes how to identify and troubleshoot layer 2 loops in networks including Catalyst 9000 series switches.
Prerequisites
It is recommended that you understand spanning-tree protocol concepts.
Components Used
This document is not restricted to specific software or hardware versions.
The information in this document was created from the devices in a specific lab environment. All of the devices used in this document started with a cleared (default) configuration. If your network is live, ensure that you understand the potential impact of any command.
Background Information
Layer 2 loops cause havok on a local-area network. The resultant "broadcast storm" interferes with communication within impacted virtual lans (VLANs) and bogs down endpoints and network devices alike. The problem gains momentum over time since the layer 2 traffic has no mechanism such as time-to-live (TTL) that eventually causes a packet to be consumed on the network. Looped traffic such as address resolution protocol (ARP) or dynamic host configuration protocol (DHCP) traffic instead loops infinitely until the loop is broken. An individual charged with the investigation of an active loop finds themselves in a stressful position.
Luckily there are tried and true methods to investigate and troubleshoot layer 2 loops. This document outlines the methodology used by generations of TAC engineers.
Spanning-Tree: How does it prevent loops?
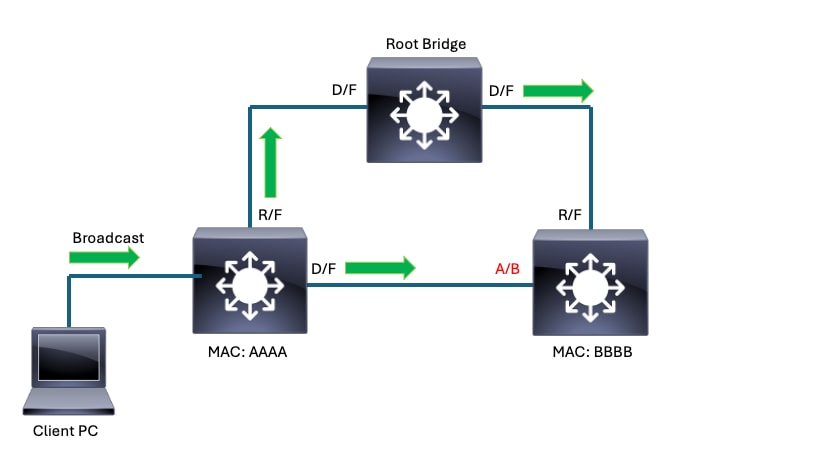
This simple topology shows spanning-tree protocol in action. These points are true for this topology:
- All links in this example are of equal bandwidth.
- D/F stands for Designated (the port role) Forwarding (the port state).
- R/F stands for Root (the port role) Forwarding (the port state).
- A/B stands for Alternate (the port role) Blocking (the port state).
- The root bridge election resulted with the identified switch elected as root bridge. All interfaces on the root bridge are in the 'designated' role and the 'forwarding' state.
- The root port for switches AAAA and BBBB is the port connecting each switch directly to the root bridge.
- On the link connecting AAAA to BBBB, the designated port belongs to AAAA by virtue of bridge MAC.
- On the link connecting AAAA to BBBB, the blocking port belongs to BBBB by virtue of the bridge MAC.
Spanning-tree has converged in this topology so that loops are prevented. The green arrows represent how a broadcast packet transmitted by a client PC would forward on the interconnected switches. The blocking port on BBBB prevents the broadcast transmitted by the client from looping indefinitely amongst the devices.
How do layer 2 broadcast storms form?
There are many scenarios where the loop prevention afforded by spanning-tree does not prevent a broadcast storm.
Physical (layer1) issues on the network can result in unidirectional links, preventing spanning-tree speakers from the reliable exchange of BPDUs. Unreliable receipt or delivery of BPDUs cause undesired and unexpected spanning-tree convergence.
Example 1:
In this scenario, BBBB stops receiving BPDUs from the root bridge on its root port. BBBB converges in response to this loss of BPDUs. Its root port is no longer a viable path to root since it no longer receives BPDUs and becomes a designated port. Its blocking port continues to receive BPDUs from AAAA and becomes root port. Neither interfaces block so a loop ensues.
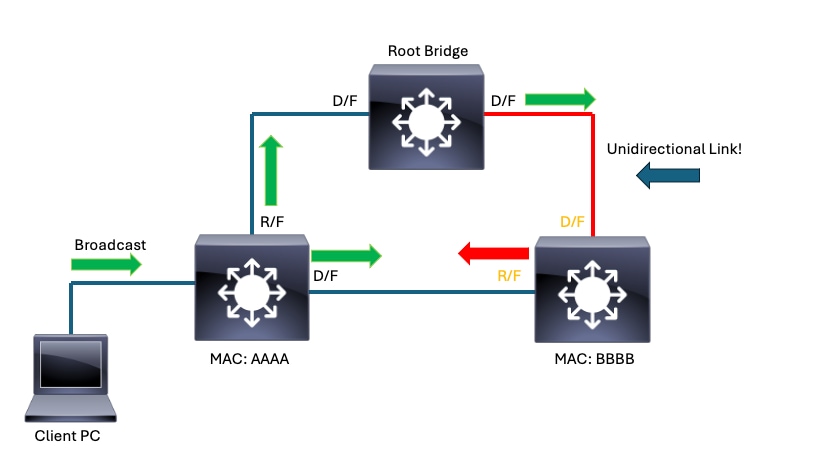 Unidirectional Link causes Spanning-Tree to converge unexpectedly
Example 2:
Network disruptions can also occur when spanning-tree is converged as expected. Certain devices connected to the network can be vectors for loops. A hub or similar device unexpectedly connected to the network can result in broadcast storms.
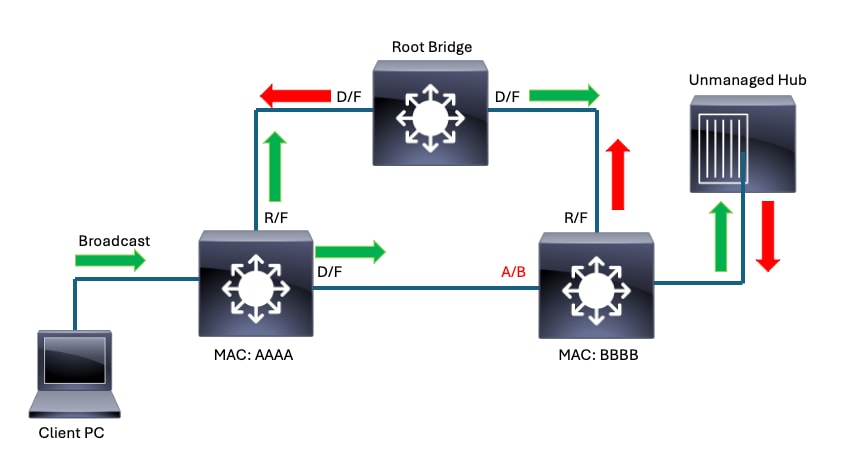 Hub connected to network results in broadcast storm
Troubleshooting
There are many ways network engineers tend to approach layer 2 loops and broadcast storms. This section outlines a tried and true method that has been tested in countless TAC cases and catastrophic outages.
This method leverages very basic commands and eschews data points such as Spanning Tree Protocol (STP) topology change notifications (TCNs) which can be chaotic to chase. TCNs in a Rapid STP (RSTP) topology occur when non-edge ports move to FORWARDING from BLOCKING. The loop itself can burden STP speakers to the point where they cannot predictably participate in convergence. Interfaces on victimized switches move to FORWARDING if they are unable to properly process inbound BPDUs due to their congested control-plane. The TCNs are often symptoms that reveal victimized devices, but not necessarily to the source of the loop.
Instead of STP TCNs, a more valid and linear data point to consider are interface input rates. Interfaces that participate in the loop shows much higher than expected input rates. Output rates are not as much of a concern since these downstream devices are likely victims themselves. You can also observe a high rate of broadcast and multicast on impacted interfaces and notice that the average packet size skews to a smaller than expected value.
With just these commands, a network engineer can isolate most if not all layer 2 loops in a straightforward fashion:
-
show interfaces | include is up|input rate
- show cdp neighbors <interface> OR show lldp neighbors <interface>
- show spanning-tree
The command "show interfaces | include is up|input rate" with the pipe and arguments provides us with a quickly digestible snippet of output. It shows us all of our interfaces that are currently 'up' as well as their input rates. For our purposes, we only care about input rates. Interfaces with unexpectedly high input rates are likely to be victims of the loop. The device connected to an interface with an unexpectedly high input rate is likely closer to the source of the loop. Interfaces with unexpectedly high output rates liklely lead us away from the source of the loop.
ACCESS-SWITCH1#show interfaces | in is up|input rate
<snip>
GigabitEthernet1/0/1 is up, line protocol is up (connected) <----- Typical endpoint with a low input rate. This would not raise suspiscion.
  5 minute input rate 33000 bits/sec, 21 packets/sec
GigabitEthernet1/0/2 is up, line protocol is up (connected)
  5 minute input rate 24000 bits/sec, 11 packets/sec
<snip>
  5 minute input rate 0 bits/sec, 0 packets/sec            <----- This output represents interfaces that are down.
  5 minute input rate 0 bits/sec, 0 packets/sec
  5 minute input rate 0 bits/sec, 0 packets/sec
  5 minute input rate 0 bits/sec, 0 packets/sec
  5 minute input rate 0 bits/sec, 0 packets/sec
TwentyFiveGigE1/1/1 is up, line protocol is up (connected) <----- Twe1/1/1 in this scenario is high-bandwith uplink interface. We would expect uplinks to have a fair amount of traffic on input.
  5 minute input rate 2816922000 bits/sec, 2072252 packets/sec.    If we were troubleshooting a loop, pay special attention to this interface given the input rate.
TwentyFiveGigE1/1/2 is up, line protocol is up (connected)
    5 minute input rate 2926942401 bits/sec, 3043467 packets/sec <-- The same logic goes for this port. The input rate is relatively high but that is possibly function of its position in the network.
TwentyFiveGigE1/1/3 is up, line protocol is up (connected)
      5 minute input rate 0 bits/sec, 0 packets/sec
<snip>
- show cdp neighbors <interface> OR show lldp neighbors <interface>
ACCESS-SWITCH1#show cdp neighbor twe1/1/1
Capability Codes: R - Router, T - Trans Bridge, B - Source Route Bridge
                  S - Switch, H - Host, I - IGMP, r - Repeater, P - Phone,
                  D - Remote, C - CVTA, M - Two-port Mac Relay

Device ID        Local Intrfce     Holdtme    Capability  Platform  Port ID
ACCESS-SWITCH2           Twe 1/1/1         142              S I   C9300-48P Twe 1/1/4 <--- We confirm that the expected neighbor is attached to this interface.

Total cdp entries displayed : 1-
show spanning-tree
Use this command to understand how the local switch believes spanning-tree is converged. Keep in mind the differences in the various flavors of spanning-tree. Catalyst switches run rapid-PVST by default but support PVST and MST.
ACCESS-SWITCH1#show spanning-tree

VLAN0001                                  <----- Keep in mind that in per-vlan spanning-tree, each VLAN represents a unique instance of spanning-tree
  Spanning tree enabled protocol rstp
  Root ID    Priority    1
             Address     380e.4d77.4800
             Cost        2000
             Port        3 (TwentyFiveGigE1/0/3)
             Hello Time   2 sec  Max Age 20 sec  Forward Delay 15 sec

  Bridge ID  Priority    32769  (priority 32768 sys-id-ext 1)
             Address     b08b.d08d.6b80
             Hello Time   2 sec  Max Age 20 sec  Forward Delay 15 sec
             Aging Time  300 sec

Interface           Role Sts Cost      Prio.Nbr Type
------------------- ---- --- --------- -------- --------------------------------
Gig1/0/1            Desg FWD 20000     128.1    P2p
Gig1/0/2            Desg FWD 20000     128.2    P2p
<snip>
Twe1/1/1            Root FWD 800       128.33   P2p
Twe1/1/2            Desg FWD 800       128.34   P2p
Twe1/1/3            Alt  BLK 800       128.35   P2p <---- This output corresponds with expectation. This step helps to populate STP information in your topology as you move from device to device
This simple straightforward method avoids time-consuming packet captures, eliminates focus on spanning-tree TCNs and keeps the actual problem at the forefront of the investigation. It also eliminates "guess and check" troubleshooting.
Consider this topology diagram:
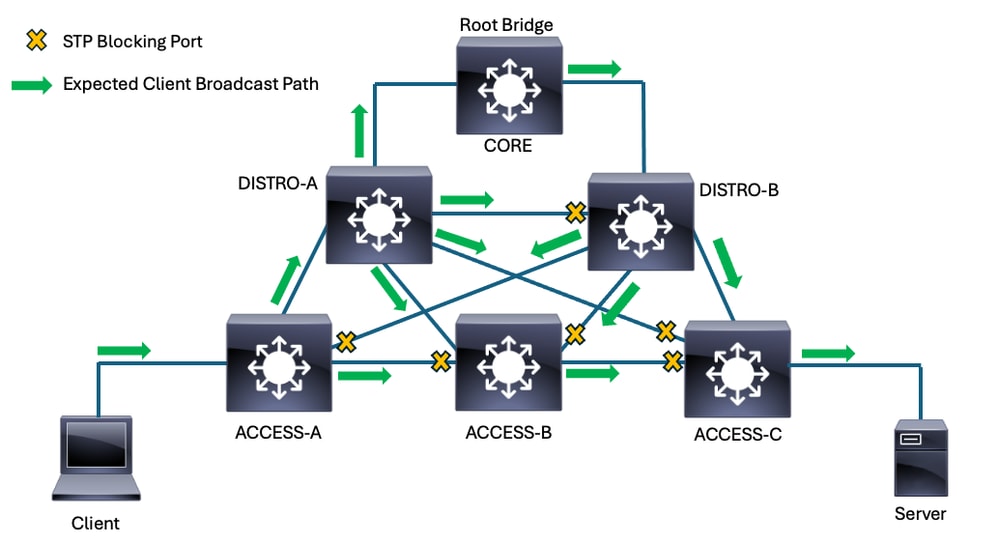 Client broadcast path in converged topology
Spanning-tree blocks multiple ports in this topology due to the redundant interconnections among the switches. For this example, the yellow X graphic represents the blocking ports. The forwarding ports are all either designated or root, depending on the location of the local switch compared to the root bridge. The green arrows represent the normal, expected flow of broadcast traffic an example client would send in this network.
While not terribly complex, this network offers many opportunities for loops to form due to the many redundant links.
This snippet from the greater topoloy focuses on the spanning-tree roles/states of the access switch where the server connects.
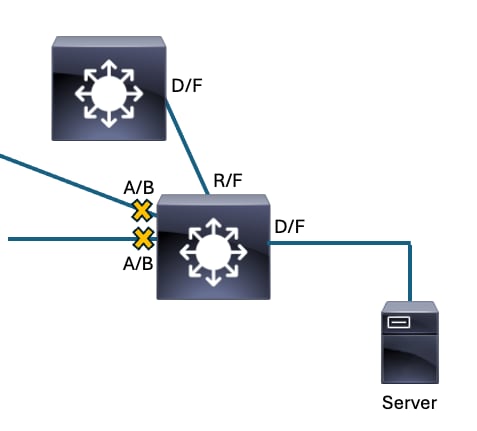 Working Spanning-Tree Convergence
Consider if we had a unidirectional link that prevents the downstream access switch from receipt of BPDUs on its root port. Spanning-tree reconverges in response, and a layer 2 loop ensues.
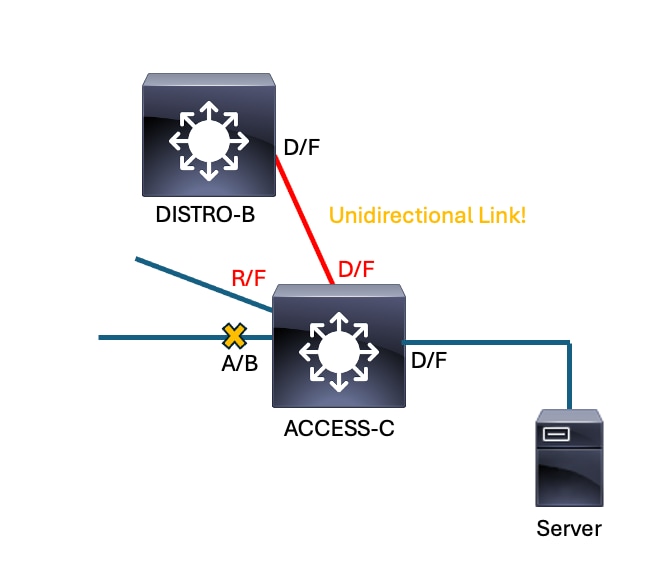
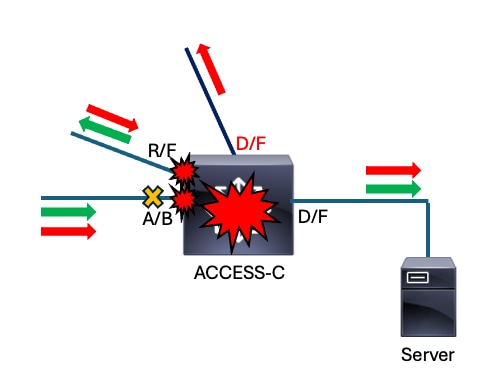
The former root port on ACCESS-C stops receiving BPDUs from DISTRO-B. The switch no longer recognizes it as a viable path to root so the highest-priority blocking port becomes ROOT/FORWARDING. The previous root port transitions to DESIGNATED/FORWARDING. This reconvergence results in a forwarding loop.
This diagram shows how the loop impacts broadcast traffic sent from our client. Unless the loop is broken, the looped traffic continues to loop indefinitely and potentially ingress/egress an impacted switch on multiple interfaces. You can see multiple red arrows that represent the direction of looped traffic.
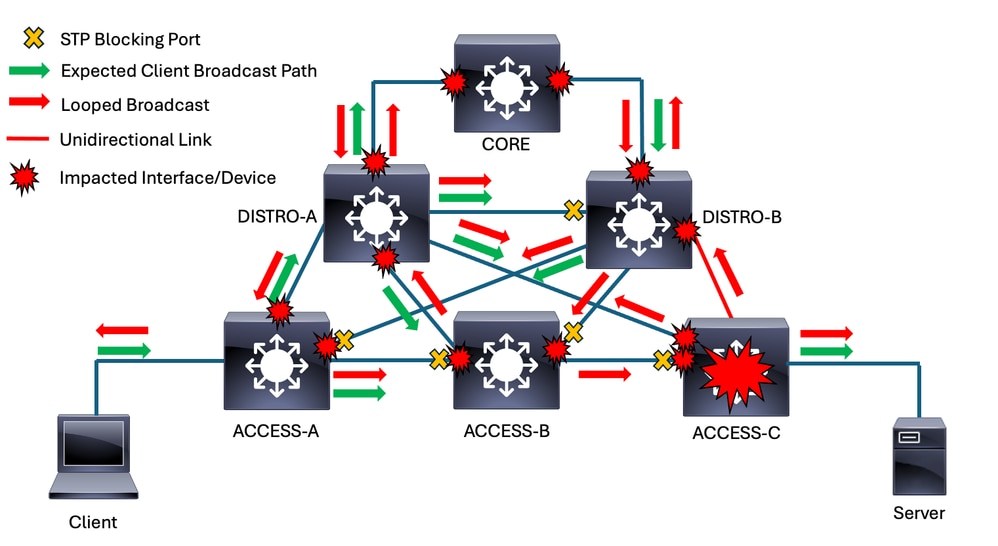
The problem continues to gain momentum as more and more traffic is infinitely looped. The Catalyst 9000 family of switches leverage a robust control-plane policing (CoPP) mechanism by default but some products do not. Switches with a local switch virtual interface (SVI) in a looped VLAN has a copy of broadcast traffic within that VLAN punted to the CPU. Without CoPP, all of this punted traffic can interrupt the switch CPU. This tends to make a bad situation worse, as the victimized switches are not able to participate in spanning-tree as expected.
Methodology
One of the initial challenges faced when we troubleshoot this type of problem is determining where to start. Ultimately, the position in which we start is not terribly important. All devices impacted by the loop eventually traces to the source of the loop.
In this example, we start at the switch where the impacted client connects.
Starting Point - ACCESS-A - Directly connected to client
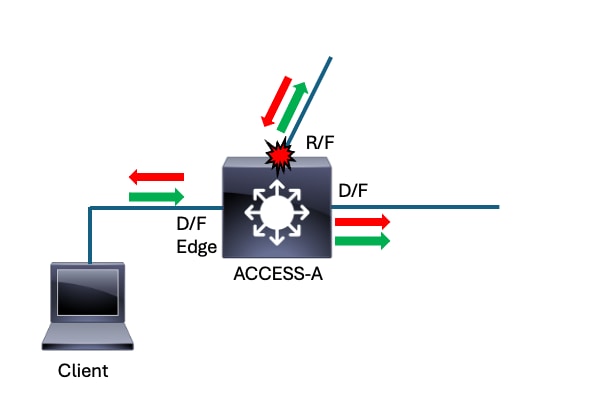
This method makes the initial start point irrelevant. All impacted interfaces point towards the source of the problem. Wherever you begin, if this process is followed you arrive at the source of the loop/reflection. In this scenario, the impacted client connects to switch ACCESS-A. This is where we begin. The first step in this process is to consider the input rates on all active interfaces.
- show interfaces | include is up|input rate
ACCESS-A#show interfaces | in is up|input rate

GigabitEthernet1/0/1 is up, line protocol is up (connected)
  5 minute input rate 33000 bits/sec, 21 packets/sec          <--- This access port (downlink) has a small volume of traffic inbound. This does not raise suspiscion.
<snip>
  5 minute input rate 0 bits/sec, 0 packets/sec
  5 minute input rate 0 bits/sec, 0 packets/sec
  5 minute input rate 0 bits/sec, 0 packets/sec
  5 minute input rate 0 bits/sec, 0 packets/sec
  5 minute input rate 0 bits/sec, 0 packets/sec
TwentyFiveGigE1/1/1 is up, line protocol is up (connected)
  5 minute input rate 2816922000 bits/sec, 2672252 packets/sec <--- This port is an uplink. There is a fair amount of traffic inbound on this port, but also keep in mind that the uplink is expected to be busier.
TwentyFiveGigE1/1/2 is up, line protocol is up (connected) <--- This is our other uplink on this switch. The input rate is zero, suggesting the other end of this link is not transmitting. This implies that the other end of the link successfully blocks.
    5 minute input rate 0 bits/sec, 0 packets/sec
The average packet size is calculated by dividing bytes per second by packets per second. In this example, the average packet size is around 132 bytes. This suggests a high volume of small packets which skews the average. A high volume of ARP, for instance, can cause the same skew from the expected average packet size in a production network and suggests the port is victimized by the broadcast storm.
None of the downlinks show abnormal input rates. The only potentially impacted port is the root port- the uplink towards the distribution layer. Before we move to the next device, first consider spanning-tree for the switch.
- show spanning tree
ACCESS-A#show spanning-tree  <--- Without an argument, this command gives spanning-tree information for all VLANs with an active STP instance running. For this example, we assume VLAN 1 is consistent with all VLANs on the trunk.

VLAN0001
  Spanning tree enabled protocol rstp
  Root ID    Priority    1
             Address     380e.4d77.4800
             Cost        2000
             Port        3 (TwentyFiveGigE1/1/1)
             Hello Time   2 sec  Max Age 20 sec  Forward Delay 15 sec

  Bridge ID  Priority    32769  (priority 32768 sys-id-ext 1)
             Address     b08b.d08d.6b80
             Hello Time   2 sec  Max Age 20 sec  Forward Delay 15 sec
             Aging Time  300 sec

Interface           Role Sts Cost      Prio.Nbr Type
------------------- ---- --- --------- -------- --------------------------------
Gig1/0/1            Desg FWD 20000     128.1    P2p
Gig1/0/2            Desg FWD 20000     128.2    P2p
<snip>
Twe1/1/1            Root FWD 800       128.33   P2p
Twe1/1/2            Desg FWD 800       128.34   P2p

<snip>
Here is where it pays to know your network and how spanning-tree is expected to converge. Te1/1/1 is the expected root port. Twe1/1/2 also connects to a switch and forwards, but its input rate is 0 packets/sec so we know the other end of the link successfully blocks. Everything looks fine with regards to spanning-tree. Now, we confirm the link peer on the impacted port.
- show cdp neighbor <interface>
ACCESS-A#show cdp neighbors twentyFiveGigE 1/1/1
Capability Codes: R - Router, T - Trans Bridge, B - Source Route Bridge
                  S - Switch, H - Host, I - IGMP, r - Repeater, P - Phone,
                  D - Remote, C - CVTA, M - Two-port Mac Relay

Device ID        Local Intrfce     Holdtme    Capability  Platform  Port ID
DISTRO-A         Twe 1/1/1        137        S I         C9300-48P Twe 1/0/3
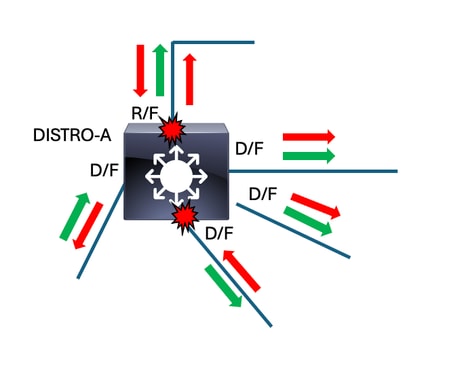
Next-Hop Switch - DISTRO-A
 DISTRO-A
The next step is a repeat of the previous activity on the switch that connects to the suspicious interface. Run "show interfaces | include is up|input rate" to identify interfaces with suspisciously high input rates.
- show interfaces | include is up|input rate
DISTRO-A#show interfaces | in is up|input rate

  5 minute input rate 0 bits/sec, 0 packets/sec
  5 minute input rate 0 bits/sec, 0 packets/sec
  5 minute input rate 0 bits/sec, 0 packets/sec
  5 minute input rate 0 bits/sec, 0 packets/sec
  5 minute input rate 0 bits/sec, 0 packets/sec
TwentyFiveGigE1/1/1 is up, line protocol is up (connected)
  5 minute input rate 4846092202 bits/sec, 4572251 packets/sec   <-- In this scenario, this input rate raises red flags. This is another situation where understanding normal baselines is helpful.
TwentyFiveGigE1/1/2 is up, line protocol is up (connected)
  5 minute input rate 0 bits/sec, 0 packets/sec                  <-- The other end of this link is likely blocking.
TwentyFiveGigE1/1/3 is up, line protocol is up (connected)
  5 minute input rate 146192134 bits/sec, 171252 packets/sec     <-- Fair amount of usage, though exponentially smaller that our 'suspect' link. Again, knowing expected baselines is helpful to identify when deviations occur. This is a downlink towards an access switch in this scenario, and does not raise red flags.
TwentyFiveGigE1/1/4 is up, line protocol is up (connected)
  5 minute input rate 4938392202 bits/sec, 4723294 packets/sec   <-- This is along the same magnitude of input as Twe1/1/1. Often, interfaces impacted by the same broadcast storm shows similar activity. In our scenario, this interface raises red flags.
TwentyFiveGigE1/1/5 is up, line protocol is up (connected)
  5 minute input rate 032182156 bits/sec, 104263 packets/sec     <-- Similar to Twe1/1/3, this interface is active but not at a suspicious level.
On DISTRO-A, we found two interfaces with input rates higher than expectation. The nature of loops mean that there are typically multiple paths to the source. We note both interfaces, but first we check spanning-tree for anything out of the norm.
- show spanning-tree
DISTRO-A#show spanning-tree

VLAN0001
  Spanning tree enabled protocol rstp
  Root ID    Priority    1
             Address     380e.4d77.4800
             Cost        2000
             Port        3 (TwentyFiveGigE1/1/1)
             Hello Time   2 sec  Max Age 20 sec  Forward Delay 15 sec

  Bridge ID  Priority    32769  (priority 32768 sys-id-ext 1)
             Address     c18b.a18d.5b76
             Hello Time   2 sec  Max Age 20 sec  Forward Delay 15 sec
             Aging Time  300 sec

Interface           Role Sts Cost      Prio.Nbr Type
------------------- ---- --- --------- -------- --------------------------------
Twe1/1/1            Root FWD 800       128.33   P2p
Twe1/1/2            Desg FWD 800       128.34   P2p
Twe1/1/3            Desg FWD 800       128.35   P2p
Twe1/1/4            Desg FWD 800       128.36   P2p
Twe1/1/5            Desg FWD 800       128.37   P2p
<snip>
If you look at the position of DISTRO-A in the network, you can see that all ports on this switch are expected to forward. It has a root port (Twe1/1/1) that directly connects it to the root brige. All of its downlinks and interconnections to other switches are designated and forward. This tracks with our spanning-tree output.
Now, we check the peers on our suspicious interfaces and decide where to go next. Either direction results in our arrival to the source of the loop.
- show cdp neighbors <interface>
DISTRO-A#show cdp neighbors twentyFiveGigE 1/1/1
Capability Codes: R - Router, T - Trans Bridge, B - Source Route Bridge
                  S - Switch, H - Host, I - IGMP, r - Repeater, P - Phone,
                  D - Remote, C - CVTA, M - Two-port Mac Relay

Device ID        Local Intrfce     Holdtme    Capability  Platform  Port ID
CORE             Twe 1/1/1       137        S I         C9500-48Y4C Twe 1/0/1

DISTRO-A#show cdp neighbors twentyFiveGigE 1/1/4
Capability Codes: R - Router, T - Trans Bridge, B - Source Route Bridge
                  S - Switch, H - Host, I - IGMP, r - Repeater, P - Phone,
                  D - Remote, C - CVTA, M - Two-port Mac Relay

Device ID        Local Intrfce     Holdtme    Capability  Platform  Port ID
ACCESS-B         Twe 1/1/4        137        S I         C9300-48P Twe 1/1/1
We first check out CORE but it would be equally valid in this scenario the move to ACCESS-B.
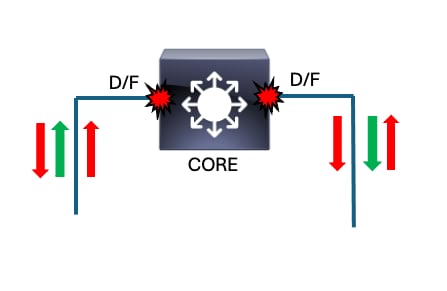
Next-Hop Switch - CORE
- show interfaces | include is up|input rate
CORE#show interfaces | in is up|input rate
TwentyFiveGigE1/0/1 is up, line protocol is up (connected)     <--- Both active downlinks have comparably high input rates. It is not unexpected for core devices to have high interface activity.
  5 minute input rate 4946092202 bits/sec, 4671352 packets/sec
TwentyFiveGigE1/0/2 is up, line protocol is up (connected)
  5 minute input rate 4936092202 bits/sec, 4474252 packets/sec <--- It appears that both Twe1/0/1 and Twe1/0/2 are victimized. These are the only active downlinks, so this makes sense.
  <snip>
    5 minute input rate 0 bits/sec, 0 packets/sec
    5 minute input rate 0 bits/sec, 0 packets/sec
    5 minute input rate 0 bits/sec, 0 packets/sec
    5 minute input rate 0 bits/sec, 0 packets/sec
    5 minute input rate 0 bits/sec, 0 packets/sec
Since this switch is the root bridge, we would expect all of its interfaces to forward. Quickly confirm with "show spanning-tree."
CORE#show spanning-tree

VLAN0001
  Spanning tree enabled protocol rstp
  Root ID    Priority    1
             Address     380e.4d77.4800
             This bridge is the root
             Hello Time   2 sec  Max Age 20 sec  Forward Delay 15 sec

  Bridge ID  Priority    1      (priority 0 sys-id-ext 1)
             Address     380e.4d77.4800
             Hello Time   2 sec  Max Age 20 sec  Forward Delay 15 sec
             Aging Time  300 sec

Interface           Role Sts Cost      Prio.Nbr Type
------------------- ---- --- --------- -------- --------------------------------
Twe1/0/1            Desg FWD 800       128.25   P2p
Twe1/0/2            Desg FWD 800       128.26   P2p
There are no unexpected paths of ingress for the broadcast storm. Based on the information at our disposal, the loop is downstream of the core. Now we check our peers on our downlinks.
- show cdp neighbors
CORE#show cdp neighbors twentyFiveGigE 1/0/1
Capability Codes: R - Router, T - Trans Bridge, B - Source Route Bridge
                  S - Switch, H - Host, I - IGMP, r - Repeater, P - Phone,
                  D - Remote, C - CVTA, M - Two-port Mac Relay

Device ID        Local Intrfce     Holdtme    Capability  Platform  Port ID
DISTRO-A         Twe 1/0/1       144        S I         C9300-48P Twe 1/1/1

CORE#show cdp neighbors twentyFiveGigE 1/0/2
Capability Codes: R - Router, T - Trans Bridge, B - Source Route Bridge
                  S - Switch, H - Host, I - IGMP, r - Repeater, P - Phone,
                  D - Remote, C - CVTA, M - Two-port Mac Relay

Device ID        Local Intrfce     Holdtme    Capability  Platform  Port ID
DISTRO-B         Twe 1/0/2        139        S I         C9300-48P Twe 1/1/1
We just came from DISTRO-A. We could revisit DISTRO-A and check out our other interface/peer on that switch that was marked as suspicious, or we can head to DISTRO-B. Next we check out DISTRO-B.
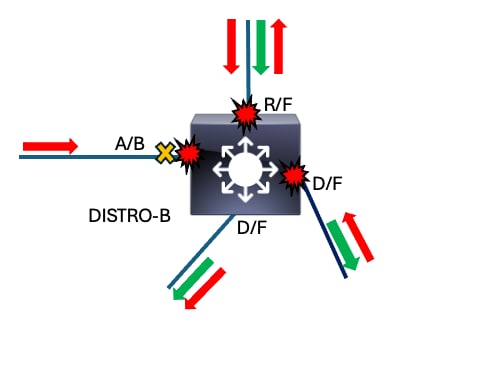
Next-Hop Switch - DISTRO-B
 DISTRO-B
- show interfaces | include is up|input rate
DISTRO-B#show interfaces | in is up|input rate
<snip>
  5 minute input rate 0 bits/sec, 0 packets/sec
  5 minute input rate 0 bits/sec, 0 packets/sec
  5 minute input rate 0 bits/sec, 0 packets/sec
  5 minute input rate 0 bits/sec, 0 packets/sec
  5 minute input rate 0 bits/sec, 0 packets/sec
TwentyFiveGigE1/1/1 is up, line protocol is up (connected)
  5 minute input rate 4446192309 bits/sec, 4673252 packets/sec <--- Suspicious
TwentyFiveGigE1/1/2 is up, line protocol is up (connected)
  5 minute input rate 4457101202 bits/sec, 4571365 packets/sec <--- Suspicious
TwentyFiveGigE1/1/3 is up, line protocol is up (connected)
  5 minute input rate 136192034 bits/sec, 170261 packets/sec
TwentyFiveGigE1/1/4 is up, line protocol is up (connected)
  5 minute input rate 4936092202 bits/sec, 4474252 packets/sec <--- Suspicious
Now we take a quick look at spanning-tree to make sure things appear as expected.
- show spanning-tree
DISTRO-B#show spanning-tree

  VLAN0001
  Spanning tree enabled protocol rstp
  Root ID    Priority    1
             Address     380e.4d77.4800
             Cost        800
             Port        3 (TwentyFiveGigE1/1/1)
             Hello Time   2 sec  Max Age 20 sec  Forward Delay 15 sec

  Bridge ID  Priority    32769  (priority 32768 sys-id-ext 1)
             Address     b08b.d08d.6b80
             Hello Time   2 sec  Max Age 20 sec  Forward Delay 15 sec
             Aging Time  300 sec

  Interface           Role Sts Cost      Prio.Nbr Type
  ------------------- ---- --- --------- -------- --------------------------------
  <snip>
  Twe1/1/1            Root FWD 800       128.33   P2p
  Twe1/1/2            Desg FWD 800       128.34   P2p
  Twe1/1/3            Desg FWD 800       128.33   P2p
  Twe1/1/3            Desg FWD 800       128.33   P2p
  Twe1/1/5            Alt  BLK 800       128.34   P2p
Spanning-tree on this switch corresponds with what we expect in a stable network. We can see our root port is converged as expected and that our interconnection to DISTRO-B (Twe1/1/4) blocks. Our access-facing interfaces are designated/forwarding.
Now we investigate our peers on the suspicious interfaces.
- show cdp neighbors <interface>
DISTRO-B#show cdp neighbors twentyFiveGigE 1/1/1
  Capability Codes: R - Router, T - Trans Bridge, B - Source Route Bridge
                    S - Switch, H - Host, I - IGMP, r - Repeater, P - Phone,
                    D - Remote, C - CVTA, M - Two-port Mac Relay

  Device ID        Local Intrfce     Holdtme    Capability  Platform  Port ID
  CORE             Twe 1/1/1         144        S I         C9500-48Y4C Twe 1/0/1

  DISTRO-B#show cdp neighbors twentyFiveGigE 1/1/2
  Capability Codes: R - Router, T - Trans Bridge, B - Source Route Bridge
                    S - Switch, H - Host, I - IGMP, r - Repeater, P - Phone,
                    D - Remote, C - CVTA, M - Two-port Mac Relay

  Device ID        Local Intrfce     Holdtme    Capability  Platform  Port ID
  ACCESS-C         Twe 1/1/2         139       S I         C9300-48P Twe 1/1/1

  DISTRO-B#show cdp neighbors twentyFiveGigE 1/1/5
  Capability Codes: R - Router, T - Trans Bridge, B - Source Route Bridge
                    S - Switch, H - Host, I - IGMP, r - Repeater, P - Phone,
                    D - Remote, C - CVTA, M - Two-port Mac Relay

  Device ID        Local Intrfce     Holdtme    Capability  Platform  Port ID
  DISTRO-A         Twe 1/1/5         132        S I         C9300-48P Twe 1/1/2
We just came from CORE and we have already visited DISTRO-A. Based on our findings so far, logic sends us to ACCESS-C.
ACCESS-C
ACCESS-C#show interfaces | in is up|input rate

GigabitEthernet1/0/1 is up, line protocol is up (connected)
    5 minute input rate 43012 bits/sec, 34 packets/sec
    5 minute input rate 0 bits/sec, 0 packets/sec
    5 minute input rate 0 bits/sec, 0 packets/sec
    5 minute input rate 0 bits/sec, 0 packets/sec
    5 minute input rate 0 bits/sec, 0 packets/sec
    5 minute input rate 0 bits/sec, 0 packets/sec
<snip>
TwentyFiveGigE1/1/1 is up, line protocol is up (connected)
    5 minute input rate 0 bits/sec, 0 packets/sec                <-- This interface has zero packets inbound. Normally this means the interface on the other end of the link is blocking. In this scenario we need to take a closer look since the upstream switch is a distribution switch.
TwentyFiveGigE1/1/2 is up, line protocol is up (connected)
    5 minute input rate 4834056103 bits/sec, 4461235 packets/sec <-- This interface has a suspicious input rate.
TwentyFiveGigE1/1/3 is up, line protocol is up (connected)
    5 minute input rate 4456091109 bits/sec, 4573242 packets/sec <-- This interface also has a suspicious input rate.
This switch is obviously impacted by the loop. Two interfaces show evidence of victimization. There is also an uplink to the distribution layer that is unexpectedly quiet. We take note of these observations and check spanning-tree next to see if anything stands out.
- show spanning-tree
ACCESS-C#show spanning-tree

    VLAN0001
    Spanning tree enabled protocol rstp
    Root ID    Priority    1
               Address     380e.4d77.4800
               Cost        1600
               Port        4 (TwentyFiveGigE1/1/2)
               Hello Time   2 sec  Max Age 20 sec  Forward Delay 15 sec

    Bridge ID  Priority    32769  (priority 32768 sys-id-ext 1)
               Address     b08b.d08d.6b80
               Hello Time   2 sec  Max Age 20 sec  Forward Delay 15 sec
               Aging Time  300 sec

    Interface           Role Sts Cost      Prio.Nbr Type
    ------------------- ---- --- --------- -------- --------------------------------
    Gig1/0/1            Desg FWD  20000    128.01   P2P
    <snip>
    Twe1/1/1            Desg FWD 800       128.33   P2p
    Twe1/1/2            Root FWD 800       128.34   P2p
    Twe1/1/3            Alt  BLK 800       128.33   P2p
Yet again, it pays to understand spanning-tree operations and what is expected in your network. Based on the earlier diagram showing expected spanning-tree convergence, ACCESS-C is expected to have two blocking ports. There is only one blocking port listed in the output of show spanning-tree which is a huge red flag. This it potentially inconspicuous while troubleshooting, so let us see what else stands out on this switch as out of the norm.
Access switches in a tiered network usually have a root port and one or more alternate ports to root. The downlinks away from the root bridge typically are 'designated' and 'forwarding'. Twe1/1/1 is shown as a designated port, which means that it believes it is closer to the root bridge than its link partner. Our diagram does not list port numbers, so let us confirm what devices connect to what ports on our suspect device.
- show cdp neighbors
ACCESS-C#show cdp neighbors twentyFiveGigE 1/1/1
    Capability Codes: R - Router, T - Trans Bridge, B - Source Route Bridge
                      S - Switch, H - Host, I - IGMP, r - Repeater, P - Phone,
                      D - Remote, C - CVTA, M - Two-port Mac Relay

    Device ID        Local Intrfce     Holdtme    Capability  Platform  Port ID. <--- There is no neighbor information listed for this interface. Very suspiscious.

ACCESS-C#show cdp neighbors twentyFiveGigE 1/1/2
    Capability Codes: R - Router, T - Trans Bridge, B - Source Route Bridge
                      S - Switch, H - Host, I - IGMP, r - Repeater, P - Phone,
                      D - Remote, C - CVTA, M - Two-port Mac Relay

    Device ID        Local Intrfce     Holdtme    Capability  Platform  Port ID
    ACCESS-B         Twe 1/1/2         144        S I         C9300-48P Twe 1/1/3

ACCESS-C#show cdp neighbors twentyFiveGigE 1/1/3
    Capability Codes: R - Router, T - Trans Bridge, B - Source Route Bridge
                      S - Switch, H - Host, I - IGMP, r - Repeater, P - Phone,
                      D - Remote, C - CVTA, M - Two-port Mac Relay

    Device ID        Local Intrfce     Holdtme    Capability  Platform  Port ID
    DISTRO-A         Twe 1/1/3         137        S I         C9300-48P Twe 1/1/2
Interface Twe1/1/1 does not have a neighbor listed. This indicates that the CDP frame sent from the peer does not arrive (or arrives and cannot be processed) and suggests a unidirectional link in this context. At this point, there is enough evidence to further scrutinize the link between DISTRO-B and ACCESS-C.
The input rate of zero at this interface while we expect the other end to forward based on its spanning-tree output and interface output rate. Combined with the unexpected STP convergence where each end of the link claims designated and the lack of CDP information, this link is unidirectional.
The fastest way to break the loop in this situation would be to shut Twe1/1/1 on ACCESS-A. Once Twe1/1/1 is shut, the loop physically breaks. Once the loop is physically interrupted, the broadcast storm immediately begins to subside.
This was a simplified scenario but demonstrates the concept. Trace the impacted interfaces to the source of the loop.
Summary
This scenario demonstrated the basic methodology for quickly and accurately troubleshooting layer 2 loops. The method can be summed up in these steps:
- On an impacted device, clear counters then check for evidence of abnormally high input rates on any active interfaces. Consider the average size of the inbound packets- a smaller average size means a higher volume of small packets (ARPs or DHCP broadcasts for instance)- and check the broadcast/multicast input counters to understand if there is a high percentage of broadcast/multicast traffic with respect to total traffic input. These interfaces are potentially involved in the loop.
ACCESS-C#show interfaces | in is up|input rate
2. Determine the peer devices connecting to the suspect interfaces. The loop is downstream of one of these interfaces. Multiple paths point towards the loop, but all paths eventually lead to the source.
ACCESS-C#show cdp neighbors twentyFiveGigE 1/1/1
3. Some networks have devices with multiple forwarding paths. Check spanning-tree to ensure the topology is converged as expected. Ensure blocking interfaces block.
ACCESS-C#show spanning-tree
Incorporate these steps and construct a topology as you move from device to device. You ultimately arrive at the source of the loop.
The loop can happen when some factor prevents spanning-tree from converging as expected. In this scenario, a unidirectional link caused an access switch to forward on a link expected to block.
Broadcast storms also occur when rogue or suspect devices loop or reflect traffic back into the network.
The methodology outlined in this document helps network professionals quickly locate the source of any layer 2 loop or traffic reflection scenario.
Finally – Why not TCNs?
A common practice in the field is to focus on and chase spanning-tree TCNs when troubleshooting loops. We recommend against this in favor of input rates. The Catalyst 9000 family of switches incorporate a robust control-plane policing policy (CoPP) to prevent punt path disruptions due to volume of punted traffic. CoPP on the Catalyst 9000 switches police BPDUs if volume exceeds the platform policer value, however, so even if high CPU utilization is not seen, spanning-tree on a Catalyst 9000 is victimized. Other switch platforms including legacy Catalysts such as the 2960, 3560, 3750 and 4k line do not employ CoPP and can easily be overwhelmed during a loop. Any device is potentially victimized by the loop- which makes spanning-tree compete with the millions of erroneous broadcasts on the CPU punt path. As a result, TCNs generated are often false positives and lead an engineer down the wrong path.
Prevention and Best Practices
There are optional features available on Catalyst switches that harden against layer-2 loops. These feature and best practices aim to prevent loops before they occur and to lessen their impact in case they do.
Features
RootGuard – Root guard prevents interfaces from becoming root ports. The feature places the interface in a Root-Inconsistent state if a superior BPDU is received. This is especially useful if the network contains connections to devices that are managed by other organizations. Typically, this is applied to the distribution layer downlinks that face the access layer. Superior BPDUs are never expected to arrive from downstream in a stable network.
LoopGuard – Generally in STP, root ports and alternate ports receive BPDUs while designated ports transmit them. This relationship can make spanning-tree unable to respond to unidirectional links. Loop guard prevents alternate or root ports from becoming designated. Loop guard puts the interface into err-disabled state if BPDUs are not regularly received and processed by the interface.
BPDUGuard – This feature operates by placing an interface into err-disable status if a BPDU is received on a configured port. Configure this on edge ports where it is not expected for another network device to connect. This feature is often used in conjunction with Portfast.
PortFast - Portfast is used on edge ports- mostly access but also trunks in some scenarios. It allows an edge port to forego the normal stages of spanning-tree and move directly to forwarding. This saves the time from the perspective of the endpoint and also prevents an unstable edge port from transmitting TCNs. Portfast must always be used along with BPDUGuard to avoid inducing a loop if a networking device is accidentally connected.
Additional Best Practices
VLAN Scoping - Only allow necessary VLANs on trunks. This limits the scope of loops and prevents a localized problem from becoming a network-wide outage.
Use Non-Operational VLANs as Native - Best practice is to use a non-operational VLAN for trunks. Many networks use the default native VLAN (1), which spans the entire network. Use a non-operational VLAN as native to further limit the potential scope of a loop.
Use Uniform Path Cost Calculation Method -The Catalyst 9000 series of switches all run the long path cost method by default as of IOS XE 17.6. Previous versions potentially run short by default. Most legacy Catalyst switches run short by default. Environments where mixed path cost methods are in use have problems responding to topology changes and disturbances. Ensure all switches run the same method. More information is found in the relevant platform configuration guide for spanning-tree.
Use the "spanning-tree pathcost method <long/short>" command to manipulate the path cost method. "Show spanning-tree summary" is used to confirm the method in use.
ACCESS-A(config)#spanning-tree pathcost method ?
  long   Use 32 bit based values for default port path costs
  short  Use 16 bit based values for default port path costs

ACCESS-A(config)#spanning-tree pathcost method long
<snip>
ACCESS-A#show spanning-tree summary
Switch is in rapid-pvst mode
Root bridge for: VLAN0001
Extended system ID                      is enabled
Portfast Default                        is disabled
PortFast BPDU Guard Default            is disabled
Portfast BPDU Filter Default           is disabled
Loopguard Default                      is disabled
EtherChannel misconfig guard            is enabled
UplinkFast                              is disabled
BackboneFast                            is disabled
Configured Pathcost method used is long             <--- Displays the configured pathcost method.
<snip>
Related Information
Configuring Spanning Tree Protocol - Catalyst 9300 Switches
Configuring Optional Spanning-Tree Features - Catalyst 9300 Switches
Configuring Optional Spanning-Tree Features - Catalyst 9600 Switches
Configuring Unidirectional Link Detection (UDLD) - Catalyst 9300 Switches
Troubleshoot Control Plane Operations on Catalyst 9000 Switches
Revision History
| Revision | Publish Date | Comments |
|---|---|---|
1.0 |
14-Nov-2023 |
Initial Release |
Contributed by Cisco Engineers
- Jason BabbCisco TAC
- Ryan StipeCisco TAC
Contact Cisco
- Open a Support Case

- (Requires a Cisco Service Contract)
 Feedback