Introduction
This document describes how to troubleshoot the CCUC Telemetry module from the Webex Control Hub and CUCM CLI.
Prerequisites
Requirements
Cisco recommends knowledge of these topics:
Components Used
The information in this document was created from the devices in a specific lab environment. All of the devices used in this document started with a cleared (default) configuration. If your network is live, ensure that you understand the potential impact of any command.
Before You Begin
On-premise CUCM includes Cloud-Connected UC Agent pre-installed in versions 12.5.1 SU4 or higher.
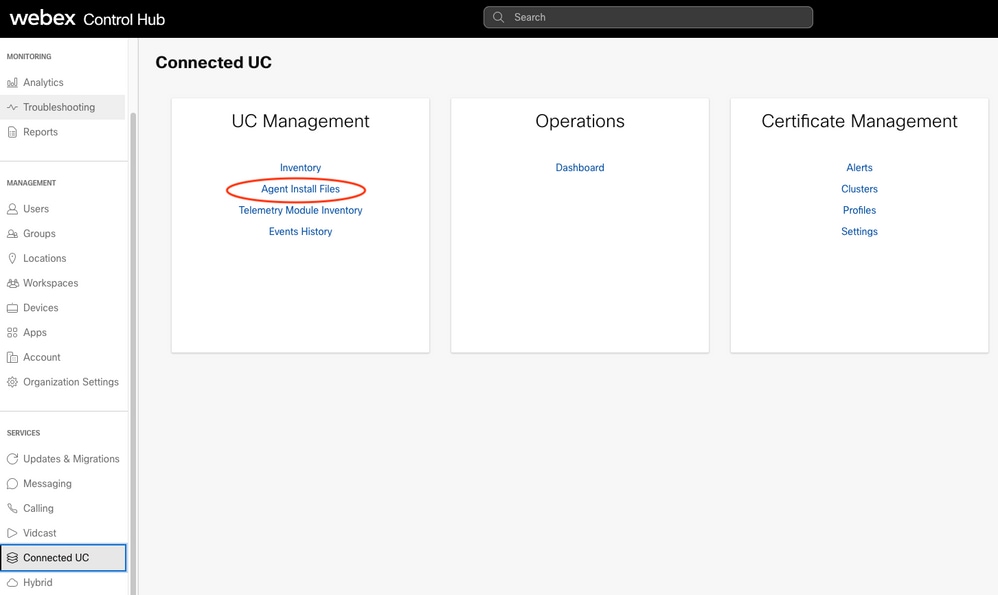
Earlier versions need the Agent installed manually. Browse to Agent Install Files page in Webex Control Hub.
Find Services on the left side, and click Connected UC.
Click Agent Install Files in the UC Management pane.
Telemetry Module
The telemetry module is part of the Connected UC UCMGMT Agent.
The telemetry module uploads data from your on-premise CUCM, CER, CUPS, or CUC nodes into the Webex Control Hub.
Data uploaded includes operational metrics of the CUCM nodes, CDR and CMR records for Analytics and more.
To receive the greatest amount of data in Control Hub, ensure Analytics and Opertational Metrics are enabled in the Service Management window in your Cluster Group.
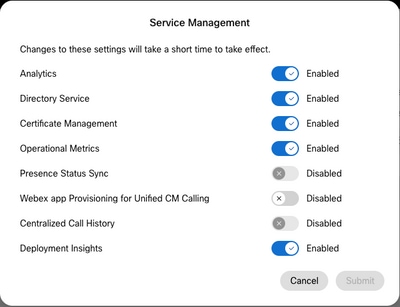
However, the Telemetry Module is not installed on any node until after the UCMGMT Agent is Verified in Connected UC.
In Webex Control Hub, find Services on the left, click Connected UC.
In the UC Management pane, click Inventory.
Here, Cluster Groups are defined and node are verified.
Once verified, the agent receives a job request from Webex Control Hub to install the Telemetry Module on the verified node.
The agent requires up to 1.5 hours to complete the installation.
Once installed, an information notice appears in Connected UC Inventory on each node where the Telemetry module was installed successfully.
Click on the individual nodes to see all notices for that node.

Browse to Telemetry Module Inventory.
In Webex Control Hub, find Services on the left, click Connected UC.
In the UC Management pane, click Telemetry Module Inventory.
If there are no connectivity issues, node Status is Online.

Troubleshoot
Problems with the Telemetry Module can arrise, such as:
- Module does not start
- Data fails to upload to Control Hub
For example: In Webex Control Hub, find Monitoring on the left menu.
If you select either Analytics or Troubleshooting, there is a section of data for Connected UC populated by the telemetry module.
When problems arise, these sections can have incomplete data, or no data, or errors messages appear in the data collected.
Be aware that In Connected UC > Telemetry Module Inventory nodes can report Offline, even if the node in the UC Management Inventory reports as Online.
This indicates an issue with the telemetry module.
To begin to troubleshoot, click on your node in Telemetry Module Inventory and note the information on the panel that appears on the right.
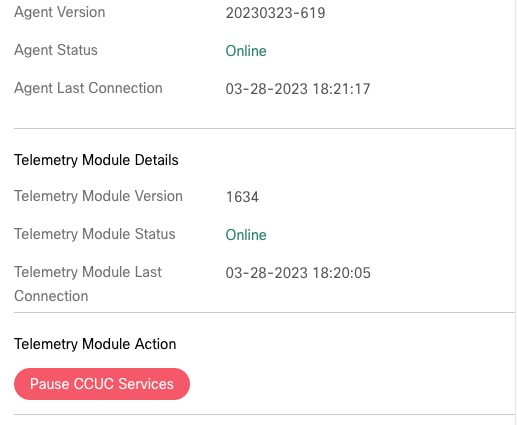
Both the Agent Status and Telemetry Module Status must report as Online.
Note the Last Connection time for Agent and Telemetry Module.
If these two fields are not within several minutes of the current time, this can indicate an issue with connectivity or services that have failed.
The Agent
Examine the Agent version in the panel information.
The first eight digits are the date this version was published.
Is the date more than four to six months old? If so, the agent most likely did not automatically update itself and the telemetry module as scheduled.
To attempt to update the agent version, try two methods.
1. Connect to the CLI of your node and run this command: utils ucmgmt agent restart.
admin:utils ucmgmt agent restart

Stopping agent..


Agent is restarting. Check agent status with 'utils ucmgmt agent status'.
admin:
That triggers the Agent to restart.
Whenever the Agent starts, it always attempts to update itself and the telemetry module.
Wait at least 10 to 15 minutes.
Then check the version installed with this command: utils ucmgmt agent status.
admin:utils ucmgmt agent status
Agent Config Information:
   Verification Code: XXXXXXXX
   Installed UCMGMT Agent version: 20230323-619
   Agent's organization id: XXXXXXXX-XXXX-XXXX-XXXX-XXXXXXXXXXXX

Agent Runtime Information:
   Agent process is running.
   Agent process is enabled.
   Agent watchdog is enabled.
   Agent is verified in Webex Control Hub.
Note the 'Installed UCMGMT Agent version' in the output of that command.
Check that the version number is updated to a more recent date.
2. Download a new Agent Install COP file from the Agent Install Files page in Connected UC.
Install that COP file on all nodes where the Agent version is out of date.
Proxy
A network proxy or web proxy can be required in your environment to connect to web services.
If so, ensure a proxy is configured for the agent.
admin:utils ucmgmt proxy list
    "http://10.0.0.1:9999"
admin:
In the output of the command: utils ucmgmt proxy list
Note if a proxy is configured.
If it is not configured, use the command:
utils ucmgmt proxy add <proxy_URL> <username>
Replace <proxy_URL> with the URL of the proxy in your environment.
Proxy_URL is mandatory for this command.
If your proxy requires authentication, enter the username. The system prompts you for the authentication password. Otherwise, username is optional.
Telemetry Module

Caution: A service can be on your node (when you run the command: utils service list), that includes the word 'Telemetry'. If so, do not manipulate this service. That Telemetry service is not related to Cloud Connected UC telemetry. The CCUC Telemetry Module is not visible in the Serviceability GUI or in the list of services visible from the CLI.
First, check that the telemetry module is installed and the version number from the CLI.
In the CLI of your node, enter this command: show version active
In the output of the command, if a line with ciscocm-ucmgmt-ucTelemetry is displayed, the telemetry module is installed.
If a line with ciscocm-ucmgmt-agent is displayed, the agent is installed.
The version number of the agent and telemetry module are also visible in the output of that command.
admin:show version active
Active Master Version: 12.5.1.14900-63
Active Version Installed Software Options:
...
ciscocm-ucmgmt-agent-upgrade.v20230329-620.k4.cop
ciscocm-ucmgmt-ucTelemetry.v1634.k4.cop
Next check connectivity. Run the these commands from the CLI of your node:
utils network connectivity gw.telemetry.ucmgmt.cisco.com 443
utils network connectivity telemetry-mgmt.na.ucmgmt.cisco.com 443
utils network connectivity gw.telemetry-eu.ucmgmt.cisco.com 443
utils network connectivity telemetry-mgmt.eu.ucmgmt.cisco.com 443
The output of each of those commands needs to end with 'Service accessible'.
If they return 'Connection timed out' or 'Connection refused', there is a connectivity issue that must be resolved with internal network or security teams.
WebSockets is required for proper CCUC functionality.
Web proxies, URL Filters and firewalls can block WebSockets traffic.
WebSockets communicates via TCP over port 443, like SSL/TLS, however, the URLs for WebSockets are written in a different manner.
TLS URLs look like this: https://domain.test
WebSockets URLs look like this: wss://domain.test
Ensure WebSockets traffic can flow between the nodes and the Webex cloud.
Next step is to attempt to pause the CCUC services.
Click on your node in Telemetry Module Inventory, then click Pause CCUC Services button in the panel that appears on the right.
Wait a minimum of two to three minutes for the Pause operation to complete. The node status changes from 'Stopping' to 'Stopped By User'.
Now click on your node and click Resume CCUC Services button. The node status changes from 'Starting' to 'Online'.
That Pause and Resume process can fix some telemetry module issues.
If trouble persists with any of these areas in Control Hub:
- Analytics > Connected UC has a lack data or errors appear in the call data collected
- Troubleshooting > Connected UC has a lack data or errors appear in the call data collected
- In Telemetry Module Inventory node still appears Offline
Then examine the TelemetryReport.txt file from the CLI.
Run this command from the CLI of the node: file view activelog telemetry/TelemetryReport.txt
Press 'n' until you reach the end of the file.
admin:file view activelog telemetry/TelemetryReport.txt

================================================================================
Cisco Webex Cloud-Connected UC Telemetry Report
================================================================================

All information in this report is to be used for debugging purpose by Cisco.

Report Generated On(GMT)      2023-03-28 11:06:00
Status                        connected
Module Version                1634
Start Time(GMT)               2023-03-28 11:05:07
Org ID                        XXXXXXXX-XXXX-XXXX-XXXX-XXXXXXXXXXXX
Time Zone                     CST
Cluster Name                  YourClusterName
Node Type                     ccm
Product Version               12.5.1.14900-63
Cluster Id                    XXXXXXXX—XXXX-XXXX-XXXX-XXXXXXXXXXXX
Agent Id                      XXXXXXXX—XXXX-XXXX-XXXX-XXXXXXXXXXXX
Host Name                     YourPublisher
Buffer Allocation             100 MB
Node Id                       AAAABBBBCCCC
Proxy

--------------------------------------------------------------------------------
Telemetry Checks (2023-03-27 23:54:48 GMT)
--------------------------------------------------------------------------------
Result                        Test
------                        ----
Pass                          JTelemetry module is running
Pass                          Cluster upgrade not in progess
Fail                          CMR is enabled
    - CMR collection is off
Pass                          CDR is enabled
Pass                          CDR file transfer
Fail                          Zero call duration enabled
    - Zero duration call is disabled
Pass                          Check high CDR duration
Pass                          Websocket-broker is running
--------------------------------------------------------------------------------
Websocket-broker Status (2023-03-28 19:56:49 GMT)
--------------------------------------------------------------------------------

Connection Status             connected
Start Time(GMT)               2023-03-28 11:02:43
Connected Time(GMT)           2023-03-28 11:04:48
Disconnected Time(GMT)        2023-03-28 11:02:43
Connected Duration(s)         31921
DisconnectedDuration(s)       125
ConnectedCount                1
DisconnectedCount             0

--------------------------------------------------------------------------------
CCUC Service Information (2023-03-28 19:57:00 GMT)
--------------------------------------------------------------------------------

Analytics                     Enabled
Deployment Insights           Enabled
Deployment Insights Limited   Disabled
Certificate Management        Enabled
Operation Metrics             Enabled
Borderless CTI                Disabled
Presence Status Sync          Disabled
Centralised Call History      Disabled
Collect Privacy Data          Enabled

--------------------------------------------------------------------------------

end of the file reached
Examine the contents of this file. Verify this information:
In the first section:
- Date and time was the report generated. If the date is days in the past, instead of hours in the past, this indicates the telemetry module has stopped running.
- Status needs to be 'connected'. Otherwise, this indicates a connectivity issue.
In the Telemetry Checks section:
- Any tests that fail can indicate incorrect configuration of your node.
See the 'Set Up' and 'Troubleshoot' documents linked in the Additional Information section of this article to correct the configuration of your nodes.
In the WebSocket-broker Status section:
- The Connection Status needs to be 'connected'. Otherwise, this indicates a connectivity or proxy issue.
- A large number in the DisconnectedCount field can also can indicate a connectivity or proxy issue.
In the CCUC Service Information section:
The Enabled and Disabled services match what you saw earlier in the Service Management window of your Cluster Group.
If they do not match, there is a connectivity issue or the telemetry module has a failure.
You also can examine the jtelemetry_error.log to see if the telemetry module has logged any errors.
To view this file, run the command: file view activelog telemetry/jtelemetry_error.log
The log file is not easy to read, but it is possible to find an indication of what is the cause of the error.
When any of these errors persist, even beyond a reboot of the node, open a support case with TAC.
Additional Information
https://help.webex.com/en-us/article/x8s8vs/Troubleshoot-Webex-Cloud-Connected-UC
https://help.webex.com/en-us/article/nzt6c0b/Set-Up-Webex-Cloud-Connected-UC-for-On-Premises-Devices
https://help.webex.com/en-us/article/fg3qim/Network-Requirements-for-Webex-Cloud-Connected-UC
https://help.webex.com/en-us/article/55mug2/System-Requirements-for-Webex-Cloud-Connected-UC


 Feedback