Export Data from the RTMT
Available Languages
Contents
Introduction
This document describes the Real-Time Monitoring Tool (RTMT), which is a useful tool to check information on the Cisco Unified Communications Manager (CUCM) about the health status of the system, registered phones, Computer Telephony Integration (CTI) connections, and so on in a user-friendly table format. The RTMT is dependent on the Cisco Real-Time Information Server (RIS) Data Collector, Cisco AlertMgrCollector (AMC) Service, Cisco Tomcat Stats Servlet, Cisco Trace Collection Service, Cisco Trace Collection Servlet, Cisco Log Partition Monitoring Tool, Simple Object Access Protocol (SOAP)-Real-Time Service APIs, SOAP-Performance Monitoring APIs, Cisco RTMT Reporter Servlet, Cisco CallManager Serviceability RTMT, and Cisco Tomcat services.
Prerequisites
Requirements
Cisco recommends that you have knowledge of CUCM and RTMT.
Components Used
The information in this document is based on CUCM Version 7.1.5 and later, but might work for earlier versions.
The information in this document was created from the devices in a specific lab environment. All of the devices used in this document started with a cleared (default) configuration. If your network is live, make sure that you understand the potential impact of any command.
Problem
There is no option presented in the RTMT tool which allows you to export displayed data to a PDF file or Microsoft Excel document.

Solution
The RTMT polls the state of the endpoints, such as registered phones, media resources, phone extensions, Media Gateway Control Protocol (MGCP), H.323 gateways, Session Initiation Protocol (SIP) trunks, and CTI sessions, with the Cisco RIS Data Collector service. It is also possible to check this dynamic information from the CLI.
A very common task is to retrieve information about all registered/unregistered phones and information about phone loads. It could be found in the RTMT under Call Manager > Device search > Phone (Any Status). A screenshot of the report from the RTMT is shown in the Problem section.
In CUCM Version 10.0 and later, the same information about registered phones can be viewed in RTMT under Voice/Video > Device search > Phone (Any Status).
In order to check the same information, IP phones registered, active firmware, and inactive firmware, enter the show risdb query phone command:
admin:show risdb query phone

----------- Phone Information -----------
#TotalPhones, #TotalRegistered, #RegisteredSCCP, #RegisteredSIP, #UnRegistered,
 #Rejected, #PartiallyRegistered, StateId, #ExpUnreg4, 3, 1, 2, 0, 1, 0, 49,0

DeviceName, Descr, Ipaddr, Ipv6addr, Ipv4Attr, Ipv6Attr, MACaddr, RegStatus,
 PhoneProtocol, DeviceModel, HTTPsupport, #regAttempts, prodId, username, seq#,
 RegStatusChg TimeStamp, IpAddrType, LoadId, ActiveLoadId, InactiveLoadId, ReqLoadId,
 DnldServer, DnldStatus, DnldFailReason, LastActTimeStamp, Perfmon Object

SEP6C416A369375, t7841, 10.147.94.124, , 0, 0, 6C416A369375, reg, SIP, 622, yes, 0,
 509, malevich, 1, 1404913142, 1, sip78xx.10-1-1SR1-4, sip78xx.10-1-1SR1-4,
 sip78xx.10-1-1-9, , , 0, , 1404913142, 2

SEP0018B9A0442B, c7941, 10.147.94.204, , 3, 0, 0018B9A0442B, reg, SCCP, 115, yes, 0,
 115, allevich, 2, 1404913140, 1, SCCP41.9-3-1SR4-1S, SCCP41.9-3-1SR4-1S, , , , 0, ,
 1404913140, 2

SEPD0C7891413BC, dx650, 10.147.94.182, , 0, 0, D0C7891413BC, reg, SIP, 647, yes, 0,
 532, kalevich, 4, 1404913141, 1, sipdx650.10-1-2-33, sipdx650.10-1-2-33,
 sipdx650.10-0-2-32, , , 0, , 1404913141, 2

SEP8CB64FF7E2EE, , 10.147.94.133, , 3, 0, 8CB64FF7E2EE, rej, SCCP, 436, yes, 0,
 335, NoUserId, 7, 1405069589, 1, , , , , , 0, , 1405069635, 0

----------------
Total count 4
----------------
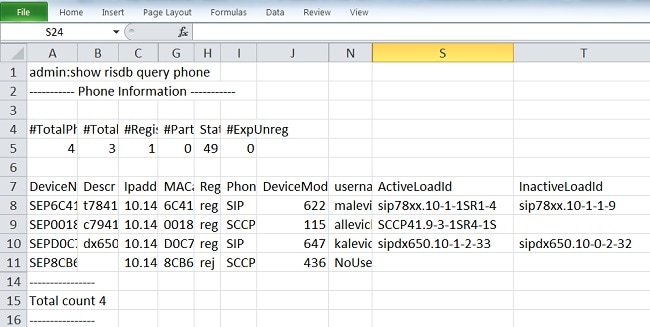
Information can be exported to the Excel file. Copy and paste the output of the show risdb query phone command to the text editor and save the file as a .csv (comma separated values or "comma delimited") file. For example, with the name UCM_export_data_RTMT2.csv.
Then, open the file with Microsoft Excel and it will be displayed in the format of a table report.

One difference between the RTMT output and the CLI command is the device model column. The RTMT contains a user-friendly presentation of the phone model (for example, Cisco 7841) and in the CLI there is a corresponding numeric value (for example, 622 for Cisco IP Phone 7841). In order to check the table of numeric (enum) values for different phone types, enter the run sql SELECT * from TypeModel command.
The command show risdb query phone should only be used on the call processing nodes where Call Manager service is activated. If this command is entered on the non-call processing node, the error message "openMMF on PhoneTable failed" is displayed.
Reports from the CLI
In order to display the list of available reports about endpoints and services, enter the show risdb list command. Some information could be also viewed in RTMT.
| CLI Command | RTMT Location |
|---|---|
| phone | CallManager -> Device -> Device Search -> Phone (Any Status) |
| ctiextn | CallManager -> Device -> Device Search -> CTI Devices (Any Status -> Finish) |
| h323 | CallManager -> Device -> Device Search -> H323 Devices (Any Status -> Finish) |
| mediaresource | CallManager -> Device -> Device Search -> Media Resources (Any Status -> Finish) |
| huntlist | CallManager -> Device -> Device Search -> Hunt List (Any Status -> Finish) |
| ctimprovider | CallManager -> CTI -> CTI Search -> Applications (Any Status -> Finish) |
| ctimline | CallManager -> CTI -> CTI Search -> Lines (Any Status -> Finish) |
| sip | CallManager -> Device -> Device Search -> SIP Trunk (Any Status -> Finish) |
In order to check the performance counters from the CLI, the administrator can enter the show perf query class "class-name" command. For example, this example shows how to check whether Media Termination Point (MTP) resources are invoked or not:
admin:show perf query class "Cisco MTP Device"
==>query class .

 - Perf class (Cisco MTP Device) has instances and values:
    MTP_2           -> AllocatedResourceCannotOpenPort = 0
    MTP_2           -> OutOfResources                 = 0
    MTP_2           -> RequestsThrottled              = 0
    MTP_2           -> ResourceActive                 = 0
    MTP_2           -> ResourceAvailable              = 24
    MTP_2           -> ResourceTotal                  = 24
Enter the show perf list classes command in order to display a complete list of performance counter commands.
Contact Cisco
- Open a Support Case

- (Requires a Cisco Service Contract)
 Feedback