Introduction
This document provides information on how to monitor parameters for resource usage on a Cisco Unified Communications Manager (CUCM) cluster with the use of the Real-Time Monitoring Tool (RTMT).
A network administrator in an organization must monitor the number of concurrent calls that are ongoing in the cluster. However, there are not any Cisco Call Manager (CCM) MIBs that help the network administrator monitor the number of active calls, media resource usage, and other parameters for the cluster.
The network administrator can monitor these calls in two ways:
- Use Performance counters. Performance counters can be continuously dumped for parameters such as CallsActive to a .csv file on a PC.
- Schedule a Perfmon log trace collection at regular intervals and check the CallsActive parameter in the logs for the various servers.
Alerts can also be set to send e-mails or print alerts in the system logs (syslogs) when the particular performance counter goes past a limit. The administrator can then use this alert information to analyze whether further resources are required in the cluster.
Prerequisites
Requirements
Cisco recommends you have knowledge of CUCM and understand the operation of RTMT.
Components Used
The information in this ocument is based on these software and hardware versions:
- CUCM Release 8.X
- The RTMT plugin
Note: Download the RTMT plugin from the CCMAdmin page under Applications > Plugins.
Set Up RTMT with E-mail
Use a functional mail server in a domain, such as an Exchange server, with the Simple Mail Transfer Protocoll (SMTP) server called mail.xyz.com.
It is simple to set up e-mail on RTMT is very simple.
- Choose System > Tools > Alert > Config Email Server.

- Enter the hostname of the mail server in the Mail Server field, and enter the port number in the Port field.
- Enter the e-mail ID that you would like to get the mails from.
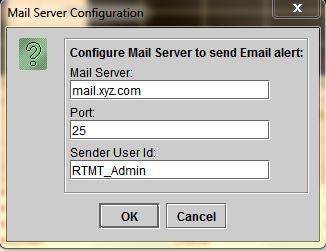
- Click OK. E-mails are sent to e-mail addresses. Now, the recepient e-mail addresses are configured in the Alerts section. You will see this in the next section.
Set Up Alerts
Click the Performance tab in the RTMT. The RTMT loads the servers in the cluster with their IP addresses. Under each of these servers is a list of the services that he servers run, such as the Cisco CallManager service, or the Cisco IP Voice Media Streaming App service.
Under each of the services is a list of parameters. In this screenshot, there is the Cisco CallManager service, and under it, there are many parameters such as CallsActive, CallsAttempted, and CallsCompleted. In order to view any of these parameters in real time, you must click and drag that parameter to the right side of the area and a graph appears.
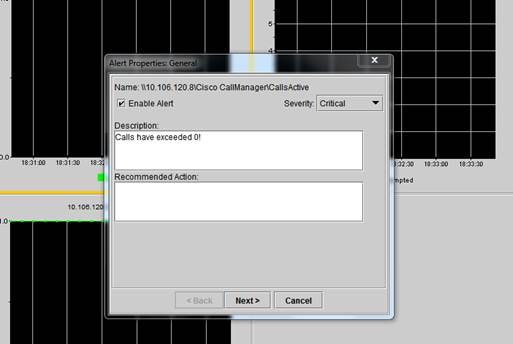
- Right-click the CallsActive window and click the Set Alerts/Properties button.

- Enter a description in the Description field and choose the severity from the Severity drop-down list. Click Next.
- Check the Value Over/Under check box and enter a value to set the limit for this counter. Click Next.
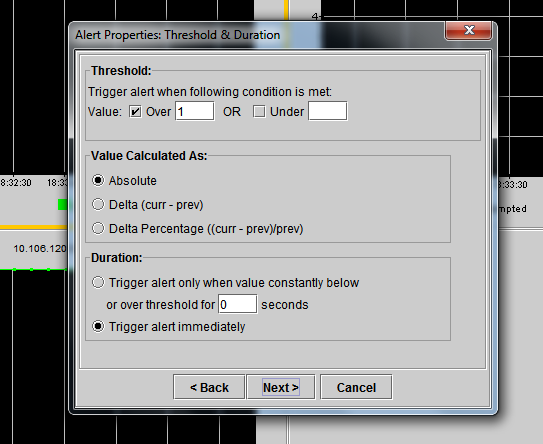
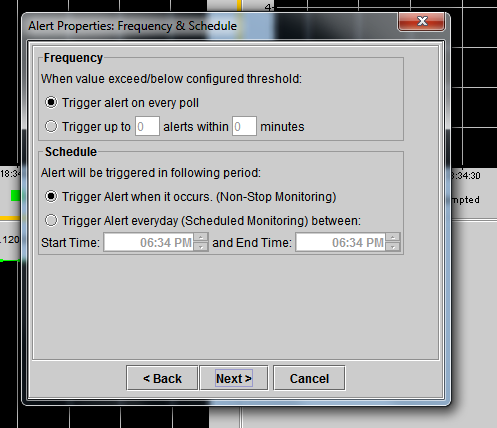
- Set the alert trigger schedule.
If e-mail has already been configured and RTMT uses SMTP to send the usual Critical alerts to the administrator, you can configure e-mail alerts for this counter as well.
- Set the mail text that must be displayed. Click Configure. This sets a new e-mail address.
- Click Save. The e-mail is sent to the mail ID configured here from the mail ID that you configured in the previous section (RTMT_Admin). See this screenshot.

- See Custom Alerts on the syslogs with the CUSTOM tag.

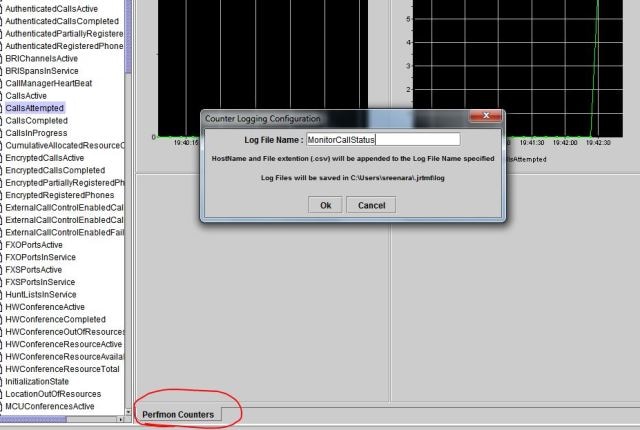
- Right-click the Performance window at the base (Perfmon Counters), and set the polling interval, and log options. You can be very specific about the value that will be dumped into the .csv file. If the RTMT session is open, the stats for this particular parameter are dumped to the .csv file on the computer.
