Monitoring and Troubleshooting Cisco Unified Communications Manager 6.0 High CPU, using Real Time Monitoring Tool (RTMT)
Available Languages
Contents
Introduction
This document provides steps to assist in monitoring and troubleshooting issues related to high processor utilization on Cisco Unified Communications Manager 6.0 with RTMT.
Prerequisites
Requirements
Cisco recommends that you have knowledge of this topic:
-
Cisco Unified Communications Manager
Components Used
The information in this document is based on these agenda items:
The information in this document is based on the Cisco Unified Communications Manager 6.0.
The information in this document was created from the devices in a specific lab environment. All of the devices used in this document started with a cleared (default) configuration. If your network is live, make sure that you understand the potential impact of any command.
Conventions
Refer to Cisco Technical Tips Conventions for more information on document conventions.
System Time, User Time, IOWait, Soft IRQ, and IRQ
The utilization of RTMT to isolate potential problems with CPU can be a very useful troubleshooting step.
These terms represent the usage of RTMT CPU and Memory page reports:
-
%System: the percentage of CPU utilization that occurred in execution at the system level (kernel)
-
%User: the percentage of CPU utilization that occurred in execution at the user level (application)
-
%IOWait: the percentage of time that the CPU was idle as it waited for an outstanding disk I/O request
-
%SoftIRQ: the percentage of time that the processor executes deferred IRQ processing (for example, processing of network packets)
-
%IRQ the percentage of time that the processor executes the interrupt request, which is assigned to devices for interrupt, or sends a signal to the computer when it is finished processing
CPU Pegging Alerts
CPUPegging/CallProcessNodeCPUPegging alerts monitor CPU usage based on configured thresholds:
Note: %CPU is calculated as %system + %user + %nice + %iowait + %softirq + %irq
Alert messages include these:
-
%system, %user, %nice, %iowait, %softirq, and %irq
-
The process that uses the most CPU
-
The processes that wait on Uninterruptible disk sleep
CPU Pegging alerts can come up in RTMT due to higher CPU usage than what is defined as the watermark level. Since CDR is a CPU intensive application when it loads, check if you receive the alerts in the same period as when the CDR is configured to run reports. In this case, you can need to increase the threshold values on RTMT. Refer to Alerts for more information about RTMT alerts.
Identification of Process that Uses the Most CPU
If %system and/or %user is high enough to generate CpuPegging alert, check the alert message to see which processes use the most CPU.
Note: Go to the RTMT Process page and sort by %CPU to identify the high CPU processes.
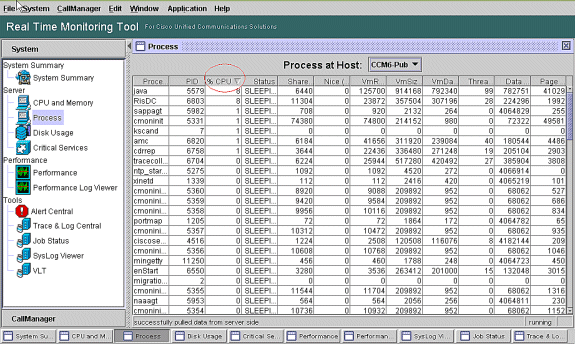
Note: For postmortem analysis, the RIS Troubleshooting PerfMon Log tracks the process %CPU usage, and it tracks at the system level.
High IOWait
High %IOWait indicates high disk I/O activities. Consider these:
-
IOWait is due to heavy memory swapping.
Check the %CPU Time for Swap Partition to see if there is high level of memory swapping activity. Since Muster has at least 2G RAM, high memory swapping is likely due to a memory leak.
-
IOWait is due to DB activity.
DB is primarily the only one that accesses Active Partition. If %CPU Time for Active Partition is high, likely there is a lot of DB activity.
High IOWait due to Common Partition
Common (or Log) Partition is the location in which trace and log files are stored.
Note: Check these:
-
Trace & Log Central—Is there any trace collection activity? If call processing is impacted (that is, CodeYellow), adjust the trace collection schedule. Also, if the zip option is used, turn that off.
-
Trace setting—At the Detailed level, CallManager generates quite a bit of trace. If high %IOWait and/or CCM is in the CodeYellow state and the CallManager service trace setting is at Detailed, try to change it to "Error."
Identification of Process Responsible for Disk I/O
There is no direct way to find out the %IOWait usage per process. Currently, the best way is to check the processes waiting on the disk.
If %IOWait is high enough to cause a CpuPegging alert, check the alert message to determine the processes waiting for disk I/O.
-
Go to RTMT Process page and sort by Status. Check for processes in the Uninterruptible disk sleep state. The SFTP process used by TLC for scheduled collection is in the Uninterruptible disk sleep state.
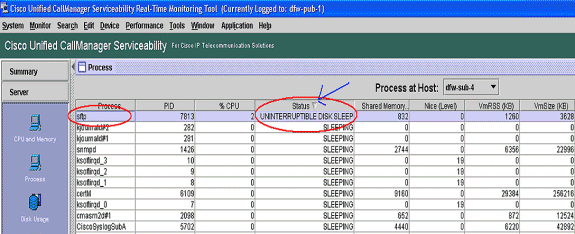
Note: The RIS Troubleshooting PerfMon Log file can be downloaded to examine the process status for longer periods of time.
-
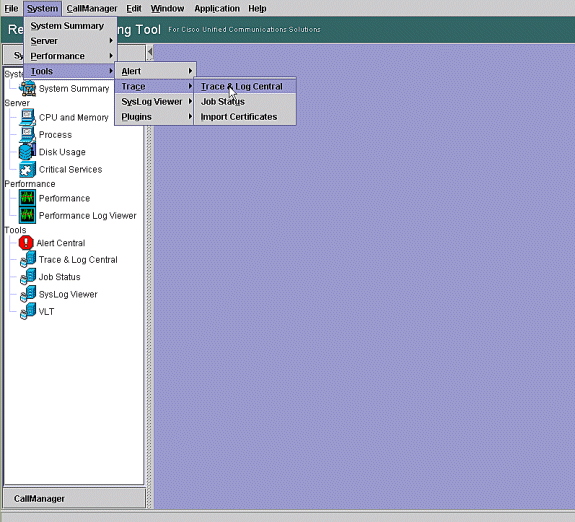
In the Real Time Monitoring Tool, go to System > Tools > Trace > Trace & Log Central.
-
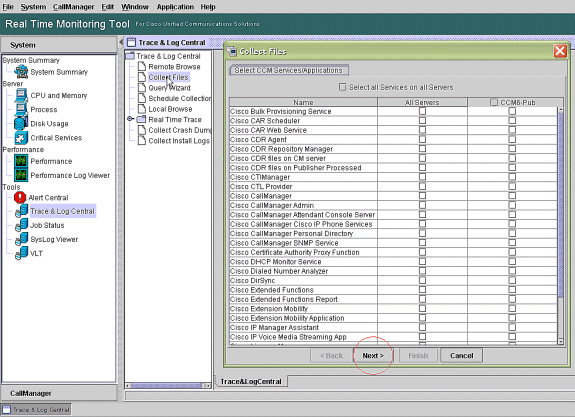
Double click Collect Files and choose Next.
-
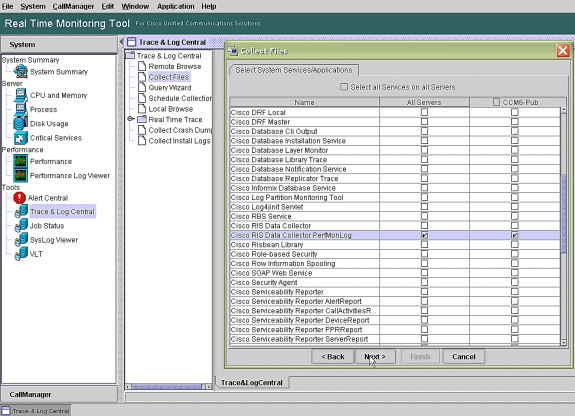
Choose Cisco RIS Data Collector PerfMonLog and choose Next.
-
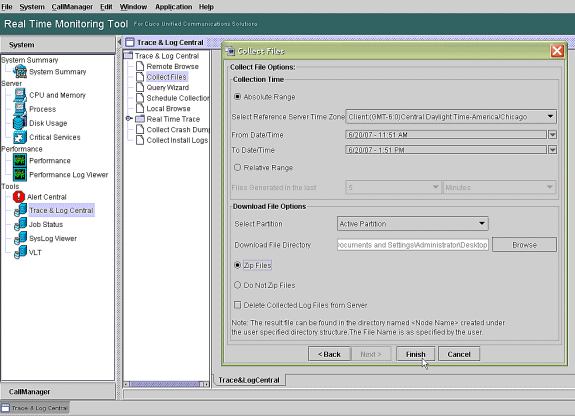
In the Collection Time field, configure the time required to view log files for the period in question. In the Download File Options field, browse to your download path (a location from which you can launch the Windows Performance Monitor to view the log file), choose Zip Files, and choose Finish.
-
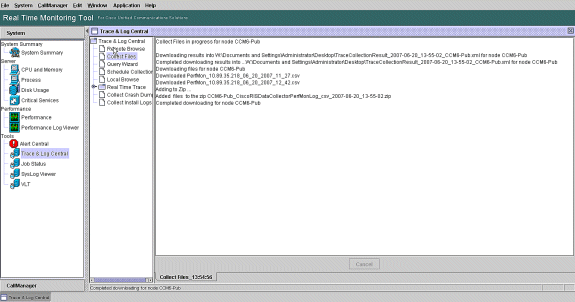
Note the Collect Files progress and download path. No errors should be reported here.
-
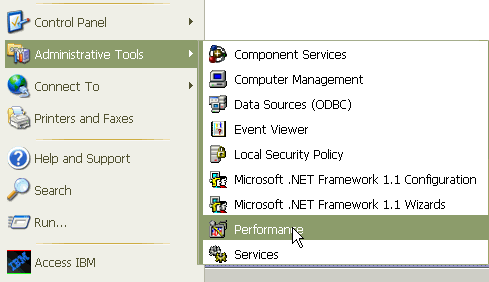
View the Performance Log Files with the Microsoft Performance Monitor Tool. Choose Start > Settings > Control Panel > Administrative Tools > Performance.
-
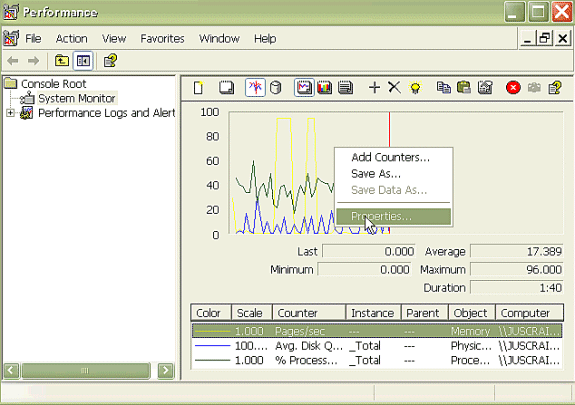
In the application window, right click and choose Properties.
-
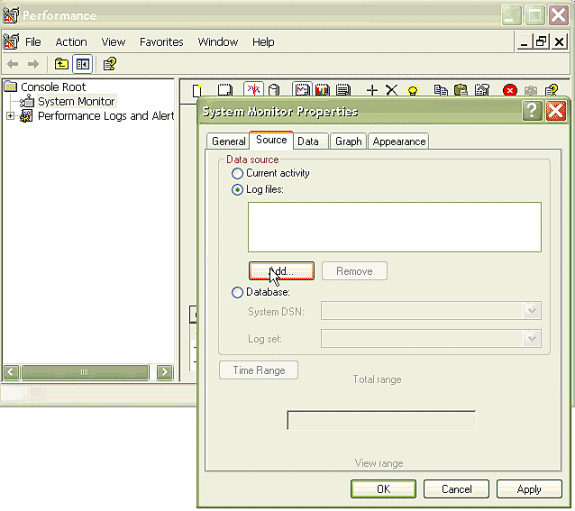
Choose the Source tab in the System Monitor Properties dialog box. Choose Log files: as the data source, and click the Add button.
-
Browse to the directory where you downloaded the PerfMon Log file and choose the perfmon csv file. The log file includes this naming convention:
PerfMon_<node>_<month>_<day>_<year>_<hour>_<minute>.csv; for example, PerfMon_10.89.35.218_6_20_2005_11_27.csv.
-
Click Apply.
-
Click the Time Range button. In order to specify the time range in the PerfMon Log file that you want to view, drag the bar to the appropriate start and end times.
-
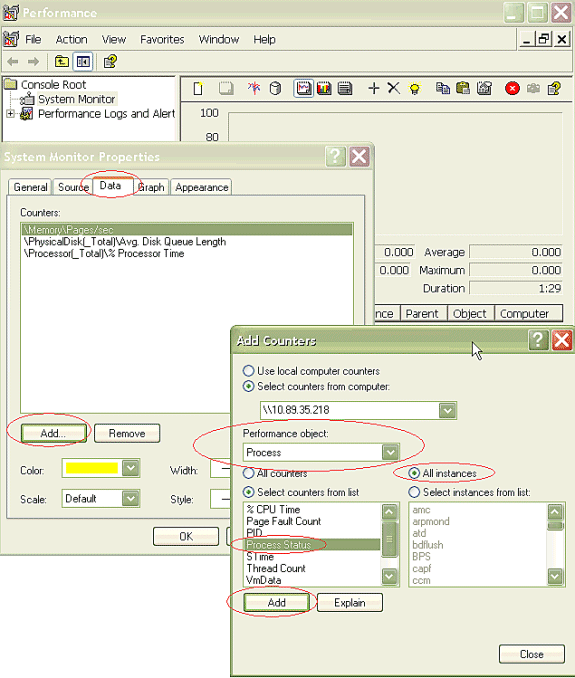
In order to open the Add Counters dialog box, click the Data tab and click Add. From the Performance Object drop-down box, add Process. Choose Process Status and click All instances. When you finish the counters choices, click Close.
-
Tips for when you view the log:
-
Set the graph vertical scale to Maximum 6.
-
Focus on each process and look at the Maximum value of 2 or greater.
-
Delete processes that are not in Uninterruptible disk sleep.
-
Use the highlight option.
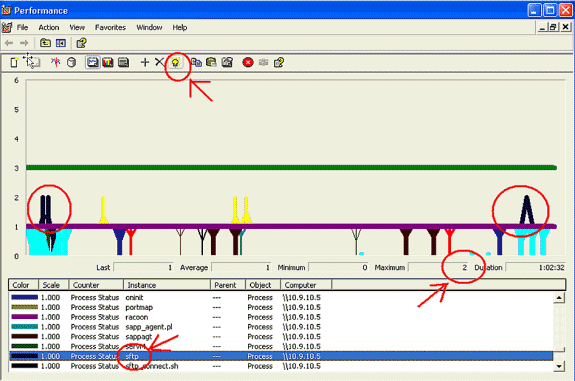
Note: Process Status 2 = Uninterruptible disk sleep are suspect. Other status possibilities are 0–running, 1–sleeping, 2–Uninterruptible disk sleep, 3–Zombie, 4–Traced or stopped, 5–Paging, 6–Unknown
-
Code Yellow
The Code Yellow alert is generated when CallManager service goes into the Code Yellow state. For more information on the Code Yellow State, refer to Call Throttling and the Code Yellow State. The CodeYellow alert can be configured to download Trace files for troubleshooting purposes.
The AverageExpectedDelay counter represents the current average expected delay to handle any inbound message. If the value is above the value specified in the "Code Yellow Entry Latency" service parameter, the CodeYellow alarm is generated. This counter can be one key indicator of call processing performance.
CodeYellow but Total CPU Usage is Only 25% - Why?
It is possible for CallManager to go into the CodeYellow state due to a lack of processor resources when the total CPU usage is only around 25-35 percent in a 4-virtual-processor box.
Note: With Hyper-Threading turned on, a server with two physical processors has four virtual processors.
Note: Similarly, on a two-processor server, CodeYellow is possible at around 50 percent total CPU usage.
Alert : "Service Status is DOWN. Cisco Messaging Interface."
If RTMT sends the Service status is DOWN. Cisco Messaging Interface. alert, you must de-activate the Cisco Messaging Interface service if CUCM is not integrated with a third party Voice Messaging System. If you disable the Cisco Messaging Interface service, it stops further alerts from RTMT.
Related Information
Revision History
| Revision | Publish Date | Comments |
|---|---|---|
1.0 |
30-Jan-2009 |
Initial Release |
Contact Cisco
- Open a Support Case

- (Requires a Cisco Service Contract)


 Feedback