Cisco CleanAir - Cisco Unified Wireless Network Design Guide
Available Languages
Contents
Introduction
Spectrum intelligence (SI) is a core technology designed to proactively manage the challenges of a shared wireless spectrum. Essentially, SI brings advanced interference identification algorithms similar to those used in the military to the commercial wireless networking world. SI provides visibility to all the users of the shared spectrum, both Wi-Fi devices and foreign interferers. For every device that operates in the unlicensed band, SI tells you: What is it? Where is it? How does it impact the Wi-Fi network? Cisco has taken the bold step to integrate SI directly into the Wi-Fi silicon and infrastructure solution.
The integrated solution, referred to as Cisco CleanAir, means that for the first time WLAN IT manager is able to identify and locate non-802.11 interference sources, which raises the bar on the ease of management and security of wireless networks. Most importantly, an integrated SI sets the stage for a new breed of Radio Resource Management (RRM). Unlike previous RRM solutions that could only understand and adapt to other Wi-Fi devices, SI opens the path for a second-generation RRM solution that is fully aware of all the users of the wireless spectrum, and is able to optimize performance in the face of these varied devices.
The first important point that needs to be made is that from a design perspective. CleanAir enabled access points (APs) are just that; APs and the performance is virtually identical to the 1140 APs. Designing for Wi-Fi coverage is the same with both. CleanAir or interference identification processes are a passive process. CleanAir is based on the receiver, and for classification to function, the source needs to be loud enough to be received at 10 dB above the noise floor. If your network is deployed in such a way that your clients and APs can hear one another, then CleanAir can hear well enough to alert you to troubling interference within your network. The coverage requirements for CleanAir are detailed in this document. There are some special cases depending on the CleanAir implementation route you ultimately choose. The technology has been designed to compliment the current best practices in Wi-Fi deployment. This includes the deployment models of other widely used technologies such as Adaptive wIPS, Voice, and location deployments.
Prerequisites
Requirements
Cisco recommends that you have knowledge of CAPWAP and Cisco Unified Wireless Network (CUWN).
Components Used
The information in this document is based on these software and hardware versions:
-
CleanAir capable APs are Aironet 3502e, 3501e, 3502i, and 3501i
-
Cisco WLAN Controller (WLC) running version 7.0.98.0
-
Cisco Wireless Control System (WCS) running version 7.0.164.0
-
Cisco Mobility Services Engine (MSE) running version 7.0
Conventions
Refer to Cisco Technical Tips Conventions for more information on document conventions.
CleanAir Theory of Operations
CleanAir is a system, not a feature. CleanAir software and hardware components provide the ability to accurately measure Wi-Fi Channel quality and identify non-Wi-Fi sources of channel interference. This cannot be done with a Standard Wi-Fi chipset. In order to understand design goals and requirements for successful implementation it is necessary to understand how CleanAir works at a high level.
For those already familiar with Cisco’s Spectrum Expert technology, CleanAir is a natural evolutionary step. But, it is a completely new technology in that this is an enterprise-based distributed spectrum analysis technology. As such, it is similar to Cisco Spectrum Expert in some respects but very different in others. The components, functions, and features are discussed in this document.
CleanAir AP
The new CleanAir capable APs are Aironet 3502e, 3501e, 3502i, and 3501i. The e designates External Antenna, the I designates Internal antenna. Both are fully functional next generation 802.11n APs and run on standard 802.3af power.
Figure 1: C3502E and C3502I CleanAir Capable APs 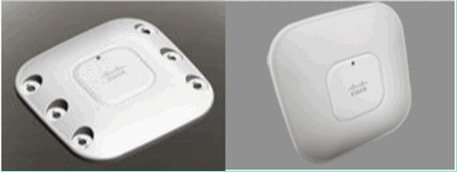
The Spectrum Analysis hardware is directly integrated into the chipset of the radio. This addition added over 500 K logic gates to the radio silicon, and has provided exceptionally close coupling of the features. There are many other traditional features, which have been added or improved with these radios. But, it is beyond the scope of this document and these are not covered here. Suffice it is to say, that on its own without CleanAir the 3500 series APs pack a lot of features and performance into an attractive and robust enterprise AP.
Cisco CleanAir System Components
The basic Cisco CleanAir architecture consists of Cisco CleanAir enabled APs and a Cisco WLAN controller (WLC). Cisco Wireless Control System (WCS) and Mobility Services Engine (MSE) are optional system components. In order to get full value from the information that the CleanAir system supplies, the WCS and MSE together are key to leveraging a wider efficacy of CleanAir. This provides user interfaces for advanced spectrum capabilities such as historic charts, tracking interference devices, location services and impact analysis.
An AP equipped with Cisco CleanAir technology collects information about non-Wi-Fi interference sources, process it and forward to the WLC. The WLC is an integral core part of the CleanAir system. The WLC controls and configures CleanAir capable APs, collects and processes spectrum data and provides it to the WCS and/or the MSE. The WLC provides local user interfaces (GUI and CLI) to configure basic CleanAir features and services and display current spectrum information.
The Cisco WCS provides advanced user interfaces for CleanAir that include feature enabling and configuration, consolidated display information, historic Air Quality records and reporting engines.
Figure 2: Logical System Flow 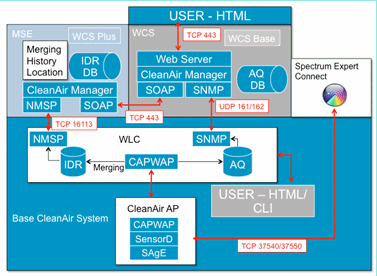
The Cisco MSE is required for location and historic tracking of interference devices, and provides coordination and consolidation of interference reports across multiple WLCs.
Note: A single WLC can only consolidate interference alerts for APs directly connected to it. Coordination of reports that come from APs attached to different controllers requires the MSE which has a system wide view of all CleanAir APs and WLCs.
Interference Classification and SAgE
The heart of the CleanAir system is the Spectrum Analysis Engine (SAgE) ASIC, the spectrum analyzer on a chip. However, it is much more than just a spectrum analyzer. At the core is a powerful 256 point FFT engine which provides an amazing 78 KHz RBW (Resolution Band Width, the minimum resolution which can be displayed) purpose built pulse and statistics gathering engines as well as the DSP Accelerated Vector Engine (DAvE). The SAgE hardware runs in parallel with the Wi-Fi chipset and processes near line rate information. All of this allows extreme accuracy and scales for large numbers of like interference sources, with no penalty in throughput of user traffic.
The Wi-Fi chipset is always on line. SAgE scans are performed once per second. If a Wi-Fi preamble is detected, it is passed through to the chipset directly and is not affected by the parallel SAgE hardware. No packets are lost during SAgE scanning, SAgE is disabled while a Wi-Fi packet is processed through the receiver. SAgE is very fast and accurate. Even in a busy environment, there is more than enough scan time to accurately assess the environment.
Why does RBW matter? If you need to count and measure the difference between several Bluetooth radios hopping with narrow signals at 1600 hops per second, you need to separate different transmitters hops in your sample if you want to know how many there are. This takes resolution. Otherwise, it would all look like one pulse. SAgE does this, and it does this well. Because of the DAvE and being associated on board memory, the ability to process multiple samples/interferers in parallel is there. This increases the speed, which allows you to process the data stream in near real time. Near real time means there is some delay, but it is so minimal it takes a computer to measure it.
CleanAir AP Information Elements
Cisco CleanAir APs produce two basic types of information for the CleanAir system. An IDR (Interference Device Report) is generated for each classified interference source. AQI’s (Air Quality Index) reports are generated every 15 seconds and passed to Cisco IOS® for averaging and eventual transmission to the controller based on the configured interval. CleanAir messaging is all handled on the control plane in two new CAPWAP message types: Spectrum Configuration and Spectrum Data. Formats for these messages are listed here:
Spectrum Configuration:
WLC – AP

CAPWAP msg: CAPWAP_CONFIGURATION_UPDATE_REQUEST = 7
payload type: Vendor specific payload type (104 -?)
vendor type: SPECTRUM_MGMT_CFG_REQ_PAYLOAD = 65
AP-WLC

Payload type: Vendor specific payload type (104 -?)
vendor types: SPECTRUM_MGMT_CAP_PAYLOAD = 66
              SPECTRUM_MGMT_CFG_RSP_PAYLOAD = 79
              SPECTRUM_SE_STATUS_PAYLOAD = 88
Spectrum data AP – WLC
CAPWAP: IAPP message
IAPP subtype: 0x16
data type: AQ data – 1
main report 1
worst interference report 2
IDR data – 2
Interference Device Report
The Interference Device Report (IDR) is a detailed report that contains information about a classified interference device. This report is very similar to the information that is seen in Cisco Spectrum Expert Active Devices, or Devices View. Active IDRs can be viewed on the WLC GUI/and CLI for all CleanAir radios on that WLC. IDRs are forwarded to the MSE only.
This is the format for an IDR report:
Table 1 - Interference Device Report| Parameter name | Units | Notes |
|---|---|---|
| Device ID | The number uniquely identifies interference device for the specific radio. It consists of upper 4 bits generated during the system boot and lower 12 bits running number. | |
| Class Type | device class type | |
| Event type | device down device up update | |
| Radio Band ID | 1 = 2.4 GHz, 2 = 5 GHz, 4 = 4.9 GHz; 2 MSBs reserved. 4.9GHz is not supported for initial release. | |
| Timestamp | initial device detection time | |
| Interference Severity Index | 1 – 100, 0x0 is reserved for undefined/hidden severity | |
| Detected on Channels | bitmap | support for detection on multiple channels within the same radio band |
| Interference Duty Cycle | % | 1 – 100% |
| Antenna ID | bitmap | Support for multiple antenna reports is reserved for the future releases. |
| Tx Power (RSSI) per antenna | dBm | |
| Device Signature length | Length of “Device Signature” field. Currently the length could be in the range 0 - 16 bytes. | |
| Device Signature | Parameter represents either unique device MAC address or device PMAC signature. See PMAC definition below. |
An IDR is produced for each classified device. An individual radio can track a theoretical infinite number of devices similar to what the Spectrum Expert card does today. Cisco has tested hundreds with success. However, in an enterprise deployment there are hundreds of sensors, and a practical reporting limit is enforced for scaling purposes. For CleanAir APs, the top ten IDRs based on severity are reported. One exception to this rule is the case of the security interferer. A security IDR is always given precedence regardless of severity. The AP tracks which IDRs have been sent to the controller, and adds or deletes as needed.
Table 2: Example of IDR tracking table on the AP| TYPE | SEV | WLC |
|---|---|---|
| SECURITY | 1 | X |
| Interference | 20 | X |
| Interference | 9 | X |
| Interference | 2 | X |
| Interference | 2 | X |
| Interference | 1 | X |
| Interference | 1 | X |
| Interference | 1 | X |
| Interference | 1 | X |
| Interference | 1 | X |
| Interference | 1 | |
| Interference | 1 |
Note: Interference sources marked as Security Interferers are user designated and can be configured through Wireless > 802.11a/b/g/n > cleanair > enable interference for security alarm. Any interference source that is classified can be chosen for a security trap alert. This sends a security trap to the WCS or another configured trap receiver based on the type of interferer selected. This trap does not contain the same information as an IDR. It is simply a way to trigger an alarm on the presence of the interferer. When an interferer is designated as a security concern, it is marked as such at the AP and is always included in the ten devices that are reported from the AP regardless of severity.
IDR messages are sent in real time. On detection the IDR is marked as device up. If it stops a device down message is sent. An update message is sent every 90 seconds from the AP for all devices currently being tracked. This allows for status updates of tracked interference sources and an audit trail in the event an up or down message was lost in transit.
Air Quality
Air Quality (AQ) reporting is available from any spectrum capable AP. Air Quality is a new concept with CleanAir and represents a “goodness” metric of the available spectrum and indicates the quality of bandwidth available for the Wi-Fi channel. Air Quality is a rolling average that evaluates the impact of all classified interference devices against a theoretical perfect spectrum. The scale is 0-100 % with 100% representing Good. AQ reports are sent independently for each radio. The latest AQ report is viewable on the WLC GUI and CLI. AQ reports are stored on the WLC and polled by WCS regular interval. The default is 15 minutes (minimum) and can be extended to 60 minutes on the WCS.
Why is AirQuality Unique?
Currently, most standard Wi-Fi chips evaluate the spectrum by tracking all of the packets/energy that can be demodulated on receive, and all of the packets/energy that it is transmitting. Any energy that remains in the spectrum that cannot be demodulated or accounted for by RX/TX activity is lumped into a category called noise. In reality a lot of the “noise” is actually remnants from collisions, or Wi-Fi packets that fall below the receive threshold for reliable demodulation.
With CleanAir, a different approach is taken. All of the energy within the spectrum that is definitely NOT Wi-Fi is classified and accounted for. We can also see and understand energy that is 802.11 modulated and classify energy that is coming from Co-channel and Adjacent channel sources. For each classified device a severity index is calculated (see the Severity section), a positive integer between 0 and 100 – with 100 being the most severe. Interference severity is then subtracted from the AQ scale (starting at 100 – good) to generate the actual AQ for a channel/radio, AP, Floor, Building or campus. AQ then is a measurement of the impact of all classified devices on the environment.
There are two AQ reporting modes defined: normal and rapid update. Normal mode is the default AQ reporting mode. Either the WCS or the WLC retrieves reports at normal update rate (default is 15 minutes). The WCS informs the Controller about the default polling period, and the WLC instructs the AP to change AQ averaging and reporting period accordingly.
When the user drills down to Monitor > Access Points > and chooses a radio interface from the WCS or the WLC, the selected radio is placed into rapid update reporting mode. When a request is received, the Controller instructs the AP to change the default AQ reporting period temporarily to a fixed fast update rate (30 sec), which allows near real-time visibility into AQ changes at the radio level.
Default reporting state is “ON”.
Table 3: Air Quality Report| Parameter name | Units | Note |
|---|---|---|
| Channel number | In local mode – this would be the served channel | |
| Minimum AQI | Lowest AQ detected during the reporting period. | |
| The following parameters are averaged on AP over the reporting period: | ||
| Air Quality Index (AQI) | ||
| Total Channel Power (RSSI) | dBm | These parameters show total power from all the sources including both interferers and WiFi devices. |
| Total Channel Duty Cycle | % | |
| Interference Power (RSSI) | dBm | |
| Interference Duty Cycle | % | non WiFi devices only |
Multiple entries for each detected device is attached to the report, ordered by device severity. The format for these entries is here:
Table 4: AQ Device Report| PARAMETER NAME | UNITS | NOTES |
|---|---|---|
| Class type | device class type | |
| Interference Severity Index | ||
| Interference Power (RSSI) | dBm | |
| Duty Cycle | % | |
| Device Count | ||
| total |
Note: In the context of spectrum reporting, Air Quality represents interference from non-Wi-Fi sources and Wi-Fi sources not detectable by a Wi-Fi AP during normal operation (for example, old 802.11 frequency hopper devices, altered 802.11 devices, Adjacent overlapping Channel Interference, etc). Information about Wi-Fi based interference is collected and reported on by the AP using the Wi-Fi chip. A Local mode AP collects AQ information for the current serving channel(s). A Monitor Mode AP collects information for all channels configured under scan options. The standard CUWN settings of Country, DCA, and All channels is supported. When an AQ report is received, the Controller performs required processing and store it in the AQ database.
CleanAir Concepts
As previously mentioned, CleanAir is the integration of Cisco Spectrum Expert technology within a Cisco AP. While similarities might exist, this is a fresh use of the technology and many new concepts are presented in this section.
Cisco Spectrum Expert introduced technology that was able to positively identify non-Wi-Fi sources of radio energy. This permitted the operator to focus on information such as duty cycle and operating channels, and make an informed decision about the device and its' impact on their Wi-Fi network. Spectrum Expert allowed the operator to then lock the chosen signal into the device finder application and physically locate the device by walking around with the instrument.
The design goal of CleanAir is to go several steps further, by essentially removing the operator further from the equation and automating several of the tasks within system management. Because you can know what the device is and what it is affecting, better decisions can be made at a system level on what to do with the information. Several new algorithms have been developed to add intelligence to the work that was started with Cisco Spectrum Expert. There are always cases that require physically disabling an interference device, or making a decision about a device and impact that involves humans. The overall system should heal what can be healed and avoid what can be avoided so that the effort to reclaim affected spectrum can be a proactive exercise instead of a reactive one.
CleanAir AP Modes of Operation
Local Mode AP (recommended) (LMAP)—A Cisco CleanAir AP operating in LMAP mode is serving clients on it’s assigned channel. It is also monitoring the Spectrum on that channel and that channel ONLY. Tight silicon integration with the Wi-Fi radio allows the CleanAir hardware to listen between traffic on the channel that is currently being served with absolutely no penalty to throughput of attached clients. That is line rate detection without interrupting client traffic.
There are no CleanAir dwells processed during normal off channel scans. In normal operation, a CUWN Local Mode AP executes an off channel passive scans of the alternate available channels in 2.4 GHz and 5 GHz. Off channel scans are used for system maintenance such as RRM metrics and rogue detection. The frequency of these scans is not sufficient to collect back to back dwells required for positive device classification, so information gleaned during this scan is suppressed by the system. Increasing the frequency of off channel scans is also not desirable, as it takes away from time that the radio services traffic.
What does this all mean? A CleanAir AP in LMAP mode only scans one channel of each band continuously. In normal enterprise densities there should be plenty of APs on the same channel, and at least one on each channel assuming RRM is handling channel selection. An interference source that uses narrow band modulation (operates on or around a single frequency) is only detected by APs that share that frequency space. If the interference is a frequency hopping type (uses multiple frequencies – generally covering the whole band) it is detected by every AP that can hear it operating in the band.
Figure 4: LMAP AP detection example 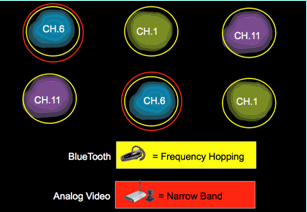
In 2.4 GHz, LMAPs have sufficient density to generally ensure at least three points of classification. A minimum of three detection points is required for location resolution. In 5 GHz, there are 22 channels operating in the United States, thus detection density and sufficient location density is less likely. However, if interference is operating on a channel occupied by a CleanAir AP, it detects it and alert or take steps to mitigate if those features are enabled. Most interference seen is confined to the 5.8 GHz portion of the band. This is where consumer devices live and hence where it is most likely to be encountered. You can limit your channel plan to force more APs to that space if you desire. However, it is not really warranted. Remember, interference is only a problem if it is using spectrum you need. If your AP is not on that channel, it is likely that you still have plenty of spectrum left to move into. What if the need to monitor all of 5 GHz is driven by security policies? See the Monitor Mode AP definition below.
Monitor Mode AP (optional) (MMAP)—A CleanAir Monitor mode AP is dedicated and does not serve client traffic. It provides full time scanning of all channels using 40 MHz dwells. CleanAir is supported in monitor mode along with all other current monitor mode applications including Adaptive wIPS and location enhancement. In a dual radio configuration this ensures that all bands-channels are routinely scanned.
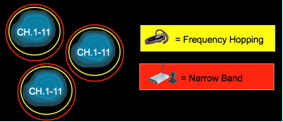
CleanAir enabled MMAPs can be deployed as part of a pervasive deployment of CleanAir enabled LMAPs to provide additional coverage in 2.4 and 5 GHz, or as a standalone overlay solution for CleanAir functionality in an existing non-CleanAir AP deployment. In a scenario as mentioned above where security is a primary driver, it is likely that Adaptive wIPS would also be a requirement. This is supported concurrently with CleanAir on the same MMAP.
There are some distinct differences in how some of the features are supported when deploying as an overlay solution. Thisis covered in the deployment models discussion in this document.
Spectrum Expert Connect Mode – SE Connect (optional)—An SE Connect AP is configured as a dedicated Spectrum Sensor that allows connection of the Cisco Spectrum Expert application running on a local host to use the CleanAir AP as a remote spectrum sensor for the local application. The connection between Spectrum Expert and the remote AP bypasses the controller on the data plane. The AP remains in contact with the controller on the control plane. This mode allows viewing of the raw spectrum data such as FFT plots and detailed measurements. All CleanAir system functionality is suspended while the AP is in this mode, and no clients are served. This mode is intended for remote troubleshooting only. The Spectrum Expert application is a MS Windows application that connects to the AP via a TCP session. It can be supported in VMWare.
Severity Index and Air Quality
In CleanAir the concept of Air Quality was introduced. Air Quality is a measurement of the percentage of time that the spectrum at a particular observed container (radio, AP, Band, Floor, Building) is available for Wi-Fi traffic. AQ is a function of the severity index, which is calculated for each classified interference source. The Severity index evaluates each non- Wi-Fi devices over the air characteristics and calculates what percentage of time the spectrum is not available for Wi-Fi with this device present.
Air Quality is a product of the severity indexes of all classified interference sources. This is then reported as the overall Air Quality by radio/channel, band, or RF propagation domain (floor, building) and represents the total cost against available airtime of all non- Wi-Fi sources. Anything that is left is theoretically available to the Wi-Fi network for traffic.
This is theoretical because there is a whole science behind measuring the efficiency of Wi-Fi traffic, and this is beyond the scope of this document. However, knowing that interference is or is not impacting that science is a key goal if your plan is success in identifying and mitigating pain points.
What makes an interference source severe? What determines if it is/or is not a problem? How do I use this information to manage my network? These questions are discussed in this document.
In the simplest terms, non- Wi-Fi utilization comes down to how often another radio is using my networks spectrum (Duty Cycle) and how loud is it in relation to my radios (RSSI/location). Energy in the channel that is seen by an 802.11 interface trying to access the channel is perceived as a busy channel if it is above a certain energy threshold. This is determined by clear channel assessment (CCA). Wi-Fi uses a listen before talk channel access method for contention free PHY access. This is per CSMA-CA (-CA=collision avoidance).
The RSSI of the interferer determines if it can be heard above the CCA threshold. The Duty Cycle is the on time of a transmitter. This determines how persistent an energy is in the channel. The higher the duty cycle the more often the channel is blocked.
Simple severity can be demonstrated this way then using strictly the RSSI and the Duty Cycle. For illustration purposes, a device with 100% duty cycle is assumed.
Figure 5: As interference signal decreases - AQI increases 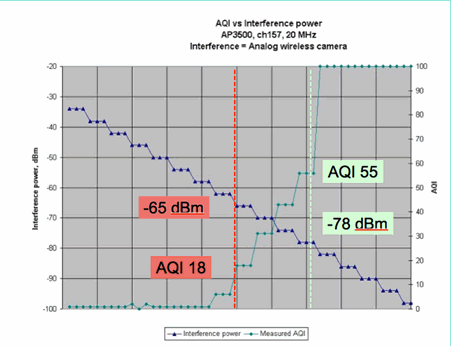
In the graph in this figure you can see that as the signal power of the interference decreases, the resulting AQI increases. Technically, as soon as the signal falls below -65 dBm, the AP no longer is blocked. You do need to think abut the impact this has on clients in the cell. 100% duty cycle (DC) ensures constant disruption of client signals with insufficient SNR in the presence of the noise. AQ rapidly increases once the signal power falls below -78 dBm.
So far there are two of the three major impacts of interference defined in the severity based Air Quality metric:
-
CCA Blocking
-
Eroded SNR
Interference is straightforward when looking at 100% DC. This is the type of signal most often used in demonstrations of the affect of interference. It is easy to see in a spectrogram, and it has a very dramatic affect on the Wi-Fi channel. This does happen in the real world too, for example in analog video cameras, motion detectors, telemetry equipment, TDM signals, and older cordless phones.
There are a lot of signals that are not 100% DC. In fact, a lot of the interference that is encountered is interference of this type: variable to minimal. Here it gets a bit tougher to call the severity. Examples of interference of this type are Bluetooth, Cordless Phones, wireless speakers, telemetry devices, older 802.11fh gear and so on. For instance, a single Bluetooth headset does not do much damage in a Wi-Fi environment. However, three of these with overlapping propagation can disconnect a Wi-Fi phone if walked through.
In addition to CCA, there are provisions in the 802.11 specifications such as the contention window, which is needed to accommodate airtime of different base protocols. Then you add to this various QOS mechanisms. All of these media reservations are used by different applications to maximize airtime efficiency and minimize collisions. This can be confusing. However, because all the interfaces on the air participate and agree on the same group of standards, it works very well. What occurs to this ordered chaos when you introduce a very specific energy that does not understand the contention mechanisms or for that matter does not even participate in CSMA-CA? Well, mayhem actually, to a greater or lesser degree. It depends how busy the medium is when the interference is experienced.
Figure 6: Similar but Different Channel Duty Cycles 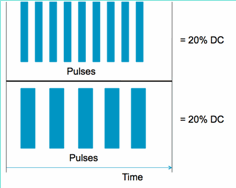
You can have two identical signals in terms of the Duty Cycle as measured in the channel and amplitude, but have two totally different levels of interference experienced on a Wi-Fi network. A fast repeating short pulse can be more devastating to Wi-Fi than a relatively slow repeating fat one. Look at an RF jammer, which effectively shuts down a Wi-Fi channel and registers very little duty cycle.
In order to do a proper job evaluating, you need a better understanding of the minimum interference interval introduced. The minimum interference interval accounts for the fact that in-channel pulses interrupt Wi-Fi activity for some period longer than their actual duration, due to three effects:
-
If already counting down, Wi-Fi devices must wait an additional DIFS period after the interference pulse. This case is typical for heavily loaded networks, where the interference starts before the Wi-Fi’s back-off counter has counted down to zero.
-
If a new packet arrives to be transmitted mid-interference, the Wi-Fi device must additionally back off using a random value between zero and CWmin. This case is typical for lightly loaded networks, where the interference starts before the Wi-Fi packet arrives to the MAC for transmission.
-
If the Wi-Fi device is already transmitting a packet when the interference burst arrives, the whole packet must be retransmitted with the next-higher value of CW, up to CWmax. This case is typical if the interference starts second, partially through an existing Wi-Fi packet.
If the back off time expires without a successful retransmission, then the next back off is double the previous. This continues with unsuccessful transmission up to CWmax is reached or TTL is exceeded for the frame.
Figure 7 - For 802.11b/g CWmin = 31, for 802.11a CWmin is 15, both have CWmax of 1023 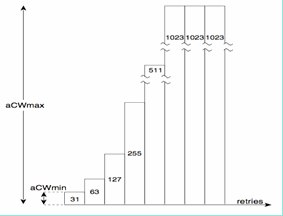
In a real Wi-Fi network, it is difficult to estimate the mean duration of these three effects because they are functions of the number of devices in the BSS, overlapping BSSs, device activity, packet lengths, supported speeds/ protocols, QoS, and present activity. Therefore, the next best thing is to create a metric that remains constant as a reference point. This is what Severity does. It measures the impact of a single interferer against a theoretical network, and maintains a constant report of severity regardless of the underlying utilization of the network. This gives us a relative point to look at across network infrastructures.
The answer to the question “how much non- Wi-Fi interference is bad” is subjective. In lightly loaded networks it is quite possible to have levels of non- Wi-Fi interference that go unnoticed by the users and administrators. This is what leads to trouble in the end. The nature of wireless networks is to become busier over time. Success leads to faster organizational adoption, and to new applications being committed. If there is interference present from day one, it is quite likely that the network have a problem with this when it becomes busy enough. When this happens it is difficult for people to believe that something that has been fine seemingly all along is the culprit.
How do we use CleanAir’s Air Quality and Severity metrics?
-
AQ is used to develop and monitor a baseline spectrum measurement and alert on changes indicating a performance impact. You can also use it for long term trend assessment through reporting.
-
Severity is used to evaluate interference impact potential and prioritize individual devices for mitigation.
PMAC
Non Wi-Fi transmitters are less than friendly when it comes to unique characteristics that can be used to identify them. That is essentially what made the Cisco Spectrum Expert solution so revolutionary. Now with CleanAir there are multiple APs that potentially all hears the same interference at the same time. Correlating these reports to isolate unique instances is a challenge that had to be solved to provide advanced features, such as location of interference devices, as well as an accurate count.
Enter the Pseudo MAC or PMAC. Because an analog video device does not have a MAC address or, in several cases, any other identifying digital tag an algorithm had to be created to identify unique devices being reported from multiple sources. A PMAC is calculated as part of the device classification and included in the interference device record (IDR). Each AP generates the PMAC independently, and while it is not identical for each report (at a minimum the measured RSSI of the device is likely different at each AP), it is similar. The function of comparing and evaluating PMACs is called merging. The PMAC is not exposed on customer interfaces. Only the results of merging are available in the form of a cluster ID. This merging is discussed next.
Figure 8: Raw Detection of Interference 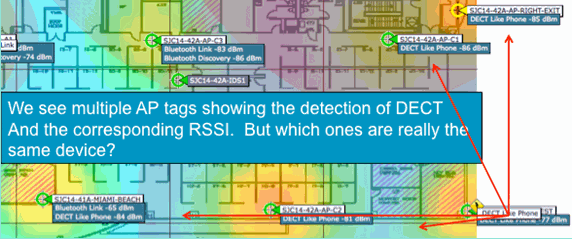
In this graphic you can see several APs all reporting DECT, such as Phone energy. However, the APs in this graphic are actually reporting on the presence of two distinct DECT, such as Phone sources. Before the assignment of a PMAC and subsequent merging, there is only the device classification, which can be misleading. PMAC gives us a way to identify individual interference sources, even if they do not have any logical information that can be used such as an address.
Merging
There are several APs all reporting a similar device. For each reporting AP, the PMAC is assigned to the classified signal. The next step is to combine the PMACs that are likely the same source device to a single report for the system. This is what merging does, consolidating multiple reports to a single event.
Merging uses spatial proximity of the reporting APs. If there are six similar IDRs with five from APs on the same floor, and another one from a building a mile away, it is unlikely this is the same interferer. Once a proximity is established, a probability calculation is run to further match the distinct IDRs that belong and the result is assigned to a cluster. A cluster represents the record of that interference device and captures the individual APs that are reporting on it. Subsequent IDR reports or updates on the same device follow the same process and instead of creating a new cluster are matched to an existing one. In a cluster report, one AP is designated as the Cluster Center. This is the AP that hears the interference the loudest.
Figure 9: After the PMAC Merge - AP's hearing the same physical device are identified 
The merging algorithm runs on every CleanAir enabled WLC. A WLC performs the merge function for all IDRs from APs that are physically associated to it. All IDRs and resulting merged clusters are forwarded to an MSE, if it exists in the system. Systems with more than one WLC require an MSE to provide merging services. The MSE performs a more advanced merging function that seeks to merge clusters reported from different WLCs and extract location information to be reported to the WCS.
Why do we need an MSE to merge IDRs across multiple WLCs? Because a single WLC only knows the neighbors for the APs physically associated to it. RF Proximity cannot be determined for IDRs coming from APs located on different controllers unless you have a full system view. The MSE has this view.
How physical proximity is determined differs, depending on how you implement CleanAir as well.
-
For LMAP pervasive implementations, the APs all participate in Neighbor Discovery, so it is an easy matter to consult the RF neighbor list and determine spatial relationships for IDRs.
-
In an MMAP overlay model you do not have this information. MMAPs are passive devices and do not transmit neighbor messages. Therefore, establishing the spatial relationship of one MMAP to another MMAP has to be done using X and Y coordinates from a system map. In order to do this, you also need the MSE that knows about the system map and can provide merging functions.
More detail on the different modes of operation as well as practical deployment advice is covered in the deployment models section.
Deploying APs in mixed mode – LMAP CleanAir APs with an overlay of MMAP CleanAir APs is the best approach to high accuracy and total coverage. You can use the neighbor list created by the received neighbor messages for the MMAP as part of the merging information. In other words, if you have a PMAC from a LMAP AP and a PMAC from a MMAP, and the MMAP shows the LMAP AP as a neighbor, then the two can be merged with a high degree of confidence. This is not possible with CleanAir MMAPs deployed within legacy standard APs because those APs do not produce IDRs to compare with the merge process. The MSE and the X and Y references are still needed.
Non Wi-Fi Location Accuracy
Determining the location of a radio transmitter in theory is a fairly straightforward process. You sample the received signal from multiple locations and you triangulate based on the received signal strength. On a Wi-Fi network clients are located and Wi-Fi RFID tags with good results as long as there is a sufficient density of receivers and adequate signal to noise ratio. Wi-Fi clients and tags send probes on all supported channels regularly. This ensures that all APs within range hear the client or TAG regardless of the channel it is serving. This provides a lot of information to work with. We also know that the device (tag or client) subscribes to a specification that governs how it operates. Therefore, you can be certain that the device is using an omni-directional antenna and has a predictable initial transmit power. Wi-Fi devices also contain logical information that identifies it as a unique signal source (MAC address).
Note: There is no guarantee of accuracy for location of non- Wi-Fi devices. Accuracy can be quite good and useful. However, there are a lot of variables in the world of consumer electronics and unintentional electrical interference. Any expectation of accuracy that is derived from current Client or Tag location accuracy models does not apply to non- Wi-Fi location and CleanAir features.
Non Wi-Fi interference sources pose a special opportunity to get creative. For instance, what if the signal you are trying to locate is a narrow video signal (1 MHz) that is only affecting one channel? In 2.4 GHz this probably works fine because most organizations have sufficient density to ensure that at least three APs on the same channel will hear it. However, in 5 GHz this is more difficult since most non-Wi-Fi devices only operate in the 5.8 GHz band. If RRM has DCA enabled with country channels, the number of APs actually assigned in 5.8 GHz declines because its goal is to spread out channel re-use and make use of open spectrum. This sounds bad, but remember if you are not detecting it, then it is not interfering with anything. Therefore, is really not a problem from a standpoint of interference.
This is however an issue if your deployment concerns extend to security. In order to gain proper coverage you require some MMAP APs in addition to the LMAP APs to ensure full spectral coverage within the band. If your only concern is securing the operating space you are using, then you can also limit the channels available in DCA and force increased density in the channel ranges you wish to cover.
The RF parameters of non- Wi-Fi devices can and do vary widely. An estimate has to be made based on the type of device that is being detected. The starting RSSI of the signal source needs to be known for good accuracy. You can estimate this based on experience, but if the device has a directional antenna the calculations will be off. If the device runs on battery power and experiences voltage sags or peaks as it operates, this will change how the system sees it. A different manufacturer's implementation of a known product might not meet the expectations of the system. This will affect the calculations.
Fortunately, Cisco has some experience in this area, and non-Wi-Fi device location actually works quite well. The point that needs to be made is that the accuracy of a non- Wi-Fi device location has a lot of variables to consider, accuracy increases with power, duty cycle, and number of channels hearing the device. This is good news because higher power, higher duty cycle, devices that impact multiple channels is generally what is considered to be severe as far as interference to the network goes.
CleanAir Deployment Models and Guidelines
Cisco CleanAir APs, first and foremost, are access points. What this means is that there is nothing inherently different about deploying these APs over deploying any other currently shipping AP. What has changed is the introduction of CleanAir. This is a passive technology that does not impact the operation of the Wi-Fi network in any way, other than the noted mitigation strategies of ED-RRM and PDA. These are only available in a Greenfield installation and configured off by default. This section will deal with the sensitivity, density and the coverage requirements for good CleanAir functionality. These are not all that different from other established technology models such as a Voice, Video, or Location deployment.
Valid deployment models for CleanAir products and feature functionality.
Table 5: CleanAir Deployment Models vs Features| Feature | MMAP Overlay | LMAP In-Line | |
|---|---|---|---|
| AP Service | CleanAir | X | X |
| Monitoring (RRM, Rogue, WIPS, Location, etc) | X | X | |
| Client Traffic | X | ||
| Detect | Detect and Analyze RF signals | X | X |
| Classify | Classify Individual Interference sources with impact severity | X | X |
| Mitigate | Event Driven channel changes | X | |
| Persistent Device avoidance | X | ||
| Locate | Locate on map with zone of impact | X | |
| Troubleshoot Manage Visualize | Cisco Spectrum Expert Connect | X | X |
| WCS Integration | X | X |
CleanAir is a passive technology. All it does is hear things. Because an AP hears a lot farther than it can effectively talk this makes it a simple task to do a correct design in a Greenfield environment. Understanding how well CleanAir hears, and how classification and detection works, will give you the answers you need for any configuration of CleanAir.
CleanAir Detection Sensitivity
CleanAir depends on detection. The detection sensitivity is more generous than Wi-Fi throughput requirements with a requirement of 10 dB SNR for all classifiers, and many operable down to 5 dB. In most conceivable deployments where coverage is pervasive, there should not be any issues in hearing and detecting interference within the network infrastructure.
How this breaks down is simple. In a network where the average AP power is at or between 5-11 dBm (power levels 3-5) then a class 3 (1 mW/0 dBm) Bluetooth device should be detected down to -85 dBm. Raising the noise floor above this level creates a slight degradation in detection dB for dB. For design purposes it is worth adding a buffer zone by setting the minimum design goal to say -80. This will provide sufficient overlap in most conceivable situations.
Note: Bluetooth is a good classifier to design for because it represents the bottom end power wise in devices you would be looking for. Anything lower generally does not even register on a Wi-Fi network. It is also handy (and readily available) to test with because it is a frequency hopper and will be seen by every AP, regardless of mode or channel in 2.4 GHz.
It is important to understand your interference source. For instance Bluetooth. Here are multiple flavors of this in the market presently and the radios and specification have continued to evolve as most technologies do over time. A Bluetooth headset that you would use for your cell phone is most likely a class3 or class2 device. This operates on low power and makes ample use of adaptive power profiles, which extends battery life and reduces interference.
A Bluetooth headset will transmit frequently on paging (Discovery mode) until associated. Then it will go dormant until needed in order to conserve power. CleanAir will only detect an active BT transmission. No RF, then nothing to detect. Therefore, if you are going to test with something, make sure it is transmitting. Play some music across it, but force it to transmit. Spectrum Expert Connect is a handy way to verify if something is, or is not transmitting and will end a lot of potential confusion.
Greenfield Deployment
CleanAir was designed to compliment what is largely considered a normal density implementation. This definition of Normal continues to evolve. For instance, just five years ago 300 APs on the same system was considered a large implementation. In a lot of the world – it still is. Numbers of 3,000-5,000 APs with many hundreds of them sharing direct knowledge through RF propagation are routinely seen.
What is important to understand is:
-
CleanAir LMAP supports the assigned channel only.
-
Band Coverage is implemented by ensuring that channels are covered.
-
The CleanAir AP can hear very well, and the active cell boundary is not the limit.
-
For Location solutions, the RSSI cutoff value is -75 dBm.
-
A minimum of three quality measurements is required for Location Resolution.
In most deployments it is hard to image a coverage area that will not have at least three APs within ear shot on the same channel in 2.4 GHz. If there are not, then location resolution suffers. Add a Monitor Mode AP and use the guidelines. Remember that the location cutoff is -75 dBm corrects this because an MMAP listens to all channels.
In locations where there is minimal density location resolution is likely not supported. But, you are protecting the active user channel extremely well. Also in such an area, you are generally not talking about a lot of space so locating an interference source does not pose the same problem as a multifloor dwelling.
Deployment considerations come down to planning the network for desired capacity, and ensuring that you have the correct components and network paths in place to support CleanAir functions. RF proximity and the importance of RF Neighbor Relations cannot be understated. Make sure to understand PMAC and the merging process well. If a network does not have a good RF design, the neighbor relations is generally affected. This affects CleanAir performance.
MMAP Overlay Deployment
If you plan to install CleanAir MMAPs as an overlay to an existing network there are some limitations you need to keep in mind. CleanAir 7.0 software is supported on all of Cisco's shipping controllers. Each model controller supports the maximum rated AP capacity with CleanAir LMAPs. There are limits in the number of MMAPs that can be supported. The maximum number of MMAPs is a function of memory. The controller must store AQ details for each monitored channel. An LMAP requires two channels storage of AQ information. However, an MMAP is passively scanning and the channel data can be 25 channels per AP. Use the table below for design guidance. Always refer to the current release documentation for current information by release.
Table 6: MMAP limits on WLCs| Controller | Max # of APs | Clusters | Device Records | Supported CleanAir MMAPs |
|---|---|---|---|---|
| 2100 | 25 | 75 | 300 | 6 |
| 2504 | 50 | 150 | 600 | 50 |
| WLCM | 25 | 75 | 300 | 6 |
| 4400 | 150 | 75 | 300 | 25 |
| WISM-1 | 300 | 1500 | 7000 | 50 |
| WISM-2 | 1000 | 5000 | 20000 | 1000 |
| 5508 | 500 | 2500 | 10000 | 500 |
Note: The numbers quoted for clusters (merged interference reports) and device records (individual IDR Reports before merging) are generous and highly unlikely to be exceeded in even the worst environments.
Suppose you simply want to deploy CleanAir as a sensor network to monitor and be alerted about non- Wi-Fi interference. How many Monitor Mode APs (MMAPs) do you need? The answer is generally 1-5 MMAP to LMAP radios. This of course depends on your coverage model. How much coverage do you get with an MMAP AP? Quite a bit actually since you are strictly listening. The coverage area is far greater than if you also had to communicate and transmit.
How about you visualize this on a map (you can use any planning tool available following a similar procedure as described below)? If you have WCS and already have the system maps built, then this is an easy exercise. Use the planning mode in theWCS maps.
-
Select Monitor > Maps.
-
Select the map you want to work with.
-
In the right hand corner of the WCS screen use the radio button to select Planning Mode, then click go.
Figure 10: WCS Planning mode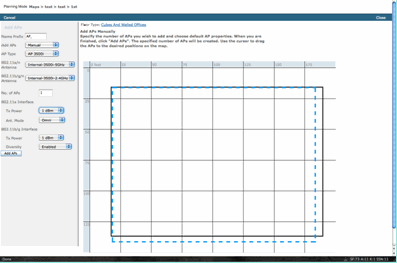
-
Select ADD APs.
-
Choose manual.
-
Select the AP type. Use the default antenna’s for internal or change to match your deployment: 1 AP TX Power for both 5 GHz and 2.4 GHz is 1 dBm –Class3 BT = 1 mW
-
Select ADD AP at the bottom.
Figure 11: Add AP in WCS planner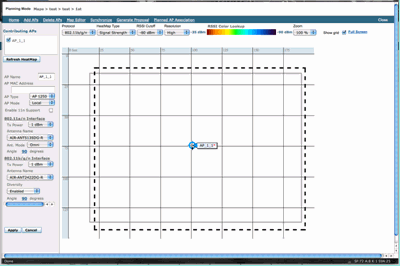
-
Move the AP to place on your map and select apply.
-
The heat map populates. Choose -80 dBm for the RSSI cutoff at the top of the map, the map re-draws if this is a change.
Here is what your CleanAir MMAP covers for 1 dBm out to -80 dBm. These results show a cell with a radius of 70 feet or 15,000 ft/2 of coverage.
Figure 12: Example Coverage of CleanAir MMAP using 1 dBm power and -80 dBm cutoff for coverage 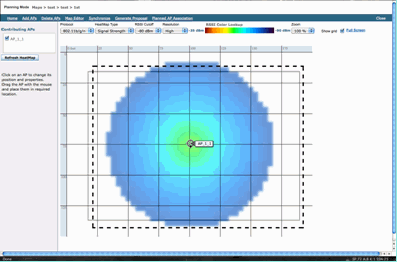
Note: Keep in mind that this is a predictive analysis. The accuracy of this analysis depends directly on the accuracy of the maps used to create it. It is beyond the scope of this document to provide a step by step instruction on how to edit maps within a WCS.
A good question you want to ask is “are these MMAPs going to be deployed strictly for CleanAir?” Or, are you going to take advantage of the many benefits that can be derived from the inclusion of monitoring APs in your network?
-
Adaptive wIPS
-
Rogue detection
-
Location Enhancement
All of these applications work with CleanAir enabled APs. For Adaptive wIPS, refer to the Cisco Adaptive wIPS Deployment Guide as the coverage recommendation of Adaptive wIPS are similar, but dependent on your goals and customers needs. For location services ensure that you review and understand the deployment requirements for your technology. All of these solutions are complimentary with CleanAir design goals.
Mixing CleanAir LMAP and legacy non CleanAir APs in the same installation
Why should I not mix CleanAir LMAP and Legacy LMAP APs in the same physical area? This question pertains to this use case:
“I currently have non CleanAir APs deployed (1130,1240, 1250, 1140) in local mode. I want to add just a few CleanAir APs to increase my coverage/density. Why can’t I just add some APs and get all the CleanAir features?”
This is not recommended because CleanAir LMAPs only monitor the serving channel and all CleanAir features rely on measurement density for quality. This installation would result in indiscriminate coverage of the band. You could well end up with a channel (or several) that has no CleanAir coverage at all. However with the base installation, you would be using all of the channels available. Assuming RRM is in control (recommended) it is entirely possible that all of the CleanAir APs could be assigned to the same channel in a normal installation. You spread them out to try to get the best spatial coverage possible, and that actually increases the odds of this.
You certainly can deploy a few CleanAir APs in with an existing installation. It is an AP and would function fine from a client and coverage standpoint. CleanAir functionality would be compromised and there is no way to really guarantee what the system would or would not tell you regarding your spectrum. There are far too many options in density and coverage which can be introduced to predict. What would work?
-
AQ would be valid for the reporting radio only. This means it is only relevant for the channel that it is serving, and this could change at any time.
-
Interference alerts and zone of impact would be valid. However, any location derived would be suspect. Best to leave that out all together and assume closest AP resolution.
-
Mitigation strategies would be ill-advised to operate because most of the APs in the deployment would not operate the same way.
-
You would be able to use the AP to look at spectrum from Spectrum Connect.
-
You would also have the option to temporarily switch to monitor mode at any time in order to perform a full scan of the environment.
While there are some benefits, it is important to understand the pitfalls and adjust expectations accordingly. It is not recommended, and issues arising from this type of deployment are not supportable based on this deployment model.
A better option if your budget does not support adding APs that do not serve client traffic (MMAP) is to collect enough CleanAir APs to deploy together in a single area. Any area that can be enclosed on a map area can contain a Greenfield CleanAir deployment with full feature support. The only caveat on this would be location. You still need enough density for location.
Operating CleanAir APs and legacy APs on the same controller
While it is not advisable to mix legacy APs and CleanAir APs operating in local mode in the same deployment area, what about running both on the same WLC? This is perfectly fine. Configurations for CleanAir are only applicable to APs that support CleanAir.
For instance, in the RRM configuration parameters for both 802.11a/n and 802.11b/g/n you see both ED-RRM and PDA configurations for RRM. One might consider that these would be bad if applied to an AP that was not a CleanAir capable AP. However, even though these features do interact with RRM, they can only be triggered by a CleanAir event and are tracked to the AP that triggers them. There is no chance that a non- CleanAir AP has these configurations applied to them, even though the configuration applies to the whole RF group.
This raises another important point. While CleanAir configurations on a 7.0 or later controller are effective for any CleanAir AP that attaches to that controller, ED-RRM and PDA are still RRM configurations.
CleanAir Features
Implementation of CleanAir draws on many of the architecture elements present within the CUWN. It has been designed to fortify and add functionality to every system component, and draws on information that is already present top enhance usability and tightly integrate the features.
This is the overall breakdown classified into license tiers. Notice that it is not necessary to have a WCS and or the MSE in the system to get good functionality from the system. The MIBs are available on the controller and are open to those who wish to integrate these features into an existing management system.
License Requirements
BASIC System
For a basic CleanAir system, the requirements are a CleanAir AP and a WLC that runs version 7.0 or later code. This provides both a CLI and the WLC GUI for customer interface and all CURRENT data is displayed, including interference sources reported by band and the SE connect feature. Security Alerts (Interference sources designated as a security concern) are merged before triggering the SNMP trap. As previously stated though, WLC merging is limited to the view of just the APs associated to that controller. There is no historical support of trend analysis supported directly from the WLC interfaces.
WCS
Adding a BASIC WCS and managing the controller adds trending support for AQ and alarms. You receive historical AQ reporting, threshold alerts through SNMP, RRM Dashboard support, Security alert support, and many other benefits including the client troubleshooting tool. What you do not get is Interference history and location. This is stored in the MSE.
Note: Adding an MSE to the WCS for location requires both a WCS plus license and Context Aware feature licenses for the MSE.
MSE
Adding an MSE and location solution to the network supports the historical IDR reporting as well as location based functions. In order to add this to an existing CUWN solution, you require a plus license on the WCS, and CAS or Context Aware licenses for the location targets.
1 Interferer = 1 CAS license
Interferers are managed through context aware and an interference that is tracked in the system is the same as a client for purposes of licensing. There are many options on how to manage these licenses and what they are used for.
On the WLC configuration you can limit which interference sources are tracked for location and reporting in the maps by selecting them from the controller > Wireless > 802.11b/a > CleanAir menu.
Interference devices selected there are reported, and choosing to ignore them keeps them out of the location system and MSE. This is completely separate from what is actually happening at the AP. All classifiers are always detected at the AP level. This determines what isdone with an IDR report. If you use this to limit reporting, then it is reasonably safe because all energy is still seen at the AP and is captured in AQ reports. AQ reports break out the contributing interference sources by category. If you eliminate a category here to conserve licensing, it is still reported as a contributing factor in AQ and you are alerted if you exceed a threshold.
Figure 13: WLC CleanAir configuration - reporting 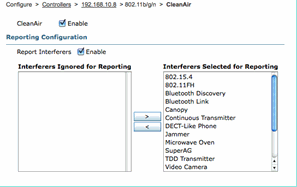
For instance, suppose the network you are installing is in a retail environment, and the map is cluttered with Bluetooth targets coming from headsets. You could eliminate this by de-selecting the Bluetooth Link. If at some time later Bluetooth became a problem, you would see this category rise in your AQ reporting and could re-enable at will. There is no interface reset required.
You also have the element manager under the MSE configurations: WCS > Mobility Services > Your MSE > Context Aware Service > administration > tracking Parameters.
Figure 14: MSE Context Aware element manager 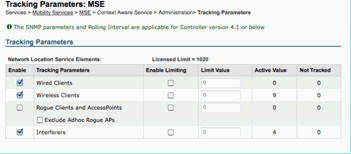
This gives the user complete control to assess and manage what licenses are used for and how they are divided among target categories.
CleanAir Features Matrix
Table 7: CleanAir Features matrix by CUWN Component| Cisco CleanAir Features by Device | 3500 WLC | WCS | MSE |
|---|---|---|---|
| Radio Troubleshooting | |||
| Air Quality and Interference by AP/radio on WLC GUI and CLI interfaces | X | ||
| AQ Threshold trap (per radio) from WLC | X | ||
| Interference Device trap (per Radio) from WLC | X | ||
| Rapid Update mode with current AQ charts and interferers for radio | X | ||
| CleanAir-enabled RRM | X | ||
| Spectrum Expert Connect mode | X | ||
| Spectrum MIB on WLC, open to 3rd Parties | X | ||
| Network Air Quality | |||
| WCS CleanAir Dashboard showing Graphic AQ history for all bands | X | ||
| AQ history tracking and reports | X | ||
| AQ Heatmap and aggregated AQ (per floor) on WCS floor map | X | ||
| Top N devices for AP shown as hover option on WCS floor map | X | ||
| CleanAir-enabled WCS RRM Dashboard | X | ||
| CleanAir-enabled WCS Security Dashboard and reports | X | ||
| CleanAir-enabled WCS Client Troubleshooting Tool | X | ||
| Location | |||
| WCS CleanAir Dashboard with Top N devices with severity | X | ||
| Merging interference devices across APs | X | ||
| Interference device history tracking with reports | X | ||
| Location of interferers – Zone of Impact | X | ||
Features Supported on the WLC
The minimum required configuration for Cisco CleanAir is the Cisco CleanAir AP, and a WLC which runs version 7.0. With these two components you can view all of the information provided by CleanAir APs. You also get the mitigation features available with the addition of CleanAir APs and the extensions provided through RRM. This information is viewable via the CLI or the GUI. The focus is on the GUI in this section for brevity.
WLC Air Quality and Interference Reports
On the WLC you can view current AQ and Interference reports from the GUI menu. In order to view interference reports, there must be interference active as the report is for current conditions only
Interference Device Report
Select Monitor > Cisco CleanAir > 802.11a/802.11b > Interference Devices.
All active interference devices being reported by CleanAir Radios are listed by Radio/AP reporting. Details include AP Name, Radio Slot ID, Interference Type, Affected Channels, Detected Time, Severity, Duty Cycle, RSSI, Device ID and Cluster ID.
Figure 15: Accessing WLC Interference Device Report 
Air Quality Report
Air Quality is reported by Radio/channel. In the example below, AP0022.bd18.87c0 is in monitor mode and displays AQ for channels 1-11.
Selecting the radio button at the end of any line allows the option of showing this information in the radio detail screen, which includes all information gathered by the CleanAir interface.
Figure 16: WLC Interference Device Report 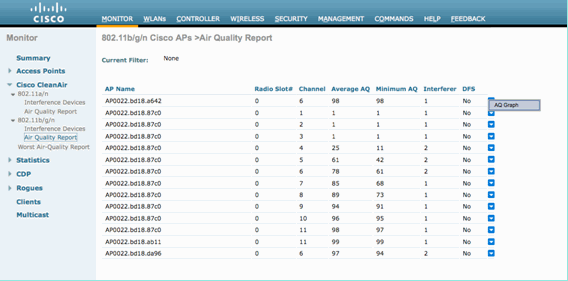
CleanAir Configuration – AQ and Device Traps control
CleanAir allows you to determine both the threshold and types of traps that you receive. Configuration is by band: Wireless > 802.11b/a > CleanAir.
Figure 17: WLC CleanAir configuration 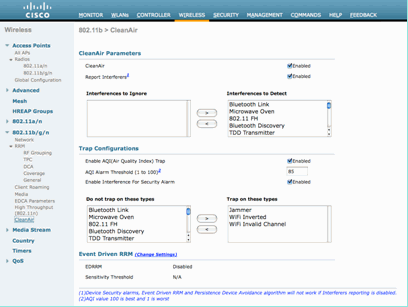
CleanAir Parameters
You can enable and disable CleanAir for the entire controller, suppress the reporting of all interferers, and determine which interferers to report or ignore. Selecting specific interference devices to ignore is a useful feature. For instance you might not want to track all Bluetooth headsets because they are relatively low impact and you have a lot of them. Choosing to ignore these devices simply prevents it from being reported. The RF that comes from the devices is still calculated into the total AQ for the spectrum.
Trap Configurations
Enable/Disable (on by default) the AirQuality trap.
AQI Alarm Threshold (1 to 100). When you set the AirQuality threshold for traps, this tells the WLC at what level you want to see a trap for AirQuality. The default threshold is 35, which is extremely high. For testing purposes setting this value to 85 or 90 proves more practical. In practice, the threshold is variable so you can tune it for your specific environment.
Enable Interference for Security Alarm. When you add the WLC to a WCS system, you can select this check box to treat interference device traps as security Alarm traps. This allows you to select the types of devices that appear in the WCS alarm summary panel as a security trap.
Do/do not trap device selection allows control over the types of devices that generates interference/security trap messages.
Lastly, the status of ED-RRM (Event Driven RRM) is displayed. Configuration for this feature is covered under the Event Driven RRM - EDRRM section later in this document.
Rapid Update Mode* - CleanAir Detail
Selecting Wireless > Access Points > Radios > 802.11a/b shows all of the 802.11b or 802.11a radios attached to the WLC.
Selecting the radio button at the end of the line allows you to see either the radio detail (traditional non CleanAir metrics of utilization, noise and the like) or CleanAir detail.
Figure 18: Accessing CleanAir Detail 
Selecting CleanAir produces a graphic (default) display of all CleanAir information pertaining to that radio. The information displayed is now in Rapid Update Mode by default. This means it is being refreshed every 30 seconds from the AP instead of the 15 minute averaging period displayed in system level messaging. From top to bottom, all interferers being detected by that radio along with the interference parameters of Type, Affected Channels, Detection Time, Severity, Duty Cycle, RSSI, Device ID, and Cluster ID.
Figure 19: CleanAir Radio Detail Page 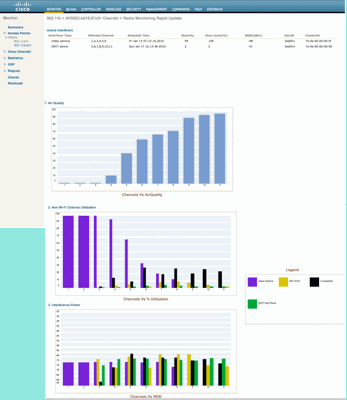
From this figure, the displayed charts include:
-
Air Quality by Channel
-
Non- Wi-Fi Channel Utilization
-
Interference Power
Air Quality by Channel displays the Air Quality for the channel that is being monitored.
Non Wi-Fi channel utilization shows the utilization that is directly attributable to the interference device being displayed. In other words, if you get rid of that device you regain that much spectrum for Wi-Fi applications to use.
There are two categories that are introduced here under Air Quality details:
-
Adjacent Off Channel Interference (AOCI)—This is interference from a Wi-Fi device that is not on the reporting operating channel, but is overlapping the channel space. For channel 6, the report would identify interference attributable to an AP on channels 4, 5, 7, and 8.
-
Unclassified—This is energy that is not attributable definitively to Wi-Fi or non- Wi-Fi sources. Fragments, collisions, things of this nature; frames that are mangled beyond recognition. In CleanAir guesses must not be made.
Interference power displays the receive power of the interferer at that AP. The CleanAir Detail page displays information for all monitored channels. The examples above are from a Monitor Mode (MMAP) AP. A local Mode AP would show the same detail, but only for the current served channel.
CleanAir Enabled RRM
There are two key Mitigation Features that are present with CleanAir. Both rely directly on information that can only be gathered by CleanAir.
Event Driven RRM
Event Driven RRM (ED-RRM) is a feature that allows an AP in distress to bypass normal RRM intervals and immediately change channels. A CleanAir AP is always monitoring AQ, and reports on this in 15 second intervals. AirQuality is a better metric than relying on normal Wi-Fi chip noise measurements because AirQuality only reports on Classified Interference devices. This makes AirQuality a reliable metric because it is known what is reported is not because of Wi-Fi energy (and hence not a transient normal spike).
For ED-RRM a channel change only occurs if the Air Quality is sufficiently impacted. Because Air Quality can only be affected by a classified known to CleanAir non- Wi-Fi source of interference (or an adjacent overlapping Wi-Fi channel), the impact is understood:
-
Not a Wi-Fi anomaly
-
A crisis condition at this AP
Crisis means that CCA is blocked. No clients or the AP can use the current channel.
Under these conditions RRM would change the channel on the next DCA pass. However, that could be a few minutes away (up to ten minutes depending on when the last run was performed), or the user could have changed the default interval and it could be longer (selected an anchor time and interval for longer DCA operation). ED-RRM reacts very quickly (30 seconds) so the users that change with the AP are likely unaware of the crisis that was close. 30 -50 seconds is not long enough to call a help desk. The users that do not are in no worse shape than they would have been in the first place. In all cases the interference source was identified and the AP change reason logs that source, and the users that have poor roaming receives an answer as to why this change was made.
The channel change is not random. It is picked based on device contention, thus it is an intelligent alternate choice. Once the channel is changed there is protection against triggering ED-RRM again in a hold down timer (60 seconds). The event channel is also marked in RRM DCA for the affected AP to prevent a return to the event channel (3 hours) in the event the interferer is an intermittent event and DCA does not see it immediately. In all cases the impact of the channel change is isolated to the affected AP.
Suppose a hacker or someone of ill intent fires up a 2.4 GHz jammer and all channels are blocked. First off, all the users within the radius are out of business anyway. However, suppose ED-RRM triggers on the all APs that can see it. All APs change channels once, then hold for 60 seconds. The condition would be met again, so another change would fire with the condition still being met after 60 seconds. There would be no channels left to change to and ED-RRM activity would stop.
A security alert would fire off on the jammer (default action) and you would need to provide a location (if with MSE) or nearest detecting AP. ED-RRM would log a major AQ event for all affected channels. The reason would be RF jammer. The event would be contained within the effected RF domain and well alerted.
Now the next question that is generally asked, "what if the hacker walks around with the jammer, would that not that cause all the APs to trigger ED-RRM?".
Sure you are going to trigger ED-RRM channel changes on all the APs that have ED-RRM enabled. However, as the jammer moves so does its effect and usability is restored as soon as it moves. It really does not matter because you have a hacker walking around with a jammer in their hand disconnecting users everywhere they go. This is a problem in itself. ED-RRM does not compound that issue. CleanAir on the other hand is also busy alerting, locating, and providing the location history of where they went and where they are. These are good things to know in such a case.
Configuration is accessed under Wireless > 802.11a/802.11b > RRM > DCA > Event Driven RRM.
Figure 20: Event Driven RRM Configuration 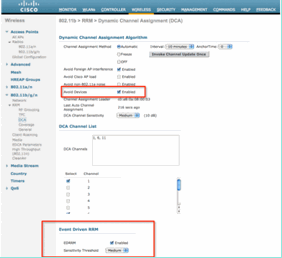
Note: Once ED-RRM is triggered on an AP/Channel the AP is prevented from returning to that channel for three hours. This is to prevent thrashing if the signal source is intermittent in nature.
Persistent Device Avoidance
Persistent Device Avoidance is another mitigation feature that is only possible with CleanAir APs. A device that operates periodically, such as a microwave oven, can introduce destructive levels of interference while it is operating. However, once it is no longer in use the air goes quiet again. Devices such as video cameras, outdoor bridge equipment, and microwave ovens are all examples of a type of device called persistent. These devices can operate continuously or periodically, but what they all have in common is that they do not move frequently.
RRM of course sees levels of RF noise on a given channel. If the device is operating long enough RRM even moves an active AP off the channel that has interference. However, once the device goes quiet, it is likely that the original channel presents as the better choice once again. Because each CleanAir AP is a spectrum sensor the center of the interference source can be evaluated and located. Also, you can understand which APs are affected by a device that you know is there, and potentially operates and disrupts the network when it does. Persistent Device Avoidance allows us to log the existence of such interference and remember that it is there so you do not place an AP back on the same channel. Once a Persistent Device has been identified it is “remembered” for seven days. If it is not seen again then it is cleared from the system. Each time you see it, the clock starts over.
Note: Persistent Device Avoidance information is remembered at the AP and Controller. Rebooting either re-sets the value.
Configuration for Persistent Device Avoidance is located at Wireless > 802.11a/802.11b > RRM > DCA > Avoid Devices.
In order to see if a radio has logged a Persistent Device you can view the status at Wireless > Access Points > Radios > 802.11a/b >.
Select a radio. At the end of the line click the radio button and select CleanAir RRM.
Figure 21: CleanAir Persistent Device Avoidance status 

Spectrum Expert Connect
CleanAir APs can all support the Spectrum Expert connect mode. This mode places the APs' radios into a dedicated scanning mode that can drive the Cisco Spectrum Expert application across a network. The Spectrum Expert console functions as if it had a local Spectrum Expert card installed.
Note: A routable network path must exist between the Spectrum Expert host and the target AP. Ports 37540 and 37550 must be open to connect. The Protocol is TCP, and the AP is listening.
Spectrum Expert connect mode is an enhanced monitor mode, and as such the AP does not serve clients while this mode is enabled. When you initiate the mode the AP reboots. When it re-joins the controller it is in Spectrum Connect mode and have generated a session key for use to connect the application. All that is required is Cisco Spectrum Expert 4.0 or later, and a routable network path between the application host and the target AP.
In order to initiate the connection, start by changing the mode on from Wireless > Access Points > All APs.
Figure 22: AP Mode Configuration 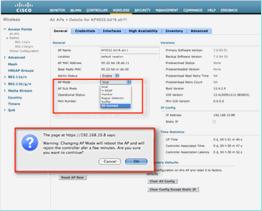
Go to AP Mode, and select SE-Connect. Save the configuration. You receive two warning screens: one advising that SE-connect mode is not a client-serving mode, the second warning that the AP is rebooted. Once you have changed the mode and saved the configuration navigate to the Monitor > Access Points screen. Monitor the AP status and reload.
Once the AP rejoins and reloads navigate back to the AP configuration screen, you need the NSI Key for the session that is displayed there. You can copy and paste the NSI key for the inclusion in launching Spectrum Expert.
Figure 23: NSI Key generated 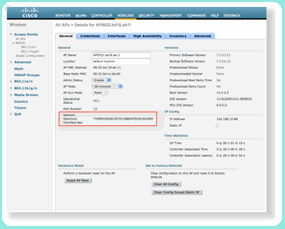
You need Cisco Spectrum Expert 4.0. Once installed, launch Spectrum Expert. On the initial splash screen you see a new option, Remote Sensor. Select Remote Sensor and paste in the NSI Key, and tell Spectrum Expert the IP address of the AP. Select which radio you wish to connect to and click OK.
Figure 24: Cisco Spectrum Expert Sensor connect screen 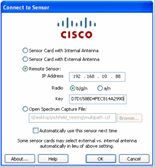
WCS Enabled CleanAir Features
When you add a WCS to the feature mix you get more display options for CleanAir information. The WLC can display current information, but with WCS the ability to track, monitor, alert, and report historical AirQuality levels for all CleanAir APs is added. Also, the ability to correlate CleanAir information to other award winning dashboards within WCS allows the user to fully understand their spectrum like never before.
WCS CleanAir Dashboard
The home page has several elements added and is customizable by the user. Any of the elements displayed on the home page can be re-arranged to user preferences. That is beyond the scope of this discussion, but keep it in mind as you use the system. What is being presented here is simply the default view. Selecting the CleanAir tab takes you to the CleanAir information available on the system.
Figure 25: WCS Home Page 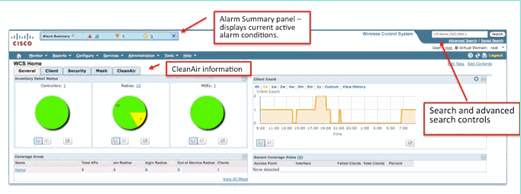
Note: The default settings for the page include a top 10 interferers report by band in the right hand corner. If you do not have an MSE, this report does not populate. You can edit this page and add or delete components to customize it to your liking.
Figure 26: WCS CleanAir Dashboard 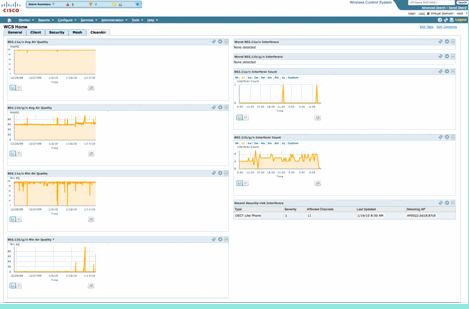
Charts displayed on this page display the running historical averages and minimums for CleanAir spectrum events. The average AQ number is for the entire system as displayed here. The minimum AQ chart for example tracks, by band, the minimum reported AQ received from any specific radio on the system in any 15 minute reporting period. You can use the charts to quickly identify historical minimums.
Figure 27: Minimum Air Quality history chart 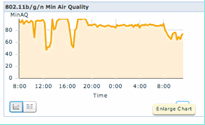
Selecting the Enlarge Chart button on the bottom right in any chart object produces a pop-up window with an enlarged view of the chart in question. A mouse hover in any chart produces a time and date stamp, and AQ level seen for the reporting period.
Figure 28: Enlarged Minimum Air Quality Chart 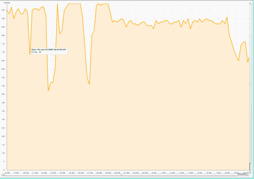
Knowledge of the date and time gives you the information that you need to search for the particular event, and gather additional details such as APs that registered the event and device types operating at that time.
AQ threshold alarms are reported to the WCS as performance alarms. You can also view them through the Alarm Summary panel at the top of the home page.
Figure 29: Alarm Summary panel 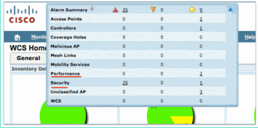
Either Advanced Search or simply selecting performance category from the alarm summary panel (provided you have a performance alarm) yields a list of performance alarms that contain details about a particular AQ event that is below the configured threshold.
Figure 30: Air Quality Threshold Alarms 
Selecting a particular event displays the detail related to that event including the date, time, and most importantly the reporting AP.
Figure 31: Performance Alarm Detail 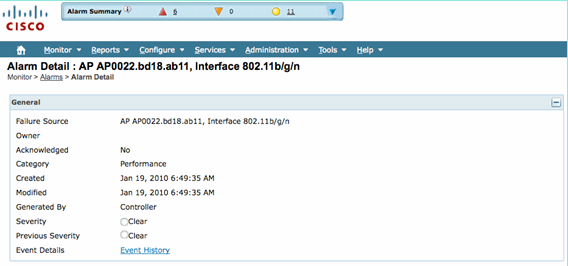
Configurations for Air Quality Thresholds is located under Configure > Controller, either from the WCS GUI or the Controller GUI. This can be used for all CleanAir Configurations. The best practice is to use the WCS once you have assigned a controller to it.
In order to generate performance alarms, you can set the AQ threshold for a low threshold such as 90 or even 95 (remember that AQ is good at 100 and bad at 0). You need some interference to trigger it such as a microwave oven. Remember to put a cup of water in it first and run it for 3-5 minutes.
Air Quality History Tracking Reports
AirQuality is tracked on each CleanAir AP at the radio level. The WCS enables historical reports for monitoring and trending AQ in your infrastructure. Reports can be accessed by navigating to the report launchpad. Select Reports > Report Launchpad.
CleanAir reports are at the top of the list. You can choose to look at Air Quality vs Time or Worst Air Quality APs. Both reports should be useful in tracking how Air Quality changes over time and identifying areas that require some attention.
Figure 32: Report Launchpad 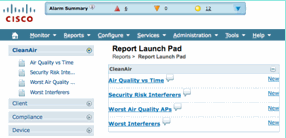
CleanAir Maps – Monitor > Maps
Selecting Monitor > Maps displays the maps configured for the system. Average and minimum AQ numbers are presented in hierarchical fashion corresponding to the container levels of campus, building, and floor. For instance, at the building level the Average/Minimum AQ is the average of all CleanAir APs contained in the building. The minimum is the lowest AQ reported by any single CleanAir AP. Looking at a floor level, the average AQ represents the average of all APs located on that floor and the minimum AQ is that of the single worst AQ from an AP on that floor.
Figure 33: Maps main page - showing Air Quality Hierarchy 
Selecting a map for a given floor provides detail relevant to the selected floor. There are a lot of ways that you can view the information on the map. For instance, you can change the AP tags to display CleanAir information such as CleanAir Status (shows which APs are capable), minimum or average AQ values, or Average and Minimum values. The values are relevant to the band selected.
Figure 34: AP Tags show lots of CleanAir information 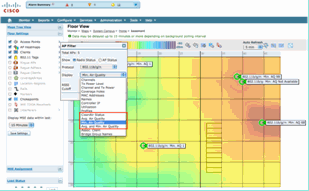
You can see the interferers that are being reported by each AP in several ways. Hover over the AP, select a radio, and select the show interferer’s hotlink. This produces a list of all Interference detected on that interface.
Figure 35: Viewing Interference Devices detected on an AP 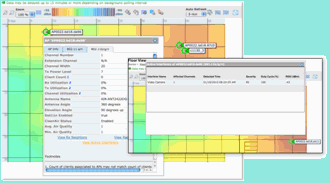
Another interesting way to visualize the impact of interference on the map is to select the interference tag. Without the MSE, you cannot locate interference on the map. However, you can select show interference labels, which are labels with the interferers currently being detected is applied to all CleanAir radios. You can customize this to limit the number of interferers displayed. Selecting the hotlink in the tab allows you to zoom in to the individual interferer details, and all interferers are displayed.
Note: CleanAir APs can track unlimited numbers of interferers. They only report on the top 10 ordered by severity, with preference being given to a security threat.
Figure 36: Interference Tag being displayed on all CleanAir APs 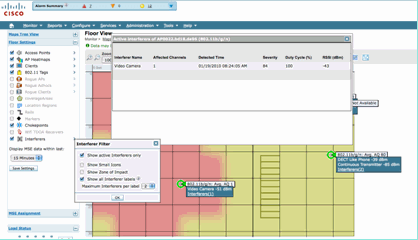
A useful way to visualize non- Wi-Fi interference and it’s effect is to view AQ as a heatmap on the map display. Do this by selecting heatmaps and selecting Air Quality. You can display the average or the minimum AQ. The map is rendered using the coverage patterns for each AP. Notice that the upper right corner of the map is white. No AQ is rendered there because the AP is in monitor mode and passive.
Figure 37: Air Quality Heat Map 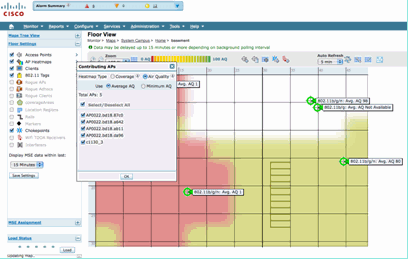
CleanAir Enabled RRM Dashboard
CleanAir allows you to see what is in our spectrum that is non- Wi-Fi. In other words, all those things that were considered just noise can now be broken down to understand if and how it is impacting your data network. RRM can and does mitigate noise by selecting a better channel. When this occurs the solution is generally better than it was, but you are still letting something that is not your data network occupy your spectrum. This reduces the overall spectrum available to your data and voice applications.
Wired and Wireless networks differ in that on a wired network if you need more bandwidth you can install more switches, or ports, or Internet connections. The signals are all contained within the wire and do not interfere with one another. In a wireless network, however, there is a finite amount of spectrum available. Once used, you cannot simply add more.
The CleanAir RRM Dashboard on the WCS allows you to understand what is going on in your spectrum by tracking non- Wi-Fi interference as well as Signal from our network, Interference from foreign networks and balancing all within the spectrum that is available. The solutions that RRM provides do not always seem optimal. However, there is often something that you cannot see which causes two APs to operate on the same channel.
The RRM Dashboard is what we use to track events that affect the balance of spectrum and provide answers as to why something is the way it is. CleanAir information being integrated to this dashboard is a big step forward to total control of the spectrum.
Figure 38: CleanAir RRM Channel Change reasons from RRM Dashboard 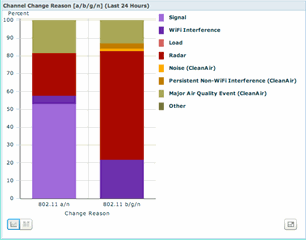
Channel Change reasons now include several new categories which refine the old Noise category (anything that is not Wi-Fi is recognized as noise by Cisco and all other competitors):
-
Noise (CleanAir) represents non- Wi-Fi energy in the spectrum as being a cause or a major contributor to a channel change.
-
Persistent Non-WiFi interference indicates that a persistent interferer has been detected and logged on an AP, and the AP changed channels to avoid this interference.
-
Major Air Quality Event is the reason for a channel change invoked by the Event Driven RRM feature.
-
Other – there is always energy present in the spectrum that is not demodulated as Wi-Fi, and cannot be classified as a known interference source. The reasons for this are many: the signals are too corrupted to separate, left over remnants from collisions is one possibility.
Knowing that non-WiFi interference is affecting your network is a big advantage. Having your network know and act on this information is a big plus. Some interference you are able to mitigate and remove, some you do not (in the case of a neighbor's emissions). Typically most organizations have interference at one level or another, and a lot of this interference is low level enough to not pose any real problems. However, the busier your network gets the more it needs an unaffected spectrum.
CleanAir Enabled Security Dashboard
Non-Wi-Fi devices can offer quite a challenge to wireless security. Having the ability to examine signals at the physical layer allows for much more granular security. Normal every day consumer wireless devices can and do bypass normal Wi-Fi security. Because all existing WIDs/WIPs applications rely on Wi-Fi chipsets for detection, there has been no way to accurately identify these threats until now.
For instance, it is possible to invert the data in a wireless signal so that it is 180 degrees out of phase from a normal Wi-Fi signal. Or, you could change the center frequency of the channel by a few kHz and as long as you had a client set to the same center frequency you would have a private channel that no other Wi-Fi chip could see or understand. All that is required is access to the HAL layer (many are available under GPL) for the chip and a little bit of skill. CleanAir is able to detect and understand what these signals are. In addition, CleanAir can detect and locate a PhyDOS attack such as RF Jamming.
You can configure CleanAir to report any device that is classified as a security threat. This allows the user to determine what should and should not be transmitting within their facility. There are three ways to view these events. The most convenient is through the Alarm Summary panel located at the top of the WCS home page.
A more detailed analysis can be gained by using the Security Dashboard tab on the main page. This is where all security related information on the system is displayed. CleanAir now has it’s own section within this dashboard allowing you to gain a full understanding of the security of your network from all wireless sources.
Figure 39: Security Dashboard with CleanAr integration 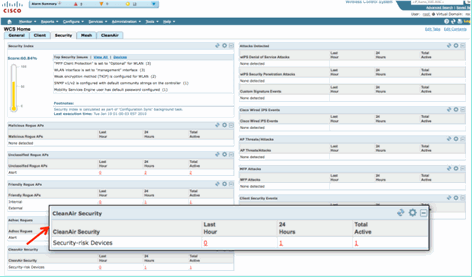
No matter where you view this information from, you have the detecting AP, the time and date of the event, and the current status to work with. With an MSE added you can run periodic reports on just CleanAir security events. Or, you can look at the location on the map and see the history of the event, even if it was moving.
CleanAir enabled Client Troubleshooting Dashboard
The client dashboard on the WCS home page is the one stop for all things for clients. Because interference often affects a client before it affects the AP (lower power, poorer antennas) a key thing to know when troubleshooting client performance issues is if non- Wi-Fi interference is a factor. CleanAir has been integrated to the Client Troubleshooting tool on the WCS for that reason.
Access the client information in any way you choose from the dashboard, either by searching on a MAC address or user. Once you have the client displayed, select the Client Troubleshooting tool Icon to launch the Client Troubleshooting Dashboard.
Figure 40: Client Troubleshooting Dashboard - with CleanAir 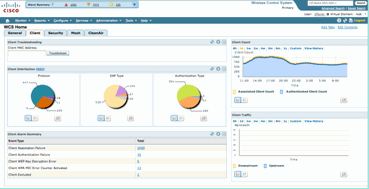
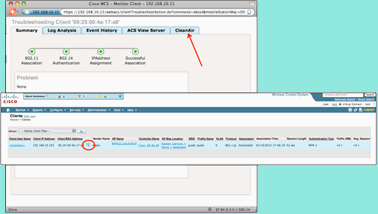
The client tools provide a wealth of information about the client’s status on the network. Select the CleanAir tab on the Monitor Client screen. If the AP that the client is currently associated to is reporting any interference, it is displayed here.
Figure 41: CleanAir tab from Client Troubleshooting tool 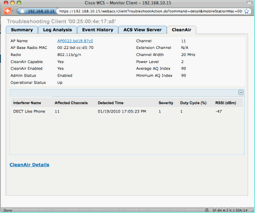
In this case, the interference being detected is a DECT like phone, and because the severity is only 1 (very low) it would be unlikely to cause a lot of trouble. However, a couple of Severity 1 devices can cause issues for a client. The Client Dashboard allows you to quickly rule out, as well as prove, issues in a logical fashion.
MSE Enabled CleanAir Features
The MSE adds a significant amount of information to CleanAir features. The MSE is responsible for all location calculations, which are much more intensive for non-Wi-Fi interference than for a Wi-Fi target. The reason for this is the range of conditions that location has to work with. There are a lot of non-Wi-Fi interferers in the world, and they all operate differently. Even among similar devices there can be great differences in signal strength or radiation patterns.
The MSE is also who manages merging of devices that span multiple controllers. If you recall, a WLC can merge devices that APs reports, which it is managing. But, interference can be detected that is present on APs that are not all on the same controller.
All of the features that MSE enhances are located only in the WCS. Once you have located an interference device on a map, there are several things that can be calculated and presented about how that interference interacts with your network.
WCS CleanAir Dashboard with MSE
Previously in this document, the CleanAir Dashboard and how the top 10 interferers per band would not be displayed without the MSE was discussed. With the MSE, these are now active because you have the interference device and location information from the MSE’s contribution.
Figure 42: MSE enabled CleanAir dashboard 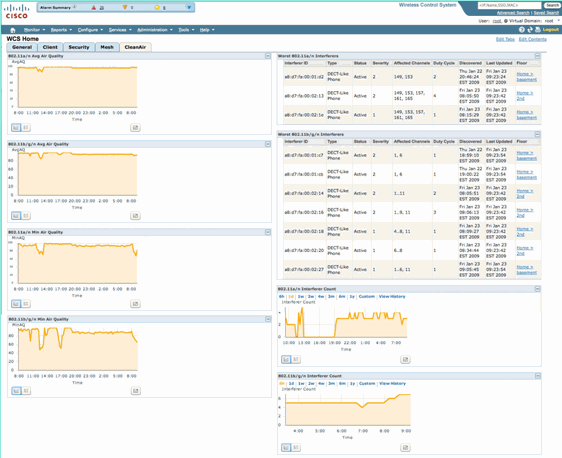
The upper right hand tables are now populated with the 10 most severe interference sources detected for each band: 802.11a/n and 802.11b/g/n.
Figure 43: Worst Interference for 802.11a/n 
The information displayed is similar to that of the interference report from a specific AP.
-
Interference ID – this is the database record for the interference on the MSE
-
Type – the type of interferer being detected
-
Status – currently only displays Active interferers
-
Severity – the severity calculated for the device
-
Affected Channels – the channels that the device is being seen affecting Discovered /last updated time stamps
-
Floor – the map location of the interference
If you choose the floor location, it hotlinks you to the map display of the interference source directly where much more information is possible.
Note: There is one other difference beyond having a location between information displayed about interferers over what you can see on the AP radio level directly. You might have noticed that there is no RSSI value for the interference. This is because the record as seen here is merged. It is the result of multiple APs reporting the device. The RSSI information is no longer relevant, nor would it be correct to display it because each AP sees the device at different signal strength.
WCS Maps with CleanAir device location
Choose the link at the end of the record in order to navigate directly to the map location of the interference device from the CleanAir dashboard.
Figure 44: Interference located on the map 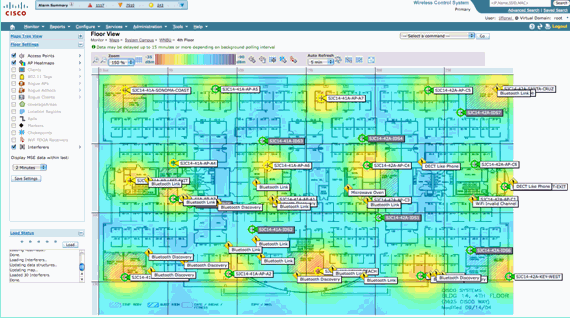
Now locating the interference source on the map allows us to understand its relationship to everything else on the map. In order to product specific information about the device itself (see figure 36), pass a mouse over the interference Icon. Notice the detecting APs, this is the list of APs that currently hears this device. The cluster Center is the AP that is closest to the device. The last line shows the Zone of Impact. This is the radius that the interference device would be suspected of being disruptive.
Figure 45: Interference Detail from Mouse Hover 
The Zone of Impact is only half the story though. It is important to remember that a device might have a long reach or large zone of impact. However, if the severity is low it might or might not matter at all. Zone of impact can be viewed on the map by selecting Interferers > Zone of Impact from the map display menu.
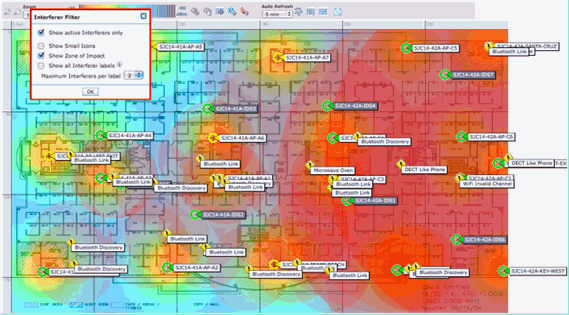
Now you can see the Zone of Impact (ZOI) on the map. ZOI is rendered as a circle around the detected device, and its opacity darkens with higher severity. This aids visualizing the impact of interference devices greatly. A small dark circle is much more of a concern than a large translucent circle. You can combine this information with any other map display or element that you choose.
Double-clicking on any interference icon takes you to the detail record for that interference.
Figure 46: MSE Interference Record 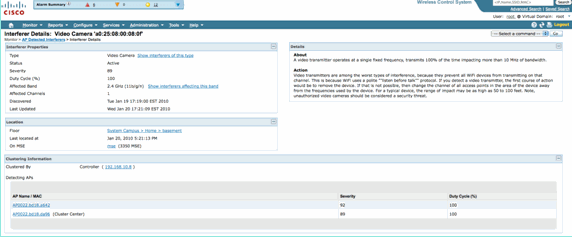
Interferer details include a lot of information about the type of interferer that is being detected. In the upper right hand corner is the help field which tells about what this device is and how this particular type of device affects your network.
Figure 47: Detailed Help 
Other workflow links within the detail record include:
-
Show Interferers of this Type – links to a filter to show other instances of this type of device
-
Show Interferers affecting this band – links to a filtered display of all same band interferers
-
Floor – links back to the map location for this device
-
MSE – links to the reporting MSE configuration
-
Clustered by – links to the controllers that performed the initial merge
-
Detecting APs – hot links to the reporting APs for use in viewing the interference directly from the AP details
Interference Location History
From the command window in the upper right corner of the record display you can select to view the location history of this interference device.
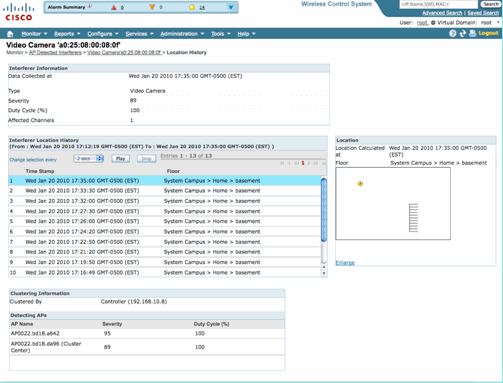
Location History shows the position and all relevant data such as time/date and detecting APs of an interference device. This can be extremely useful in understanding where the interference has been detected and how it has behaved or impacted your network. This information is part of the permanent record of the interference in the MSE database.
WCS – Monitor Interference
The contents of the MSE interferer database can be viewed directly from the WCS by selecting Monitor > Interference.
Figure 48: Monitor Interferers display 
The list is sorted by status by default. However, it can be sorted by any of the columns contained. You might notice that RSSI information on the interferer is missing. This is because these are merged records. Multiple APs hear a particular interference source. All of them hear it differently, so severity replaces RSSI. You can select any interference IDs in this list to display the same detailed record as was discussed above. Selecting the device type produces the help information that is contained within the record. Selecting the floor location takes you to the map location of the interference.
You can select Advanced Search and query the Interferers database directly, then filter the results by multiple criteria.
Figure 49: Advance Interference Search 
You can choose all interferers by ID, by Type (includes all classifiers), severity (range), Duty Cycle (range) or location (floor). You can select the time period, the status (Active/Inactive), select a specific band or even a channel. Save the search for future use if you like.
Summary
There are two basic types of information generated by the CleanAir components within the system: Interference Device Reports and AirQuality. The controller maintains the AQ database for all attached radios and is responsible for generating threshold traps based on the user's configurable thresholds. The MSE manages Interference Device Reports and merges multiple reports arriving from controllers and APs that span controllers into a single event, and locates within the infrastructure. The WCS displays information collected and processed by different components within the CUWN CleanAir system. Individual information elements can be viewed from the individual components as raw data, and the WCS is used to consolidate and display a system wide view and provide automation and work flow.
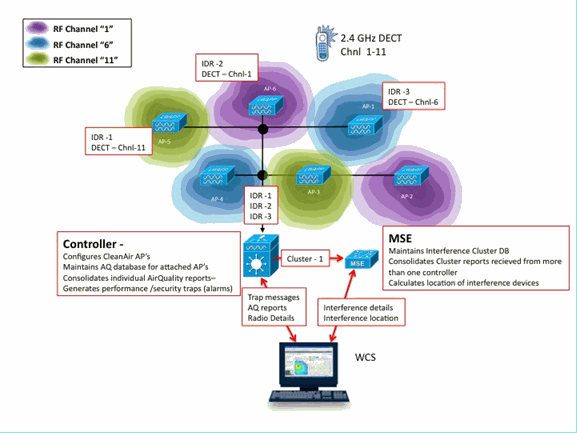
Installation and Validation
CleanAir installation is a straightforward process. Here are some tips on how to validate the functionality for an initial installation. If you upgrade a current system or install a new system, the best order of operations to follow is Controller code, WCS code, then add MSE code to the mix. Validation at each stage is recommended.
CleanAir Enabled on the AP
In order to enable CleanAir functionality in the system, you first need to enable this on the controller through Wireless > 802.11a/b > CleanAir.
Ensure CleanAir is enabled. This is disabled by default.

Once enabled it takes 15 minutes for normal system propagation of Air Quality information because the default reporting interval is 15 minutes. However, you can see the results instantly at the CleanAir detail level on the radio.
Monitor > Access Points > 802.11a/n or 802.11b/n
This displays all radios for a given band. CleanAir status is displayed in the CleanAir Admin Status and CleanAir Oper Status columns.

-
Admin Status relates to the radio status for CleanAir – should be enabled by default
-
Oper Status relates to the state of CleanAir for the system – this is what the enable command on the controller menu mentioned above controls
The operational status cannot be up if the admin status for the radio is disabled. Assuming that you have an Enable for Admin Status, and Up for Operational Status, you can select to view the CleanAir details for a given radio using the radio button located at the end of the row. The selection of CleanAir for details places the radio into Rapid Update mode and provides instant (30 second) updates to Air Quality. If you get Air Quality then CleanAir works.
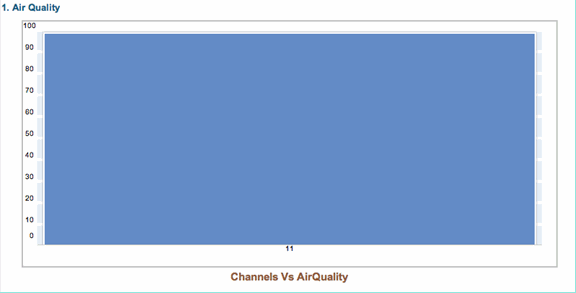
You might or might not see interferers at this point. This depends if you have any active.
CleanAir Enabled on WCS
As previously mentioned, you do not have Air Quality reports for up to 15 minutes displaying in the WCS > CleanAir tab after initially enabling CleanAir. However, Air Quality reporting should be enabled by default and can be used to validate the installation at this point. In the CleanAir tab you do not have interferers reported in the worst 802.11a/b categories without an MSE.
You can test an individually interference trap by designating an interference source that you can easily demonstrate as a security threat in the CleanAir configuration dialogue: Configure > controllers > 802.11a/b > CleanAir.
Figure 50: CleanAir configuration - Security Alarm 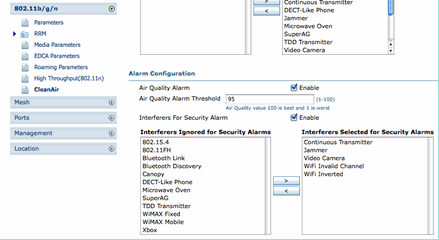
Adding an interference source for a Security Alarm causes the controller to send a trap message on discovery. This is reflected in the CleanAir tab under the Recent Security-risk Interferers heading.

Without the MSE present you do not have any functionality for Monitor > Interference. This is driven purely by the MSE.
CleanAir Enabled MSE Installation and Validation
There is nothing particularly special about adding an MSE to the CUWN for CleanAir support. Once added, there are some specific configurations you need to make. Ensure that you have synchronized both the system maps and controller before you enable CleanAir tracking parameters.
On the WCS console, choose Services > Mobility Services > select your MSE > Context Aware Service > Administration > Tracking Parameters.
Choose Interferers to enable MSE interference tracking and reporting. Remember to save.
Figure 51: MSE Context Aware interference configuration 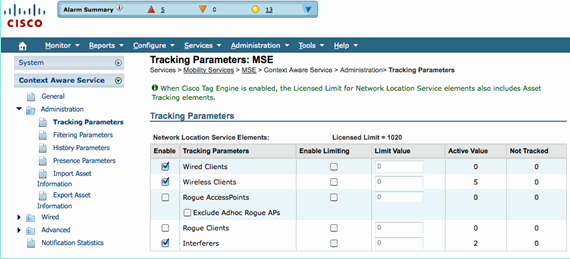
While in the Context Aware Services Administration menu, also visit History Parameters and enable Interferers here as well. Save your selection.
Figure 52: Context Aware History Tracking Parameters 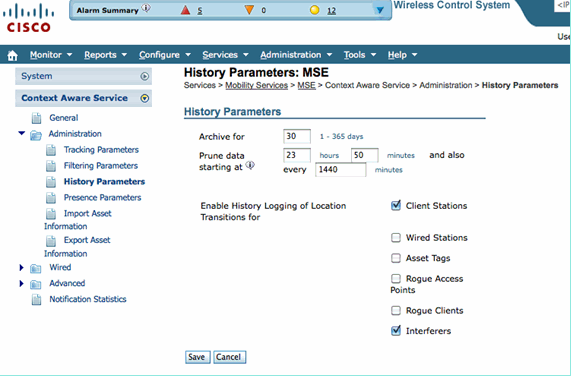
Enabling these configurations signals the synchronized controller to start the flow of CleanAir IDR information to the MSE and initiates the MSE tracking and convergence processes. It is possible to get the MSE and a controller out of synchronization from a CleanAir perspective. This can happen during an upgrade of controller code when interference sources from multiple controllers might get bounced (deactivated, and re-activated). Simply disabling these configurations and re-enabling with a save forces the MSE to re-register with all synchronized WLCs. Then, the WLCs send fresh data to the MSE, effectively re-starting the processes of merging and tracking of interference sources.
When you first add an MSE, you must synchronize the MSE with the network designs and WLCs that you wish for it to provide services for. Synchronization is heavily dependent on Time. You can validate synchronization and NMSP protocol functionality by going to Services > Synchronization services > Controllers.
Figure 53: Controller - MSE Synchronization Status 
You see the sync status for each WLC you are synchronized with. A particularly useful tool is located under the MSE column heading [NMSP Status].
Selecting this tool provides a wealth of information about the state of the NMSP protocol, and can give you information on why a particular synchronization is not occurring.
Figure 54: NMSP Protocol Status 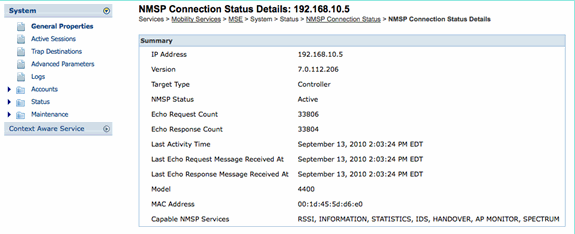
One of the more common issues experienced is that the time on the MSE and WLC are not the same. If this is the condition, it is displayed in this status screen. There are two cases:
-
WLC Time is after the MSE time—This synchronizes. But, there are potential errors when merging multiple WLCs information.
-
WLC time is before the MSE time—This does not allow synchronization because the events have not occurred yet according to the MSE’s clock.
A good practice is to use NTP services for all controllers and the MSE.
Once you have the MSE synchronized and CleanAir enabled, you should be able to see Interference sources in the CleanAir tab under Worst 802.11a/b interferers. You can also view them under Monitor > Interference, which is a direct display of the MSE interference database.
One last potential gotcha exists on the Monitor Interferers display. The initial page is filtered to only display interferers that have a severity greater than 5.
Figure 55: WCS - Monitor Interferers display 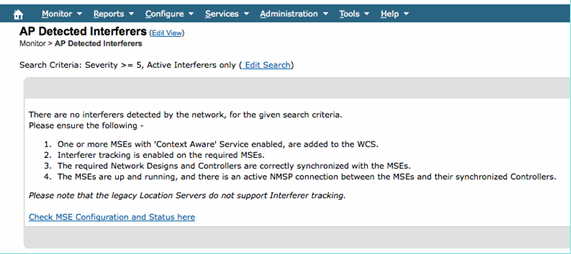
This is stated on the initial screen, but often goes overlooked when initializing and validating a new system. You can edit this to display all interference sources by simply making the severity value 0.
Glossary
There are many terms used in this document that are not familiar to a lot of users. Several of these terms come from Spectrum Analysis, some are not.
-
Resolution Band Width (RBW), the minimum RBW—The minimum band width that can be accurately displayed. SAgE2 cards (including the 3500) all have 156 KHz minimum RBW on a 20 MHz dwell, and 78 KHz on a 40 MHz dwell.
-
Dwell–A dwell is the amount of time the receiver spends listening to a particular frequency. All lightweight access points (LAPs) do off channel dwell’s in support of rogue detection and metrics gathering for RRM. Spectrum Analyzers do a series of dwells to cover a whole band with a receiver that only covers a portion of the band.
-
DSP—Digital Signal Processing
-
SAgE—Spectrum Analysis Engine
-
Duty Cycle—Duty Cycle is the active on time of a transmitter. If a transmitter is actively using a particular frequency, the only way another transmitter can use that frequency is to be louder than the first, and significantly louder at that. A SNR margin is needed to understand it.
-
Fast Fourier Transform (FFT)—For those interested in the math, google this. Essentially, FFT is used to quantify an analog signal and convert the output from the Time domain to the Frequency domain.
Related Information
Revision History
| Revision | Publish Date | Comments |
|---|---|---|
1.0 |
07-Feb-2014 |
Initial Release |
Contact Cisco
- Open a Support Case

- (Requires a Cisco Service Contract)


 Feedback