Configure Advanced gRPC Workflow with Telegraf, InfluxDB and Grafana on Catalyst 9800
Available Languages
Download Options
Bias-Free Language
The documentation set for this product strives to use bias-free language. For the purposes of this documentation set, bias-free is defined as language that does not imply discrimination based on age, disability, gender, racial identity, ethnic identity, sexual orientation, socioeconomic status, and intersectionality. Exceptions may be present in the documentation due to language that is hardcoded in the user interfaces of the product software, language used based on RFP documentation, or language that is used by a referenced third-party product. Learn more about how Cisco is using Inclusive Language.
Contents
Introduction
This document describes how to deploy the Telegraf, InfluxDB and Grafana (TIG) stack and interconnect it with the Catalyst 9800.
Prerequisites
This document demonstrates Catalyst 9800's programmatic interfaces capacities through a complex integration. This document aims at showing how these can be fully customizable based on any need and be daily time savers. The deployment showcased here relies on gRPC and presents telemetry configuration to make wireless data from the Catalyst 9800 available in any Telegraf, InfluxDB, Grafana (TIG) observability stack.
Requirements
Cisco recommends that you have knowledge of these topics:
- Catalyst Wireless 9800 configuration model.
- Network programmability and data models.
- TIG stack basics.
Components Used
The information in this document is based on these software and hardware versions:
- Catalyst 9800-CL (v. 17.12.03).
- Ubuntu (v. 22.04.03).
- InfluxDB (v. 1.06.07).
- Telegraf (v. 1.21.04).
- Grafana (v. 10.02.01).
The information in this document was created from the devices in a specific lab environment. All of the devices used in this document started with a cleared (default) configuration. If your network is live, ensure that you understand the potential impact of any command.
Configure
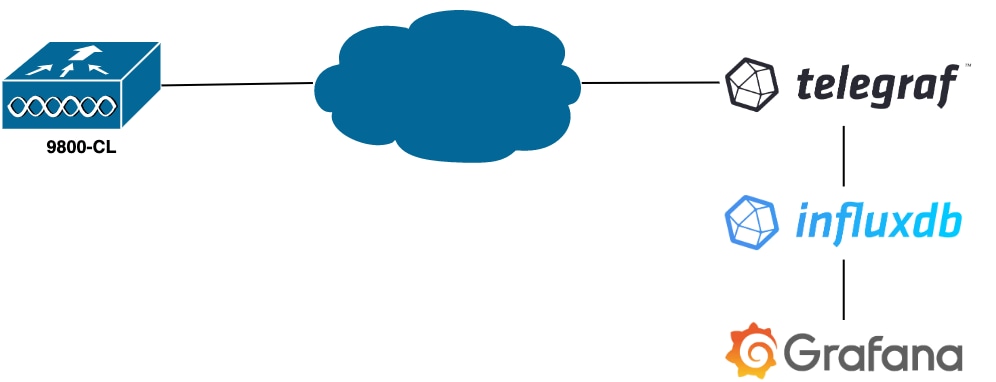
Network Diagram
Configurations
In this example, telemetry is configured on a 9800-CL using gRPC dial-out to push information on a Telegraf application storing them into an InfluxDB database. Here, two devices were used,
- An Ubuntu server hosting the whole TIG stack.
- A Catalyst 9800-CL.
This configuration guide does not focus on the whole deployment of these devices but rather on the configurations required on each application for the 9800 information to be sent, received and presented properly.
Step 1. Prepare the Database
Before going into the configuration part, make sure your Influx instance is running properly. This can be easily done using the systemctl status command, if you are using a Linux distribution.
admin@tig:~$ systemctl status influxd
● influxdb.service - InfluxDB is an open-source, distributed, time series database
     Loaded: loaded (/lib/systemd/system/influxdb.service; enabled; vendor preset: enabled)
     Active: active (running) since Wed 2023-06-14 13:06:18 UTC; 2 weeks 5 days ago
       Docs: https://docs.influxdata.com/influxdb/
   Main PID: 733 (influxd)
      Tasks: 15 (limit: 19180)
     Memory: 4.2G
        CPU: 1h 28min 47.366s
     CGroup: /system.slice/influxdb.service
             └─733 /usr/bin/influxd -config /etc/influxdb/influxdb.conf
For the example to work, Telegraf needs a database to store the metrics as well as a user to connect to this one. These can be easily created from the InfluxDB CLI, using these commands:
admin@tig:~$ influx
Connected to http://localhost:8086 version 1.8.10
InfluxDB shell version: 1.8.10
> create database TELEGRAF
> create user telegraf with password 'YOUR_PASSWORD'
The database now created, Telegraf can be configured to store metrics into it properly.
Step 2. Prepare Telegraf
Only two Telegraf configurations are interesting for this example to work. These can be made (as usual for applications running on Unix) from the /etc/telegraf/telegraf.conf configuration file.
The first one declares the output used by Telegraf. As previously stated, InfluxDB is used here and is configured in the output section of the telegraf.conf file as follow:
###############################################################################
#                            OUTPUT PLUGINS                                   #
###############################################################################
# Output Plugin InfluxDB
[[outputs.influxdb]]
## The full HTTP or UDP URL for your InfluxDB instance.
#   ##
#   ## Multiple URLs can be specified for a single cluster, only ONE of the
#   ## urls will be written to each interval.
  urls = [ "http://127.0.0.1:8086" ]
#   ## The target database for metrics; will be created as needed.
#   ## For UDP url endpoint database needs to be configured on server side.
  database = "TELEGRAF"
#   ## HTTP Basic Auth
  username = "telegraf"
  password = "YOUR_PASSWORD"
This instructs the Telegraf process to store the data it receives in the InfluxDB running on the same host on port 8086 and to use the database called “TELEGRAF” (as well as the credentials telegraf/YOUR_PASSWORD to access it).
If the first thing declared was the output format, the second one is, of course, the input one. To inform Telegraf that the data it receives comes from a Cisco device using telemetry, you can use the cisco_telemetry_mdt” input module. To configure this, you just need to add these lines in the /etc/telegraf/telegraf.conf file:
###############################################################################
#                             INPUT PLUGINS                                   #
###############################################################################
# # Cisco model-driven telemetry (MDT) input plugin for IOS XR, IOS XE and NX-OS platforms
[[inputs.cisco_telemetry_mdt]]
#  ## Telemetry transport can be "tcp" or "grpc".  TLS is only supported when
#  ## using the grpc transport.
    transport = "grpc"
#
#  ## Address and port to host telemetry listener
    service_address = ":57000"
#  ## Define aliases to map telemetry encoding paths to simple measurement names
[inputs.cisco_telemetry_mdt.aliases]
    ifstats = "ietf-interfaces:interfaces-state/interface/statistics"
This makes the Telegraf application running on the host (on default port 57000) able to decode the received data coming from the WLC.
Once the configuration saved, make sure to restart Telegraf to apply it to the service. Make sure also that the service restarted properly:
admin@tig:~$ sudo systemctl restart telegraf
admin@tig:~$ systemctl status telegraf.service
● telegraf.service - Telegraf
     Loaded: loaded (/lib/systemd/system/telegraf.service; enabled; vendor preset: enabled)
     Active: active (running) since Mon 2023-07-03 17:12:49 UTC; 2min 18s ago
       Docs: https://github.com/influxdata/telegraf
   Main PID: 110182 (telegraf)
      Tasks: 10 (limit: 19180)
     Memory: 47.6M
        CPU: 614ms
     CGroup: /system.slice/telegraf.service
             └─110182 /usr/bin/telegraf -config /etc/telegraf/telegraf.conf -config-directory /etc/telegraf/telegraf.d
Step 3. Determine Telemetry Subscription Containing the Desired Metric
As stated, on Cisco devices as on many others, metrics are organized according to the YANG model. The particular Cisco YANG models for each version of IOS XE (used on the 9800) can be found here, in particular the one for IOS XE Dublin 17.12.03 used in this example.
In this example, we focus on collecting CPU utilization metrics from the 9800-CL instance used. By inspecting the YANG model for Cisco IOS XE Dublin 17.12.03, one can determine which module contains the CPU utilization of the controller, and in particular for the last 5 seconds. These are part of the Cisco-IOS-XE-process-cpu-oper module, under the cpu-utilization grouping (leaf five-seconds).
Step 4. Enable NETCONF on the Controller
The gRPC dial out framework relies on NETCONF to work the same. Therefore, this feature must be enabled on the 9800 and this is achieved by running these commands:
WLC(config)#netconf ssh
WLC(config)#netconf-yang
Step 5. Configure the Telemetry Subscription on the Controller
Once the XPaths (a.k.a, XML Paths Language) of the metrics determined from the YANG model, a telemetry subscription can be easily configured from the 9800 CLI in order to start streaming these to the Telegraf instance configured in Step 2. This is done by executing these commands:
WLC(config)#telemetry ietf subscription 101
WLC(config-mdt-subs)#encoding encode-kvgpb
WLC(config-mdt-subs)#filter xpath /process-cpu-ios-xe-oper:cpu-usage/cpu-utilization/five-seconds
WLC(config-mdt-subs)#source-address 10.48.39.130
WLC(config-mdt-subs)#stream yang-push
WLC(config-mdt-subs)#update-policy periodic 100
WLC(config-mdt-subs)#receiver ip address 10.48.39.98 57000 protocol grpc-tcp
In this code block, first the telemetry subscription with identifier 101 is defined. The subscription Identifier can be any number between <0-2147483647> as long as it does not overlap with another subscription. For this subscription are configured, in this order:
- The encoding method used, which must be kvGPB when working with the gRPC transport protocol.
- The filter for the metrics sent by the subscription, being the XPath defining the metric interesting us (to know,
/process-cpu-ios-xe-oper:cpu-usage/cpu-utilization/five-seconds). - The source IP address used by the controller to send the metrics.
- The stream type used to communicate the metrics, in this case YANG Push IETF standard.
- The frequency used by the controller to send data to the subscriber in 100th of seconds. In this case, it was configured to send update periodically every second.
- The receiver IP address and port number as well as the protocol used for the communication between the controller and the subscriber. In this example, gRPC-TCPis used to send metric to host 10.48.39.98 on port 57000.
Step 6. Configure Grafana Data Source
Now that the controller starts sending data to Telegraf and that these are stored in the TELEGRAF InfluxDB database, it is time to configure Grafana to let it browse these metrics.
From your Grafana GUI, navigate to Home > Connections > Connect data and use the search bar to find the InfluxDB data source.
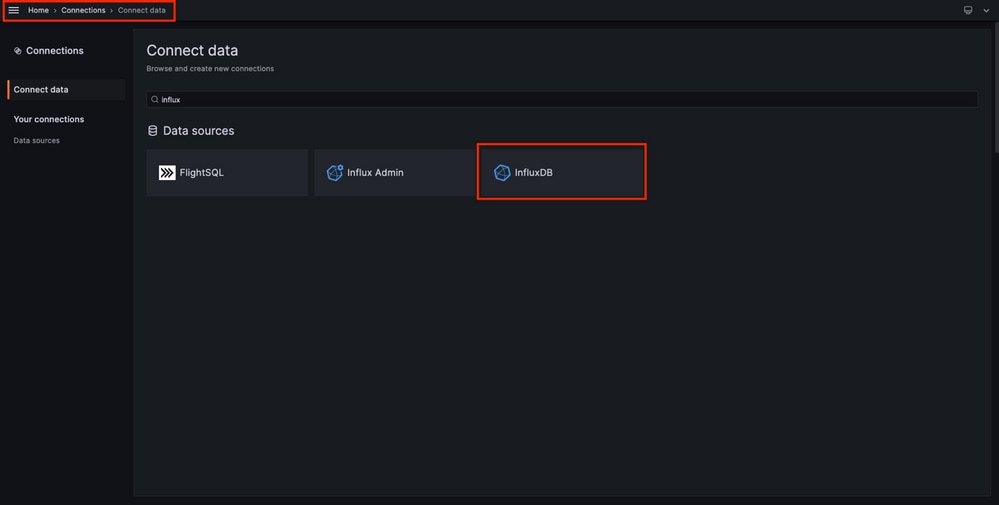
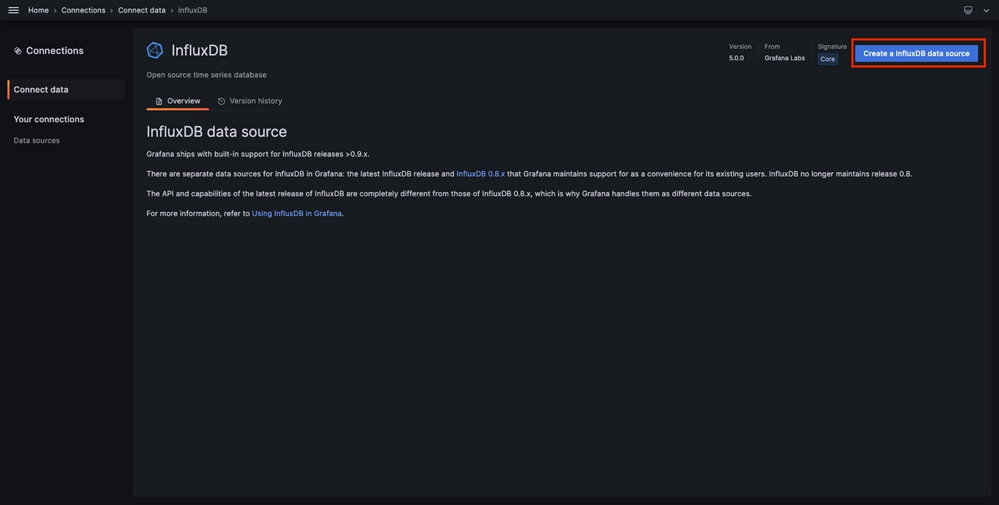
Select this data source type and use the "Create a InfluxDB data source" button to connect Grafana and the TELEGRAPH database created at Step 1.
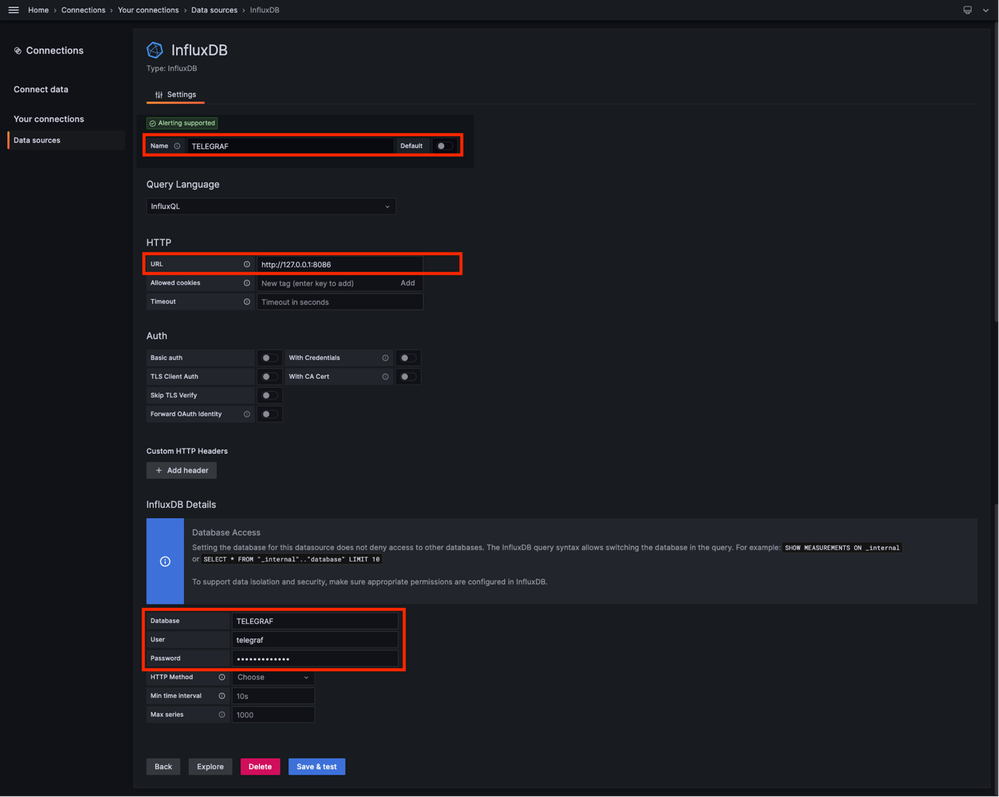
Fill the form appearing to the screen, especially provide:
- A name for the data source.
- The URL of the InfluxDB instance used.
- The database name used (in this example, "TELEGRAF").
- The credential of the user defined to access it (in this example, telegraf/YOUR_PASSWORD).
Step 7. Create a Dashboard
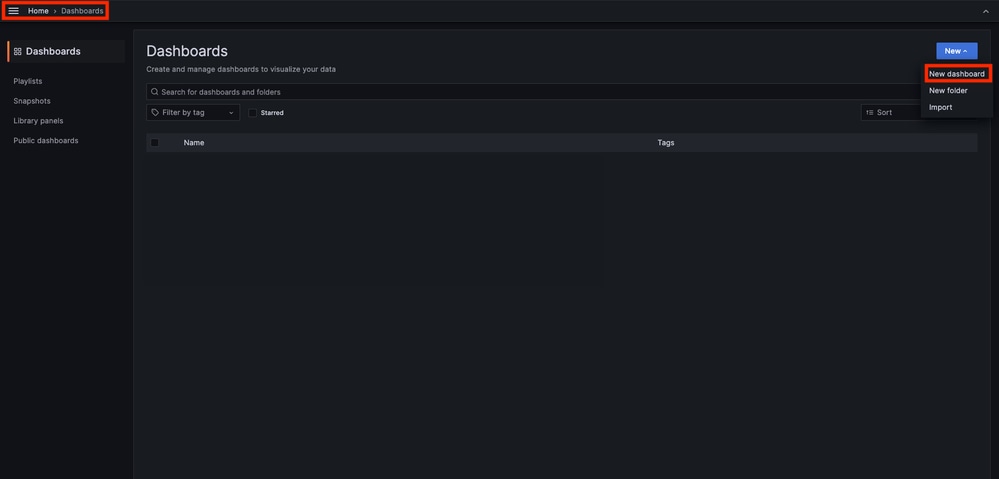
Grafana visualizations are organized into Dashboards. To create a dashboard containing the Catalyst 9800 metrics visualizations, navigate to Home > Dashboards and use the "New dashboard" button
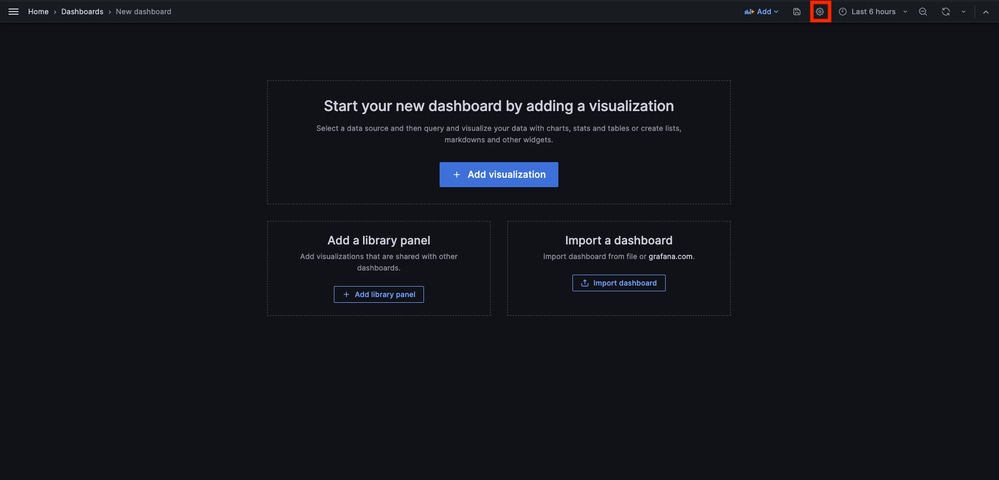
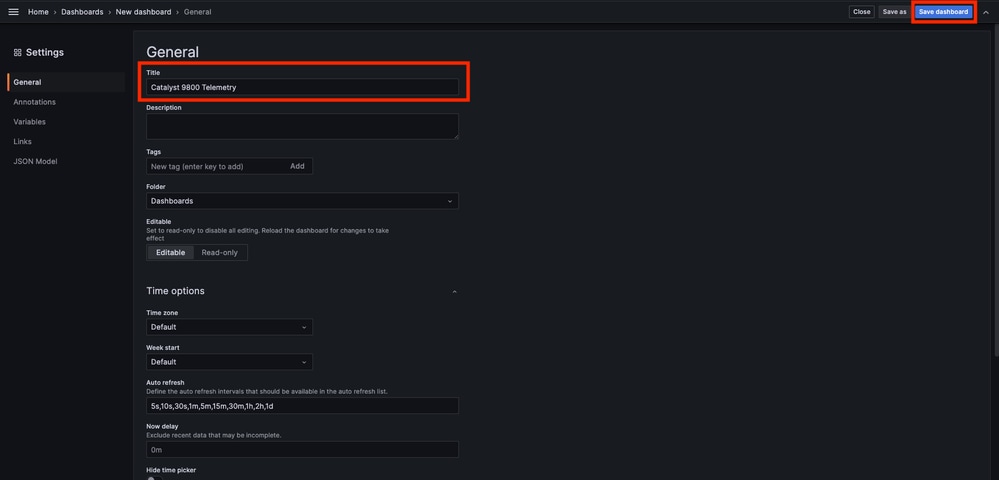
This opens the new dashboard created. Click on the gear icons to access the dashboard parameter and change its name. In the example, "Catalyst 9800 Telemetry" is used. Once this performed, use the "Save dashboard" button to save your dashboard.
Step 8. Add a Visualization to the Dashboard
Now that data are sent, received and stored properly and that Grafana has access to this storage location, it is time to create a visualization for them.
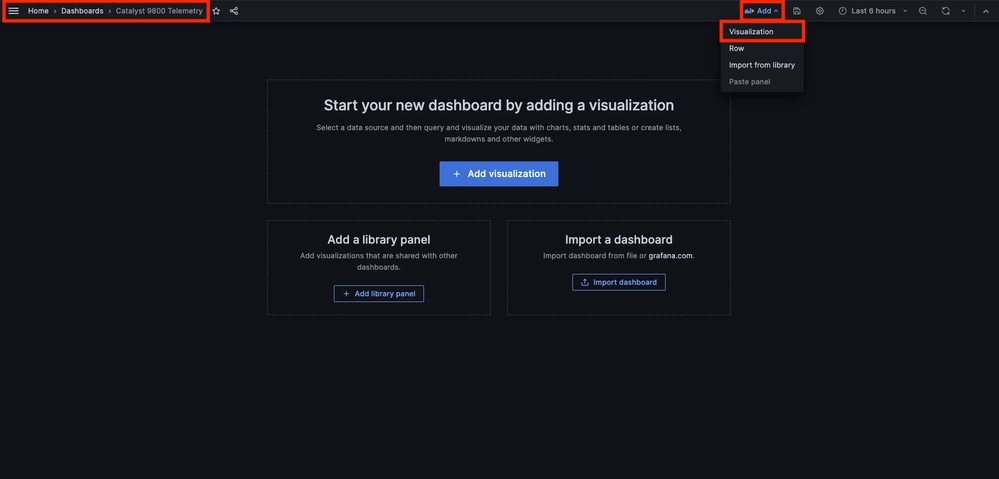
From any of your Grafana dashboard, use the “Add” button and select “Visualization" from the menu appearing to create a visualization of your metrics.
This opens the Edit panel of the created visualization:
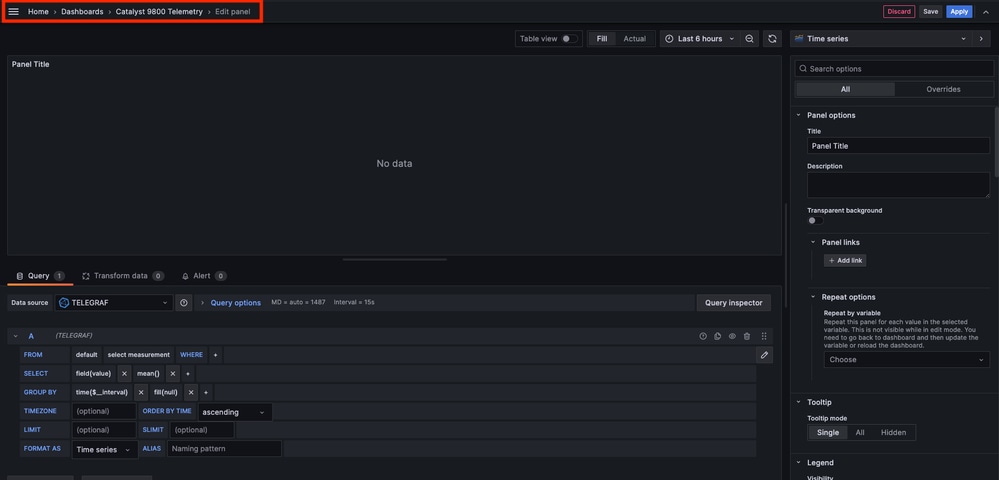
From this panel, select
- The name of the data source you created in Step 6, TELEGRAF in this example.
- The measurement (schema) containing the data you want to visualize, "Cisco-IOS-XE-process-cpu-oper:cpu-usage/cpu-utilization" in this example.
- The field from the database representing the metrics you want to visualize, “five_seconds” in this example.
- The title of the visualization, “CPU Utilisation 9800-CL” in this example.
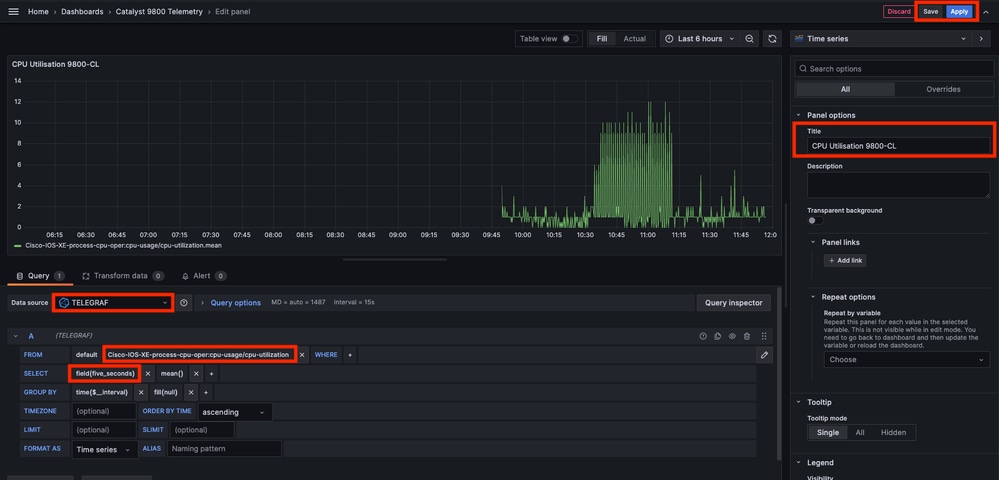
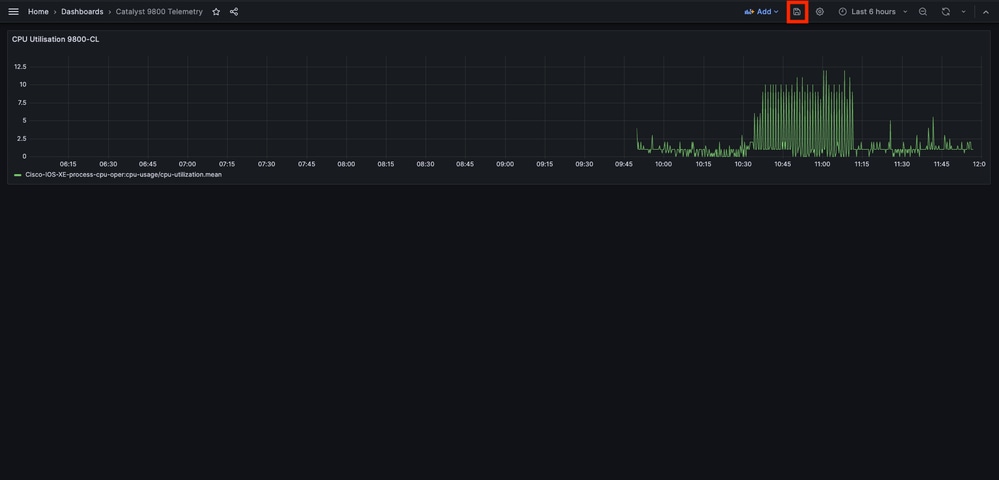
Once the "Save/Apply" button from the previous figure pressed, the visualization showing the CPU usage of the Catalyst 9800 controller over time is added to the dashboard. The changes made to the dashboard can be saved by using the floppy disk icon button.
Verify
WLC Running Configuration
Building configuration...
Current configuration : 112215 bytes
!
! Last configuration change at 14:28:36 UTC Thu May 23 2024 by admin
! NVRAM config last updated at 14:28:23 UTC Thu May 23 2024 by admin
!
version 17.12
[...]
aaa new-model
!
!
aaa authentication login default local
aaa authentication login local-auth local
aaa authentication dot1x default group radius
aaa authorization exec default local
aaa authorization network default group radius
[...]
vlan internal allocation policy ascending
!
vlan 39
!
vlan 1413
 name VLAN_1413
!
!
interface GigabitEthernet1
 switchport access vlan 1413
 negotiation auto
 no mop enabled
 no mop sysid
!
interface GigabitEthernet2
 switchport trunk allowed vlan 39,1413
 switchport mode trunk
 negotiation auto
 no mop enabled
 no mop sysid
!
interface Vlan1
 no ip address
 no ip proxy-arp
 no mop enabled
 no mop sysid
!
interface Vlan39
 ip address 10.48.39.130 255.255.255.0
 no ip proxy-arp
 no mop enabled
 no mop sysid
[...]
telemetry ietf subscription 101
 encoding encode-kvgpb
 filter xpath /process-cpu-ios-xe-oper:cpu-usage/cpu-utilization
 source-address 10.48.39.130
 stream yang-push
 update-policy periodic 1000
 receiver ip address 10.48.39.98 57000 protocol grpc-tcp
[...]
netconf-yang
Telegraf Configuration
# Configuration for telegraf agent
[agent]
  metric_buffer_limit = 10000
  collection_jitter = "0s"
  debug = true
  quiet = false
  flush_jitter = "0s"
  hostname = ""
  omit_hostname = false

###############################################################################
#                            OUTPUT PLUGINS                                   #
###############################################################################
# Configuration for sending metrics to InfluxDB
[[outputs.influxdb]]
  urls = ["http://127.0.0.1:8086"]
  database = "TELEGRAF"
  username = "telegraf"
  password = "Wireless123#"

###############################################################################
#                            INPUT PLUGINS                                    #
###############################################################################

###############################################################################
#                            SERVICE INPUT PLUGINS                            #
###############################################################################
# # Cisco model-driven telemetry (MDT) input plugin for IOS XR, IOS XE and NX-OS platforms
[[inputs.cisco_telemetry_mdt]]
  transport = "grpc"
  service_address = "10.48.39.98:57000"
 [inputs.cisco_telemetry_mdt.aliases]
    ifstats = "ietf-interfaces:interfaces-state/interface/statistics"
InfluxDB Configuration
### Welcome to the InfluxDB configuration file.
reporting-enabled = false
[meta]
  dir = "/var/lib/influxdb/meta"

[data]
  dir = "/var/lib/influxdb/data"
  wal-dir = "/var/lib/influxdb/wal"

[retention]
  enabled = true
  check-interval = "30m"
Grafana Configuration
#################################### Server ####################################
[server]
http_addr = 10.48.39.98
domain = 10.48.39.98
Troubleshoot
WLC One Stop-Shop Reflex
From the WLC side, the very first thing to verify is that processes related to programmatic interfaces are up and running.
#show platform software yang-management process
confd : Running
nesd : Running
syncfd : Running
ncsshd : Running               <-- NETCONF / gRPC Dial-Out
dmiauthd : Running             <-- For all of them, Device Managment Interface needs to be up.
nginx : Running                <-- RESTCONF
ndbmand : Running
pubd : Running
gnmib : Running                <-- gNMI
For NETCONF (used by gRPC dial-out), these command can also help checking the status of the process.
WLC#show netconf-yang status
netconf-yang: enabled
netconf-yang candidate-datastore: disabled
netconf-yang side-effect-sync: enabled
netconf-yang ssh port: 830
netconf-yang turbocli: disabled
netconf-yang ssh hostkey algorithms: rsa-sha2-256,rsa-sha2-512,ssh-rsa
netconf-yang ssh encryption algorithms: aes128-ctr,aes192-ctr,aes256-ctr,aes128-cbc,aes256-cbc
netconf-yang ssh MAC algorithms: hmac-sha2-256,hmac-sha2-512,hmac-sha1
netconf-yang ssh KEX algorithms: diffie-hellman-group14-sha1,diffie-hellman-group14-sha256,ecdh-sha2-nistp256,ecdh-sha2-nistp384,ecdh-sha2-nistp521,diffie-hellman-group16-sha512
Once the process status checked, another important check is the telemetry connection status between the Catalyst 9800 and the Telegraf receiver. It can be viewed using the “show telemetry connection all” command.
WLC#show telemetry connection all
Telemetry connections

Index Peer Address               Port  VRF Source Address             State      State Description
----- -------------------------- ----- --- -------------------------- ---------- --------------------
28851 10.48.39.98                57000 0   10.48.39.130               Active     Connection up
If the telemetry connection is up between the WLC and the receiver, one can also ensure that the subscriptions configured are valid using the show telemetry ietf subscription all brief command.
WLC#show telemetry ietf subscription all brief
ID         Type       State      State Description
101        Configured Valid      Subscription validated
The detailed version of this command, show telemetry ietf subscription all detail, provide more information about subscriptions and can help pointing out an issue from its configuration.
WLC#show telemetry ietf subscription all detail
Telemetry subscription detail:

  Subscription ID: 101
  Type: Configured
  State: Valid
  Stream: yang-push
  Filter:
    Filter type: xpath
    XPath: /process-cpu-ios-xe-oper:cpu-usage/cpu-utilization
  Update policy:
    Update Trigger: periodic
    Period: 1000
  Encoding: encode-kvgpb
  Source VRF:
  Source Address: 10.48.39.130
  Notes: Subscription validated

  Named Receivers:
    Name                                              Last State Change  State                 Explanation
    -------------------------------------------------------------------------------------------------------------------------------------------------------
    grpc-tcp://10.48.39.98:57000                      05/23/24 08:00:25  Connected
Confirm Network Reachability
The Catalyst 9800 controller sends gRPC data to the receiver port configured for each telemetry subscription.
WLC#show run | include receiver ip address
receiver ip address 10.48.39.98 57000 protocol grpc-tcp
To verify the network connectivity between the WLC and the receiver on this configured port, several tools are available.
From the WLC, one can use telnet on the configured receiver IP/port (here 10.48.39.98:57000) to verify that this one is open and reachable from the controller itself. If traffic is not being blocked, port must show up as open in the output:
WLC#telnet 10.48.39.98 57000
Trying 10.48.39.98, 57000 ... Open <-------
Alternatively, one can use Nmap from any host to ensure that the receiver is exposed properly on the configured port.
$ sudo nmap -sU -p 57000 10.48.39.98
Starting Nmap 7.95 ( https://nmap.org ) at 2024-05-17 13:12 CEST
Nmap scan report for air-1852e-i-1.cisco.com (10.48.39.98)
Host is up (0.020s latency).

PORT      STATE         SERVICE
57000/udp open|filtered unknown

Nmap done: 1 IP address (1 host up) scanned in 0.35 seconds
Logging and Debugging
2024/05/23 14:40:36.566486156 {pubd_R0-0}{2}: [mdt-ctrl] [30214]: (note): **** Event Entry: Configured legacy receiver creation/modification of subscription 101 receiver 'grpc-tcp://10.48.39.98:57000'
2024/05/23 14:40:36.566598609 {pubd_R0-0}{2}: [mdt-ctrl] [30214]: (note): Use count for named receiver 'grpc-tcp://10.48.39.98:57000' set to 46.
2024/05/23 14:40:36.566600301 {pubd_R0-0}{2}: [mdt-ctrl] [30214]: (note): {subscription receiver event='configuration created'} received for subscription 101 receiver 'grpc-tcp://10.48.39.98:57000'
[...]
2024/05/23 14:40:36.572402901 {pubd_R0-0}{2}: [pubd] [30214]: (info): Collated data collector filters for subscription 101.
2024/05/23 14:40:36.572405081 {pubd_R0-0}{2}: [pubd] [30214]: (debug): Creating periodic sensor for subscription 101.
2024/05/23 14:40:36.572670046 {pubd_R0-0}{2}: [pubd] [30214]: (info): Creating data collector type 'ei_do periodic' for subscription 101 using filter '/process-cpu-ios-xe-oper:cpu-usage/cpu-utilization'.
2024/05/23 14:40:36.572670761 {pubd_R0-0}{2}: [pubd] [30214]: (debug): Creating crimson data collector for filter '/process-cpu-ios-xe-oper:cpu-usage/cpu-utilization' (1 subfilters) with cap 0x0001.
2024/05/23 14:40:36.572671763 {pubd_R0-0}{2}: [pubd] [30214]: (debug): Need new data collector instance 0 for subfilter '/process-cpu-ios-xe-oper:cpu-usage/cpu-utilization'.
2024/05/23 14:40:36.572675434 {pubd_R0-0}{2}: [pubd] [30214]: (debug): Creating CRIMSON periodic data collector for filter '/process-cpu-ios-xe-oper:cpu-usage/cpu-utilization'.
2024/05/23 14:40:36.572688399 {pubd_R0-0}{2}: [pubd] [30214]: (debug): tree rooted at cpu-usage
2024/05/23 14:40:36.572715384 {pubd_R0-0}{2}: [pubd] [30214]: (debug): last container/list node 0
2024/05/23 14:40:36.572740734 {pubd_R0-0}{2}: [pubd] [30214]: (debug): 1 non leaf children to render from cpu-usage down
2024/05/23 14:40:36.573135594 {pubd_R0-0}{2}: [pubd] [30214]: (debug): URI:/cpu_usage;singleton_id=0 SINGLETON
2024/05/23 14:40:36.573147953 {pubd_R0-0}{2}: [pubd] [30214]: (debug): 0 non leaf children to render from cpu-utilization down
2024/05/23 14:40:36.573159482 {pubd_R0-0}{2}: [pubd] [30214]: (debug): Timer created for subscription 101, sensor 0x62551136f0e8
2024/05/23 14:40:36.573166451 {pubd_R0-0}{2}: [mdt-ctrl] [30214]: (note): {subscription receiver event='receiver connected'} received with peer (10.48.39.98:57000) for subscription 101 receiver 'grpc-tcp://10.48.39.98:57000'
2024/05/23 14:40:36.573197750 {pubd_R0-0}{2}: [pubd] [30214]: (debug): Starting batch from periodic collector 'ei_do periodic'.
2024/05/23 14:40:36.573198408 {pubd_R0-0}{2}: [pubd] [30214]: (debug): Building from the template
2024/05/23 14:40:36.575467870 {pubd_R0-0}{2}: [pubd] [30214]: (debug): Created dbal batch:133, for crimson subscription
2024/05/23 14:40:36.575470867 {pubd_R0-0}{2}: [pubd] [30214]: (debug): Done building from the template
2024/05/23 14:40:36.575481078 {pubd_R0-0}{2}: [pubd] [30214]: (debug): Executing batch:133 for periodic subscription
2024/05/23 14:40:36.575539723 {pubd_R0-0}{2}: [mdt-ctrl] [30214]: (note): {subscription id=101 receiver name='grpc-tcp://10.48.39.98:57000', state='connecting'} handling 'receiver connected' event with result 'e_mdt_rc_ok'
2024/05/23 14:40:36.575558274 {pubd_R0-0}{2}: [mdt-ctrl] [30214]: (note): {subscription receiver event='receiver connected'} subscription 101 receiver 'grpc-tcp://10.48.39.98:57000' changed
2024/05/23 14:40:36.577274757 {ndbmand_R0-0}{2}: [ndbmand] [30690]: (info): get__next_table reached the end of table for /services;serviceName=ewlc_oper/capwap_data@23
2024/05/23 14:40:36.577279206 {ndbmand_R0-0}{2}: [ndbmand] [30690]: (debug): Cleanup table for /services;serviceName=ewlc_oper/capwap_data cursor=0x57672da538b0
2024/05/23 14:40:36.577314397 {ndbmand_R0-0}{2}: [ndbmand] [30690]: (info): get__next_object cp=ewlc-oper-db exit return CONFD_OK
2024/05/23 14:40:36.577326609 {ndbmand_R0-0}{2}: [ndbmand] [30690]: (debug): yield ewlc-oper-db
2024/05/23 14:40:36.579099782 {iosrp_R0-0}{1}: [parser_cmd] [26295]: (note): id= A.B.C.D@vty0:user= cmd: 'receiver ip address 10.48.39.98 57000 protocol grpc-tcp' SUCCESS 2024/05/23 14:40:36.578 UTC
2024/05/23 14:40:36.580979429 {pubd_R0-0}{2}: [pubd] [30214]: (debug): Batch response received for crimson sensor, batch:133
2024/05/23 14:40:36.580988867 {pubd_R0-0}{2}: [pubd] [30214]: (debug): Green response: Result rc 0, Length: 360, num_records 1
2024/05/23 14:40:36.581175013 {pubd_R0-0}{2}: [pubd] [30214]: (debug): Green Resp cursor len 63
2024/05/23 14:40:36.581176173 {pubd_R0-0}{2}: [pubd] [30214]: (debug): There is no more data left to be retrieved from batch 133.
2024/05/23 14:40:36.581504331 {iosrp_R0-0}{2}: [parser_cmd] [24367]: (note): id= 10.227.65.133@vty1:user=admin cmd: 'receiver ip address 10.48.39.98 57000 protocol grpc-tcp' SUCCESS 2024/05/23 14:40:36.553 UTC
[...]
2024/05/23 14:40:37.173223406 {pubd_R0-0}{2}: [pubd] [30214]: (info): Added queue (wq: tc_inst 60293411, 101) to be monitored (mqid: 470)
2024/05/23 14:40:37.173226005 {pubd_R0-0}{2}: [pubd] [30214]: (debug): New subscription (subscription 101) monitoring object stored at id 19
2024/05/23 14:40:37.173226315 {pubd_R0-0}{2}: [pubd] [30214]: (note): Added subscription for monitoring (subscription 101, msid 19)
2024/05/23 14:40:37.173230769 {pubd_R0-0}{2}: [pubd] [30214]: (debug): Stats updated for Q (wq: tc_inst 60293411, 101), total_enqueue: 1
2024/05/23 14:40:37.173235969 {pubd_R0-0}{2}: [pubd] [30214]: (debug): (grpc::events) Processing event Q
2024/05/23 14:40:37.173241290 {pubd_R0-0}{2}: [pubd] [30214]: (debug): GRPC telemetry connector update data for subscription 101, period 1 (first: true)
2024/05/23 14:40:37.173257944 {pubd_R0-0}{2}: [pubd] [30214]: (debug): Encoding path is Cisco-IOS-XE-process-cpu-oper:cpu-usage/cpu-utilization
2024/05/23 14:40:37.173289128 {pubd_R0-0}{2}: [pubd] [30214]: (debug): Creating kvgpb encoder
2024/05/23 14:40:37.173307771 {pubd_R0-0}{2}: [pubd] [30214]: (debug): Creating combined parser
2024/05/23 14:40:37.173310050 {pubd_R0-0}{2}: [pubd] [30214]: (debug): Beginning MDT yang container walk for record 0
2024/05/23 14:40:37.173329761 {pubd_R0-0}{2}: [pubd] [30214]: (debug): Dispatching new container [data_node: name=Cisco-IOS-XE-process-cpu-oper:cpu-usage, type=container, parent=n/a, key=false]
2024/05/23 14:40:37.173334681 {pubd_R0-0}{2}: [pubd] [30214]: (debug): Container 'Cisco-IOS-XE-process-cpu-oper:cpu-usage' started successfully
2024/05/23 14:40:37.173340313 {pubd_R0-0}{2}: [pubd] [30214]: (debug): add data in progress
2024/05/23 14:40:37.173343079 {pubd_R0-0}{2}: [pubd] [30214]: (debug): GRPC telemetry connector continue data for subscription 101, period 1 (first: true)
2024/05/23 14:40:37.173345689 {pubd_R0-0}{2}: [pubd] [30214]: (debug): (grpc::events) Processing event Q
2024/05/23 14:40:37.173350431 {pubd_R0-0}{2}: [pubd] [30214]: (debug): Dispatching new container [data_node: name=cpu-utilization, type=container, parent=Cisco-IOS-XE-process-cpu-oper:cpu-usage, key=false]
2024/05/23 14:40:37.173353194 {pubd_R0-0}{2}: [pubd] [30214]: (debug): Deferred container cpu-utilization
2024/05/23 14:40:37.173355275 {pubd_R0-0}{2}: [pubd] [30214]: (debug): Container 'cpu-utilization' started successfully
2024/05/23 14:40:37.173380121 {pubd_R0-0}{2}: [pubd] [30214]: (debug): Dispatching new leaf [name=five-seconds, value=3, parent=cpu-utilization, key=false]
2024/05/23 14:40:37.173390655 {pubd_R0-0}{2}: [pubd] [30214]: (debug): Leaf 'five-seconds' added successfully
2024/05/23 14:40:37.173393529 {pubd_R0-0}{2}: [pubd] [30214]: (debug): add data in progress
2024/05/23 14:40:37.173395693 {pubd_R0-0}{2}: [pubd] [30214]: (debug): GRPC telemetry connector continue data for subscription 101, period 1 (first: true)
2024/05/23 14:40:37.173397974 {pubd_R0-0}{2}: [pubd] [30214]: (debug): (grpc::events) Processing event Q
2024/05/23 14:40:37.173406311 {pubd_R0-0}{2}: [pubd] [30214]: (debug): Dispatching new leaf [name=five-seconds-intr, value=0, parent=cpu-utilization, key=false]
2024/05/23 14:40:37.173408937 {pubd_R0-0}{2}: [pubd] [30214]: (debug): Leaf 'five-seconds-intr' added successfully
2024/05/23 14:40:37.173411575 {pubd_R0-0}{2}: [pubd] [30214]: (debug): add data in progress
[...]
Making Sure Metrics Reach the TIG Stack
From InfluxDB CLI
Just like any other database system, InfluxDB comes with a CLI which can be used to check metrics are received correctly by Telegraf and stored in the database defined. InfluxDB organize metrics, so called points, into measurements which are themselves organized as series. Some basic commands presented here can be used to verify the data scheme on InfluxDB side and make sure data reach this application.
First, you can check that the series, measurements and their structure (keys) are properly generated. These are automatically generated by Telegraf and InfluxDB based on the structure of the RPC used.

Note: Of course, this structure is fully customisable from the Telegraf and InfluxDB configurations. However, this goes behind the scope of this configuration guide.
$ influx
Connected to http://localhost:8086 version 1.6.7~rc0
InfluxDB shell version: 1.6.7~rc0
> USE TELEGRAF
Using database TELEGRAF
> SHOW SERIES
key
---
Cisco-IOS-XE-process-cpu-oper:cpu-usage/cpu-utilization,host=ubuntu-virtual-machine,path=Cisco-IOS-XE-process-cpu-oper:cpu-usage/cpu-utilization,source=WLC,subscription=101
> SHOW MEASUREMENTS
name: measurements
name
----
Cisco-IOS-XE-process-cpu-oper:cpu-usage/cpu-utilization
> SHOW FIELD KEYS FROM "Cisco-IOS-XE-process-cpu-oper:cpu-usage/cpu-utilization"
name: Cisco-IOS-XE-process-cpu-oper:cpu-usage/cpu-utilization
fieldKey                                               fieldType
--------                                               ---------
cpu_usage_processes/cpu_usage_process/avg_run_time     integer
cpu_usage_processes/cpu_usage_process/five_minutes     float
cpu_usage_processes/cpu_usage_process/five_seconds     float
cpu_usage_processes/cpu_usage_process/invocation_count integer
cpu_usage_processes/cpu_usage_process/name             string
cpu_usage_processes/cpu_usage_process/one_minute       float
cpu_usage_processes/cpu_usage_process/pid              integer
cpu_usage_processes/cpu_usage_process/total_run_time   integer
cpu_usage_processes/cpu_usage_process/tty              integer
five_minutes                                           integer
five_seconds                                           integer
five_seconds_intr                                      integer
one_minute                                             integer
Once the data structure clarified (integer, string, boolean, ...), one can get the number of data points being stored on these measurements based for a particular field.
# Get the number of points from "Cisco-IOS-XE-process-cpu-oper:cpu-usage/cpu-utilization" for the field "five_seconds".
> SELECT COUNT(five_seconds) FROM "Cisco-IOS-XE-process-cpu-oper:cpu-usage/cpu-utilization"
name: Cisco-IOS-XE-process-cpu-oper:cpu-usage/cpu-utilization
time count
---- -----
0    1170
> SELECT COUNT(five_seconds) FROM "Cisco-IOS-XE-process-cpu-oper:cpu-usage/cpu-utilization"
name: Cisco-IOS-XE-process-cpu-oper:cpu-usage/cpu-utilization
time count
---- -----
0    1171

# Fix timestamp display
> precision rfc3339
# Get the last point stored in "Cisco-IOS-XE-process-cpu-oper:cpu-usage/cpu-utilization" for the field "five_seconds".
> SELECT LAST(five_seconds) FROM "Cisco-IOS-XE-process-cpu-oper:cpu-usage/cpu-utilization"
name: Cisco-IOS-XE-process-cpu-oper:cpu-usage/cpu-utilization
time                    last
----                    ----
2024-05-23T13:18:53.51Z 0
> SELECT LAST(five_seconds) FROM "Cisco-IOS-XE-process-cpu-oper:cpu-usage/cpu-utilization"
name: Cisco-IOS-XE-process-cpu-oper:cpu-usage/cpu-utilization
time                     last
----                     ----
2024-05-23T13:19:03.589Z 2
If the number of points for a particular field and the timestamp for the last occurrence increase, it is good sign that the TIG stack receives and stores properly the data sent by the WLC.
From Telegraf
To verify that the Telegraf receiver actually gets some metrics from the controller and checks their format, you can redirect the Telegraf metrics to an output file on the host. This can be very handy when it comes to device interconnection troubleshooting. In order to achieve this, simply make use of the “file” output plugin from Telegraf, configurable from the /etc/telegraf/telegraf.conf.
# Send telegraf metrics to file(s)
[[outputs.file]]
#   ## Files to write to, "stdout" is a specially handled file.
   files = ["stdout", "/tmp/metrics.out", "other/path/to/the/file"]
#
#   ## Use batch serialization format instead of line based delimiting.  The
#   ## batch format allows for the production of non line based output formats and
#   ## may more efficiently encode metric groups.
#   # use_batch_format = false
#
#   ## The file will be rotated after the time interval specified.  When set
#   ## to 0 no time based rotation is performed.
#   # rotation_interval = "0d"
#
#   ## The logfile will be rotated when it becomes larger than the specified
#   ## size.  When set to 0 no size based rotation is performed.
#   # rotation_max_size = "0MB"
#
#   ## Maximum number of rotated archives to keep, any older logs are deleted.
#   ## If set to -1, no archives are removed.
#   # rotation_max_archives = 5
#
#   ## Data format to output.
#   ## Each data format has its own unique set of configuration options, read
#   ## more about them here:
#   ## https://github.com/influxdata/telegraf/blob/master/docs/DATA_FORMATS_OUTPUT.md
   data_format = "influx"
References
Revision History
| Revision | Publish Date | Comments |
|---|---|---|
1.0 |
10-Jun-2024 |
Initial Release |
Contributed by Cisco Engineers
- Guilian DeflandreCisco TAC
- Rasheed HamdanCisco TAC
Contact Cisco
- Open a Support Case

- (Requires a Cisco Service Contract)
 Feedback