Understand AVC on the Catalyst 9800 Wireless LAN Controller
Available Languages
Download Options
Bias-Free Language
The documentation set for this product strives to use bias-free language. For the purposes of this documentation set, bias-free is defined as language that does not imply discrimination based on age, disability, gender, racial identity, ethnic identity, sexual orientation, socioeconomic status, and intersectionality. Exceptions may be present in the documentation due to language that is hardcoded in the user interfaces of the product software, language used based on RFP documentation, or language that is used by a referenced third-party product. Learn more about how Cisco is using Inclusive Language.
Contents
Introduction
This document describes Application Visibility and Control (AVC) on a Cisco Catalyst 9800 WLC which enables precise management of application traffic.
Prerequisite
Cisco recommends that you have knowledge of these topics:
- Basic knowledge of Cisco WLC 9800.
- Basic knowledge of local and flex connect mode AP.
- The access points must be AVC capable. (Not applicable with Local Mode AP)
- For the control part of AVC (QoS) to work, the application visibility feature with FNF has to be configured.
Information about Application Visibility and Control (AVC)
Application Visibility and Control (AVC) is Cisco's leading approach for deep-packet inspection (DPI) technology in both wireless and wired networks. With AVC, you can perform real-time analysis and create policies to effectively reduce network congestion, minimize costly network link usage, and avoid unnecessary infrastructure upgrades. In short, AVC empowers users to achieve a whole new level of traffic recognition and shaping through Network Based Application Recognition (NBAR). NBAR packages running on the 9800 WLC are used for DPI and the results are reported using Flexible NetFlow (FNF).
In addition to visibility, AVC provides the capability to prioritize, block, or throttle different types of traffic. For instance, administrators can create policies that prioritize voice and video applications to ensure quality of service (QoS) or limit the bandwidth available to non-essential applications during peak business hours. It can also be integrated with other Cisco technologies, such as Cisco Identity Services Engine (ISE) for identity-based application policies and Cisco Catalyst Center for centralized management.
How AVC Works
AVC utilizes advanced technologies such as FNF and NBAR2 engine for DPI. By analyzing and identifying traffic flows using the NBAR2 engine, specific flows are marked with the recognized protocol or application. The controller collects all reports and presents them through show commands, Web UI, or additional NetFlow export messages to external NetFlow collectors like Prime.
Once Application Visibility is established, users can create control rules with policing mechanisms for clients by configuring Qualty of service (QOS).
 Working Mechanism of AVC
Network-Based Application Recognition (NBAR)
NBAR is a mechanism integrated on the 9800 WLC, which is used to perform DPI for identifying and classifying a wide variety of applications running over a network. It can recognize and classify a vast number of applications, including encrypted and dynamically port-mapped applications, which are often invisible to traditional packet inspection technologies.

Note: To leverage NBAR on the Catalyst 9800 WLC, it is necessary to enable and configure it correctly, often in conjunction with specific AVC profiles that define the appropriate actions to be taken based on the classification of the traffic.
NBAR continues to be periodically updated, and it is important to keep the WLC software up to date to ensure that the NBAR feature set remains current and effective.
A complete list of the protocols supported in the latest releases can be found at https://www.cisco.com/c/en/us/td/docs/ios-xml/ios/qos_nbar/prot_lib/config_library/nbar-prot-pack-library.html
Enable NBAR Protocol on Policy Profile
9800WLC#configure terminal
9800WLC(config)#wireless profile policy AVC_testing
9800WLC(config-wireless-policy)#ip nbar protocol-discovery
9800WLC(config-wireless-policy)#end

Note: % Policy profile needs to be disabled before performing this operation.
9800WLC#show wireless profile policy detailed AVC_testing | in NBAR
NBAR Protocol Discovery : Enabled
Upgrading NBAR on 9800 WLC
9800 WLC already has ~1500 recognizable applications. In the case where a new application is released, the protocol for the same will be updated in the latest NBAR which would be needed to be downloaded from the Software Download page for the specific 9800 model.
Via GUI
Navigate to Configuration > Services > Application Visibility. Click Upgrade Protocol Pack .
 Upload Protocol Section in 9800 WLC
Click Add, then choose the protocol pack to be downloaded and click Upgrade .
 Adding NBAR Protocol
Once Upgrade is done, you will see the protocol pack added.
 Verification of Protocol Pack
Via CLI
9800WLC#copy tftp://10.10.10.1/pp-adv-c9800-1712.1-49-70.0.0.pack bootflash:
9800WLC#configure terminal
9800WLC(config)#ip nbar protocol-pack bootflash:pp-adv-c9800-1712.1-49-70.0.0.pack

To verify NBAR protocol pack version

9800WLC#show ip nbar protocol-pack active
Active Protocol Pack:
Name: Advanced Protocol Pack
Version: 70.0
Publisher: Cisco Systems Inc.
NBAR Engine Version: 49
Creation time: Tue Jun 4 10:18:09 UTC 2024
File: bootflash:pp-adv-c9800-1712.1-49-70.0.0.pack
State: Active

Note: There will be no service disruption during the upgrade of NBAR protocol pack.
NetFlow
NetFlow is a network protocol used for collecting IP traffic information and monitoring network flow data. It is used primarily for network traffic analysis and bandwidth monitoring. Here is an overview of how NetFlow works on the Cisco Catalyst 9800 series controllers:
- Data Collection: 9800 WLC collect data about IP traffic flowing through them. This data includes information such as source and destination IP addresses, source and destination ports, protocols used, class of service, and the cause of flow termination.
- Flow Records: The collected data is organized into flow records. A flow is defined as a unidirectional sequence of packets sharing a set of common attributes, such as the same source/destination IP, source/destination ports, and protocol type.
- Exporting Data: The flow records are periodically exported from the NetFlow-enabled device to a NetFlow collector. The collector can be local WLC or a dedicated server or software application that receives, stores, and processes the flow data.
- Analysis: You can use NetFlow collectors and analysis tools to visualize traffic patterns, identify bandwidth, detect unusual traffic flows indicative of security breaches, optimize network performance, and plan for network expansion.
- Wireless-Specific Information: In the context of wireless controllers, NetFlow can include additional information specific to wireless networking, such as the SSID, AP names, client MAC addresses, and other details relevant to Wi-Fi traffic.
Flexible Netflow
Flexible NetFlow (FNF) is an advanced version of traditional NetFlow, and it is supported by the Cisco Catalyst 9800 Series Wireless LAN Controllers (WLCs). It provides more customization options for tracking, monitoring, and analyzing network traffic patterns. Key features of Flexible NetFlow on the Catalyst 9800 WLC include:
- Customization: FNF allows users to define what information they want to collect from the network traffic. This includes a wide range of traffic attributes like IP addresses, port numbers, timestamps, packet and byte counts, application types, and more.
- Enhanced Visibility: By leveraging FNF, administrators gain detailed visibility into the types of traffic flowing through the network, which is essential for capacity planning, usage-based network billing, network analysis, and security monitoring.
- Protocol Independence: FNF is flexible enough to support various protocols beyond IP, making it adaptable to different types of network environments.
On the Catalyst 9800 WLC, FNF can be configured to export flow records to an external NetFlow collector or analysis application. This data can then be used for troubleshooting, network planning, and security analysis. The FNF configuration involves defining a flow record (what to collect), a flow exporter (where to send the data), and attaching the flow monitor (which binds the record and exporter) to the appropriate interfaces.

Note: FNF can send 17 different data records ( as defined in RFC 3954) to the External 3rd Party Netflow collector such as Stealthwatch, Solarwinds and others which are: Application Tag, Client Mac Address, AP Mac address, WlanID, Source IP, Destination IP, Source Port, Destination Port, Protocol, Flow Start Time, Flow End Time, Direction, Packet out, Byte count, VLAN ID (Local mode) – Mgmt/Client and TOS - DSCP Value
Flow Monitor
A flow monitor is a component used in conjunction with Flexible NetFlow (FNF) to capture and analyses network traffic data. It plays a crucial role in monitoring and understanding traffic patterns for network management, security, and troubleshooting. The flow monitor is essentially an applied instance of FNF that collects and tracks flow data based on defined criteria. It is associated with three main elements:
- Flow Record: This defines the data that the flow monitor must collect from the network traffic. It specifies the keys (such as source and destination IP addresses, ports, protocol types) and non-key fields (like packet and byte counters, timestamps) that will be included in the flow data.
- Flow Exporter: This specifies the destination where the collected flow data must be sent. It includes details like the IP address of the NetFlow collector, the transport protocol (usually UDP), and the destination port number where the collector is listening.
- Flow Monitor: The flow monitor itself binds the flow record and flow exporter together and applies them to an interface or WLAN to actually start the monitoring process. It determines how the flow data must be collected and exported based on the criteria set in the flow record and the destination set in the flow exporter.
AVC Supported Access Points
AVC is supported only on these access points:
- Cisco Catalyst 9100 Series Access Points
- Cisco Aironet 2800 Series Access Point
- Cisco Aironet 3800 Series Access Points
- Cisco Aironet 4800 Series Access Points
Support for different 9800 deplyment modes
|
Deployment Mode |
9800 WLC |
Wave 1 Access Point |
Wave 2 Access Point |
Wifi 6 Access Point |
|
Local Mode |
IPV4 Traffic: |
Processing at WLC Level |
Processing at WLC Level |
Processing at WLC Level |
|
Flex Mode |
IPV4 Traffic: |
Processing at WLC Level |
Processing at WLC Level |
Processing at WLC Level |
|
Flex Mode |
Processing at AP Level |
IPV4 Traffic: |
IPV4 Traffic: |
IPV4 Traffic: |
|
Local Mode |
Processing at AP Level |
IPV4 Traffic: |
IPV4 Traffic: |
IPV4 Traffic: |
Restrictions while implementing AVC on 9800
Both Application Visibility and Control (AVC) and Flexible NetFlow (FNF) are powerful features on Cisco Catalyst 9800 Series Wireless LAN Controllers that enhance network visibility and control. However, there are some limitations and considerations to keep in mind when using these features:
- Layer 2 roaming is not supported across controllers.
- Multicast traffic is not supported.
- Only the applications that are recognized with App visibility can be used for applying QoS control.
- Data link is not supported for NetFlow fields in AVC.
- You cannot map the same WLAN profile to both the AVC-not-enabled policy profile and the AVC-enabled policy profile.
- You cannot use the policy profile with different switching mechanism to same WLAN to implement AVC.
- AVC is not supported on the management port (Gig 0/0).
- NBAR-based QoS policy configuration is allowed only on wired physical ports. Policy configuration is not supported on virtual interfaces, for example, VLAN, port channel and other logical interfaces.
- When AVC is enabled, the AVC profile supports only up to 23 rules, which includes the default DSCP rule. The AVC policy will not be pushed down to the AP, if rules are more than 23.
Network Topology
AP In Local Mode
 AVC in Local Mode AP (Central Switching)
AP In flex Mode
 AVC in Flex Mode AP
Configuration of AVC on 9800 WLC
While Configuring AVC on 9800 WLC, you can use either it as NetFlow Collector or can export the NefFlow data to External NetFlow Collector.
Local Exporter
On a Cisco Catalyst 9800 Wireless LAN Controller (WLC), a local NetFlow collector refers to the embedded feature within the WLC that allows it to collect and locally store NetFlow data. This capability enables the WLC to perform basic NetFlow data analysis without the need to export the flow records to an external NetFlow collector.
Via GUI
Step 1: To enable AVC on Specific SSID Navigate to Configuration > Services > Application Visibility. Choose the particular Policy Profile for which you wish to activate AVC.
 Enabling AVC on Policy Profile
Step 2: Select Local as Netflow Collector and Click Apply.
 Selecting Local NetFlow Collector
Observe that the NetFlow Exporter and NetFlow settings have been automatically configured according to the specified preferences once you apply the AVC configuration.
You can Validate the same by navigating to Configuration > Services > Application Visibility > Flow Monitor > Exporter/Monitor . Local Flow Collector Configuration on 9800 WLC
 Flow Monitor Configuration with Local NetFlow Collector
The IPv4 and IPv6 AVC Flow Monitors will get automatically associated with the Policy Profile. Navigate to Configuration > Tags & Profile > Policy . Click Policy Profile > AVC and QOS .
 Flow Monitor Configuration In Policy Profile
Via CLI
Step1: Configure 9800 WLC as Local Exporter.
9800-Cl-VM#config t
9800-Cl-VM(config)#flow exporter wireless-local-exporter
9800-Cl-VM(config-flow-exporter)#destination local wlc
9800-Cl-VM(config-flow-exporter)#exit
Step2: Configure IPv4 and IPv6 Network Flow Monitor to use Local(WLC) as Netflow Exporter.
9800-Cl-VM(config)#flow monitor wireless-avc-basic
9800-Cl-VM(config-flow-monitor)#exporter wireless-local-exporter
9800-Cl-VM(config-flow-monitor)#cache timeout active 60
9800-Cl-VM(config-flow-monitor)#record wireless avc ipv4 basic
9800-Cl-VM(config-flow-monitor)#exit

9800-Cl-VM(config)#flow monitor wireless-avc-basic-ipv6
9800-Cl-VM(config-flow-monitor)#exporter avc_local_exporter
9800-Cl-VM(config-flow-monitor)#cache timeout active 60
9800-Cl-VM(config-flow-monitor)#record wireless avc ipv6 basic
9800-Cl-VM(config-flow-monitor)#exit
Step 3: Map the IPv4 and IPv6 Flow Minitor in Policy Profile for both ingress and egress traffic.
9800-Cl-VM(config)#wireless profile policy AVC_Testing
9800-Cl-VM(config-wireless-policy)#shutdown

Disabling policy profile will result in associated AP/Client rejoin

9800-Cl-VM(config-wireless-policy)#ipv4 flow monitor wireless-avc-basic input
9800-Cl-VM(config-wireless-policy)#ipv4 flow monitor wireless-avc-basic output
9800-Cl-VM(config-wireless-policy)#ipv6 flow monitor wireless-avc-basic-ipv6 input
9800-Cl-VM(config-wireless-policy)#ipv6 flow monitor wireless-avc-basic-ipv6 output
9800-Cl-VM(config-wireless-policy)#no shutdown
9800-Cl-VM(config-wireless-policy)#exit
External NetFlow Collector
An external NetFlow collector, when used in the context of Application Visibility and Control (AVC) on a Cisco Catalyst 9800 Wireless LAN Controller (WLC), is a dedicated system or service that receives, aggregates, and analyzes NetFlow data exported from the WLC. You can Either Configure only external NeFlow Collector to Monitor the Application Visibility or can use it along with Local Collector as well.
Via GUI
Step 1: To enable AVC on Specific SSID Navigate to Configuration > Services > Application Visibility. Choose the particular Policy Profile for which you wish to activate AVC. Select Collector as External and configure the IP address of NetFlow Collector like Cisco Prime, SolarWind, StealthWatch and click Apply.
 AVC Configuration for External NetFlow Collector
Observe that, once you apply the AVC configuration, the NetFlow Exporter and NetFlow settings have been automatically configured with the NetFlow Collector IP address as exporter and Exporter address as 9800 WLC with default timeout settings and UDP port 9995. You can Validate the same by navigating to Configuration > Services > Application Visibility > Flow Monitor > Exporter/Monitor .
 External NetFlow Collector Configuration on 9800 WLC
 Flow Monitor Configuration with External NetFlow Collector
You can check the Port Configuration of automatically generated NetFlow Monitor by navigating to Configuration > Services > NetFlow .


Note: If you Configure AVC via GUI, The automatically generated NetFlow Exporter will be configured to use UDP 9995 port. Please make sure to validate the port number which is being used by your NetFlow collector.
For Example: If you are using Cisco Prime as your NetFlow Collector, it is essential to set the Exporter port to 9991, as this is the port on which Cisco Prime listens for NetFlow traffic. You can manually change the Exporter Port in NetFlow Configuration.
 Changing Exporter Port Number in NetFlow Configuration
Via CLI
Step1: Configure the IP address of External NetFlow Collector with the source interface.
9800-Cl-VM#config t
9800-Cl-VM(config)#flow exporter External_Exporter
9800-Cl-VM(config-flow-exporter)#destination 10.106.36.22
9800-Cl-VM(config-flow-exporter)#source $Source_Interface
9800-Cl-VM(config-flow-exporter)#transport udp $Port_Numbet
9800-Cl-VM(config-flow-exporter)#exit
Step2: Configure IPv4 and IPv6 Network Flow Monitor to use Local(WLC) as Netflow Exporter.
9800-Cl-VM(config)#flow monitor wireless-avc-basic
9800-Cl-VM(config-flow-monitor)#exporter External_Exporter
9800-Cl-VM(config-flow-monitor)#cache timeout active 60
9800-Cl-VM(config-flow-monitor)#record wireless avc ipv4 basic
9800-Cl-VM(config-flow-monitor)#exit

9800-Cl-VM(config)#flow monitor wireless avc ipv6 basic
9800-Cl-VM(config-flow-monitor)#exporter External_Exporter
9800-Cl-VM(config-flow-monitor)#cache timeout active 60
9800-Cl-VM(config-flow-monitor)#record wireless avc ipv6 basic
9800-Cl-VM(config-flow-monitor)#exit
Step 3: Map the IPv4 and IPv6 Flow Minitor in Policy Profile for both ingress and egress traffic.
9800-Cl-VM(config)#wireless profile policy AVC_Testing
9800-Cl-VM(config-wireless-policy)#shutdown

Disabling policy profile will result in associated AP/Client rejoin

9800-Cl-VM(config-wireless-policy)#ipv4 flow monitor wireless-avc-basic input
9800-Cl-VM(config-wireless-policy)#ipv4 flow monitor wireless-avc-basic output
9800-Cl-VM(config-wireless-policy)#ipv6 flow monitor wireless avc ipv6 basic input
9800-Cl-VM(config-wireless-policy)#ipv6 flow monitor wireless avc ipv6 basic output
9800-Cl-VM(config-wireless-policy)#no shutdown
9800-Cl-VM(config-wireless-policy)#exit
Configuration of AVC on 9800 WLC using Cisco Catalyst Center
Before proceeding with the configuration of Application Visibility and Control (AVC) on a Cisco Catalyst 9800 Wireless LAN Controller (WLC) through Cisco Catalyst Center, it is important to verify that telemetry communication between the WLC and Cisco Catalyst Center has been successfully established. Ensure that the WLC appears in a managed state within the Cisco Catalyst Center interface and that its health status is being actively updated. Additionally, for effective monitoring of the health status, it is important to properly assign both the WLC and the Access Points (APs) to their respective sites within Cisco Catalyst Center.
 Telemetry Connection Verfication on 9800 WLC
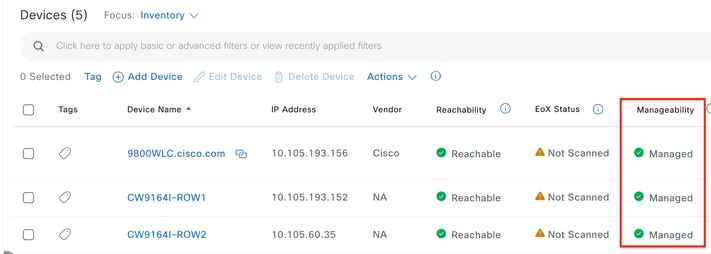 WLC and AP are in Managed State
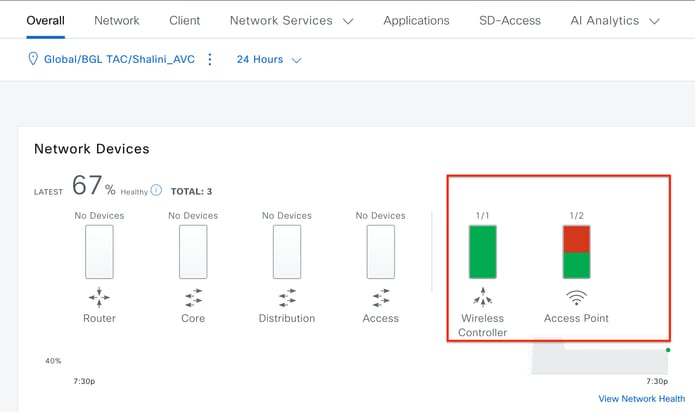 Health Status of WLC and AP on Cisco Catalyst Center
Step 1: Configure Cisco Catalyst Center as NetFlow collector and enable Wireless Telemetry in Global setting. Navigate to Design > Network Setting > Telemetry and enable the desired configuration as demonstrated.
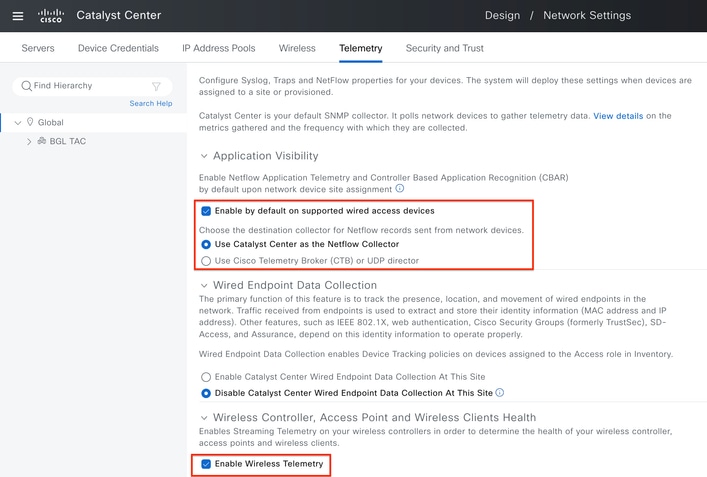 Wireless Telemetry and AVC Configuration
Step 2: Enable Application Telemetry on the desired 9800 WLC to push the AVC configuration on 9800 WLC. For this navigate to Provision > Network Device > Inventory. Choose the 9800 WLC on which you wish to activate Application Telemetry, and then navigate to Action > Telemetry > Enable Application Telemetry .
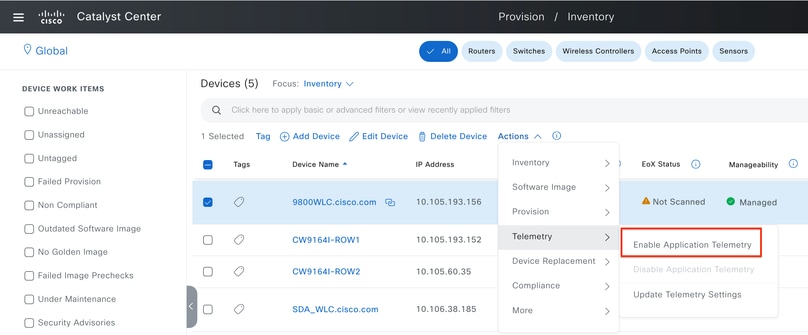 Enabling Application Telemetry on 9800 WLC
Step 3: Choose the Deployment Mode as per the requirement.
Local: To enable AVC in local Policy profile (Central Switching)
Flex/Fabric: To enable AVC in Flex Policy Profile (Local Switching) or Fabric based SSID.
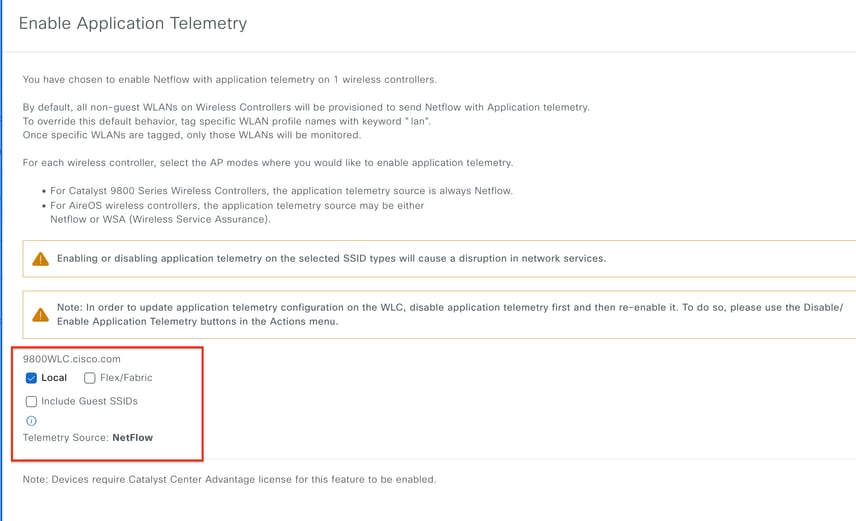 Deployment Mode Selection on Cisco Catalyst Center
Step 4: It initiates a task to activate the AVC settings, and the corresponding configuration will be applied to the 9800 WLC. You can view the status by navigating to Activities > Audit Log .
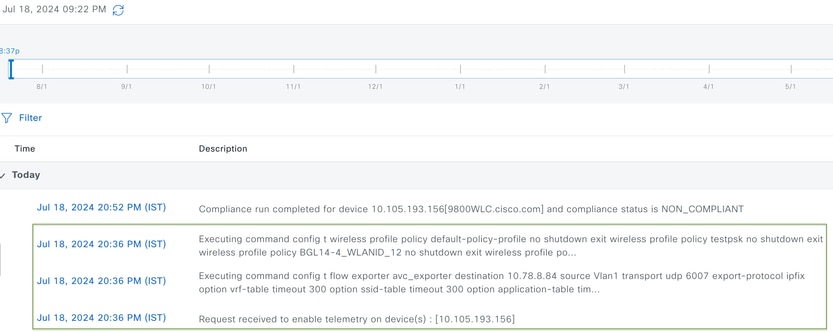 Audit Logs after Enabling Telemetry on 9800 WLC
Cisco Catalyst Center will deploy the Flow Exporter and Flow Monitor configurations, including the specified port and other settings, and activate them within the chosen mode policy profile as shown below:
Configure Cisco Catalyst Center as Flow Exporter:

9800-Cl-VM#config t
9800-Cl-VM(config)#flow exporter avc_exporter
9800-Cl-VM(config-flow-exporter)#destination 10.104.222.201
9800-Cl-VM(config-flow-exporter)#source Vlan10
9800-Cl-VM(config-flow-exporter)#transport udp 6007
9800-Cl-VM(config-flow-exporter)#export-protocol ipfix
9800-Cl-VM(config-flow-exporter)#option vrf-table timeout 300
9800-Cl-VM(config-flow-exporter)#option ssid-table timeout 300
9800-Cl-VM(config-flow-exporter)#option application-table timeout 300
9800-Cl-VM(config-flow-exporter)#option application-attributes timeout 300
9800-Cl-VM(config-flow-exporter)#exit
Configure 9800 WLC as Local Exporter

9800-Cl-VM#config t
9800-Cl-VM(config)#flow exporter avc_local_exporter
9800-Cl-VM(config-flow-exporter)#destination local wlc
9800-Cl-VM(config-flow-exporter)#exit
Configure Network Flow Monitor to use both Local(WLC) and Cisco Catalyst Center as Netflow Exporter:

9800-Cl-VM(config)#flow monitor avc_ipv4_assurance
9800-Cl-VM(config-flow-monitor)#exporter avc_exporter
9800-Cl-VM(config-flow-monitor)#exporter avc_local_exporter
9800-Cl-VM(config-flow-monitor)#cache timeout active 60
9800-Cl-VM(config-flow-monitor)#default cache entries
9800-Cl-VM(config-flow-monitor)#record wireless avc ipv4 assurance
9800-Cl-VM(config-flow-monitor)#exit

9800-Cl-VM(config)#flow monitor avc_ipv6_assurance
9800-Cl-VM(config-flow-monitor)#exporter avc_exporter
9800-Cl-VM(config-flow-monitor)#exporter avc_local_exporter
9800-Cl-VM(config-flow-monitor)#cache timeout active 60
9800-Cl-VM(config-flow-monitor)#default cache entries
9800-Cl-VM(config-flow-monitor)#record wireless avc ipv6 assurance
9800-Cl-VM(config-flow-monitor)#exit

9800-Cl-VM(config)#flow monitor avc_ipv4_assurance_rtp
9800-Cl-VM(config-flow-monitor)#exporter avc_exporter
9800-Cl-VM(config-flow-monitor)#cache timeout active 60
9800-Cl-VM(config-flow-monitor)#default cache entries
9800-Cl-VM(config-flow-monitor)#record wireless avc ipv4 assurance-rtp
9800-Cl-VM(config-flow-monitor)#exit

9800-Cl-VM(config)#flow monitor avc_ipv6_assurance_rtp
9800-Cl-VM(config-flow-monitor)#exporter avc_exporter
9800-Cl-VM(config-flow-monitor)#cache timeout active 60
9800-Cl-VM(config-flow-monitor)#default cache entries
9800-Cl-VM(config-flow-monitor)#record wireless avc ipv6 assurance-rtp
9800-Cl-VM(config-flow-monitor)#exit
Mapping the IPv4 and IPv6 Flow Minitor in Policy Profile

9800-Cl-VM(config)#wireless profile policy AVC_Testing
9800-Cl-VM(config-wireless-policy)#shutdown

Disabling policy profile will result in associated AP/Client rejoin

9800-Cl-VM(config-wireless-policy)#ipv4 flow monitor avc_ipv4_assurance input
9800-Cl-VM(config-wireless-policy)#ipv4 flow monitor avc_ipv4_assurance output
9800-Cl-VM(config-wireless-policy)#ipv4 flow monitor avc_ipv4_assurance_rtp input
9800-Cl-VM(config-wireless-policy)#ipv4 flow monitor avc_ipv4_assurance_rtp output
9800-Cl-VM(config-wireless-policy)#ipv6 flow monitor avc_ipv6_assurance input
9800-Cl-VM(config-wireless-policy)#ipv6 flow monitor avc_ipv6_assurance output
9800-Cl-VM(config-wireless-policy)#ipv6 flow monitor avc_ipv6_assurance_rtp input
9800-Cl-VM(config-wireless-policy)#ipv6 flow monitor avc_ipv6_assurance_rtp output
9800-Cl-VM(config-wireless-policy)#no shutdown
9800-Cl-VM(config-wireless-policy)#exit
Verification of AVC
On 9800
When the 9800 WLC is utilized as a Flow exporter, these AVC statistics can be observed:
• Application Visibility for clients connected across all SSIDs.
• Individual Application usage for each client.
• Specific Application usage on each SSID separately.

Note: You have the option to filter the data by direction, covering both incoming (ingress) and outgoing (egress) traffic, as well as by time interval, with the ability to select a range of up to 48 hours.
Via GUI
Navigate to Monitoring > Services > Application Visibility .
 Application Visibility of users connected to AVC_testing SSID for both Ingress and Egress Traffic
To view Application Visibility statistics for each client, you can click on the Clients tab, choose a specific client, and then click View Application Details.
 Application Visibility for Specific Client - 1
 Application Visibility for Specific Client - 2
Via CLI
Verify AVC status
9800WLC#show avc status wlan AVC_testing
WLAN profile name: AVC_testing
----------------------------------------------------------
AVC configuration complete: YES
Statistics from NetFlow (FNF Cache)
9800WLC#show flow monitor $Flow_Monitor_Name cache format table
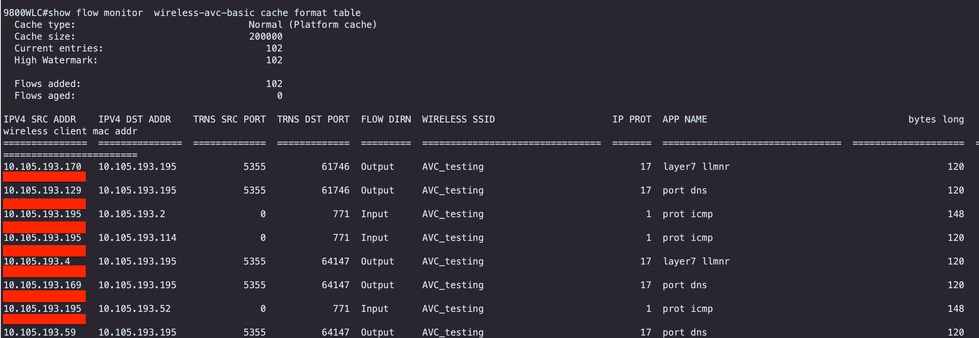 Verification of AVC on 9800 CLI
To individually examine the top application usage for each WLAN and its connected clients:
9800WLC#show avc wlan <SSID> top <n> applications <aggregate|downstream|upstream>
9800WLC#show avc client <mac> top <n> applications <aggregate|downstream|upstream>
where n = <1-30> Enter the number of applications

9800WLC#show avc wlan <SSID> application <app> top <n> <aggregate|downstream|upstream>
where n =  <1-10> Enter the number of clients
Verify FNFv9 packets counts and decode status punted to Control Plane (CP)
9800WLC#show platform software wlavc status decoder
 FNFv9 Packet Record
You can also check the nbar statistics directly.
9800WLC#show ip nbar protocol-discovery
On Fabric and Flex modes, you can get the NBAR stats from AP via:
AP#show avc nbar statistics
Works on both IOS and ClickOS APs

Note: In a foreign-anchor setup, the anchor WLC serves as the Layer 3 presence for the client, while the foreign WLC operates at Layer 2. Because Application Visibility and Control (AVC) operates at Layer 3, the relevant data is only observable on the anchor WLC.
On DNAC
From the packet capture taken on 9800 WLC we can validate it is sending data regarding the applications and network traffic to Cisco Catalyst Center continuously.
 Packet Capture on 9800 WLC
To view the application data for clients connected to a specific WLC on Cisco Catalyst Center, navigate to Assurance > Dashboards > Health > Application .
 AVC Monitoring on Cisco Catalyst Center
We can track the most frequently used applications by clients and identify the highest data consumers, as demonstrated here.
 Top application and Top Bandwidth User Statistics
You have the ability to set a filter for a particular SSID, which allows you to monitor the overall throughput and application usage of clients associated with that SSID.
This functionality enables you to identify the Top applications and the highest bandwidth-consuming users within your network.
Additionally, you can utilize the Time Filter feature to examine this data for previous time periods, offering historical insights into network usage.
 Time Filter to display AVC statistics.
  SSID Filter to display AVC Statistics
On External NetFlow Collector
Example1: Cisco Prime as Netflow Collector
When you use Cisco Prime as Netflow collector the collected You can see 9800 WLC as Data source sending Netflow data and the NetFlow template will be created automatically as per the data being sent by 9800 WLC.
From the packet capture taken on 9800 WLC we can validate it is sending data regarding the applications and network traffic to Cisco Prime continuously.
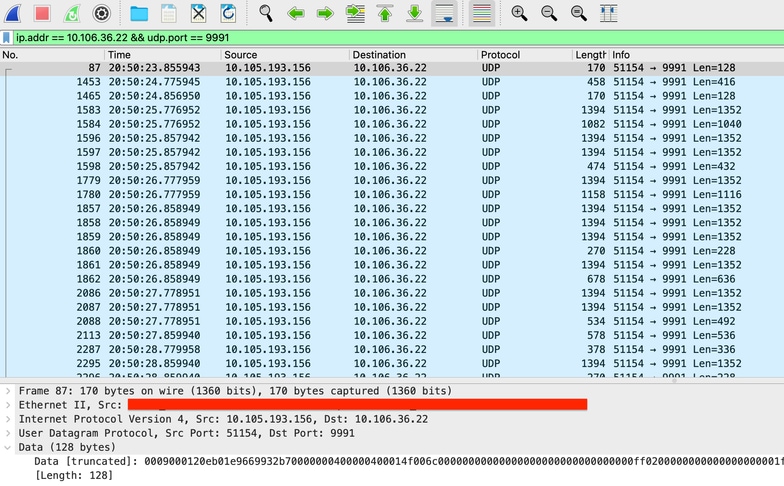 Packet Capture Taken on 9800 WLC
 Cisco Prime Detecting 9800 WLC as Netflow Data Source
You can set filters based on Application, Services, and even by Client, using the IP address for more targeted data analysis.
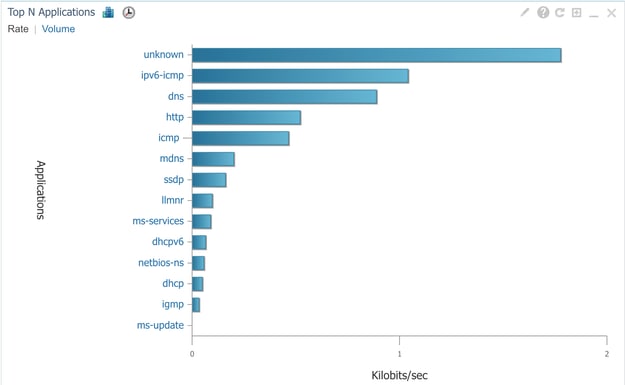 Application Visibility for all Clients
 Application of specific Client Using IP address
Example 2: Third party NetFlow Collector
In this example, the third-party NetFlow collector [SolarWinds] is utilized to gather application statistics. The 9800 WLC employs Flexible NetFlow (FNF) to transmit comprehensive data regarding the applications and network traffic, which is then collected by SolarWinds.
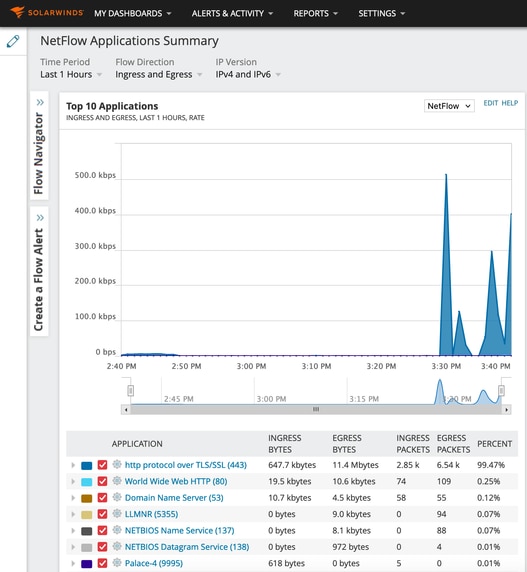 Netflow Application Statistics on SolarWind
Traffic Control
Traffic control refers to a set of features and mechanisms used to manage and regulate the flow of network traffic. Traffic policing or rate limiting are mechanisms used in wireless controller to control the amount of traffic transmitted from client. It monitors the data rate for network traffic and takes immediate action when a predefined rate limit is exceeded. When the traffic exceeds the specified rate, rate limiting can drop the excess packets or mark them down by changing their Class of Service (CoS) or Differentiated Services Code Point (DSCP) values. This can be achieved by configuring QOS in 9800 WLC, You can refer to https://www.cisco.com/c/en/us/support/docs/wireless/catalyst-9800-series-wireless-controllers/215441-configure-qos-rate-limiting-on-catalyst.html to get the overview of how these components work and how can they be configured to achieve different results.
Troubleshooting
Troubleshooting AVC issues involves involves identifying and resolving problems that possibly affect the AVC's ability to accurately identify, classify, and manage application traffic on your wireless network. Common issues can include problems with traffic classification, policy enforcement, or reporting. Here are some steps and considerations when troubleshooting AVC issues on a Catalyst 9800 WLC:
- Verify AVC Configuration: Ensure that AVC is properly configured on the WLC and associated with the correct WLANs and profiles.
-
When setting up AVC through the GUI, it will automatically assign port 9995 as the default. However, if you are using an External Collector, verify which port it is configured to listen on for NetFlow traffic. It is crucial to accurately configure this port number to match your collector's settings.
- Verify the AP Model and deployment mode support.
- Refer to limitations on 9800 WLC while implementing AVC in your wireless network.
Log Collection
WLC logs
1. Enable timestamp to have time reference for all the commands.
9800WLC#term exec prompt timestamp
2. To review the configuration
9800WLC#show tech-support wireless
3. You can verify the avc status and netflow statistics.
Check the AVC configuration status.
9800WLC#show avc status wlan <wlan_name>
Check FNFv9 packets counts and decode status punted to Control Plane (CP).
9800WLC#show platform software wlavc status decoder
Check Statistics from NetFlow (FNF Cache).
9800WLC#show flow monitor <Flow_Monitor_Name>
Check Top n application usage for each wlan, where n = <1-30> Enter the number of applications.
9800WLC#show avc wlan <SSID> top <n> applications <aggregate|downstream|upstream>
Check top n application usage for each client, where n = <1-30> Enter the number of applications.
9800WLC#show avc client <mac> top <n> applications <aggregate|downstream|upstream>
Check top n clients connected to specific wlan using the specific application, where n=<1-10> Enter the number of clients.
9800WLC#show avc wlan <SSID> application <app> top <n> <aggregate|downstream|upstream>
Check the nbar statistics.
9800WLC#show ip nbar protocol-discovery
4. Set logging level to debug/verbose.
9800WLC#set platform software trace all debug/verbose

!! To View the collected logs
9800WLC#show logging profile wireless internal start last clear to-file bootflash:<File_Name

!!Set logging level back to notice post troubleshooting
9800WLC#set platform software trace wireless all debug/verbose
5. Enable Radioactive (RA) Trace for client MAC address to validate the AVC stats.
Via CLI
9800WLLC#debug wireless {mac | ip} {aaaa.bbbb.cccc | x.x.x.x } {monitor-time} {N seconds} !! Setting time allows us to enable traces for up to 24 days
9800WLC#no debug wireless mac <Client_MAC>
!!WLC generates a debug trace file with Client_info, command to check for debug trace file generated.
9800WLC#dir bootflash: | i debug
Caution: The conditional debugging enables debug-level logging which in turn increases the volume of the logs generated. Leaving this running reduces how far back in time you can view logs from. So, it is recommended to always disable debugging at the end of the troubleshooting session.
# clear platform condition all
# undebug all
Via GUI
Step 1. Navigate to Troubleshooting > Radioactive Trace .
Step 2. Click Add and enter a client Mac address that you want to troubleshoot. You can add several Mac addresses to track.
Step 3. When you are ready to start the radioactive tracing, click start. Once started, debug logging is written to disk about any control plane processing related to the tracked MAC addresses.
Step 4. When you reproduce the issue you want to troubleshoot, click Stop .
Step 5. For each mac address debugged, you can generate a log file collating all the logs pertaining to that mac address by clicking Generate .
Step 6. Choose how long back you want your collated log file to go and click Apply to Device.
Step 7. You can now download the file by clicking the small icon next to the file name. This file is present in the boot flash drive of the controller and can also be copied out of the box through CLI.
Here's a glimpse of AVC debugs in RA traces
2024/07/20 20:15:24.514842337 {wstatsd_R0-0}{2}: [avc-stats] [15736]: (debug): Received stats record for app 'dns'(app-id: 0x3000035), client MAC: xxxx.xxxx.a7da , SSID 'AVC_testing', direction ingress (0), WLAN ID <not provided>, #bytes 280, #packets 5
2024/07/20 20:15:24.514865665 {wstatsd_R0-0}{2}: [avc-stats] [15736]: (debug): Received stats record for app 'dns'(app-id: 0x3000035), client MAC: xxxx.xxxx.a7da , SSID 'AVC_testing', direction ingress (0), WLAN ID <not provided>, #bytes 56, #packets 1
2024/07/20 20:15:24.514875837 {wstatsd_R0-0}{2}: [avc-stats] [15736]: (debug): Received stats record for app 'unknown'(app-id: 0xd000001), client MAC: xxxx.xxxx.a7da , SSID 'AVC_testing', direction ingress (0), WLAN ID <not provided>, #bytes 56, #packets 1
2024/07/20 20:15:40.530177442 {wstatsd_R0-0}{2}: [avc-stats] [15736]: (debug): Received stats record for app 'ping'(app-id: 0xd0001df), client MAC: xxxx.xxxx.a7da , SSID 'AVC_testing', direction ingress (0), WLAN ID <not provided>, #bytes 3600, #packets 60
6. Embedded Captures filtered by client MAC address in both directions, Client inner MAC filter available after 17.1.
It is particularly useful when using an external collector, as it helps confirm whether the WLC is transmitting NetFlow data to the intended port as expected.
Via CLI
monitor capture MYCAP clear
monitor capture MYCAP interface <Interface> both
monitor capture MYCAP buffer size 100
monitor capture MYCAP match any
monitor capture MYCAP inner mac CLIENT_MAC@
monitor capture MYCAP start
!! Inititiate different application traffic from user
monitor capture MYCAP stop
monitor capture MYCAP export flash:|tftp:|http:.../filename.pcap
Via GUI
Step 1. Navigate to Troubleshooting > Packet Capture > +Add .
Step 2. Define the name of the packet capture. A maximum of 8 characters is allowed.
Step 3. Define filters, if any.
Step 4. Check the box to Monitor Control Traffic if you want to see traffic punted to the system CPU and injected back into the data plane.
Step 5. Define buffer size. A maximum of 100 MB is allowed.
Step 6. Define limit, either by duration which allows a range of 1 - 1000000 seconds or by number of packets which allows a range of 1 - 100000 packets, as desired.
Step 7. Choose the interface from the list of interfaces in the left column and select the arrow to move it to the right column.
Step 8. Click on Apply to Device.
Step 9. To start the capture, select Start .
Step 10. You can let the capture run to the defined limit. To manually stop the capture, select Stop.
Step 11. Once stopped, an Export button becomes available to click with the option to download the capture file (.pcap) on the local desktop via HTTP or TFTP server or FTP server or local system hard disk or flash.
AP Logs
On Fabric and Flex modes
1. show tech to have all config details and client stats for the AP.
2. show avc nbar statistics nbar stats from AP
3. AVC debugs
AP#term mon
AP#debug capwap client avc <all/detail/error/event>
AP#debug capwap client avc netflow <all/detail/error/event/packet>
Related Information
Revision History
| Revision | Publish Date | Comments |
|---|---|---|
1.0 |
29-Jul-2024 |
Initial Release |
Contributed by Cisco Engineers
- Shalini ChoubeyTechnical Consulting Engineer
Contact Cisco
- Open a Support Case

- (Requires a Cisco Service Contract)
 Feedback