Introduction
This document describes Grafana and how monitoring is done at Cisco Policy Suite (CPS).
What is Grafana?
Grafana is Graphite Webapp. Graphite is an open-source monitoring tool for storing and viewing time series data.
Graphite consists of 3 software components :
- Carbon
- Whisper
- Graphite Webapp (Grafana)
How Does the Monitoring Work for CPS?
- CPS system & application statistics and key performance indicators are collected by the system and displayed using a browser-based graphical metric tool for monitoring.
- The list of statistics available in CPS is consolidated in an Excel spreadsheet.
- This spreadsheet can be found in the mentioned location on the cluster manager VM :
/var/qps/install/current/scripts/documents/QPS_statistics.xlsx
How Does Data Collection Work?
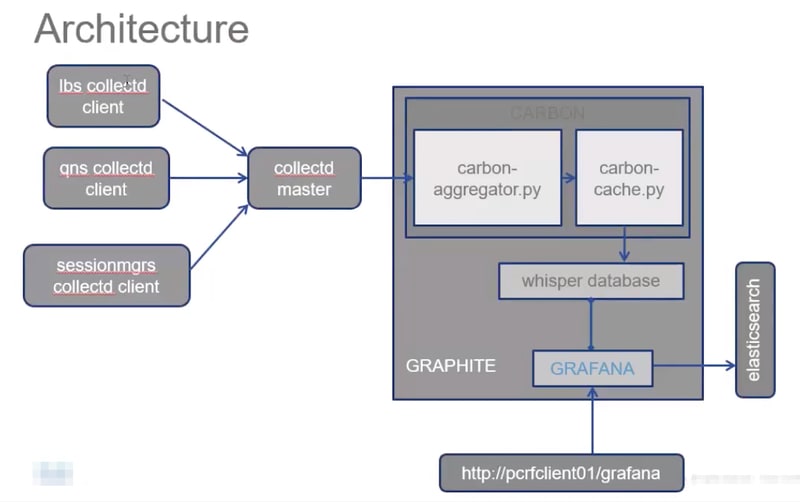
- The application writes data on to JMX beans. JMX here is Java Management Extensions.
- Collectd clients run on all CPS virtual machine such as policy server i.e qns, policy director i.e load balancer and sessionmgr. It retrieves the data from the JMX beans using JMX plugin (jmxplugin.conf), data are directly written to collectd in case of sessionmgr.
- Collectd clients then push data to collectd master node on the pcrfclient01, the configuration file of collectd daemon is collectd.conf.
- The Collectd master node, in turn, forwards the collected data to the graphite database on the pcrfclient01.
- The graphite database stores system-related statistics such as CPU usage, memory usage, and ethernet interface statistics, as well as application message counters such as Gx, Gy and Sp.
- Carbon cache writes this data to the Whisper database, database configuration files used here are storage-schemas.conf & rewrite-rules.conf.
- Grafana then pulls this data from Whisper database configuration file wsgi.conf & 25-graphite.conf, as we execute the query in grafana GUI.
Users in Grafana
Users must be authenticated to access Grafana. No default users are provided.
Command to add a user :
Run from Cluster Manager
/usr/bin/htpasswd -s /var/www/html/htpasswd <username>
Command to delete a user :
Run from Cluster Manager
/usr/bin/htpasswd -D /var/www/html/htpasswd <username>
After a Grafana user is added or deleted :
- Manually copy the .htpasswd file from pcrfclient01 VM to the pcrfclient02 VM.
- Run this command to synchronize the information between two OAM (pcrfclient) VMs
/var/qps/bin/support/grafana_sync.sh
URLs to Connect to Grafana
For HA setup you use load balancer (LB) virtual IPs to connect:
https://<lbvip01>:9443/grafana
For All in One setup you can use the management IP to connect:
htttp://<ip>>:80/grafana
Note: URLs are present in the output of script about.sh as well.
Create a Dashboard in Grafana
Step 1. Login via Admin user. The dashboard can be created as shown in the image:
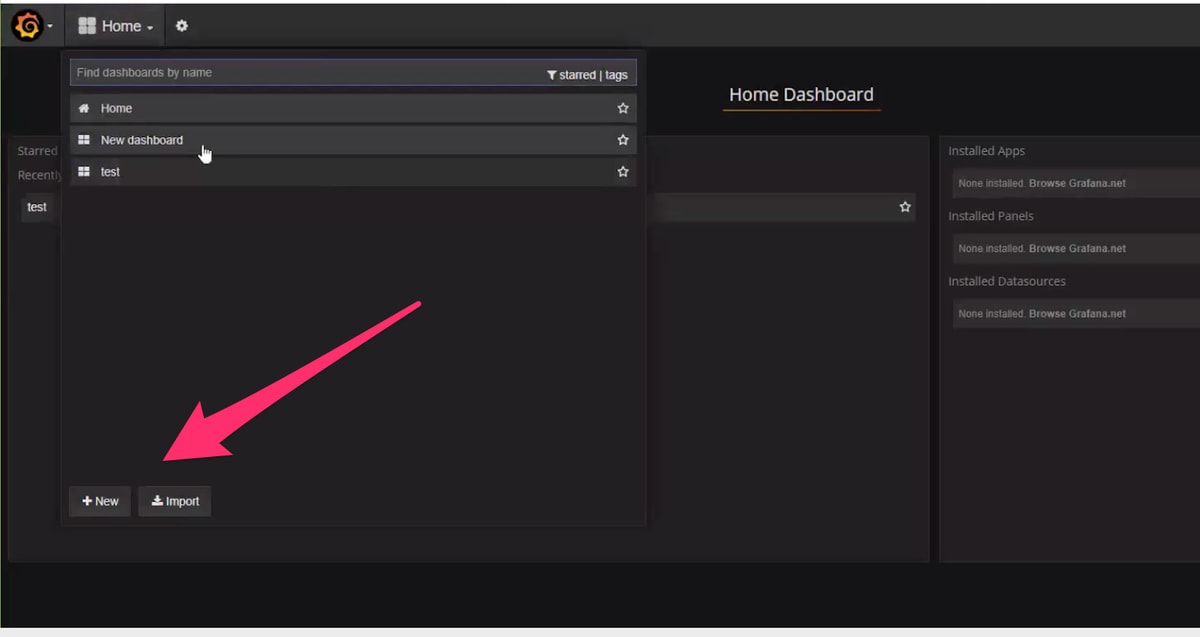
Step 2. Select a new dashboard or import dashboard exported from another environment.
In order to change settings in the dashboard according to the requirement:
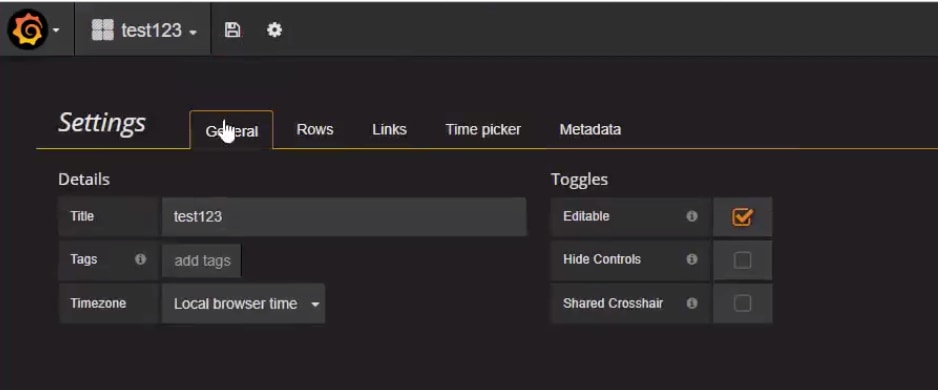
Step 1. Navigate to Settings, on the top left corner of the page.
Step 2. Under Settings you can get options to add metadata, links, time setting etc as shown in the image :
In order to write a query :
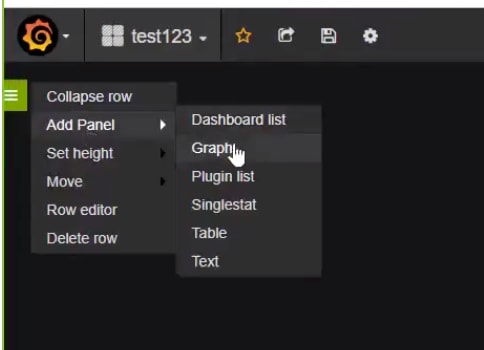
Step 1. Select 3 horizontal bars at left side.
Step 2. Navigate Add Panel > Graph, as shown in the image.
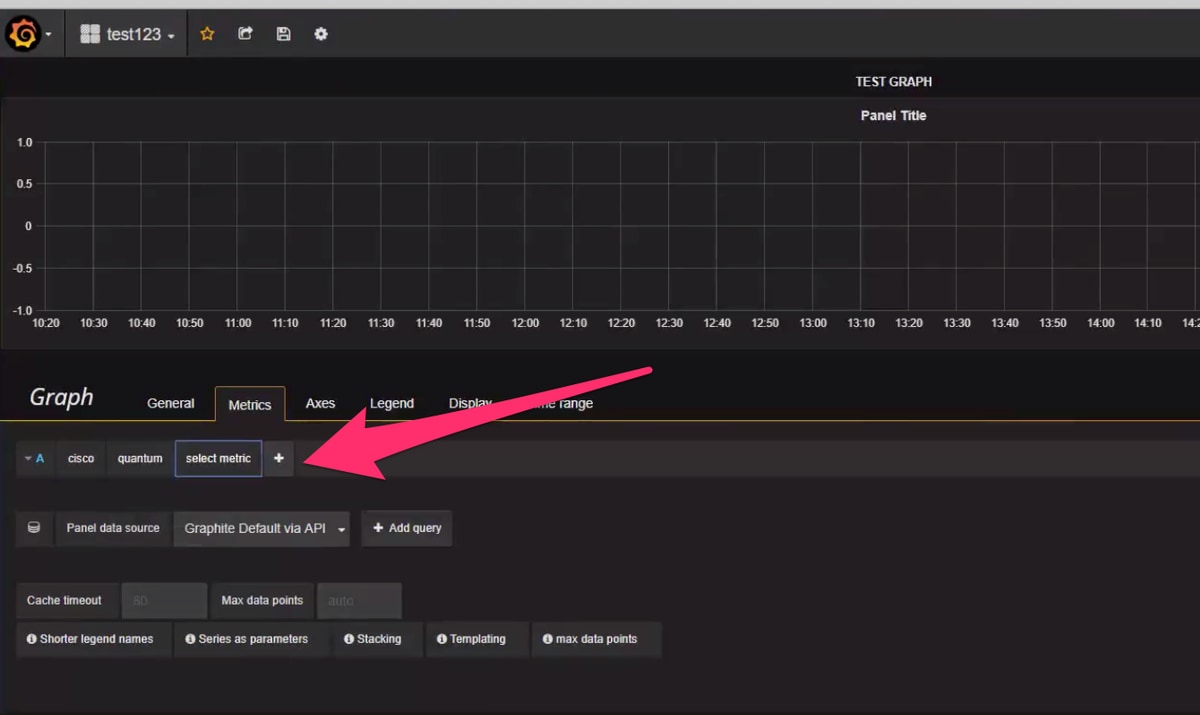
Step 3. Click on Select Metrics, as shown in image to add a query.
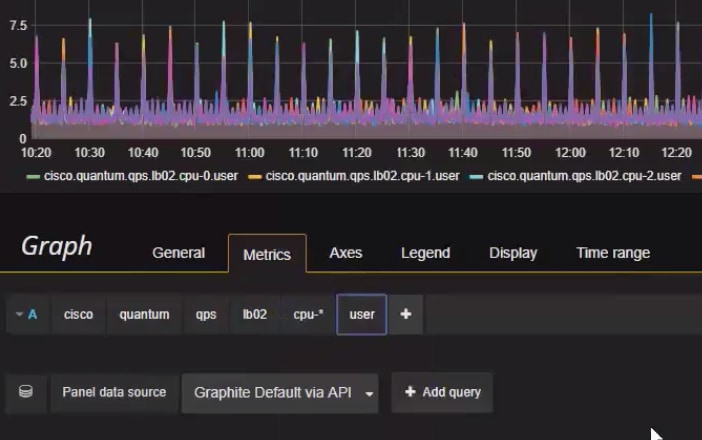
Example:
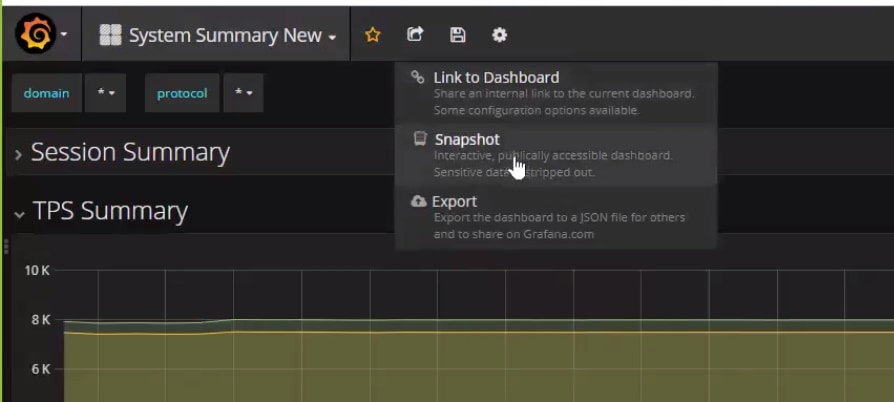
In order to export or to take snapshot:
Step 1. Select the export sign from the top bar.
Step 2. You can export the dashboard to JSON file or get a internal link to the dashboard or take the snapshot of dashboard as shown in the image.
