Cisco Crosswork Situation Manager 7.3.x Integration Guide
Available Languages
Cisco Crosswork Situation Manager 7.3.x Integration Guide
(Powered by Moogsoft AIOps 7.3)
Configure the Ansible Tower Integration
Configure the Kafka Integration
Configure the AppDynamics Integration
Configure the Remedy Integration
Configure the Cherwell Integration
Configure the Email Integration
Configure the EMC Smarts Integration
Configure the ExtraHop Integration
Configure the Fluentd Integration
Configure the Grafana Integration
Configure the Lenovo XClarity LAM
Configure the Nagios Integration
Install the Nagios Integration Scripts
Configure the Node.js Integration
Configure the Node-RED Integration
Configure Oracle Enterprise Manager
Configure the ServiceNow Integration
Configure a ServiceNow MID Server
Configure a ServiceNow MID Server
Configure the Sensu Integration
Configure the SevOne Integration
Configure the Site24x7 Integration
Configure the Slack Integration
Parse MIBs for Trap Integration
Configure the Sumo Logic Integration
Configure the Zenoss Integration
Integrations
Integrations enable you to connect applications and other tools to Cisco Crosswork Situation Manager.
You can integrate with applications such as ticketing, monitoring and collaboration tools. You can also create your own custom webhook integrations.
Ticketing
You can integrate with the following ticketing applications:
· Cherwell
Monitoring
You can integrate with the following monitoring applications:
· DataDog
· ExtraHop
· Fluentd
· HP
· JMS
· Nagios
· Node.js
· Node-RED
· Pingdom
· REST LAM
· Sensu
· SevOne
· Site24x7
· Splunk
· SNMP LAM
· VMware
· Webhook
· Zabbix
· Zenoss
Notification & Collaboration
You can connect these collaboration tools to Cisco Crosswork Situation Manager:
· Slack
· xMatters
Reporting & Dashboards
You can integrate with these reporting applications to gain insight into your operations:
· Grafana
Introduction to Integrations
Integrations and Link Access Modules (LAMs) handle data ingestion from your event sources into Cisco Crosswork Situation Manager.
Many monitoring and ticketing systems can be configured by using an integration in the UI. Go to the Integrations tab to see what is available.
If you want to set properties that are not visible in the integration, or configure for high availability, modify the LAM configuration file instead. For each data source you can configure either the integration or the LAM, not both. A UI integration is independent from a LAM and you cannot edit it outside the UI.
LAMs contain LAMbots which are Javascript files that determine how to process the data, map it to Cisco Crosswork Situation Manager events, and publish events on the Message Bus.
Further information on LAMs and integrations can be found on the following pages:
Data Ingestion
You can configure how data fields are mapped and how events are deduplicated for monitoring integrations in Cisco Crosswork Situation Manager.
Benefits of these data ingestion features include:
1. Data Mapping enables Cisco Crosswork Situation Manager to identify and organize alerts from integrations.
2. Deduplicating events from integrations into alerts reduces noise.
The configuration steps below can only be taken after the integration has been installed and is running. The tabs are inactive prior to the integration being installed.
Data Mapping
After Cisco Crosswork Situation Manager receives the payload of an incoming event from the integration, you can map the data fields to the corresponding alert fields in Cisco Crosswork Situation Manager.
Customize your mapping using the Data Mapping tab under each integration. There are three steps:
· Input displays the incoming payload of the first event sent to Cisco Crosswork Situation Manager by the integration after tokenization. The Payload View contains the following information and controls:
— Source fields - integration data fields.
— Source field values - values of the integration data fields.
— Refresh - clears the window and populates with the payload of the next event from the integration.
— Expand - click and drag down to expand the Payload View.
You can edit, copy and paste the payload text as required.
· Transform allows you to transform and map the data fields of events from the integration with the appropriate alert fields in Cisco Crosswork Situation Manager.
Select any field from the list to edit it and select the Cisco Crosswork Situation Manager field it maps to. See Alert and Event Field Reference for descriptions of the alert fields in Cisco Crosswork Situation Manager. You can also add custom fields.Event and Alert Field Best Practice
· Output displays a preview of how the integration event appears as an alert in Cisco Crosswork Situation Manager. This changes dynamically as you change the data field mappings and the Payload View.
Alert Noise Reduction
Cisco Crosswork Situation Manager deduplicates events into alerts in order to reduce noise. You can configure a signature to ensure events from a single integration or from multiple integrations of different types are deduplicated into alerts together.
To edit the signature, go to the Signature editor and select the fields you want to be included. Alternatively, click 'Use Recommended Fields' to use fields recommended by Cisco Crosswork Situation Manager.
Fields recommended for use in a signature included: source/host, event type/class, manager/agent, unique ID, error code or impacted entities.
After you configure a signature, compare the Alerts to see if Cisco Crosswork Situation Manager deduplicated the events as you would expect. If not, then revise and refine the signature.
See Signature for more information.
Integrations with Deduplication
The alert noise reduction feature is only available for certain monitoring integrations. These are as follows:
| Apache Kafka |
HP NNMi |
VMware vSphere |
| AWS CloudWatch |
HP OMi |
vRealize Log Insight |
| CA Spectrum |
HP OMi Plugin |
Webhook |
| CA UIM |
JMS |
WebSphere MQ |
| Dynatrace APM |
Microsoft SCOM |
XClarity |
| |
Cisco OEM |
Zabbix |
| Fluentd |
Pingdom |
Zenoss |
All other integrations take care of the field mapping and it is not configurable.
LAM and Integration Reference
This is a reference for the LAMs and UI integrations. The LAM configuration files are located at $MOOGSOFT_HOME/config/. See the individual LAM and integration configuration pages for the names of the files.
The configuration options for LAMs contain the following sections and properties. Some of these properties are configurable in UI integrations.
Monitor
name
Name of the LAM.
Type: String
Required: Yes
Default: Each LAM configuration contains a default name. Do not change.
class
Class of the LAM.
Type: String
Required: Yes
Default: Each LAM configuration contains a default class. Do not change.
expose_request_headers
Determines whether to include request HTTP headers in Cisco Crosswork Situation Manager events. If set to true, exposed headers are listed under the key moog_request_headers in events.
Type: Boolean
Required: No
Default: False
use_ssl
Enables Secure Sockets Layer (SSL) certification. If you set this to True, provide SSL certificate details.
Type: Boolean
Required: No
Default: False
path_to_ssl_files
Path to the directory that contains the SSL certificates. You can use a relative path based upon the $MOOGSOFT_HOME directory. For example the default config indicates $MOOGSOFT_HOME/config.
Type: String
Required: If use_ssl = true
Default: "config"
ssl_key_filename
Name of the SSL server key file.
Type: String
Required: If use_ssl is set to True
Default: N/A
ssl_cert_filename
Name of the SSL root CA file. Must reside in the location contained in path_to_ssl_files.
Type: String
Required: If use_ssl = true
Default: N/A
use_client_certificates
Defines whether to use SSL client certification.
Type: Boolean
Required: If use_ssl = true.
Default: False
client_ca_filename
Name of the SSL client CA file. Must reside in the location contained in path_to_ssl_files.
Type: String
Required: If use_client_certificates = true.
Default: N/A
ssl_protocols
Sets the allowed SSL protocols.
Type: Array
Required: If protocol = POP3S or IMAPS.
Valid protocols: SSLv3, TLSv1, TLSv1.1, TLSv1.2.
Default: [ "TLSv1.2" ]
auth_token
Authentication token in the request body. Can only be used when accept_all_json = false. If you define a token you must include it in the body of all requests. You can define auth_token or header_auth_token but not both.
Type: String
Required: No
Default: N/A
header_auth_token
Authentication token in the request header. Can only be used when accept_all_json = false. If you define a token you must include it in the header of all requests. You can define auth_token or header_auth_token but not both.
Type: String
Required: No
Default: N/A
encrypted_auth_token
Encrypted authentication token in the request body. Can only be used when accept_all_json = false. If you define a token you must include it in the body of all requests. Overrides auth_token.
Type: String
Required: No
Default: N/A
encrypted_header_auth_token
Encrypted authentication token in the request header. Can only be used when accept_all_json = false. If you define a token you must include it in the header of all requests. Overrides header_auth_token.
Type: String
Required: No
Default: N/A
authentication_type
Defines the authentication type the LAM uses.
Type: String
Required: Yes
basic - LAM uses the Graze login.
basic_auth_static - Use the static username and password set in the basic_auth_static property.
none - No authentication.
jwt - JSON Web Token authentication.
Default: Varies. See the individual LAM and integration configuration documents.
basic_auth_static
Defines the username and password used for authentication when authentication_type is set to basic_auth_static.
Type: String
Required: If authentication_type = basic_auth_static.
Default: N/A
jwt
Defines the claims the LAM uses when it creates JSON Web Tokens (JWT).
Type: String
Required: If authentication_type = jwt
Example:
jwt:
{
secretKey : "secret",
sub : "moogsoft",
iss : "moogsoft",
aud : "moogsoft",
jti : ""
}
secretKey
Key the LAM uses to validate JSON Web Tokens.
Type: String
Required: If authentication_type = jwt.
Default: N/A
sub
Subject the LAM uses to identify JSON Web Tokens.
Type: String
Required: No
Default: N/A
iss
Issuer the LAM uses to identify JSON Web Tokens.
Type: String
Required: No
Default: N/A
aud
Audience the LAM uses to identify JSON Web Tokens.
Type: String
Required: No
Default: N/A
jti
Identifier the LAM uses to iCisco Crosswork Situation Managerdentify JSON Web Tokens.
Type: String
Required: No
Default: N/A
authentication_cache
Defines whether a hashed version of a user's password is kept in the internal cache for the duration of the connection. If set to true it enables faster event handling. If set to false users are authenticated with each request.
Type: Boolean
Required: If authentication_type = basic.
Default: True
accept_all_json
When set to true, the LAM can read and process incoming requests using any valid form of JSON. The LAM and LAMbot configurations define the structure of the event. Set this property to false when you can structure incoming messages in the Cisco Crosswork Situation Manager format. Using the Cisco Crosswork Situation Manager format allows you to use the default LAM and LAMbot configuration to accept, convert and send incoming requests to the Message Bus. See REST LAM Examples for more information.
Type: Boolean
Required: No
Default: True
lists_contain_multiple_events
Defines whether a JSON list is interpreted as multiple events. Set to true to allow the LAM to accept structured events from a third party and convert them into Cisco Crosswork Situation Manager events.
Type: Boolean
Required: If accept_all_json = true.
Default: False
num_threads
Number of worker threads to use for processing events. If you have a large number of events and javascript logic, increase the number of threads. Also increase the thread count if a queue builds up in the LAMs. You can use the heartbeat monitor or Graze API to check the queue size.
Type: Integer
Required: No
Default: The number of available CPUs, up to a maximum of 8
rest_response_mode:
Determines when a REST response is sent for a request.
Type: String
Required: Yes
One of: on_receipt - Send a response when a valid event is received.
event_forwarded - Send a response when an event is sent to the Message Bus.
event_processed - Send a response when an event is processed by the Moogfarmd AlertBuilder Moolet.
Default: "event_processed"
rpc_response_timeout
The length of time to wait for a REST response from the Moogfarmd AlertBuilder Moolet, in seconds.
Type: Integer
Required: If rest_response_mode = event_processed.
Default: 20
event_ack_mode
Determines when Moogfarmd acknowledges events from the LAM.
Type: String
Required: Yes
One of: queued_for_processing: Acknowledge events when Cisco Crosswork Situation Manager adds them to the Moolet queue.
event_processed: Acknowledge events when a Moolet processes them.
Default: "queued_for_processing"
request_interval
Length of time to wait between requests, in seconds. Can be overridden by request_interval in individual targets.
Type: Integer
Required: No
Default: 60
max_retries
Number of times the LAM attempts to reconnect after connection failure. Used in conjunction with retry_interval.
Type: Integer
Required: No
Default: -1 (infinite retries)
retry_interval
Length of time to wait between reconnection attempts, in seconds. Used in conjunction with max_retries.
Type: Integer
Required: No
Default: 60
timeout
Length of time to wait before halting a connection or read attempt, in seconds.
Type: Integer
Required: No
Default: 120
max_lookback
Period of time for which to recover missed events, in seconds, when the LAM re-establishes a connection after a failure.
Type: Integer
Required: No
Default: -1 (recover all events since the last successful poll).
retry_recovery
Object containing properties which allow you to specify how the LAM recovers events that were missed during a connection outage. Comment out this object to recover all missed events with no imposed waiting time.
Type: Object
Required: No
Default: N/A
recovery_interval
Length of time to wait between requests, in seconds, when the LAM re-establishes a connection after a failure.
Type: Integer
Required: No
Default: 20
disable_certificate_validation
Specifies whether to disable SSL certificate validation. If set to true the data transmission between Cisco Crosswork Situation Manager and the external system is not protected by the encryption protocol. Works on chains that consist of more than one certificate.
Type: Boolean
Required: No
Default: False
proxy
Specifies connection details for a proxy server if you want to connect to the external system through a proxy. To use, uncomment the proxy section of the file and define the host, user, port, and password or encrypted password for the proxy. Not all properties are configurable in every LAM and integration.
Type: String
Required: No
Default: N/A
targets
This property is available in multi-target LAMs. It is a top-level container defining one or more target event sources. You can specify the configuration for each target. If you don't specify a request_interval the target uses the globally defined interval. See /document/preview/95030#UUIDc06d3f9c8b3d99f90b7227c2e2d8afae for more information.Data Parsing
Type: JSON Object
Required: Yes
Default: N/A
requests_overlap
If events meet the overlap_identity_fields matching criteria during this interval (in seconds), they are not treated as duplicates. Used to ensure that Cisco Crosswork Situation Manager does not miss valid events.
Type: Integer
Required: No
Default: N/A
overlap_identity_fields
A list of payload tokens the LAM uses to identify duplicate events when the source returns all open events and not just updated events. After the requests_overlapperiod the LAM treats events with the same overlap identity fields as duplicate events. The LAM identifies duplicates for each payload event in the previous request only. Identification is based on the token names of the returned payload, not the mapped names. For example, including $signature refers to this value in the payload, not event.value("signature").
Type: String
Required: If requests_overlap is enabled
Default: N/A
Datadog Polling LAM Example:
overlap_identity_fields: [ "id", "alert_type", "priority" ]
SevOne LAM Example:
overlap_identity_fields: [ "id", "severity", "closed", "number" ]
folder_path
Name of the folder containing the email messages.
Type: String
Required: Yes
Default: "INBOX"
retrieve
Specifies whether to receive all email messages or only unread messages.
Type: String
Required: Yes
One of: UNREAD, ALL
Default: "UNREAD"
retrieve_filter
Specifies one or more filters to limit the email messages to retrieve. The LAM concatenates field-level filters with the AND operator. For example, if you set a "To" filter and a "From" filter, a message must match both fields to meet the filter criteria. For each field, you can specify multiple values that the LAM joins with an OR operator. For example, if you set two email addresses for the "To" field, the message can match one or the other to meet the filter criteria.
Type: String
Required: No
Default: N/A
Example:
{
to : ["support@moogsoft.com", "support1@moogsoft.com"],
from : ["customer@abc.com", "customer@xyz.com"],
#recipient : [],
subject : ["Alert", "Event"],
#body : ""
}
to
A list of email addresses used to filter the "To" field in email messages. If multiple adresses are set, the email is retrieved if any of them match the "To" address.
Type: String
Required: No
Default: N/A
from
A list of email address used to filter the "From" field in email messages. If multiple addresses are set, the email is returned if any of them match the "From" address.
Type: String
Required: No
Default: N/A
recipient
A list of email addresses used to filter the "To", "CC" and "BCC" fields in email messages. If multiple addresses are set, the email is returned if any of them match the address in "To", "CC" or "BCC".
Type: String
Required: No
Default: N/A
subject
A list of strings used to filter the subject field in email messages. The email is returned if any of the strings are found in the subject. The matching is case-insensitive.
Type: String
Required: No
Default: N/A
body
A string used to filter the body in email messages. The email is returned if the string is found in the body. The matching is case-insensitive.
Type: String
Required: No
Default: N/A
mark_as_read
Marks unread emails as read.
Type: Boolean
Required: If retrieve = UNREAD
Default: False
delete_on_retrieve
Specifies whether to delete email messages on retrieval.
Type: Boolean
Required: No
Default: False
remove_html_tags
Type: Boolean
Required: No
Default: True
treat_body_as_json
Decodes the email body into a JSON object and makes it available for mapping under the $body key. Set to true if the body of retrieved email messages contain JSON objects only.
Type: Boolean
Required: No
Default: False
Agent
name
Identifies events the LAM sends to the Message Bus.
Type: String
Required: Yes
Default: "DATA_SOURCE"
log
Location of the LAM's capture log file. See /document/preview/11693#UUID6c5a18c5db3af17ad14c9a8382cd0dba for more information.Configure Logging
Type: String
Required: No
Default: N/A
Log Config
configuration_file
File that specifies the configuration of the LAM's process log. See /document/preview/11693#UUID6c5a18c5db3af17ad14c9a8382cd0dba for more information.Configure Logging
Type: String
Required: No
Default: "$MOOGSOFT_HOME/config/logging/integrations.log.json"
Integrations Default Ports
| LAM Name |
Port |
| Splunk |
48001 |
| OEM |
48002 |
| SCOM |
48003 |
| Dynatrace APM Plugin |
48004 |
| Ansible Tower |
48005 |
| Appdynamics |
48006 |
| Datadog |
48007 |
| Fluentd |
48008 |
| Nagios |
48009 |
| NewRelic |
48010 |
| Node.js |
48011 |
| Node-RED |
48012 |
| Pingdom |
48013 |
| Webhook |
48014 |
| HP OMi Plugin |
48015 |
| Dynatrace Notification |
48016 |
| AWS SNS |
48017 |
| Azure Classic |
48018 |
| Sumo Logic |
48019 |
| Azure |
48020 |
| ExtraHop |
48021 |
| Zabbix |
48023 |
| Catchpoint |
48024 |
| Site24x7 |
48025 |
| Sensu |
48026 |
LAMbot Configuration
LAMbots are JavaScript modules associated with every LAM. The LAMbots control the actions the LAM performs at startup and any necessary processing before forwarding objects to the Message Bus.
You can configure a LAMbot by modifying the functions and modules within its configuration file. The LAMbot files are located at $MOOGSOFT_HOME/bots/lambots.
LAMbot Functions
Each LAMbot includes an onLoad function that runs at startup and a presend function that processes and filters objects before sending them to the Message Bus.
REST-based LAMbotscall modifyResponse after they receive an object and convert it to JSON.
REST Client-based LAMbots call preClientSend before they send a request to a polled server and modifyResponse after a response is received from a polled server.
onLoad
Every instance of a LAMbot calls the onLoad function at startup. We recommend setting up shared values or lookup tables in the onLoad function. You can use it to initalize internal variables, load external JavaScript modules and set up structures needed for the filter function. For example:
var config = MooBot.loadModule('Config');
var moogUrl;
function onLoad()
{
var servletsConf = config.getConfig('servlets.conf');
if (servletsConf)
{
moogUrl = servletsConf.webhost;
}
}
The onLoad function:
· Stores the value of the servlets configuration in the config module to a variable "servletsConf".
· Sets the variable moogURL to the servlets webhost value.
presend
The LAMbot calls the presend function every time it assembles an object to publish on the Message Bus. Moogfarmd processes objects and turns them into alerts and Situations. An example presend function is:
function presend(event)
{
event.setCustomInfoValue("eventDetails",overflow);
if (overflow.LamInstanceName && (overflow.LamInstanceName === "DATA_SOURCE"))
{
delete overflow.LamInstanceName;
}
event.setCustomInfoValue("nodeSeverity", overflow.Severity);
event.setCustomInfoValue("nodeMachineType", overflow.MachineType);
event.setCustomInfoValue("nodeVendor", overflow.Vendor);
return true;
}
The presend function:
· Adds the overflow object as event details.
· Checks whether LamInstanceName is the default value DATA_SOURCE and if so, removes it from custom info.
· Saves three overflow fields to custom info.
· Returns a true response to indicate that the object will be passed to the Message Bus.
You can partition event streams into substreams for differential processing in a distributed environment. You can send a boolean response if the configuration dictates that all objects will or will not be sent to the bus.
Instead of a boolean response, you can configure the function to return a JSON object containing two members: "passed" which is either true or false, and "stream" which defines the substream to send the event. For example:
function presend(event)
{
return
({
"stream" : "my_stream",
"passed" : true
});
}
You can configure the event inside the presend function. For example you can:
· Change values
· Access lookup tables
· Add or remove key value bindings
· Access regular expressions
· Extract tokens
In the LAMbot, the following line instructs the LAM to use the presend function. It calls filterFunction using the global LamBot variable:
LamBot.filterFunction("presend");
The filterFunction function receives a string, which is the name of the function to use for filtering.
You define the presend processing file or stream in individual LAM configuration files. See "Filtering" in /document/preview/11720#UUID5c67156b667b1a28ec648cd779393914 for more information.Data Parsing
preClientSend
REST Client-based LAMbots call preClientSend before they send a request to a polled server. The function accepts an object and returns a modified version that is then sent by the Rest Client LAM. An example preClientSend function is:
function preClientSend(outBoundEvent)
{
outBoundEvent.set('method', 'Post');
var header = outBoundEvent.value('header');
header['Content-Type'] = 'application/json';
outBoundEvent.set('header', header);
var body = { 'events': 'all', 'type': { 'id': '12345', 'name': 'incident' } };
outBoundEvent.set('body', body);
return true;
}
The function generates a POST request with body type JSON.
In the LAMbot, the following line instructs the LAM to use the preClientSend function. It calls preClientSendFunction using the global LamBot variable:
LamBot.preClientSendFunction("preClientSend");
modifyResponse
You can modify the response sent by a REST-based LAMbot after it receives an object and a REST Client-based LAMbot after it receives a response from a polled server. An example modifyResponse function is:
function modifyResponse(inBoundEventData)
{
var response = JSON.parse(inBoundEventData.value('responseData'));
if (inBoundEventData.value('moog_target_name') == 'target1') {
response['manager'] = 'primary';
}
else {
response['manager'] = 'secondary';
}
inBoundEventData.set('responseData', JSON.stringify(response));
return true;
}
The function generates a different response depending on the name of the REST client target called.
In the LAMbot, the following line instructs the LAM to use the modifyResponse function. It calls modifyResponseFunction using the global LamBot variable:
LamBot.modifyResponseFunction("modifyResponse");
LAMbot Modules
You can load modules into a LAMbot to perform various tasks. The most commonly used modules are:
1. Logger: Cisco Crosswork Situation Manager components generate log files to report their activity.
2. Constants: Used to share logic, states and flags between LAMbots.
3. Utilities: A JavaScript utility used to escape and convert XML strings and JSON objects.
Define a global object to load a module into a LAMbot. For example:
var logger = LamBot.loadModule("Logger");
var constants = LamBot.loadModule("Constants");
var utilities = LamBot.loadModule("Utilities");
LAMs and High Availability
High Availability (HA) systems aim to minimize downtime and data loss. This is achieved with component redundancy to ensure there is no single point of failure, and ensure no loss of data or performance.
In the High Availability architecture of LAMs, we will have 2 clusters and each cluster contains an instance of the LAM. Only one LAM will be active at a time and the other will be set to passive. In case of a communication failure in the active LAM, a manual failover is initiated to the passive LAM, which will now send the data to MooMs. In the steps outlined below, 2 clusters, KINGSTON and SURBITON are used. The AWS LAM instance 1 in SURBITON is active and the AWS LAM instance 2 in KINGSTON is passive
Creating the HA configuration and switching the LAM in HA has following 2 steps:
1. Copying and creating an instance of LAM in 2 clusters and editing their respective configuration file
2. Manually initiating a failover of the LAM in case of communication failure in the active LAM
Copying and creating an instance of LAM in 2 clusters and editing their respective configuration file
We are taking the example of the AWS LAM, to provide HA for your LAM replace the AWS LAM with your LAM name and aws_lam.conf with the conf name of your LAM
An instance of the AWS LAM is created in each of the 2 clusters. The steps for creating the instances are as follows:
a. Set the following properties in the system.conf file located in the config folder, if it is already set then proceed to the next step:
a. message_persistence: true This setting is in the mooms section of the system.conf file. The message_persistence configuration controls whether MooMS will persist important messages or not and when set to true will ensure that two moog_farmds in the same process group share the relevant queues or servers, this allows failover in moog_farmd to ensure that the processing of Events is continuous. The default is 'false' if not specified
b. Create a copy of $MOOGSOFT_HOME/config/aws_lam.conf as $MOOGSOFT_HOME/config/aws_lam1.conf
c. Create another copy as $MOOGSOFT_HOME/config/aws_lam2. conf
d. Create a copy of /etc/init.d/awslamd as /etc/init.d/awslamd1, if the awslamd file is not in the init.d directory then it can be found in the /usr/share/moogsoft/etc/service-wrappers directory. After copying, perform the following steps in the awslamd1 file:
e. In the awslamd1 file, enter the path of the aws_lam1.conf in the CONFIG_FILE e.g. $MOOGSOFT_HOME/config/aws_lam1.conf field and enter the service name e.g. awslamd1 in the SERVICE NAME field
1. Edit the below given commands in the file with the instance and cluster properties at the end of the line of both "daemon" commands. For example, the instance name is AWS1 and cluster name is SURBITON in the below mentioned command lines
daemon --pidfile=$PID_FILE $MOOG_WRAPPER --home=$PROCESS_HOME --process=$PROCESS_NAME --config=$CONFIG_FILE--logfile=$LOG_FILE --pidfile=$PID_FILE --loglevel=$LOG_LEVEL --service_instance AWS1 --cluster SURBITON
daemon --pidfile=$PID_FILE --user=$PROCESS_OWNER $MOOG_WRAPPER --home=$PROCESS_HOME --process=$PROCESS_NAME --config=$CONFIG_FILE --logfile=$LOG_FILE --pidfile=$PID_FILE --loglevel=$LOG_LEVEL --service_instance AWS1 --cluster SURBITON
2. Now update the SERVICE_NAME in the /etc/init.d/awslamd1 file to be unique on that server, for example "AWS1"
3. Create a copy of /etc/init.d/awslamd as /etc/init.d/awslamd2, if the awslamd file is not in the init.d directory then it can be found in the /usr/share/moogsoft/etc/service-wrappers directory. After copying, perform the following steps in the awslamd2 file:
4. In the awslamd2 file, enter the path of the aws_lam2.conf in the CONFIG_FILE field e.g. $MOOGSOFT_HOME/config/aws_lam2.conf and enter the service name e.g. awslamd2 in the SERVICE NAME field
5. Edit the below given commands in the file with the instance and cluster properties at the end of the line of both "daemon" commands. For example, the instance name is AWS2 and cluster name is KINGSTON in the below mentioned command lines
daemon --pidfile=$PID_FILE $MOOG_WRAPPER --home=$PROCESS_HOME --process=$PROCESS_NAME --config=$CONFIG_FILE--logfile=$LOG_FILE --pidfile=$PID_FILE --loglevel=$LOG_LEVEL --service_instance AWS2 -- cluster KINGSTON
daemon --pidfile=$PID_FILE --user=$PROCESS_OWNER $MOOG_WRAPPER --home=$PROCESS_HOME --process=$PROCESS_NAME --config=$CONFIG_FILE --logfile=$LOG_FILE --pidfile=$PID_FILE --loglevel=$LOG_LEVEL --servise_instance AWS2 --cluster KINGSTON
f. Now update the SERVICE_NAME in the /etc/init.d/awslamd2 file to be unique on that server, for example "AWS2"
g. Under $MOOGSOFT_HOME/config directory edit the aws_lam1.conf file. If not present, then make a copy of aws_lam.conf file and rename it to aws_lam1.conf. Edit the following parameters in the file:
h. Enter the login details and the proxy details (if used) of the AWS server in the config file
i. Edit the HA section as per the example given below
ha:
{
cluster: "SURBITON",
group: "aws_lam",
instance: "aws",
duplicate_source: false,
default_leader: true,
only_leader_active: true,
accept_conn_when_passive: true
},
j. Under $MOOGSOFT_HOME/config directory edit the aws_lam2.conf file. If not present, then make a copy of aws_lam.conf file and rename it to aws_lam2.conf. Edit the following parameters in the file:
a. Enter the same configuration in it as given in aws_lam1.conf
b. Edit the ha section as per the example given below
ha:
{
cluster: "KINGSTON",
group: "aws_lam",
instance: "aws",
duplicate_source: false,
default_leader: true,
only_leader_active: true,
accept_conn_when_passive: true
} ,
k. Start both the services
service awslamd1 start
service awslamd2 start
l. In the ha section following fields can be configured:
a. cluster: The name of the Cluster. This supersedes anything set in system.conf (can also be overwritten by the command line)
b. group: The name of the Process Group. This defaults to the LAM process name if no value is specified (for example aws_lam)
c. instance: The name of the AWS LAM instance
d. duplicate_source: If set to true, it allows duplicate events from the same source.The default value is false
e. default_leader: A Boolean, indicating if the LAM is the Leader within its Process Group. The default value is true if not specified
f. only_leader_active: A Boolean that changes the type of process group from a Leader Only group to a Process Group where more than one process can be active
g. accept_conn_when_passive: A Boolean instructing the LAM what to do in Passive mode. If true (or not set), the LAM accepts incoming connections but discards any events received. If false, the LAM does not accept incoming connections
Manually initiating a failover of the LAM in case of communication failure of the active LAM
In the case of a communication failure the LAM has to be manually changed over to the passive LAM in another cluster by using the following command:
$MOOGSOFT_HOME/bin/ha_cntl -a KINGSTON.aws_lam
In the above case the AWS LAM process group from the SURBITON Cluster is changed over to the KINGSTON Cluster. Initially, the LAM in the SURBITON cluster was active and the LAM in KINGSTON cluster was passive. After executing the command the LAM in the KINGSTON cluster becomes active. The active LAM now publishes the events to MOOMs.
HA Configuration
High Availability (HA) systems aim to minimize downtime and protect against data loss and maintain performance. They use component redundancy to ensure there is no single point of failure.
In LAM High Availability architecture there are two clusters, each with an instance of the LAM. For an HA Polling pair LAM 1 and LAM 2 run in an active/passive mode for an HA Polling pair; if the active LAM fails, a manual failover is initiated to the passive LAM, which sends data to the message bus. For an HA Receiving pair, the LAMs run in active/active mode. See /document/preview/122128#UUID566270bbcbacff7a5e41f439e86aadf1 for more information.Install without Caching LAM
Consider the following cluster:
| Cluster |
Status |
| --instance AWS1 --cluster SURBITON |
active |
| --instance AWS2 --cluster KINGSTON |
passive |
Creating the HA configuration and switching the LAM has two steps:
1. LAM instance: copy and create an instance of the LAM in each of the two clusters and edit their respective configuration file.
2. Automatic failover: automatically initiate a failover of the LAM in case a failure occurs in the active LAM.
The following examples use the AWS LAM to demonstrate the configuration process.
LAM Instance
Create an instance of the LAM in each of the two clusters:
1. Copy the following files:
| File to copy |
Result |
| $MOOGSOFT_HOME/config/aws_lam.conf |
$MOOGSOFT_HOME/config/aws_lam1.conf |
|
|
$MOOGSOFT_HOME/config/aws_lam2.conf |
| /etc/init.d/awslamd *If this file is not in the init.d directory, look in $MOOGSOFT_HOME/etc/service-wrappers |
/etc/init.d/awslamd1 |
Perform the following steps in the awslamd1 configuration file:
a. In the CONFIGURATION section, enter the path of aws_lam1.conf, for example $MOOGSOFT_HOME/config/aws_lam1.conf.
b. In the SERVICE NAME field, enter the service name e.g. awslamd1.
2. Copy the awslamd.conf file:
| File to copy |
Result |
| /etc/init.d/awslamd.conf *If this file is not in the init.d directory, look here: /usr/share/moogsoft/etc/service-wrappers |
/etc/init.d/awslamd2.conf |
3. Perform the following steps in the awslamd2 file:
a. Enter the path of aws_lam2.conf, for example $MOOGSOFT_HOME/config/aws_lam2.conf.
b. Enter the service name e.g. awslamd2 in the SERVICE NAME field.
4. Edit the following parameters in aws_lam1.conf file:
a. Enter login and proxy details (if used) of the AWS server.
b. Edit the HA section with the following:
ha:
{
cluster: "SURBITON",
group: "aws_lam",
instance: "aws",
duplicate_source: false,
accept_conn_when_passive: true
}
5. Edit the following parameters in aws_lam2.conf file.
a. Enter the same configuration as given in aws_lam1.conf
b. Edit the ha section as follows:
ha:
{
cluster: "KINGSTON",
group: "aws_lam",
instance: "aws",
duplicate_source: false,
accept_conn_when_passive: true
}
6. Start both services:
service awslamd1 start
service awslamd2 start
Configurable Fields
The fields in the ha section of the LAM's configuration files are as follows:
| Field |
Description |
| cluster |
The name of the cluster. This supersedes anything set in system.conf (can also be overwritten by the command line). |
| group |
The name of the process group. This defaults to the LAM process name if no value is specified (for example aws_lam). |
| instance |
The name of the AWS LAM instance. |
| duplicate_source |
If set to true, drops duplicate events from the same source. Defaults to false. |
| accept_conn_when_passive |
If set to true, the passive LAM accepts incoming connections but discards any events received. |
Automatic Failover
Automatic failover enables the passive LAM to automatically take over from the active LAM if it fails.
To set up automatic failover:
1. On LAM 1 and LAM 2, edit the $MOOGSOFT_HOME/config/system.conf file and set the automatic_failover property to true:
# Allow a passive process to automatically become active if
# no other active processes are detected in the same process group
"automatic_failover" : true,
2. Restart the polling LAMs to finish enabling automatic failover.
Manual Failover
If you do not set up automatic failover, if the active LAM fails you must manually change over to the passive instance in another cluster. Use the following command to do so:
$MOOGSOFT_HOME/bin/ha_cntl -a KINGSTON.aws_lam
This changes the AWS LAM process group from the SURBITON cluster over to the KINGSTON cluster's process group, which will now publish incoming events to the message bus.
See /document/preview/77329#UUID9806780b990d278cc4a707cafe3a626f for a list of all HA-related commands.HA Control command reference
Brokers
A broker is a Cisco Crosswork Situation Manager entity that installs and runs monitoring integrations. You can deploy brokers to multiple hosts to provide continuous assurance of integrations you configure via the UI. Cisco Crosswork Situation Manager automatically manages instances of your integrations across your installed brokers.
By default, Cisco Crosswork Situation Manager automatically installs one broker per UI instance. For information on broker configuration brokers, see Create a Broker Profile.
The Deployment Status page displays the brokers on your system and their current status.
Click a broker to display the Broker Summary page, which includes a list of the integrations running on the broker. When you configure a new integration, Cisco Crosswork Situation Manager automatically assigns it to a broker.
If you create a new monitoring integration while no brokers are available, an error message displays and the integration will not start. After a broker becomes available you will still need to manually start the integration via an API request. See /document/preview/120790#UUID1ee4ec5ebf4065980541c71520e89010 for more information./integrations/{integrationId}/status
Create a Broker Profile
Each broker uses a profile which contains the connection information for other Cisco Crosswork Situation Manager components, such as the APIs, the database, and the Message Bus.
You use the broker-profiles endpoint of the integrations API to create a broker profile, for example:
<host>/integrations/api/v1/broker-profiles
Where <host> is the URL of the Cisco Crosswork Situation Manager instance you want to create the new profile on.
Before you begin
Before you create your new profile, ensure you have met the following requirements:
· You are running RHEL/CentOS 7.
· You have the values of the rabbit_config and mysql_config properties from the system.conf file. You can find the file in $MOOGSOFT_HOME/config.
· The ports you want to configure the profile on are open.
Request body
Endpoint broker-profiles takes the following properties:
| Name |
Type |
Required |
Description |
| name |
String |
Yes |
The name of the new broker. |
| config |
JSON Object |
Yes |
The top-level object containing the config attributes. |
| controller_url |
String |
Yes |
The URL of the integrations page on your instance, eg. "https://aiops.example.com/integrations" |
| port_range_min |
Integer |
Yes |
Minimum port number for the broker to use. |
| port_range_max |
Integer |
Yes |
Maximum port number for the broker to use. |
| rabbit_config |
JSON Objects |
Yes |
The top-level object containing the rabbit_config attributes. These should match your RabbitMQ broker configuration in system.conf |
| brokers |
String |
Yes |
The host and port of the RabbitMQ broker. |
| zone |
String |
Yes |
The name of the zone. |
| username |
String |
Yes |
The username of the RabbitMQ user. |
| password |
String |
Yes |
The password for the RabbitMQ user. |
| mysql_config |
JSON Objects |
Yes |
The top-level object containing the mysql_config attributes. |
| host |
String |
Yes |
The host name or server name of the server that is running MySQL. |
| moogdb_database_name |
String |
Yes |
The name of the primary Moogsoft AIOps database. |
| intdb_database_name |
String |
Yes |
The name of the moog_reference database |
| username |
String |
Yes |
The username of the MySQL user. |
| password |
String |
Yes |
The MySQL user's password. |
| port |
Integer |
Yes |
The port that MySQL uses. |
Response
The endpoint returns the following response:
| Type |
Description |
| HTTP |
HTTP status or error code indicating request success or failure. See HTTP status code definitions for more information. |
Examples
The following examples demonstrate typical use of endpoint broker-profiles.
Request Example
Example cURL request to https://aiops.example.com/integrations/api/v1/broker-profiles:
curl -X POST \
https://aiops.example.com/integrations/api/v1/broker-profiles \
-u john.doe:<password> \
-d '{
"name": "Main Broker Profile",
"config":
{
"controller_url": "https://aiops.example.com/integrations",
"port_range_min": 50000,
"port_range_max": 51000,
"rabbit_config":
{
"brokers": [
{
"host": "aiops.example.com",
"port": 5672
}
],
"zone": "zonex",
"username": "jdoe",
"password": "eg123"
},
"mysql_config":
{
"host": "aiops.example.com",
"moogdb_database_name": "moogdb",
"intdb_database_name": "moog_intdb",
"username": "janedoe",
"password": "123eg",
"port": 3306
}
}
}'
Response Example
A successful request returns the HTTP code 200 and no response text.
Example response returning details of the newly created profile:
{
"name": "Main Broker Profile",
"config":
{
"controller_url": "https://aiops.example.com/integrations",
"port_range_min": 50000,
"port_range_max": 51000,
"rabbit_config":
{
"brokers": [
{
"host": "aiops.example.com",
"port": 5672
}
],
"zone": "zonex",
"username": "jdoe",
"password": "eg123"
},
"mysql_config":
{
"host": "aiops.example.com",
"moogdb_database_name": "moogdb",
"intdb_database_name": "moog_intdb",
"username": "janedoe",
"password": "123eg",
"port": 3306
}
}
}
After creating a broker profile, you can use it with any broker you subsequently create in the Cisco Crosswork Situation Manager UI. See Create a Broker for more information.
Create a Broker
You can create additional brokers to run your integrations. By default, Cisco Crosswork Situation Manager installs one broker per UI instance. You may need to install additional brokers if:
· If you have installed a large volume of integrations.
· If you want to use a custom broker profile.
Before You Begin
Before you install your new broker, ensure you have met the following requirements:
· You have Java v11.0.2 installed and in your $PATH environment.
· Crontab exists and cron is running for the installing user. To install Java v11.0.2 and Crontab, you can run the following script: yum install -y cronie java-11-openjdk-devel*11.0.2* && echo "" | crontab - && crond start
· You have configured a broker profile. See Create a Broker Profile for more information.
· If you are not installing the broker to $MOOGSOFT_HOME, you have the necessary permissions to install it to your working directory.
· Ensure the host you install the broker on has low latency with the RabbitMQ host.
Create the Broker
To create a new broker:
1. Navigate to the Deployment Status page.
2. Click Get Broker Install Script to display the Broker Install Script page.
3. Using the drop-down menu, select the profile you want the broker to use.
4. Copy and run the installation command on your machine. The broker installs to $MOOGSOFT_HOME or if unset, your current working directory, for example /opt/local/moogsoft. On the Deployment Status page, the Status field indicates the install status of the new broker.
When the installation completes, the script notifies you of the broker's installation and Cisco Crosswork Situation Manager will begin using it alongside your other brokers to run integrations.
You can access the broker logs in $MOOGSOFT_HOME/config.
Integrations Controller
In order to run integrations, you must configure the Integrations Controller. The Integrations Controller provides basic configurations for all of the brokers and integrations in your Cisco Crosswork Situation Manager instance beyond the configurations assigned through broker profiles.
This is a reference for the Integrations Controller configuration file, which is located at $MOOGSOFT_HOME/config/controller.conf.
identifier
Unique name and identifier of the Integrations Controller.
| Type |
String |
| Required |
No |
| Default |
If not defined, an identifier is automatically generated on the first start up and defined in this file. |
host
Hostname for the webserver on the Integrations Controller. We recommend leaving this as 0.0.0.0
| Type |
String |
| Required |
Yes |
| Default |
0.0.0.0 |
port
Port for the webserver on this Integrations Controller. We recommend leaving this as 8086. If you change this, you will need to amend the integrations paths in your Nginx configurations to use the new port.
| Type |
String |
| Required |
Yes |
| Default |
8086 |
start_internal_broker
When true, starts a broker alongside the Integrations Controller.
| Type |
Boolean |
| Required |
Yes |
| Default |
true |
webhost
Address of the web host, used as the outwards facing URL for integrations.
| Type |
String |
| Required |
No |
| Default |
The value of the webhost field in the servlets.conf file. |
moogsvr_host
The address of moogsvr.
| Type |
String |
| Required |
Yes |
| Default |
The value of the webhost field. |
port_range_min and port_range_max
Port range for the Integrations Controller to use for integrations that are running on the internal broker. These ports must be open on the machines that brokers are running on.
| Type |
Integer |
| Required |
No |
| Default |
The values specified in system.conf. |
jwt
Configures the JSON web token (JWT) management for broker installation and communication with the Controller.
| Type |
Object |
| Required |
Yes |
| Default |
N/A |
| Valid Values |
See the secret_key, default_token_days_to_live, broker_init_token_days_to_live and token_leeway_seconds properties below. |
secret_key
Base 64 encoding of the secret key to sign JWT tokens. If you are running multiple instances of the Controller, you must synchronize the same key across your instances.
| Type |
String |
| Required |
No |
| Default |
If not defined, a secret key is automatically generated on the first start up and defined in this file. |
default_token_days_to_live
How many days a non-broker JWT remains active.
| Type |
Integer |
| Required |
Yes |
| Default |
1 |
broker_init_token_days_to_live
How many days a broker initialisation token remains active.
| Type |
Integer |
| Required |
Yes |
| Default |
7 |
token_leeway_seconds
How much leeway (in seconds) is given when checking a token's expiry.
| Type |
Integer |
| Required |
Yes |
| Default |
60 |
Example
An example Integrations Controller configuration is as follows:
{
# "identifier" : "UniqueID",
"host" : "0.0.0.0",
"port" : 8086,
"start_internal_broker" : true,
"webhost": "https://localhost",
"moogsvr_host": "http://localhost:8085",
"port_range_min": 50000,
"port_range_max": 51000,
"jwt" :
{
"secret_key" : "/9MiQ5gA+WKV1vp/Fo96fbZdQBY4IEh/TL4RbqPRF6M=",
"default_token_days_to_live" : 1,
"broker_init_token_days_to_live" : 7,
"token_leeway_seconds" : 60
}
}
Signature
Signature is the value Cisco Crosswork Situation Manager uses to deduplicate source events with the same context. Cisco Crosswork Situation Manager assigns a signature value to each event it ingests, constructed from a subset of the event fields. If Cisco Crosswork Situation Manager finds an event signature to be unique, it creates a new alert. Otherwise it adds the event to an existing alert with a matching signature.
After Cisco Crosswork Situation Manager deduplicates events into alerts, you can still access the individual event information from the alert timeline.
Most LAMs and integrations include a default signature mapping. If you are building a custom data ingestion or tweaking the default, you can use the fields of your choice to define the signature.
Why is Signature Important?
The composition of the signature is very important because it has a significant impact on what you see in the alert list.
The first time Cisco Crosswork Situation Manager ingests an event with a specific signature it creates a unique alert. If it ingests another event with a matching signature it deduplicates it into the same alert. Cisco Crosswork Situation Manager updates the alert timestamp and increments the alert count. This is very useful in reducing the number of alerts in the system.
Default Signatures
To view and edit default signatures for integrations configured in the Cisco Crosswork Situation Manager UI:
1. Go to Integrations and click the name of your installed integration in the left panel.
2. Click the Alert Noise Reduction tab and scroll down to the Signature Editor section.
This section displays the fields that can be used to create a baseline signature for this integration. You can edit the signature here to select different or additional fields. Click Use Recommended Fields to restore the recommended default.
You can view and edit default LAM signatures in LAM configuration files. For example, the SevOne configuration file $MOOGSOFT_HOME/config/sevone_lam.conf contains the following signature definition in the mapping rules:
{ name: "signature", rule: "$origin::$deviceId::$objectId" }
Signature Composition
A signature is made up of a subset of event properties. Different types of events require different signatures.
In general, fields to consider using in the signature are:
· Source, such as hostname
· Event type or class
· Static unique IDs
· Error code
· Impacted entities
Do not include fields in the signature that may change between events with the same context. For example:
· Timestamp
· State changes such as up or down
· Event count
· Variable unique IDs
· Severity
· Descriptions with changing content such as metrics
For example, every event has a different timestamp so including it in the signature effectively disables deduplication.
A perfect signature contains just enough information to identify the context of an event.
Signature Length and Concatenation
There is no restriction imposed on the length of signatures in raw events. Signatures longer than 746 characters are hashed at the alert level. This improves the manageability of signatures in the database but does not affect deduplication. The hashed signature length is 40 characters.
If you edit the signature in a LAM configuration file, concatenate multiple fields with two colons "::" to prevent misleading results. For example, if you concatenate source "Node A" and unique ID "1234" as "NodeA1234" this could potentially also match Node A1 and unique ID 234.
Example
The Email LAM uses the following default signature mapping:
$hostname::$subject
The Email LAM retrieves the following email messages in this order and sends them to Cisco Crosswork Situation Manager:
Event 1:
ip-172-22-97-140.ec2.internal::TDM 18 Remote Loss of Signal
Event 2:
ip-172-22-97-140.ec2.internal::TDM 18 Remote Loss of Signal
Event 3:
ip-172-22-99-144.ec3.internal::TDM 18 Remote Loss of Signal
Events 1 and 2 have an identical signature. Cisco Crosswork Situation Manager creates an alert for event 1 and deduplicates event 2 into the same alert. It creates a separate alert for event 3 which has the same subject but a different hostname.
UI Enrichment
In some cases, the raw alert data from your monitoring source is insufficiently usable. You can use the optional enrichment feature in the Cisco Crosswork Situation Manager UI to integrate alert data with other data sources. Enrichment can:
· Improve readability of alerts for operators.
· Improve accuracy for clustering alerts into Situations.
This topic covers enriching alerts with a static data file.
Before You Begin
Before you start to set up enrichment in the UI, ensure you have met the following requirements:
· You have logged into Cisco Crosswork Situation Manager as a user with the 'manage_integrations' role.
· You have the credentials to connect to MySQL and write to the database.
· You have prepared a .csv file containing the enrichment data you want to upload, as follows:
The first line contains the field names.
The values for one field match the values of a field in your raw alert data.
See the sample file below:
NameCode,SiteCode,Address,City,State,Zip
AB2,GAF,9384 Ornare Road,Lansing,Michigan,76690
CAV,GAF,133-5757 Sed Avenue,Racine,Wisconsin,42779
GX2,TES,5722 Nulla Avenue,Springfield,Massachusetts,29957
Enable Enrichment
Run the following MySQL command in the MoogDb database to enable enrichment:
UPDATE features
SET enabled = 1
WHERE feature_name = 'enrichment';
You can check that the feature was successfully enabled by running a command similar to the following:
SELECT feature_name, enabled
FROM features
WHERE feature_name = 'enrichment';
Configure the Moolets
Edit $MOOGSOFT_HOME/config/moolets/enricher.conf and make the following change:
1. Enable the Enricher Moolet to run on startup:
{
name : "Enricher",
classname : "com.moogsoft.farmd.moolet.enricher.CEnricherMgr",
run_on_startup : true,
metric_path_moolet : true,
process_output_of : "AlertBuilder",
description : "Alert Enrichment"
}
See Enricher Moolet for further information.Enricher Moolet
2. Edit $MOOGSOFT_HOME/config/moolets/maintenance_window_manager.conf and make the following change:
3. Set the Maintenance Window Manager Moolet to process the output of the Enricher:
{
name : "MaintenanceWindowManager",
classname : "CMaintenance",
run_on_startup : true,
metric_path_moolet : true,
process_output_of : "Enricher",
maintenance_status_field : "maintenance_status",
maintenance_status_label : "In maintenance",
update_captured_alerts : true
}
4. Save the changes and restart Moogfarmd. See Control Moogsoft AIOps Processes for more information.Control Processes
Create Custom Alert Fields
Create the custom_info alert fields to receive the enrichment data. You cannot update default alert fields with enrichment data.
Refer to the Alerts Columns instructions for further information on creating custom info alert fields.Alerts Overview
For example, if you want to enrich alerts with all of the data from the sample file, create custom info alert fields for NameCode, SiteCode, Address, City, State and Zip.
Upload an Enrichment File
Use the Integrations UI to upload your data source as follows:
1. Go to Integrations - Available Enrichments. The Available Enrichments link is only visible if Enrichment is enabled in the database.
2. Click Static Data.
3. Click Upload File, locate your .csv file and click Open.
4. This populates the Source Field drop-down lists under Define Lookup and Map Alert Fields with the field names in the first line of the .csv file.
5. Select the Source Field, which is a field in your .csv file, and the corresponding Alert Field to use for the lookup.
For example, the NameCode in the sample file could be used as a lookup against a custom_info alert field that contains the same data (AB2, CAV, GX2).
You can only define one lookup. You can select a custom alert field for the lookup or one of several default alert fields. Alert fields that cannot be used for the lookup do not appear in the drop-down list.
6. Click + to map the source fields in your .csv file that you want to include in alerts.
7. For each desired source field choose the destination alert field. Your custom_info alert fields will appear in the drop-down list.
You can't map source fields to default alert fields.
8. When you have mapped all of your alert fields, click Confirm to upload your data.
After you have completed the configuration, Cisco Crosswork Situation Manager adds enrichment data when it creates new alerts. It is not added to existing alerts.
Cisco Crosswork Situation Manager enriches alerts when it creates them. Subsequent updates to alerts do not trigger updates to the enriched data within the alerts.
Exit Codes
Integrations return the following Exit Codes for successful and unsuccessful requests:
| Exit Code |
Meaning |
| 0 |
Expected exit. |
| 1 |
A general error occurred. |
| 2 |
Misuse of shell built-ins. |
| 3 |
The integration failed to start up. |
| 4 |
An unknown error occurred during the integration's startup. |
| 5 |
Failed to load the integration's configuration. |
| 7 |
Failed to parse the integration's configuration. |
| 8 |
Failed to create the request for the integration's configuration. |
| 9 |
Invalid mapping config. |
| 10 |
Invalid event stream in config. |
| 11 |
The integration name has not been specified. |
| 12 |
RabbitMQ configuration is missing from system.conf. |
| 13 |
Failed to initialize connection to RabbitMQ. |
| 14 |
Failed to initialize connection to RabbitMQ with SSL. |
| 15 |
Failed to initialize the integration's monitor. |
| 16 |
Failed to initialize the integration's extractor. |
| 17 |
Failed to initialize the integration's failover thread. |
| 50 |
Required native library is missing. |
| 51 |
Event factory thread pool is unavailable. |
| 52 |
The integration could not send heartbeats to the Integrations Controller. |
| 71 |
Using a database in a lambot is prohibited. |
| 72 |
Using MooMS in a lambot is prohibited. |
| 91 |
The file to monitor was not found. |
| 92 |
An error occurred while monitoring the file. |
| 93 |
HTTP Server failed to start up. |
| 94 |
Failed to bind port for SNMP. |
Ansible Tower
To integrate with Red Hat Ansible Tower, configure a Webhook to send Ansible Tower notifications to Cisco Crosswork Situation Manager.
See the Ansible Tower documentation for details on its components.
Before You Begin
The Ansible Tower integration has been validated with Ansible Tower v3.0 and 3.1. Before you start to set up your integration, ensure you have met the following requirements:
· You have an Ansible Tower account with administrator privileges.
· Ansible Tower can make requests to external endpoints over port 443.
Configure the Ansible Tower Integration
To configure the integration:
1. Navigate to the Integrations tab.
2. Click Ansible Tower in the Monitoring section.
3. Follow the instructions to create an integration name.
Configure Ansible Tower
Log in to Ansible Tower to configure a notification template to send event data to your system. For more help, see the Ansible Tower documentation.
1. Create a new notification template under 'Notifications' in Settings.
2. Configure the template as follows:
| Field |
Value |
| Name |
Event Webhook |
| Description |
Event notifications |
| Organization |
Default |
| Type |
Webhook |
| Target URL |
<your Ansible Tower integration URL> For example: https://example.Cisco.com/events/ansibletower_ansibletower1 |
| User ID |
Username generated in the Cisco Crosswork Situation Manager UI |
| Password |
Password generated in the Cisco Crosswork Situation Manager UI |
3. Encode the 'userid:password' in a Base64 encoder and enter the following under 'HTTP Headers':
{
"Content-Type": "application/json",
"Authorization": "Basic <base64 encoded credentials>"
}
4. Save the template. You can test the notification to verify if there are any issues.
5. Connection the notification to a job template.
After you complete the configuration, Ansible Tower notifies Cisco Crosswork Situation Manager when new events occur.
Apache Kafka
You can install the Apache Kafka integration to enable Cisco Crosswork Situation Manager to collect event data from Kafka. After you have installed and configured the Kafka Integration, Kafka will push messages to the integration for the subscribed topics.
See the Kafka documentation for details on Kafka components.
Before You Begin
The Kafka integration has been validated with Kafka v0.9 and 1.1. Before you start to set up your Kafka integration, ensure you have met the following requirements:
· You have the URL for your Kafka system.
· The port for your Kafka broker is open and accessible from Cisco Crosswork Situation Manager .
· You know the name of the topics for the system to subscribe to.
· You have the group ID of the consumer group.
· If you want to fetch events from specific topics in the Kafka broker, you know the names of these topics.
Configure the Kafka Integration
To configure the Kafka integration:
1. Navigate to the Integrations tab.
2. Click Kafka in the Monitoring section.
3. Follow the instructions to create an integration name and supply the connection information for Kafka.
See Configure the Kafka LAM for advanced configuration information.
Configure Kafka
You do not need to perform any integration-specific steps on your Kafka system. After you configure the integration, it polls Kafka at regular intervals to collect event data from the subscribed topics (every 60 seconds by default).
Configure the Kafka LAM
Apache Kafka is used for building real-time data pipelines and streaming apps. Kafka runs as a cluster of one or more servers. The Kafka cluster, stores stream of records in categories called topics and each record consists of a key, a value, and a time-stamp.
You can install a basic Kafka integration in the UI. See Apache Kafka for integration steps.
Before You Begin
The Kafka integration has been validated with Kafka v0.9 and 1.1. Before you start to set up the LAM, ensure you have met the following requirements:
· You have the URL for your Kafka system.
· The port for your Kafka broker is open and accessible from Cisco Crosswork Situation Manager .
· You know the name of the topics for the system to subscribe to.
· You have the group ID of the consumer group.
· If you want to fetch events from specific topics in the Kafka broker, you know the names of these topics.
Configure the LAM
Edit the configuration file to control the behavior of the Kafka LAM. You can find the file at $MOOGSOFT_HOME/config/kafka_lam.conf.
The configuration file contains a JSON object. At the first layer of the object, the LAM has a parameter called config, and the object that follows config has all the necessary information to control the LAM.
See /document/preview/140542#UUIDa752d32ccb7814ddd9f7a77ac64a68d8 and LAM and Integration Reference for a full description of all properties. Some properties in the file are commented out by default; remove the '#' character to enable them.Kafka Reference
1. Configure the connection properties:
a. kafka_listener: The hostname along with the port of the Kafka broker.
b. topic_name: The name of the topic(s) in the Kafka broker you are consuming events from.
c. groupid: The name of the consumer group.
2. Configure SSL if you want to encrypt communications between Kafka and Cisco Crosswork Situation Manager :
a. ssl_connection: Set to true to enable SSL communication.
b. ssl_truststore_filename: The path of the truststore certificate.
c. ssl_truststore_password: The password for the truststore certificate.
d. ssl_keystore_filename: The path of the keystore certificate.
e. ssl_keystore_password: The password for the keystore certificate.
f. ssl_key_password: The password for the client certificate required in client authentication. It is the password entered in the ssl.key.password of the Kafka server.properties file.
3. Configure the kafka_properties section, which allows you to use Kafka consumer properties. Note that these take priority over the aforementioned SSL properties:
a. ssl.endpoint.identification.algorithm: The endpoint identification algorithm used by clients to validate server host name.
b. sasl.mechanism: The SASL mechanism method for the Kafka broker to use.
c. security.protocol: The security protocol to use.
d. sasl.jaas.config: The type of JAAS authentication configuration to use for the Kafka broker.
e. sasl.login.refresh.window.factor: If using OAUTHBEARER, the login refresh thread will sleep until the specified window factor relative to the credential's lifetime has been reached, at which time it will attempt to refresh the credential.
f. sasl.login.refresh.window.jitter: The maximum amount of random jitter relative to the credential's lifetime that is added to the login refresh thread's sleep time.
g. sasl.login.refresh.min.period.seconds: The desired minimum time (in seconds) for the login refresh thread to wait before refreshing a credential.
h. sasl.login.refresh.min.buffer.seconds: The amount of buffer time (in seconds) to maintain before credential expiration when refreshing a credential.
i. sasl.kerberos.service.name: The Kerberos service name.
See the Apache Kafka documentation for more information on these properties.
4. Configure parsing and tokenisation. See the "Parsing and Tokenisation" section below for more information.
5. Optionally configure the LAM identification and logging details in the agent and log:
a. name: Identifies events the LAM sends to the Message Bus.
b. capture_log: Name and location of the LAM's capture log file.
c. configuration_file: Name and location of the LAM's process log configuration file.
6. Optionally configure severity conversions. See /document/preview/11721#UUID8b183a1e1278a7a652d3ae86944d7379 for further information and "Conversion Rules" in /document/preview/95030#UUIDc06d3f9c8b3d99f90b7227c2e2d8afae for details on conversions in general.Severity ReferenceData Parsing
Parsing and Tokenisation
Note:
The parsing section is used when the event format is a text message; if you have an event with JSON format then comment the parsing and the variables sections and uncomment builtInMapper: "CJsonDecoder" in the Mapping section of kafka_lam.conf.
The parsing section is used for parsing the received event and tokenising it.
The Kafka LAM receives data in two formats:
· Text: The data is received in text format which can be parsed and tokenised in the Parsing section and then mapped to Cisco Crosswork Situation Manager fields in the Variables and the Mapping section.
· JSON: The data is received in a JSON format, which can be mapped directly using CJsonDecoder. The parsing and the variable section are not required for JSON format.
Parsing
The following two methods are available for parsing:
· Text Message: The parsing will start when it gets NEW_MSG and end when it gets new line. The extracted string is then delimited as per the defined delimiters.
To enable this method set type to start_and_end and then configure the start and end fields.
· Regular Expression: The parser searches a regular expression for the strings you define in the pattern field and delimits them in accordance with your configuration of delimiters.
To enable this method set type to regexp.
Only use one parsing method at a time, commenting out the ones you are not using.
Tokenisation
The parsed events are tokenised using either delimiters or the regexp_subgroups. See the /document/preview/140542#UUIDa752d32ccb7814ddd9f7a77ac64a68d8 for more information.Kafka Reference
Variables
Note:
The variable section is used when the received event message type is TextMessage; a JSON event can be mapped directly to the Moog field in the Mapping section.
A received event is a positioned collection of tokens. The variables section enables you to name these positions. The naming of the positions helps you to identify the tokens.
Positions start at 1 and increase. In the example below, the token in position number 6 is a Manager name, so the user names the token as "Manager". The naming helps in mapping the tokens to the Cisco Crosswork Situation Manager fields in the mapping section.
variables:
[
{ name: "signature", position: 1 },
{ name: "source_id", position: 4 },
{ name: "external_id", position: 3 },
{ name: "Manager", position: 6 },
{ name: "AlertGroup", position: 7 },
{ name: "Class", position: 8 },
{ name: "Agent", position: 9 },
{ name: "severity", position: 5 },
{ name: "description", position: 10 },
{ name: "agent_time", position: 2 }
],
Map LAM Properties
For events received in JSON format, you can directly map the event fields of Kafka. In the case of an event received in text format, the event is first tokenised in the Variable section, and the tokenised event is then mapped here. The parameters of the received events are displayed in Cisco Crosswork Situation Manager accordingly.
| Kafka Event Property |
Kafka LAM Event Property |
| Agent |
$LamInstanceName |
| Agent Location |
$agent_location |
| Agent Time |
$agent_time |
| Class |
$class |
| Description |
$description |
| External ID |
$external_id |
| Manager |
Kafka |
| Severity |
$severity |
| Signature |
$signature |
| Source ID |
$source_id |
| Type |
$type |
The above example specifies the mapping of the Kafka alarm fields with the Cisco Crosswork Situation Manager fields.
Example
An example Kafka LAM configuration is as follows:
monitor:
{
name: "Kafka Lam Monitor",
class: "CKafkaMonitor",
kafka_listener: "localhost:9092",
topic_name: [
"topic1",
"topic2"
],
groupid: "consumer-group",
ssl_connection: false
}
parsing:
{
type: "start_and_end",
start_and_end:
{
start: [],
end: ["\n"],
delimiters:
{
ignoreQuotes: true,
stripQuotes: true,
ignores: "",
delimiter: [",","\r"]
}
}
},
#parsing:
#{
#type: "regexp",
#regexp:
#{
#pattern : "(?mU)^(.*)$",
#capture_group: 1,
#tokeniser_type: "delimiters",
#delimiters:
#{
#ignoreQuotes: true,
#stripQuotes: false,
#ignores: "",
#delimiter: ["\r"]
#}
#}
#},
variables:
[
{ name: "signature", position: 1 },
{ name: "source_id", position: 4 },
{ name: "external_id", position: 3 },
{ name: "Manager", position: 6 },
{ name: "AlertGroup", position: 7 },
{ name: "Class", position: 8 },
{ name: "Agent", position: 9 },
{ name: "severity", position: 5 },
{ name: "description", position: 10 },
{ name: "agent_time", position: 2 }
],
mapping :
{
builtInMapper: "CJsonDecoder",
catchAll: "overflow",
rules:
[
{ name: "signature", rule: "$signature" },
{ name: "source_id", rule: "$source_id" },
{ name: "external_id", rule: "$external_id" },
{ name: "manager", rule: "Kafka" },
{ name: "source", rule: "$source" },
{ name: "class", rule: "$class" },
{ name: "agent", rule: "$LamInstanceName" },
{ name: "agent_location", rule: "$agent_location" },
{ name: "type", rule: "$type" },
{ name: "severity", rule: "$severity", conversion: "sevConverter" },
{ name: "description", rule: "$description" },
{ name: "agent_time", rule: "$agent_time" }
]
},
}
,log_config:
{
configuration_file: "$MOOGSOFT_HOME/config/logging/custom.log.json"
}
}
Configure for High Availability
Configure the Kafka LAM for high availability if required. See /document/preview/77155#UUIDbea404d9dd1afee65fa1471105d1b3c6 for details.High Availability Overview
Configure LAMbot processing
The Kafka LAMbot processes and filters events before sending them to the Message Bus. You can customize or bypass this processing if required. You can also load JavaScript files into the LAMbot and execute them.
See LAMbot Configuration for more information. An example Kafka LAM filter configuration is shown below.
filter:
{
presend: "KafkaLam.js",
}
Start and Stop the LAM
Restart the Kafka LAM to activate any changes you make to the configuration file or LAMbot.
The LAM service name is kafkalamd.
See /document/preview/11677#UUID1a2205c3aae40b26fdfe94490043f3c3 for the commands to start, stop and restart the LAM.Control Processes
AppDynamics
The AppDynamics integration allows you to retrieve events from AppDynamics and send them to Cisco Crosswork Situation Manager.
When you use the integrations UI, you can only configure the visible properties. If you want to implement a more complex AppDynamics LAM with custom settings, see Configure the AppDynamics LAM
See the AppDynamics documentation for details on AppDynamics components.
Before You Begin
Before you start to set up your AppDynamics integration, ensure you have met the following requirements:
· You have an active AppDynamics account.
· You have the necessary permissions to configure Alert and Respond templates, actions, and policies in AppDynamics.
· AppDynamics can make requests to external endpoints over port 443.
Configure the AppDynamics Integration
You can configure the AppDynamics integration in Cisco Crosswork Situation Manager as follows:
1. Navigate to the Integrations tab.
2. Click AppDynamics in the Monitoring section.
3. Follow the instructions to create an integration name.
See Configure the AppDynamics LAM for advanced configuration information.
Configure AppDynamics
Log in to AppDynamics to configure the Alert and Respond system to send event data to your system. For more help, see the AppDynamics documentation.
1. Create an HTTP request template in the AppDynamics Alert and Respond UI as follows:
| Template Field |
Value |
| Request URL endpoint |
|
| Method |
POST |
| Name |
Alert Post |
| Request URL |
https://<hostname>/events/appdynamics_<integration_name> The integration name is the name created in the previous section. |
| URL-Encoding |
UTF 8 |
| Enable authentication |
|
| Authentication Type |
BASIC |
| User ID |
Username generated in the Cisco Crosswork Situation Manager UI. |
| Password |
Password generated in the Cisco Crosswork Situation Manager UI. |
| Custom request header |
|
| Header |
Content-Type |
| Value |
application/json |
| Payload |
|
| MIME Type |
application/json |
| Payload Encoding |
UTF-8 |
| Payload text |
Add the contents of this file to the field |
| Response Handling Criteria |
|
| Failure |
Status Codes 400, 401, 405, and 406 |
| Success |
Status Code 200 |
| Settings |
|
| One Request Per Event |
True |
| Connect timeout |
5000 |
| Socket timeout |
5000 |
2. You can test the HTTP Template with the following options:
a. Set the Log Level to Debug.
b. Add an Event type of Health Rule Violation Started - Warning
3. For each AppDynamics business application you want to report events to your system create an action in AppDynamics.
Action Type: Make an HTTP Request
| Action Field |
Value |
| Name |
Send Alerts |
| Template |
Alert Post |
4. For each AppDynamics business application that should report events to your system, create a policy in AppDynamics that applies the "Send to AIOps" action to health rules.
| Policy Field |
Value |
| Trigger Tab |
|
| Name |
Send Events |
| Enabled check box |
Yes |
| Health Rule Violation Events |
Select all required |
| Actions Tab |
|
| Action |
Send Alerts |
After you complete the AppDynamics configuration, AppDynamics reports event data to your system for the relevant health rule violations.
Configure the AppDynamics LAM
The AppDynamics LAM is an endpoint for HTTP notifications from AppDynamics alerts. The LAM parses the alerts from AppDynamics into Cisco Crosswork Situation Manager events.
You can install a basic AppDynamics integration in the UI. See AppDynamics for integration steps.
Configure the AppDynamics LAM if you want to configure custom properties, set up high availability or configure advanced options that are not available in the UI integration.
Before You Begin
Before you configure the AppDynamics LAM, ensure you have met the following requirements:
· You have an active AppDynamics account.
· You have the necessary permissions to configure Alert and Respond templates, actions, and policies in AppDynamics.
· AppDynamics can make requests to external endpoints over port 443.
If you are configuring a distributed deployment refer to /document/preview/77155#UUIDbea404d9dd1afee65fa1471105d1b3c6 first. You will need the details of the server configuration you are going to use for HA.High Availability Overview
Configure the LAM
Edit the configuration file to control the behavior of the AppDynamics LAM. You can find the file at $MOOGSOFT_HOME/config/appdynamics_lam.conf
The AppDynamics LAM is a REST-based LAM as it provides an HTTP endpoint for data ingestion. Note that only the generic REST LAM properties in appdynamics_lam.conf apply to integrating with AppDynamics; see the LAM and Integration Reference for a full description of all properties.
Some properties in the file are commented out by default. Uncomment properties to enable them.
1. Configure the connection properties for the REST connection:
a. address: Address on the Cisco Crosswork Situation Manager server that listens for REST messages. Defaults to all interfaces.
b. port: Port on the Cisco Crosswork Situation Manager server that listens for REST messages. Defaults to 48006.
2. Configure authentication:
a. authentication_cache: Whether to cache the username and password for the current connection when the authentication type is Basic.
3. Configure the SSL properties if you want to encrypt communications between the LAM and the REST connection:
a. use_ssl: Whether to use SSL certification.
b. path_to_ssl_files: Path to the directory that contains the SSL certificates.
c. ssl_key_filename: SSL server key file.
d. ssl_cert_filename: SSL root CA file.
e. use_client_certificates: Whether to use SSL client certification.
f. client_ca_filename: SSL client CA file.
g. auth_token or encrypted_auth_token: Authentication token in the request body.
4. Configure the LAM behavior:
a. num_threads: Number of worker threads to use.
b. rest_response_mode: When to send a REST response. See the LAM and Integration Reference for the options.
c. rpc_response_timeout: Number of seconds to wait for a REST response.
5. Optionally configure the LAM identification and logging details:
a. name: Identifies events the LAM sends to the Message Bus.
b. capture_log: Name and location of the LAM's capture log file.
c. configuration_file: Name and location of the LAM's process log configuration file.
6. Optionally configure severity conversion. See /document/preview/11721#UUID8b183a1e1278a7a652d3ae86944d7379 for further information and "Conversion Rules" in /document/preview/11720#UUID5c67156b667b1a28ec648cd779393914 for details on conversions in general.Severity ReferenceData Parsing
Example
The following example demonstrates an AppDynamics LAM configuration.
monitor:
{
name : "App Dynamic Lam Monitor",
class : "CRestMonitor",
address : "0.0.0.0",
port : 48006,
use_ssl : false,
#path_to_ssl_files : "config",
#ssl_key_filename : "server.key",
#ssl_cert_filename : "server.pem",
#use_client_certificates : false,
#client_ca_filename : "ca.crt",
#auth_token : "my_secret",
#encrypted_auth_token : "dfJtTQMGiFHfiq7sCmxguBt6Jv+eytkoiKCquSB/7iWxpgGsG2aez3z2j7SuBtKj",
authentication_type : "none",
authentication_cache : true,
accept_all_json : true,
lists_contain_multiple_events : true,
num_threads : 5,
rest_response_mode : "on_receipt",
rpc_response_timeout : 20
},
agent:
{
name : "AppDynamics",
capture_log : "$MOOGSOFT_HOME/log/data-capture/appdynamics_lam.log"
},
log_config:
{
configuration_file : "$MOOGSOFT_HOME/config/logging/appdynamics_lam_log.json"
},
Configure for High Availability
Configure the AppDynamics LAM for high availability if required. See /document/preview/77155#UUIDbea404d9dd1afee65fa1471105d1b3c6 for details.High Availability Overview
Configure LAMbot Processing
The AppDynamics LAMbot processes and filters events before sending them to the Message Bus. You can customize or bypass this processing if required. You can also load JavaScript files into the LAMbot and execute them.
An example AppDynamics LAM filter configuration is shown below.
filter:
{
presend: "AppDynamicsLam.js",
modules: [ "CommonUtils.js" ]
}
Check the account, policy and action properties in the AppDynamics LAMbot configuration file located at $MOOGSOFT_HOME/bots/lambots/AppDynamicsLam.js:
var includeAccountInfo=true;
var includePolicyInfo=true;
var includeActionInfo=true;
By default these properties are set to true so Cisco Crosswork Situation Manager creates events that include the account, policy and action information received from AppDynamics. You can set the properties to false to omit this data from events.
See LAMbot Configuration for more information.
Start and Stop the LAM
Restart the AppDynamics LAM to activate any changes you make to the configuration file or LAMbot.
The LAM service name is appdynamicslamd.
See /document/preview/11677#UUID1a2205c3aae40b26fdfe94490043f3c3 for the commands to start, stop and restart the LAM.Control Processes
You can use a GET request to check the status of the AppDynamics LAM. See "Check the LAM Status" in Configure the REST LAM for further information and examples.
Configure AppDynamics
After you have the AppDynamics LAM running and listening for incoming requests, you can configure AppDynamics. See "Configure AppDynamics" in AppDynamics.
If you have a large AppDynamics implementation you can use the AppDynamics Configuration Exporter utility to copy the same configuration across multiple applications and controllers. Contact AppDynamics Support for more information.
AWS
You can integrate Cisco Crosswork Situation Manager with Amazon Web Services (AWS) via two products. Choose your integration process below according to your AWS environment:
· AWS CloudWatch: Use this integration to collect event and alarm data from AWS CloudWatch.
· AWS SNS: Use this integration to post AWS Simple Notification Service data to Cisco Crosswork Situation Manager when a CloudWatch alarm is triggered.
AWS CloudWatch
You can install the Amazon Web Services (AWS) CloudWatch integration to collect event and alarm data from AWS CloudWatch.
See the AWS CloudWatch documentation for details on AWS CloudWatch components.
Before You Begin
The AWS CloudWatch integration has been validated with aws-java-sdk v1.11. Before you start to set up your integration, ensure you have met the following requirements:
· You have the access key ID and secret access key for your AWS CloudWatch account.
· You have access to retrieve data from AWS CloudWatch.
Additionally, you can provide optional configuration details. See the LAM and Integration Reference for a description of all properties.
Configure the AWS CloudWatch Integration
To configure the AWS CloudWatch integration:
1. Navigate to the Integrations tab.
2. Click AWS CloudWatch in the Monitoring section.
3. Provide a unique integration name. You can use the default name or customize the name according to your needs.
4. Provide connection details for your AWS CloudWatch system.
Configure AWS CloudWatch
You do not need to perform any integration-specific steps on your AWS CloudWatch system. After you configure the integration, it polls AWS CloudWatch at regular intervals to collect event and alarm data (every 60 seconds by default).
Configure the AWS CloudWatch LAM
CloudWatch is the monitoring tool for Amazon Web Services (AWS), its applications and other cloud resources. AWS CloudWatch is useful for tracking metrics, collecting log files, setting alarms, and reacting to changes in your AWS resources. It monitors resources including Amazon EC2 instances, Amazon DynamoDB tables, and Amazon RDS DB instances.
See AWS CloudWatch for UI configuration instructions.
The AWS integration fetches alarms and events from the AWS CloudWatch. The workflow of gathering alarms/events from AWS and publishing it to Cisco Crosswork Situation Manager is as follows:
1. AWS LAM reads the configuration from the aws_lam.conf file.
2. AWS LAM reads credentials and region of AWS from the config file and requests Amazon Web Services for alarms/events.
3. The AWS LAM parses the received alarms/events and converts it into a map and submits it to Event Factory.
4. The events are parsed and converted into normalized Cisco Crosswork Situation Manager events.
5. The normalized events are then published to MooMS bus.
Configuration
The alarms/events received from AWS are processed according to the configuration in the awl_lam.conf file. The processed alarms are published to Cisco Crosswork Situation Manager.
The configuration file contains a JSON object. At the first layer of the object, LAM has a parameter called config, and the object that follows config has all the necessary information to control the LAM.
Monitor
The AWS LAM takes alarm and event data from the AWS CloudWatch. To establish a connection with AWS, you can configure the parameters here:
General
| Field |
Type |
Description |
| name and class |
String |
Reserved fields: do not change. Default values are AWS Monitor and CAwsMonitor. |
| access_key_id |
String |
Enter the Access Key ID received at the time of creating the AWS account. |
| encrypted_access_key_id |
String |
If the access key ID is encrypted, then enter the encrypted access key id in this field and comment out the access_key_id field. Either access_key_id or the encrypted_access_key_id field is used. If both fields are not commented, then only encrypted_access_key_id will be used. |
| Secret_access_key |
String |
Enter the Secret Access key received at the time of creating the AWS account. |
| encrypted_secret_access_key |
String |
If the secret access key ID is encrypted, then enter the encrypted password in this field and comment out the secret_access_key_id field. Either secret_access_key_id or the encrypted_secret_access_key_id field is used. If both fields are not commented then the field encrypted_secret_access_key_id is used. |
| proxy |
Object |
Uncomment this section if you want to use a proxy for communication with AWS and complete the following fields: host: Enter the host name or the URL of the proxy. port: Enter the port of the proxy. user: Enter the username of the user who has the rights to access the proxy. password: Enter the password of the user whose user name is given in the proxy_userid field. encrypted_password: If the proxy password is encrypted, then enter the encrypted password in this field and comment out the proxy_password field. If both fields are uncommented, then only the field encrypted_proxy_password will be used. |
| polling_interval |
Integer |
The polling time interval, in seconds, between the requests after which the event data is fetched from the AWS. Default = 60 seconds. If specified value is less than 1, the polling_interval will set to 60 seconds. |
| max_retries |
Integer |
The maximum number of retry attempts to reconnect with AWS server in case of a connection failure. Default = -1, if no value is specified, then there will be infinite retry attempts. If the specified value is greater than 0, then the LAM will try that many times to reconnect; in case of any other value less than 0, max retries will set to default. |
| retry_interval |
Integer |
The time interval between two successive retry attempts. Default = 60 seconds, if specified value is less than 1,retry_interval will set to 60 seconds. |
| retry_recovery |
Object |
Specifies the behavior of the LAM when it re-establishes a connection after a failure. - recovery_interval: Length of time to wait between recovery requests in seconds. Must be less than the request_interval set for each target. Defaults to 20. - max_lookback: The period of time for which to recover missed events in seconds. Defaults to -1 (recover all events since the last successful poll). |
| timeout |
Integer |
This is the timeout value in seconds, which will be used to timeout a connection, socket and request. If no value is specified, then the time interval will set to to 120 seconds. |
| exclude_protected_regions |
Boolean |
When set to true, US Government and Chinese regions are excluded when "aws_all_regions" is used in either the alarms or events filter. By default, all regions are included. |
Note:
Below are the minimum access levels required for a user to retrieve data from the AWS:
AmazonEC2ReadOnlyAccess
CloudWatchLogsReadOnlyAccess
CloudWatchReadOnlyAccess
Secure Sockets Layer
| Field |
Type |
Description |
| ssl |
Boolean |
Set to true, to enable SSL Communication: ssl_keystore_file_path: Enter the path of the keystore file. This is the path where the generated keystore file is copied e.g. "/usr/local/aws_ssl/keystore.jks". ssl_keystore_password: Enter the password of keystore. It is the same password that was entered when the keystore was generated. |
Filter
| Field |
Sub Field |
Type |
Description |
| filter |
alarms |
Object |
Alarms are fetched from the regions described in the alarms filter. See the example for more information. You can filter the alarms from the regions added to the alarms field. Each region has 2 parameters: alarm_name_prefix: Enter the alarm name prefix. alarms_to_monitor: Enter the name of the alarms. The alarms filter is used to filter the alarms received from AWS CloudWatch per region basis. The alarm_name_prefix, filters the alarm based on the prefix in the alarm name. For example, if "test" is entered, then all the alarms having the text "test" in the starting of their names will be filtered and sent to Cisco Crosswork Situation Manager. In alarms_to_monitor, the alarm name is given, for example "alarm1". Only the alarms with the alarm name entered here will be sent to Cisco Crosswork Situation Manager. You can also provide multiple alarm names separated by comma, for example "alarm1","alarm2". Note: If none of the filter is provided, then all the alarms from the AWS account will be forwarded to Cisco Crosswork Situation Manager. Only one filter will be used at a time, it can be either alarm_name_prefix or alarms_to_monitor. If no configuration is present in the filter section, then LAM will not fetch alarms from any region. If you want to fetch alarms from all regions, then leave the "aws_all_regions" block as uncommented. You may specify filter parameters in this block to apply filter(s) for all regions. |
|
|
events |
Object |
Events are fetched from the regions described in the events filter. See the example for more information. You can filter the events from the regions added to the events field. The regions have 2 parameters: filter_pattern: Enter the filter pattern. log_group_to_monitor: Enter the log group to monitor. Only the events which are logged in the log group given in the log_group_to_monitor field, and which have the same pattern as entered in the filter_pattern field will be forwarded to the Cisco Crosswork Situation Manager GUI. For example, the log group /aws/lambda/SomethingHappened have events with a word "scheduled" in it , so to filter the events having the word "scheduled" in it, "scheduled" is entered in the filter_pattern field and /aws/lambda/SomethingHappened is entered in the log_group_to_monitor field. Note: If none of the filter is provided, then all the events from the region where it is left blank will be sent to the LAM. If no configuration is present in the filter section, then LAM will not fetch events from any region. |
Note:
If alarms or events are not to be filtered, comment out the complete filter section of the config file. If only alarms are to be filtered, then comment out the event's section or vice-versa.
Note:
The LAM starts fetching the events from the current time. After that it saves the last poll time (in epoch format) in the state file.The state file is generated in the same folder where the config file is present e.g. $MOOGSOFT_HOME/config. The LAM generates the name of the state file as <proc_name>.state. Here the default proc_name (process name) is aws_lam, therefore, the state file name is aws_lam.state. proc_name is defined in the aws_lam.sh file located at $MOOGSOFT_HOME/bin.
It is recommended not to make any changes to the state file as this may lead to loss of events.
Note:
The LAM can fetch alarms from multiple regions. In state file, there are 15 regions to fetch the alarms, and for logs there is one common timestamp which is used to fetch events from all the applicable regions. For example,
{"alarms":{"ap-south-1":1509610912603,"eu-west-3:1509610912603","eu-west-2":1509610912603,"eu-west-1":1509610912603,"ap-northeast-2":1509610912603,"ap-northeast-1":1509610912603,"ca-central-1":1509610912603,"sa-east-1":1509610912603,"ap-southeast-1":1509610912603,"ap-southeast-2":1509610912603,"eu-central-1":1509610912603,"us-east-1":1509610912603,"us-east-2":1509610912603,"us-west-1":1509610912603,"us-west-2":1509610912603},"logevent":1509610854792}
Example
monitor:
{
name : "AWS Monitor",
class : "CAwsMonitor",
role_arn : "",
role_session_validity : 3600,
access_key_id : "",
#encrypted_access_key_id : "",
secret_access_key : "",
#encrypted_secret_access_key : "",
proxy:
{
host : "localhost",
port : 8181,
user : "user",
password : "pass",
#encrypted_password : "ieytOFRUdLpZx53nijEw0rOh07VEr8w9lBxdCc7229o="
},
exclude_protected_regions : true,
filter:
{
alarms:
{
"aws_all_regions":
{
#alarm_name_prefix : "",
alarms_to_monitor : []
}
"us-west-2":
{
#alarm_name_prefix : "",
alarms_to_monitor :[]
},
"ap-south-1":
{
#alarm_name_prefix : "",
alarms_to_monitor : []
}
},
events:
{
"aws_all_regions":
{
#filter_pattern : "",
log_group_to_monitor : []
},
"us-west-2":
{
#filter_pattern :"",
log_group_to_monitor :[]
},
"ap-south-1":
{
#filter_pattern :"",
log_group_to_monitor :[]
}
}
},
polling_interval : 60,
max_retries : -1,
retry_interval : 60,
retry_recovery:
{
recovery_interval : 20,
max_lookback : -1
},
timeout : 120
},
Agent and Process Log
Agent and Process Log allow you to define the following properties:
· name: Identifies events the LAM sends to the Message Bus.
· capture_log: Name and location of the LAM's capture log file.
· configuration_file: Name and location of the LAM's process log configuration file.
Mapping
You can directly map the alarm/event fields of AWS with fields displayed in the Cisco Crosswork Situation Manager. The mapping example is as follows:
mapping :
{
catchAll: "overflow",
rules:
[
{ name: "signature", rule: "" },
{ name: "source_id", rule: "" },
{ name: "external_id", rule: "" },
{ name: "manager", rule: "AWS Cloudwatch" },
{ name: "source", rule: "" },
{ name: "class", rule: "$class" },
{ name: "agent", rule: "$LamInstanceName" },
{ name: "agent_location", rule: "" },
{ name: "type", rule: "" },
{ name: "severity", rule: "" },
{ name: "description", rule: "" },
{ name: "agent_time", rule: "" }
]
},
filter:
{
presend: "AwsLam.js"
}
The above example specifies the mapping of the AWS alarm fields with the Cisco Crosswork Situation Manager fields. Data not mapped to fields goes into "Custom Info".
Note:
The signature field is used by the LAM to identify correlated alarms.
Constants and Conversions
Constants and Conversions allows you to convert formats of the received data.
| Field |
Description |
Example |
| Severity and sevConverter |
has a conversion defined as sevConverter in the Conversions section, this looks up the value of severity defined in the severity section of constants and returns back the mapped integer corresponding to the severity. |
severity: "CLEAR" : 0, }, sevConverter: |
| stringToInt |
used in a conversion, which forces the system to turn a string token into an integer value. |
stringToInt: |
Example
Constants and Conversions
constants:
{
severity:
{
"CLEAR" : 0,
"INDETERMINATE" : 1,
"WARNING" : 2,
"MINOR" : 3,
"MAJOR" : 4,
"CRITICAL" : 5,
}
},
conversions:
{
sevConverter:
{
lookup : "severity",
input : "STRING",
output : "INTEGER"
},
stringToInt:
{
input : "STRING",
output : "INTEGER"
}
},
Severity Reference
Cisco Crosswork Situation Manager Severity Levels
severity:
{
"CLEAR" : 0,
"INDETERMINATE" : 1,
"WARNING" : 2,
"MINOR" : 3,
"MAJOR" : 4,
"CRITICAL" : 5,
}
| Level |
Description |
| 0 |
Clear |
| 1 |
Indeterminate |
| 2 |
Warning |
| 3 |
Minor |
| 4 |
Major |
| 5 |
Critical |
Service Operation Reference
| Process Name |
Service Name |
| aws_lam |
awslamd |
Start the LAM Service:
service awslamd start
Stop the LAM Service:
service awslamd stop
Check the LAM Service status:
service awslamd status
Optional AWS LAM Configuration
The Secret Access Key and the Access Key are usually stated in the config file, but you can also connect to the AWS LAM using the following:
Using Environment Variables
You can use environment variables to connect to the LAM.
1. Open the .bashrc file using an editor, for example vi /root/.bashrc.
2. Enter the Access/Secret Access Key of your AWS account:
# .bashrc
# User specific aliases and functions
alias rm='rm -i'
alias cp='cp -i'
alias mv='mv -i'
# Source global definitions
if [ -f /etc/bashrc ]; then
. /etc/bashrc
fi
export AWS_ACCESS_KEY=<Your AWS Access Key>
export AWS_SECRET_KEY=<Your AWS Secret Key>
export MOOGSOFT_HOME=/usr/share/moogsoft
export JAVA_HOME=/usr/java/latest
3. Save the bashrc file.
4. Enter the command source .bashrc.
You have successfully configured the Access/Secret Access Key for the LAM and now you don't have to enter it in the config file.
Entering the keys in the awslam file
You can enter the Access/Secret Access Key in the the awslam file.
1. Go to $MOOGSOFT_HOME/bin.
2. Open the awslam file using an editor, for example vi awslam.
3. Enter the lines AWS_ACCESS_KEY and AWS_SECRET_KEY in the Set up the java environment section along with the Access/Secret Access Key:
# Set up the java environment
#
AWS_ACCESS_KEY="<Your AWS Access Key>"
AWS_SECRET_KEY="<Your AWS Secret Key>"
java_classpath="$APP_HOME/lib/lam_components-1.0.jar:$APP_HOME/lib/cots/httpmime-4.3.1.jar:$APP_HOME/lib/cots/httpcore-4.4.5.jar:$APP_HOME/lib/cots/httpclient-4.5.2.jar:$APP_HOME/lib/cots/commons-codec-1.10.jar:$APP_HOME/lib/cots/joda-time-2.8.2.jar:$APP_HOME/lib/cots/aws-java-sdk-1.11.158.jar:$APP_HOME/lib/cots/aws-java-sdk-cloudwatch-1.11.158.jar:$APP_HOME/lib/cots/aws-java-sdk-logs-1.11.158.jar:$APP_HOME/lib/cots/aws-java-sdk-core-1.11.158.jar:$APP_HOME/lib/cots/aws-java-sdk-ec2-1.11.158.jar:$APP_HOME/lib/cots/aws-java-sdk-s3-1.11.158.jar:$APP_HOME/lib/bot.jar:$APP_HOME/lib/mooms.jar:$APP_HOME/lib/dao.jar:$APP_HOME/lib/security.jar:$APP_HOME/lib/utilutils.jar:$APP_HOME/lib/servletutils.jar:$APP_HOME/lib/cots/commons-lang3-3.4.jar:$APP_HOME/lib/cots/commons-io-1.2.jar:$APP_HOME/lib/cots/commons-cli-1.2.jar:$APP_HOME/lib/cots/jackson-annotations-2.8.1.jar:$APP_HOME/lib/cots/jackson-core-2.8.1.jar:$APP_HOME/lib/cots/jackson-databind-2.8.1.jar:$APP_HOME/lib/cots/rhino-1.7R4.jar:$APP_HOME/lib/cots/mysql-connector-java-5.1.37.jar:$APP_HOME/lib/cots/amqp-client-3.6.5.jar:$APP_HOME/lib/cots/javax.servlet-api-3.1.0.jar:$APP_HOME/lib/cots/shiro-core-1.2.4.jar:$APP_HOME/lib/cots/snmp4j-2.5.2.jar:$APP_HOME/lib/cots/antlr4-runtime-4.5.3.jar:$APP_HOME/lib/cots/slf4j-api-1.6.4.jar:$APP_HOME/lib/cots/commons-logging-1.2.jar:$APP_HOME/lib/aws_lam-1.1.jar:$APP_HOME/lib/cots/nonDist/*"
java_vm=$JAVA_HOME/bin/java
4. Enter the following lines in the Run app section:
# Run app
$java_vm ${JVM_OPTS[@]} -DprocName=$proc_name -DMOOGSOFT_HOME=$APP_HOME -classpath $java_classpath $java_main_class "$@" &
#$java_vm ${JVM_OPTS[@]} -Daws.accessKeyId=$AWS_ACCESS_KEY -Daws.secretKey=$AWS_SECRET_KEY -DprocName=$proc_name -DMOOGSOFT_HOME=$APP_HOME -classpath $java_classpath $java_main_class "$@" &
You have successfully configured the Access/Secret Access Key for the LAM and now you don't have to enter it in the config file.
Using a Credential File
You can use a credential file to store the Access/Secret Access Key at a predefined default location.
1. Go to /root/.aws. If the .aws directory is not present then create the .aws directory using the mkdir command.
2. Create a file named credentials using the command touch credentials .
3. Enter the Access Key and Secret Access Key in the credentials file.
You have successfully configured the Access/Secret Access Key for the LAM and now you don't have to enter it in the config file.
Instance profile credentials delivered through the Amazon EC2 metadata service
See the AWS documentation for information on setting up roles to access AWS resources.
AWS CloudWatch LAM Reference
This is a reference for the AWS CloudWatch LAM and UI integration. The AWS CloudWatch LAM configuration file is located at $MOOGSOFT_HOME/config/aws_lam.conf.
The following properties are unique to the AWS CloudWatch LAM and UI integration.
See the LAM and Integration Reference for a full description of all common properties used to configure LAMs and UI integrations.
See the AWS CloudWatch documentation for details on AWS CloudWatch components.
role_arn
Role ARN of the delegated role. If credentials (access_key_id and secret_access_key) are provided, it is assumed that it belongs to a user from the account trusted with role delegation. If no credentials are provided, SDK falls back on environment variables, SDK or instance roles for them.
| Type |
String |
| Required |
No |
| Default |
N/A |
role_session_validity
Duration (in seconds) for which temporary credentials remain valid for sending requests to AWS.
| Type |
Integer |
| Required |
Yes |
| Default |
3600 |
exclude_protected_regions
When true, US Government and Chinese regions are not added when aws_all_regions is used in either the alarms or events filter. When false, all regions are included.
| Type |
Boolean |
| Required |
Yes |
| Default |
true |
filter
Filters alarms and/or events received from AWS CloudWatch by region.
| Type |
Object |
| Required |
No |
| Default |
N/A |
| Valid Values |
See the alarms and events properties below. |
Example
filter:
{
alarms:
{
"aws_all_regions":
{
#alarm_name_prefix : "",
alarms_to_monitor : ["alarm1", "alarm2"]
},
"us-west-2":
{
alarm_name_prefix : "alarm",
alarms_to_monitor : ["3", "4"]
}
events:
{
"aws_all_regions":
{
#filter_pattern : "scheduled",
log_group_to_monitor : ["/aws/lambda/event1"]
},
"ap-south-1":
{
#filter_pattern :"",
log_group_to_monitor :["/aws/lambda/event2", "/aws/lambda/event3"]
}
}
}
alarms
Filters the alarms received from AWS CloudWatch by region. The alarm_name_prefix filters alarms based on their prefixes. The aws_all_regions filter applies to all regions that have not been separately filtered.
| Type |
String |
| Required |
No |
| Default |
N/A |
events
Filters the events from AWS CloudWatch by region. log_group_to_monitor specifies the log group to filter within a region. The filter_pattern filters events within the specified log group. The aws_all_regions filter applies to all regions that have not been separately filtered.
| Type |
String |
| Required |
No |
| Default |
N/A |
AWS SNS
The AWS SNS integration receives and processes CloudWatch alarms forwarded to Cisco Crosswork Situation Manager. The integration parses the alarms into Cisco Crosswork Situation Manager events.
If you want to implement a more complex AWS SNS LAM with custom settings, see Configure the AWS SNS LAM.
See the AWS SNS documentation for details on invoking Lambda functions using AWS SNS.
Before You Begin
The AWS SNS integration has been validated with AWS SNS v2016-06-28. Before you start to set up your AWS SNS integration, ensure you have met the following requirements:
· You have an active AWS account.
· You have the necessary permissions to create Lambda functions and SNS topics within AWS.
· You have configured AWS SNS topics for your CloudWatch alarms.
· AWS SNS can make requests to external endpoints over port 443. This is the default.
Configure the AWS SNS Integration
To configure the AWS SNS integration:
1. Navigate to the Integrations tab.
2. Click AWS SNS in the Monitoring section.
3. Follow the instructions to create an integration name.
Configure AWS SNS
To create a Lambda function to trigger on an SNS topic, follow the steps below. For more help, see the AWS SNS Documentation.
1. Create a role in AWS with the following properties:
| Field |
Value |
| Type |
AWS service |
| Service |
Lambda |
| Policies |
These two policies are required as a minimum: AmazonEC2ReadOnlyAccess AWSLambdaExecute |
2. Create a Lambda function with the following properties:
| Field |
Value |
| Name |
lambdaToMoog |
| Runtime |
Node.js 8.10 |
| Role |
Select the role you created in step 1 |
3. Add an SNS trigger to your Lambda function and select the topics to trigger the function.
4. Download the SNS integration Lambda function zip file here.
5. Upload the zip file in the function code section of the lambToMoog configuration.
Note:
Unapproved changes to the code are unsupported. Submit any changes to Cisco for review.
6. Configure the environment variables for the lambToMoog function as follows:
| Key |
Value |
| MOOG_URL |
<your AWS SNS integration URL> For example: https://example.Cisco.com/events/sns_awssns1 |
| MOOG_USER |
Username generated in the Cisco Crosswork Situation Manager UI. |
| MOOG_PASS |
Password generated in the Cisco Crosswork Situation Manager UI. |
7. Save the function.
Test AWS SNS
You can test the AWS SNS configuration using the following example test event.
Note:
JSON is the only supported format for AWS SNS messages.
{
"Records": [
{
"EventSource": "aws:sns",
"EventVersion": "1.0",
"EventSubscriptionArn": "arn:aws:sns:us-east-1:347584378564:test-notifications:fe1a2b3c-ab11-1234-a12b-108a1abc1234",
"Sns": {
"Type": "Notification",
"MessageId": "1ab123a1-1a01-12ab-a1b2-12aa0a1abc1a",
"TopicArn": "arn:aws:sns:us-east-1:347584378564:test-notifications",
"Subject": "OK: \"Dynatrace EC2 Instance CPU\" in US East (N. Virginia)",
"Message": "{\"AlarmName\":\"Dynatrace EC2 Instance CPU\",\"AlarmDescription\":\"Dynatrace EC2 Instance Monitoring\",\"AWSAccountId\":\"123412341234\",\"NewStateValue\":\"OK\",\"NewStateReason\":\"Sample SNS integration test event.\",\"StateChangeTime\":\"2018-02-27T16:19:41.353+0000\",\"Region\":\"US East (N. Virginia)\",\"OldStateValue\":\"INSUFFICIENT_DATA\",\"Trigger\":{\"MetricName\":\"CPUUtilization\",\"Namespace\":\"AWS/EC2\",\"StatisticType\":\"Statistic\",\"Statistic\":\"AVERAGE\",\"Unit\":null,\"Dimensions\":[{\"name\":\"InstanceId\",\"value\":\"i-123a1abcdef0a012a\"}],\"Period\":300,\"EvaluationPeriods\":1,\"ComparisonOperator\":\"GreaterThanOrEqualToThreshold\",\"Threshold\":10.0,\"TreatMissingData\":\"- TreatMissingData: Breaching\",\"EvaluateLowSampleCountPercentile\":\"\"}}",
"Timestamp": "2018-02-27T16:19:41.392Z",
"SignatureVersion": "1",
"Signature": "signature",
"SigningCertUrl": "https://sns.us-east-1.amazonaws.com/SimpleNotificationService-1234.pem",
"UnsubscribeUrl": "https://sns.us-east-1.amazonaws.com/?Action=Unsubscribe&SubscriptionArn=arn:aws:sns:us-east-1:347584378564:test-notifications:fe1a2b3c-ab11-1234-a12b-108a1abc1234",
"MessageAttributes": {}
}
}
]
}
After you configure the AWS SNS integraton it forwards CloudWatch alarms to Cisco Crosswork Situation Manager.
Configure the AWS SNS LAM
The AWS SNS LAM receives and processes CloudWatch alarms forwarded to Cisco Crosswork Situation Manager. The LAM parses the alarms into Cisco Crosswork Situation Manager events.
You can install a basic AWS SNS integration in the UI. See AWS SNS for integration steps.
Configure the AWS SNS LAM if you want to configure custom properties, set up high availability or configure advanced options that are not available in the UI integration.
Before You Begin
Before you configure the AWS SNS LAM, ensure you have met the following requirements:
• You have an active AWS account.
• You have the necessary permissions to create Lambda functions and SNS topics within AWS.
• You have configured AWS SNS topics for your CloudWatch alarms.
• AWS SNS can make requests to external endpoints over port 443. This is the default.
If you are configuring a distributed deployment refer to /document/preview/77155#UUIDbea404d9dd1afee65fa1471105d1b3c6 first. You will need the details of the server configuration you are going to use for HA.High Availability Overview
Configure the LAM
Edit the configuration file to control the behavior of the AWS SNS LAM. You can find the file at $MOOGSOFT_HOME/config/sns_lam.conf
The AWS SNS LAM is a REST-based LAM as it provides an HTTP endpoint for data ingestion. Note that only the generic REST LAM properties in sns_lam.conf apply to integrating with AWS SNS; see the LAM and Integration Reference for a full description of all properties.
Some properties in the file are commented out by default. Uncomment properties to enable them.
1. Configure the connection properties for the REST connection:
a. address: Address on the Cisco Crosswork Situation Manager server that listens for REST messages. Defaults to all interfaces.
b. port: Port on the Cisco Crosswork Situation Manager server that listens for REST messages. Defaults to 48017.
2. Configure authentication:
a. authentication_cache: Whether to cache the username and password for the current connection when the authentication type is Basic.
3. Configure the LAM behavior:
a. num_threads:Number of worker threads to use when processing events.
b. rest_response_mode: When to send a REST response. See the LAM and Integration Reference for the options.
c. rpc_response_timeout: Number of seconds to wait for a REST response.
d. event_ack_mode: When Moogfarmd acknowledges events from the AWS SNS LAM during the event processing pipeline.
4. Configure the SSL properties if you want to encrypt communications between the LAM and the REST connection:
a. use_ssl: Whether to use SSL certification.
b. path_to_ssl_files: Path to the directory that contains the SSL certificates.
c. ssl_key_filename: The SSL server key file.
d. ssl_cert_filename: The SSL root CA file.
e. use_client_certificates: Whether to use SSL client certification.
f. client_ca_filename: The SSL client CA file.
g. auth_token or encrypted_auth_token: Authentication token in the request body.
h. header_auth_token or encrypted_header_auth_token: Authentication token in the request header.
i. ssl_protocols:Sets the allowed SSL protocols.
5. Optionally configure the LAM identification and logging details in the agent and log_config sections of the file:
a. name:Identifies events the LAM sends to the Message Bus.
b. capture_log: Name and location of the LAM's capture log file.
c. configuration_file: Name and location of the LAM's process log configuration file.
6. Optionally configure severity conversion. See /document/preview/11721#UUID8b183a1e1278a7a652d3ae86944d7379 for further information and "Conversion Rules" in /document/preview/11720#UUID5c67156b667b1a28ec648cd779393914 for details on conversions in general.Severity ReferenceData Parsing
Example
An example AWS SNS LAM configuration is as follows.
monitor:
{
name : "Rest Lam Monitor",
class : "CRestMonitor",
port : 48017,
address : "0.0.0.0",
use_ssl : false,
#path_to_ssl_files : "config",
#ssl_key_filename : "server.key",
#ssl_cert_filename : "server.pem",
#use_client_certificates : false,
#client_ca_filename : "ca.crt",
#auth_token : "my_secret",
#encrypted_auth_token : "dfJtTQMGiFHfiq7sCmxguBt6Jv+eytkoiKCquSB/7iWxpgGsG2aez3z2j7SuBtKj",
#header_auth_token : "my_secret",
#encrypted_header_auth_token : "dfJtTQMGiFHfiq7sCmxguBt6Jv+eytkoiKCquSB/7iWxpgGsG2aez3z2j7SuBtKj",
#ssl_protocols : [ "TLSv1.2" ],
authentication_type : "basic",
#jwt:
#{
#secretKey : "secret",
#sub : "moogsoft",
#iss : "moogsoft",
#aud : "moogsoft",
#jti : ""
#},
authentication_cache : true,
accept_all_json : true,
lists_contain_multiple_events : true,
num_threads : 5,
rest_response_mode : "on_receipt",
rpc_response_timeout : 20,
event_ack_mode : "queued_for_processing"
},
agent:
{
name : "AWS SNS",
capture_log : "$MOOGSOFT_HOME/log/data-capture/sns_lam.log"
},
log_config:
{
configuration_file : "$MOOGSOFT_HOME/config/logging/sns_lam_log.json"
{,
Configure for High Availability
Configure the AWS SNS LAM for high availability if required. See /document/preview/77155#UUIDbea404d9dd1afee65fa1471105d1b3c6 for details.High Availability Overview
Configure LAMbot Processing
The AWS SNS LAMbot processes and filters events before sending them to the Message Bus. You can customize or bypass this processing if required. You can also load JavaScript files into the LAMbot and execute them.
See LAMbot Configuration for more information. An example AWS SNS LAM filter configuration is shown below.
filter:
{
presend: "SnsLam.js",
modules: [ "CommonUtils.js ]
}
Start and Stop the LAM
Restart the AWS SNS LAM to activate any changes you make to the configuration file or LAMbot.
The LAM service name is snslamd.
See /document/preview/11677#UUID1a2205c3aae40b26fdfe94490043f3c3 for the commands to start, stop and restart the LAM.Control Processes
You can use a GET request to check the status of the AWS SNS LAM. See "Check the LAM Status" in Configure the REST LAM for further information and examples.
Configure AWS SNS
After you have the AWS SNS LAM running and listening for incoming requests, you can configure AWS SNS. See "Configure AWS SNS" in AWS SNS.
BMC Remedy
You can install the BMC Remedy integration to create Remedy incidents from Situations in Cisco Crosswork Situation Manager.
You can enable auto-assign so new Remedy incidents created from Cisco Crosswork Situation Manager are automatically assigned to the logged in user. You can also configure Remedy to synchronize information with Cisco Crosswork Situation Manager.
See the BMC Remedy documentation for more information on Remedy components.
Before You Begin
The Remedy integration has been validated with BMC Remedy v. 9.1. Before you start to set up your integration, ensure you have met the following requirements:
· You have the Remedy API URL.
· You have the Remedy Web URL.
· You have the Remedy Mid Tier Server details.
· You know the Remedy username and password for Cisco Crosswork Situation Manager to use to authenticate to Remedy.
· You know the full name of the Remedy customer for the Remedy incident.
If you want to enable auto-assign, you have created user accounts with the same names in both Cisco Crosswork Situation Manager and Remedy.
Configure the Remedy Integration
To configure the BMC Remedy integration:
1. Navigate to the Integrations tab.
2. Click Remedy in the Ticketing section.
3. Follow the instructions to create an integration name and provide connection details for your Remedy system.
After you complete the BMC Remedy configuration you can perform the following actions in Cisco Crosswork Situation Manager:
· Right-click an open Situation and select Open Remedy Incident from the menu.
· Create a Remedy incident from the Tools drop-down menu.
· Double-click a Situation and select Show Details > Custom Info to display the Remedy incident number.
· View the related Remedy incident in the Situation's Collaborate tab.
· Automatically close a Remedy incident by closing the related Situation.
· You can perform the following actions in the Remedy Incident Management Console:
· View the incidents created by Cisco Crosswork Situation Manager.
· View comments added to the related Situation's Collaborate tab in the incident's worklog.
Configure Remedy
If you want to configure Remedy to send information back to Cisco Crosswork Situation Manager, see Configure BMC Remedy.
Configure BMC Remedy
While you can install the BMC Remedy integration to create Remedy incidents from Cisco Crosswork Situation Manager Situations, you can also configure Remedy to synchronize with Cisco Crosswork Situation Manager, allowing you to:
· Close Cisco Crosswork Situation Manager Situations by resolving the related Remedy incidents.
· Synchronize the Remedy incident worklog with the Situation's Collaborate tab.
· Synchronize resolutions from Remedy to Cisco Crosswork Situation Manager.
Before You Begin
Before you configure Remedy, ensure you have met the following requirements:
· You have installed BMC Remedy Developer Studio and configured it to connect to your BMC server and Remedy system.
· You can access the BMC Mid Tier Configuration Tool.
· You have the connection details for your Cisco Crosswork Situation Manager server.
· You know your Cisco Crosswork Situation Manager Graze API username and password.
See the BMC documentation for details on BMC components.
Configure Remedy Properties
To configure the behavior of Remedy, download the Remedy config zip file and extract it to your Remedy server, typically <Remedy installation directory>/BMC Software/ARSystem/Remedy. The configuration file is in Remedy/config/RemedyMoogsoft.properties.
See BMC Remedy Reference and LAM and Integration Reference for a full description of all properties. Some properties in the file are commented out by default; remove the '#' character to enable them.
1. Configure the connection properties:
a. moogsoft.host: The hostname or IP address of the Cisco Crosswork Situation Manager instance to connect to.
2. Configure authentication:
a. moogsoft.graze.user: Graze API username.
b. moogsoft.graze.password: Graze API password.
3. Configure Remedy's behavior:
a. moogsoft.close_situation_in_moog: If set to true, resolving or closing an incident in Remedy also applies to the Situation in Cisco Crosswork Situation Manager. If set to false, closing an incident in Remedy resolves the Situation in Cisco Crosswork Situation Manager but does not close it.
b. moogsoft.remedy_integration_user: Remedy username(s). Use commas to separate multiple usernames.
c. moogsoft.thread_name: Thread to use in Cisco Crosswork Situation Manager for adding comments.
4. Configure SSL if you want to encrypt communications between Remedy and Cisco Crosswork Situation Manager.
a. moogsoft.use_ssl: Whether to use SSL certification.
b. moogsoft.disable_certificate_validation: Whether to disable SSL certificate validation.
c. moogsoft.server_cert_filename: Name of the SSL root CA file.
5. Configure request timeouts:
a. moogsoft.connection_request_timeout: Length of time (in milliseconds) to wait for a response from a POST request before returning a timeout.
b. moogsoft.socket_timeout: Length of time (in milliseconds) to wait for a response from the Java socket before returning a timeout.
c. moogsoft.connect_timeout: Length of time (in milliseconds) to wait for a response from the Cisco Crosswork Situation Manager server before returning a timeout.
6. If you want to connect to Remedy through a proxy server, configure the following properties:
a. moogsoft.enable_proxy: Whether or not to connect to Remedy through a proxy server.
b. moogsoft.proxy_host: The hostname or IP address of the proxy server.
c. moogsoft.proxy_port: The port number of the proxy server.
d. moogsoft.proxy_authentication_required: Whether to require the proxy server's username and password.
e. moogsoft.proxy_user: The proxy server username.
f. moogsoft.proxy_password: The server password.
Example
An example Remedy configuration is as follows:
moogsoft.host = 0.0.0.0
moogsoft.graze.user = graze
moogsoft.graze.password = graze
#moogsoft.use_ssl=false
#moogsoft.disable_certificate_validation=true
#moogsoft.server_cert_filename=""
#moogsoft.enable_proxy=false
#moogsoft.proxy_host=""
#moogsoft.proxy_port=8080
#moogsoft.proxy_authentication_required=false
#moogsoft.proxy_user=""
#moogsoft.proxy_password= ""
moogsoft.close_situation_in_moog=true
moogsoft.remedy_integration_user=remedy_user
moogsoft.thread_name=Support
moogsoft.connection_request_timeout=12000
moogsoft.socket_timeout=12000
moogsoft.connect_timeout=12000
Create Remedy Custom Fields
Follow these steps to create a custom field to store the Cisco Crosswork Situation Manager Situation ID:
1. Log into BMC Remedy Developer Studio.
2. Go to Forms and select the HPD: WorkLog form.
3. Create an Overlay so that you can edit the form.
4. Create a new Integer field in the current view.
5. Edit the new field's properties and set the following:
a. Display Label: moogsoft_aiops_situation_id
b. Database Name: moogsoft_aiops_situation_id
6. Copy the custom field you have just created to the forms HPD: IncidentInterface_create and HPD: Help Desk. Note that the field must be copied; creating a custom field with the same name results in the fields having different database IDs and does not work.
7. Add the following mapping to the filter HPD:HII:CreateIncident_100`! to make the custom field available in the help desk:
moogsoft_aiops_situation_id: $moogsoft_aiops_situation_id$
8. Save your changes.
Configure Remedy Filters
You can set up filters to sychronize the Remedy incident status, resolution and worklog with the corresponding Cisco Crosswork Situation Manager Situation.
You will need to supply the following details in the filter command line strings:
· Path to Java on your BMC server: Required to execute the .jar file.
· Path to the Remedy jar file: This file interacts with Cisco Crosswork Situation Manager and performs actions on Situations.
· Flag: Indicates whether an incident is closed or resolved.
· Incident number: Represents the number of the incident closed or resolved by the Remedy user.
· Incident status: Status of the Remedy incident.
· Submitter: Remedy user that submitted the work log.
· Cisco Crosswork Situation Manager Situation ID.
To create filters in BMC Remedy Developer Studio, navigate to the Filters section of the UI. Create new filters using the configurations outlined in the sections below.
Remedy Incident Status
To synchronize the Remedy incident status with the Cisco Crosswork Situation Manager Situation, create a filter with the following configuration:
· Filter: Filter name, for example MoogsoftIncidentStatus.
· Associated Forms: HPD:HelpDesk
· Execution Option: Enabled - Modify, Submit
· Run IF Qualification:
(('TR.Status' = "Resolved") AND ('DB.Status' != "Resolved")) OR (('TR.Status' = "Closed") AND ('DB.Status' != "Closed")) AND ('moogsoft_aiops_situation_id' != $NULL$)
· If Action, Run Process:
<Path to Java on your BMC server> -jar <Path to Remedy jar file>"true" $IncidentNumber$ "$moogsoft_aiops_situation_id$" "$z2TF Work Log Submitter$" "$Status$"
Remedy Incident Resolution
To synchronize the Remedy incident resolution with the Cisco Crosswork Situation Manager Situation, create a filter with the following configuration:
· Filter: Filter name, for example MoogsoftIncidentResolution.
· Associated Forms: HPD:HelpDesk
· Execution Option: Enabled - Modify, Submit
· Run IF Qualification: (('TR.Status' = "Resolved") OR ('TR.Status' = "Closed") OR ('DB.Status' = "Resolved") OR ('DB.Status' = "Closed")) AND ('moogsoft_aiops_situation_id' != $NULL$)
· If Action, Run Process:
<Path to Java on your BMC server> -jar <Path to Remedy jar file> "false" $IncidentNumber$ "$moogsoft_aiops_situation_id$" "$USER$" $Status$ $Resolution$
Remedy Incident Worklog
To synchronize the Remedy incident worklog with the Cisco Crosswork Situation Manager Situation, create two filters. The first filter retrieves the Situation ID from the helpdesk and adds it to the worklog custom field:
· Filter: Filter name, for example MoogsoftSetIDWorklog
· Associated Forms: HPD:WorkLog
· Execution Option: Enabled - Modify, Submit
· Run IF Qualification: <No condition>
· If Action: Set Fields
You will need to add the action Set Fields to If Actions. Complete the Set Fields properties as follows:
· Data Source: Server
· Server Name: Name of your server
· Form Name: HPD:Help Desk
· Qualification: $Incident Number$ = 'Incident Number'
· If No Requests Match: Set Fields to $NULL$
· If Multiple Requests Match: Use First Matching Request
· Auto Map: Field moogsoft_aiops_situation_id to Value$moogsoft_aiops_situation_id$
Add a second filter to complete the synchronization action as follows:
· Filter: Filter name, for example MoogsoftIncidentWorklog
· Associated Form: HPD:WorkLog
· Execution Option: Enabled - Modify, Submit
· Run IF Qualification: 'moogsoft_aiops_situation_id' != $NULL$
· If Action, Run Process:
<Path to Java on your BMC server> -jar <Path to Remedy jar file> "false" $Incident Number$ "$moogsoft_aiops_situation_id$" "$Submitter$" $Detailed Description$
Example
An example filter configuration to synchronize Remedy incident status with Cisco Crosswork Situation Manager is as follows:

Commit the Changes
To commit the custom field changes, follow these steps to perform a mid tier flush:
1. Log in to the BMC Mid Tier Configuration Tool and flush the cache.
2. Log in to the BMC Remedy Developer Studio and check the forms for the new custom field.
3. If the changes have not committed, use the BMC Mid Tier Configuration Tool again to flush the browser history and cookies and then flush the cache.
BMC Remedy Reference
This is a reference for the BMC Remedy LAM and UI integration. The Remedy configuration file is located in the Remedy config zip file at Remedy/config/RemedyMoogsoft.properties.
The following properties are unique to the BMC Remedy integration.
See the LAM and Integration Reference for a full description of all common properties used to configure LAMs and UI integrations.
See the BMC Remedy documentation for details on Remedy components.
moogsoft.host
The hostname or IP address of the Cisco Crosswork Situation Manager instance to connect to.
| Type |
String |
| Required |
Yes |
| Default |
0.0.0.0 |
moogsoft.graze.user
Graze API username.
| Type |
String |
| Required |
Yes |
| Default |
N/A |
moogsoft.graze.password
Graze API password.
| Type |
String |
| Required |
Yes |
| Default |
N/A |
moogsoft.close_situation_in_moog
If set to true, resolving or closing an incident in Remedy also applies to the Situation in Cisco Crosswork Situation Manager. If set to false, closing an incident in Remedy resolves the Situation in Cisco Crosswork Situation Manager but does not close it.
| Type |
Boolean |
| Required |
Yes |
| Default |
True |
moogsoft.remedy_integration_user
Remedy username(s). Use commas to separate multiple usernames.
| Type |
String |
| Required |
Yes |
| Default |
N/A |
moogsoft.thread_name
Thread to use in Cisco Crosswork Situation Manager for adding comments.
| Type |
String |
| Required |
Yes |
| Default |
N/A |
moogsoft.use_ssl
Whether to use SSL certification.
| Type |
Boolean |
| Required |
No |
| Default |
False |
moogsoft.disable_certificate_validation
Whether to disable SSL certificate validation.
| Type |
Boolean |
| Required |
If moogsoft.use_ssl=true. |
| Default |
True |
moogsoft.server_cert_filename
Name of the SSL root CA file.
| Type |
String |
| Required |
If moogsoft.use_ssl=true. |
| Default |
N/A |
moogsoft.connection_request_timeout
Length of time (in milliseconds) to wait for a response from a POST request before returning a timeout.
| Type |
Integer |
| Required |
Yes |
| Default |
12000 |
moogsoft.socket_timeout
Length of time (in milliseconds) to wait for a response from the Java socket before returning a timeout.
| Type |
Integer |
| Required |
Yes |
| Default |
12000 |
moogsoft.connect_timeout
Length of time (in milliseconds) to wait for a response from the Cisco Crosswork Situation Manager server before returning a timeout.
| Type |
Integer |
| Required |
Yes |
| Default |
12000 |
moogsoft.enable_proxy
Whether or not to connect to Remedy through a proxy server.
| Type |
Boolean |
| Required |
No |
| Default |
False |
moogsoft.proxy_host
The hostname or IP address of the proxy server.
| Type |
String |
| Required |
If moogsoft.enable_proxy=true. |
| Default |
N/A |
moogsoft.proxy_port
The port number of the proxy server.
| Type |
String |
| Required |
If moogsoft.enable_proxy=true. |
| Default |
N/A |
moogsoft.proxy_authentication_required
Whether to require the proxy server's username and password.
| Type |
Boolean |
| Required |
If moogsoft.enable_proxy=true. |
| Default |
False |
moogsoft.proxy_user
The proxy server username.
| Type |
String |
| Required |
If moogsoft.enable_proxy=true. |
| Default |
N/A |
moogsoft.proxy_password
The proxy server password.
| Type |
String |
| Required |
If moogsoft.enable_proxy=true. |
| Default |
N/A |
CA Technologies
You can integrate Cisco Crosswork Situation Manager with several tools made by CA Technologies. Choose the integration that meets your requirements:
· CA Spectrum: Install the CA Spectrum integration to collect event data from the CA Spectrum monitoring tool.
· CA UIM: Install the CA UIM (Unified Infrastructure Management) integration to enable Cisco Crosswork Situation Manager to collect event data from UIM.
CA Spectrum
You can install the CA Spectrum integration to enable Cisco Crosswork Situation Manager to collect event data from one or more CA Spectrum systems.
The CA Spectrum API does not supply events with status 'clear' for collection by Cisco Crosswork Situation Manager.
See the CA Spectrum documentation for details on CA Spectrum components.
Before You Begin
The CA Spectrum integration has been validated with CA Spectrum OneClick v10.2. Before you start to set up your integration, ensure you have met the following requirements for each CA Spectrum server:
· You have the URL for your CA Spectrum server.
· The port for your CA Spectrum server is open and accessible from Cisco Crosswork Situation Manager.
· You have credentials to connect to the CA Spectrum server.
· You have set up alarms in CA spectrum.
· Your CA Spectrum server is able to accept HTTP/HTTPS requests.
Additionally, you can provide optional configuration details. See the LAM and Integration Reference for a description of all properties.
Configure the CA Spectrum Integration
To configure the CA Spectrum integration:
1. Navigate to the Integrations tab.
2. Click CA Spectrum in the Monitoring section.
3. Provide a unique integration name. You can use the default name or customize the name according to your needs.
4. Provide connection details for your CA Spectrum system.
CA Spectrum Configuration
You do not need to perform any integration-specific steps on your CA Spectrum systems. After you configure the integration, it polls your CA Spectrum servers at regular intervals to collect event data (every 60 seconds by default).
If the integration fails to connect to one or more sources, Cisco Crosswork Situation Manager creates an alert and writes the details to the process log. Refer to the logging details for LAMs and integrations for more information.Configure Logging
Configure the CA Spectrum LAM
CA Spectrum provides deep application monitoring and performance lifecycle management. The CA Spectrum LAM connects to CA Spectrum, fetches the incidents and forwards them to Cisco Crosswork Situation Manager.
The CA Spectrum API does not supply events with status 'clear' for collection by Cisco Crosswork Situation Manager.
See CA Spectrum for UI configuration instructions.
The workflow of gathering events from CA Spectrum and publishing it to Cisco Crosswork Situation Manager is as follows:
1. The LAM reads the configuration from the ca_spectrum_lam.conf file.
2. It connects the CA Spectrum REST API with the URL given in the config file.
3. It creates a rest_client instance for each server in the server section of the config file.
4. It fetches data either by polling or by subscription as defined in the config file.
5. It prepares a request body and sends it to the CA Spectrum Server.
6. A response is received with incident data in the JSON format.
7. The events are parsed and converted into normalized Cisco Crosswork Situation Manager events.
8. The normalized events are published to the Message Bus.
Configuration
Events received from CA Spectrum are processed according to the configuration in the ca_spectrum_lam.conffile and then they are published to the Cisco Crosswork Situation Manager.
The configuration file contains a JSON object. At the first layer of the object, LAM has a parameter called config, and the object that follows config has all the necessary information to control the LAM.
Monitor
The CA Spectrum LAM takes the incidents from the CA Spectrum Servers. To establish a connection with the CA Spectrum, you can configure the parameters here:
General
| Field |
Type |
Description |
| name and class |
String |
Reserved fields: do not change. Default values are CA Spectrum Lam Monitor and CCASpectrumMonitor. |
| target |
JSON Object |
A top-level container for which you can define one or more target CA Spectrum sources. You can specify the configuration for each target. |
| user_name and Password |
String |
Enter the username and password of the CA Spectrum console. |
| url |
String |
Enter the URL of the server along with the port number in this field. For example https://myspectrumserver:80/ |
| encrypted_password |
String |
If you are using an encrypted password, enter the encrypted password in this field and comment the password field. Either password or the encrypted_password field is used. If both the fields are specified, then only the encrypted_password value will be used by the CA Spectrum LAM. |
| fetch_type |
String |
This option gives you the flexibility to poll events or get events via subscription. The values can be either 'poll' or 'subscription' : Poll: Request body is sent in every poll. Subscription: In case of subscription, the request body is sent only once and then a subscription ID will be received. This subscription id is attached to the request which enables the LAM to not send request body in every poll, the URL with the subscription id is hit and the events are received by the LAM. |
| landscape |
String |
If you want to query specific landscapes (restrictive views), enter the names of the landscapes as a list of strings. The unique Id for each landscape you query will be retrieved by the LAM at startup and used to build the alarm request. |
| limit |
Integer |
Enter the number of events that can be fetched here. The default is set to 1000. If 0, or any negative value is set, it will revert to the default value i.e. 1000. |
| max_thread |
Integer |
Enter the number of threads the LAM will run to fetch the alarms/events from the CA Spectrum servers. Increase the number of threads according to the number of servers that the LAM will fetch data from, and the processing capability (number of cores) of the machine on which the LAM is running. |
| polling_interval |
Integer |
The polling time interval, in seconds, between the requests after which the event data is fetched from the CA Spectrum. Default = 60 seconds. If 0 is entered, the time interval will set to 60 seconds. |
| retry_recovery |
Object |
Specifies the behavior of the LAM when it re-establishes a connection after a failure. - recovery_interval: Length of time to wait between recovery requests in seconds. Must be less than the request_interval set for each target. Defaults to 20. - max_lookback: The period of time for which to recover missed events in seconds. Defaults to -1 (recover all events since the last successful poll). |
| timeout |
Integer |
The value in seconds to wait for a request to complete before timing out. If a timeout occurs, the LAM will wait for the next poll before trying again. Default value is 120 seconds. |
| proxy |
Object |
If you want to connect to CA Spectrum through a proxy server, configure the host, port, user, and password or encrypted password properties in the proxy section for the target. |
Secure Sockets Layer
To set up SSL for CA Spectrum, refer to the CA Spectrum documentation.
Configure the SSL properties for each target if you want to encrypt communications between CA Spectrum and Cisco Crosswork Situation Manager:
· disable_certificate_validation: Whether to disable SSL certificate validation.
· path_to_ssl_files: Path to the directory that contains the SSL certificates.
· server_cert_filename: Name of the SSL root CA file.
· client_key_filename: Name of the SSL client key file.
· client_cert_filename: Name of the SSL client certificate.
Filter
| Field |
Type |
Description |
| filter |
Object |
Parameters to filter incidents: acknowledged: If set to true, only the acknowledged events will be fetched from the CA Spectrum, else, all the alarms will be fetched from CA Spectrum. |
Note:
The LAM starts fetching the events from the current time. After that it saves the last poll time (in epoch format) in a state file. The state file is generated in the same folder where the config file is present e.g. $MOOGSOFT_HOME/config. The LAM generates the name of the state file as <proc_name>.state. Here the default proc_name (process name) is ca_spectrum_lam, therefore, the state file name is ca_spectrum_lam.state. The proc_name is defined in ca_spectrum_lam.sh file located at $MOOGSOFT_HOME/bin.
It is recommended not to make any changes to the state file as this may lead to loss of events.
Example
monitor:
{
name: "CA Spectrum Lam Monitor",
class: "CCASpectrumMonitor",
request_interval: 60,
max_retries: -1,
retry_interval: 60,
retry_recovery:
{
recovery_interval: 20,
max_lookback: -1
},
targets:
{
target1:
{
url: "http://localhost:8080",
user_name: "user name",
password: "password",
#encrypted_password: "ieytOFRUdLpZx53nijEw0rOh07VEr8w9lBxdCc7229o=",
request_interval: 60,
max_retries: -1,
retry_interval: 60,
retry_recovery:
{
recovery_interval: 20,
max_lookback: -1
},
#proxy:
#{
#host: "localhost",
#port: 8181,
#user: "user",
#password: "pass",
#encrypted_password: "ieytOFRUdLpZx53nijEw0rOh07VEr8w9l="
#},
disable_certificate_validation : false,
path_to_ssl_files: "config",
server_cert_filename: "server.crt",
#client_key_filename: "client.key",
#client_cert_filename: "client.crt",
limit: 1000,
timeout: 120,
filter:
{
acknowledged: false
}
},
target2:
{
url: "http://localhost:8080",
user_name: "user name",
password: "password",
request_interval: 60,
max_retries: -1,
retry_interval: 60,
disable_certificate_validation: false,
#path_to_ssl_files: "config",
#server_cert_filename: "server.crt",
limit: 1000,
landscape: ["landscape-1", "landscape-2"],
timeout: 120,
filter:
{
acknowledged: "false"
}
}
}
},
agent:
{
name: "CA Spectrum",
capture_log: "$MOOGSOFT_HOME/log/data-capture/ca_spectrum_lam.log"
},
log_config:
{
configuration_file: "$MOOGSOFT_HOME/config/logging/caspectrum.log.json"
}
Agent and Process Log
Agent and Process Log allow you to define the following properties:
· name: Identifies events the LAM sends to the Message Bus.
· capture_log: Name and location of the LAM's capture log file.
· configuration_file: Name and location of the LAM's process log configuration file.
Mapping
You can directly map the alert/event fields of CA Spectrum with Cisco Crosswork Situation Manager fields displayed in Cisco Crosswork Situation Manager. The mapping example is as follows:
mapping :
{
catchAll: "overflow",
rules:
[
{ name: "signature", rule: "$serverName :: $alarmId" },
{ name: "source_id", rule: "$modelId" },
{ name: "external_id", rule: "$significantModelId" },
{ name: "manager", rule: "CA Spectrum" },
{ name: "source", rule: "$serverName" },
{ name: "class", rule: "$modelClass" },
{ name: "agent", rule: "$LamInstanceName" },
{ name: "agent_location", rule: "$networkAddress" },
{ name: "type", rule: "$modelTypeName" },
{ name: "severity", rule: "$severity", conversion:"sevConverter" },
{ name: "description", rule: "$alarmTitle :: $originatingEvent" },
{ name: "agent_time", rule: "$creationDate", conversion:"stringToInt"}
]
},
filter:
{
presend:"CASpectrumLam.js"
}
The above example specifies the mapping of the CA Spectrum alarm fields with the Cisco Crosswork Situation Manager fields. Data not mapped to fields goes into "Custom Info".
Note:
The signature field is used by the LAM to identify correlated alarms.
Constants and Conversions
Constants and Conversions allows you to convert formats of the received data.
| Field |
Description |
Example |
| Severity and sevConverter |
There is a conversion defined as sevConverter in the Conversions section, this looks up the value of severity defined in the severity section of constants and returns back the mapped integer corresponding to the severity. |
severity: { "0" : 0, "1" : 3, "2" : 4, "3" : 5, "4" : 1, "5" : 1, "6" : 1 }, sevConverter: |
| stringToInt |
Used in a conversion, which forces the system to turn a string token into an integer value. |
stringToInt: |
| timeConverter |
Used in conversion which forces the system to convert time. If epoc time is to be used, then timeFormat mentioned in timeConverter should be commented. Otherwise, the user should provide the timeFormat. |
timeConverter: |
Example
Example Constants and Conversions
constants:
{
severity:
{
"0" : 0,
"1" : 1,
"2" : 2,
"3" : 3,
"4" : 4,
"5" : 5
}
},
conversions:
{
sevConverter:
{
lookup: "severity",
input: "STRING",
output: "INTEGER"
},
stringToInt:
{
input: "STRING",
output: "INTEGER"
},
timeConverter:
{
timeFormat: "yyyy-MM-dd'T'HH:mm:ss.SSS",
input: "STRING",
output: "INTEGER"
}
},
Service Operation Reference
| Process Name |
Service Name |
| ca_spectrum_lam |
caspectrumlamd |
Start the LAM Service:
service caspectrumlamd start
Stop the LAM Service:
service caspectrumlamd stop
Check the LAM Service status:
service caspectrumlamd status
If the integration fails to connect to one or more CA Spectrum sources, creates an alert and writes the details to the process log. Refer to the logging details for LAMs and integrations for more information.
Command Line Reference
You can see the available optional attributes of the ca_spectrum_lam by running the following command:
ca_spectrum_lam --help
The ca_spectrum_lam is a command line executable, and has the following optional attributes:
| Option |
Description |
| --config |
Points to a pathname to find the configuration file for the LAM. This is where the entire configuration for the LAM is specified. |
| --help |
Displays all the command line options. |
| --version |
Displays the component’s version number. |
| --loglevel |
Specifies the level of debugging. By default, User gets everything. In common with all executables in Cisco Crosswork Situation Manager, having it set at that level can result in a lot of output (many messages per event message processed). In all production implementations, it is recommended that log level is set to WARN. This ensures only warning, error and fatal messages are recorded. |
CA UIM
You can install the CA UIM (Unified Infrastructure Management) integration to enable Cisco Crosswork Situation Manager to collect event data from UIM.
See the UIM documentation for details on UIM components.
Before You Begin
The UIM integration has been validated with UIM v8.4. Before you start to set up your integration, ensure you have met the following requirements:
· You have the UIM Hub IP or host name.
· You know the queue name where the alerts will be routed.
Configure the UIM Integration
To configure the CA UIM integration:
1. Navigate to the Integrations tab.
2. Click UIM in the Monitoring section to open the CA UIM integration.
3. Provide a unique integration name. You can use the default name or customize the name according to your needs.
4. Provide connection details for your UIM system.
Configure UIM
You do not need to perform any integration-specific steps on your UIM system. After you configure the integration, Cisco Crosswork Situation Manager requests event data from UIM every 60 seconds.
Configure the CA UIM LAM
This document describes how to install and configure the CA UIM LAM to Cisco Crosswork Situation Manager interface.
See CA UIM for UI configuration instructions.
The UIM LAM is a link access module that:
· Monitors data being written to a queue in UIM.
· Parses this data according to the LAM’s configuration file.
· Constructs events that are passed to the Message Bus.
· Publishes to the subject “Events”.
You can configure the UIM LAM processing of alarms received from UIM by accessing the $MOOGSOFT_HOME/config/uim_lam.conf file, at the following path.
Add UIM SDK to Cisco Crosswork Situation Manager
SNAP/UIM installation has proprietary JAVA SDK included. It is used by multiple components in the SNAP or UIM. Add the SDK jar file to Cisco Crosswork Situation Manager as follows:
1. Locate the file on the server running the Unified Management Portal:
$NIMSOFT_HOME/probes/service/wasp/lib/nimsoft-SDK.jar
2. On Linux can be found in the directory system/opt/nimsoft
3. The file may be named differently depending on the version.
4. Copy the file to the following location in Cisco Crosswork Situation Manager:
$MOOGSOFT_HOME/lib/cots/nonDist
You can use the the nimsoft-SDK.jar when you have the UIM license.
Fully Qualified Domain Name (FQDN) and hostname entry should be made in the host file (hosts).
Configure CA UIM
Create an attach queue on the target hub that will retrieve the "alarm" messages, with the following properties:
· Active: checked
· Name: moogsoft_alarm_queue
· Type: Attach
· Address: N/A
· Subject: alarm
· Bulk Size: N/A
Set the Subject to "alarm". All other messages will be discarded by the CA UIM LAMbot This reduces overhead on the target hub and CA UIM LAMbot.
Configure the CA UIM LAM
The alarms received from the UIM are processed according to the configurations in the configuration file. The processed alarms are published to Cisco Crosswork Situation Manager.
The configuration file contains a JSON object. At the first layer of the object, the LAM has a parameter called config, and the object that follows config has all the necessary information to control the LAM.
The following sections are available for configuration in the UIM LAM configuration file:
Monitor
The UIM LAM takes its input from a queue created in UIM. To establish a connection with UIM, you can configure the parameters here:
General
| Field |
Type |
Description |
| name and class |
String |
Reserved fields: do not change. |
| hub |
String |
Enter the hub IP/hostname/FQDN of the UIM application. Note UIM Lam connects to the UIM hub (default port is 48002). Firewall, if any, should not block access to the port when UIM hub is running. |
| queue |
String |
Enter the queue name from where you will subscribe the events. In case of multiple queue names, you can separate the queue with “,”. |
| bulksize |
Integer |
The bulksize provides you the option to control the flow of received alerts. The entry in this field limits the LAM to process the number of events in one go. It can be either zero or greater than zero. Defaults to 100. If a value of 100 is set, then at a time LAM will process 100 events. In case, when no value is given or 0 is entered in this field, then all the events received by LAM will get processed. |
Example
Config File
monitor:
{
name : "UIM Monitor",
class : "CUimMonitor",
hub : "127.0.0.1",
queue : "queueName"
bulksize : 100
},
Note:
The entry in the field bulksize should be an integer, therefore enter the value in this field without quotation marks.
Agent and Process Log
Agent and Process Log allow you to configure the following properties:
· name: Identifies events the LAM sends to the Message Bus.
· capture_log: Name and location of the LAM's capture log file.
· configuration_file: Name and location of the LAM's process log configuration file.
Data Parsing
Any received data needs to be broken up into tokens. Once the LAM knows the tokens, then it can start assembling an event.
In UIM LAM, the data is received in PDS (CA Proprietary format) and is extracted to MAP format.
Mapping
You can directly map the alarm fields of UIM with fields displayed in the Cisco Crosswork Situation Manager. Here input is restricted to JSON only, so the builtInMapper option will not be used for this LAM.
The mapping example is as follows:
mapping:
{
catchAll: "overflow",
rules:
[
{ name: "signature", rule: "$origin::$robot" },
{ name: "source_id", rule: "$source" },
{ name: "external_id", rule: "$external_id" },
{ name: "manager", rule: "UIM" },
{ name: "source", rule: "$source" },
{ name: "class", rule: "$subject" },
{ name: "agent", rule: "$LamInstanceName" },
{ name: "agent_location", rule: "$origin" },
{ name: "type", rule: "$values.robotname" },
{ name: "severity", rule: "$pri", conversion: "stringToInt" },
{ name: "description", rule: "$message" },
{ name: "agent_time", rule: "$nimts", conversion: "timeConverter" }
]
},
filter:
{
presend: "UimLam.js"
}
The above example specifies the mapping of the UIM alarm fields with the Cisco Crosswork Situation Manager fields.
Note:
The signature field is used by the LAM to identify the correlated alarms. By default, it is set to a combination of the source and robot field. However, you can change it as per the requirements.
The following table and images show the mapped UIM LAM variables with the fields.
UIM alarm fields and alert fields mapping with examples
| UIM Alarm Fields |
Alert Fields |
| $origin::$robot Example:WIN-FIJMK6PJEI8_hubWIN-FIJMK6PJEI8 |
Signature Example: WIN-FIJMK6PJEI8_hubWIN-FIJMK6PJEI8 This parameter is for mapping only and is not displayed in the UI. |
| $source Example: 10.122.42.160 |
source_id Example: 10.122.42.160 |
| $external_id Example: Dummy field not present in UIM alarm, any other UIM field can be configured here. |
external_id Example: This is not displayed in the UI. |
| $origin Example: WIN-FIJMK6PJEI8_hub |
Manager Example: WIN-FIJMK6PJEI8_hub |
| $source Example: 10.122.42.160 |
Source Example: 10.122.42.160 |
| $subject Example: alarm |
Class Example: alarm |
| $LamInstanceName Example: Dummy field not present in UIM alarm, any other UIM field can be configured here. |
Agent Example: This is not displayed in the UI. |
| $origin Example: WIN-FIJMK6PJEI8_hub |
agent_location Example: WIN-FIJMK6PJEI8_hub |
| $values.robotname Example: WIN-FIJMK6PJEI8 |
Type Example: WIN-FIJMK6PJEI8 |
| $pri Example: 2 |
Severity Example: Warning |
| $message Example: Average (2 samples) total CPU is 14.90 % |
Description Example: Average (2 samples) total CPU is 14.90 % |
| $nimts Example:1475659822 |
agent_time Example:10:32:22 10/05/2016 Here the timeFormat "%D %T" is used. |
UIM CPU alarm fields:

UIM Disk alarm fields:
Constants and Conversions
| Field |
Description |
Example |
| Severity and sevConverter |
has a conversion defined as sevConverter in the Conversions section, this looks up the value of severity defined in the severity section of constants and returns back the mapped integer corresponding to the severity |
severity: sevConverter: { |
| stringToInt |
used in a conversion, which forces the system to turn a string token into an integer value |
stringToInt: |
| timeConverter |
used in conversion which forces the system to convert time. If epoch time is to be used, then timeFormat mentioned in timeConverter should be commented. Otherwise, the user should provide the timeFormat |
timeConverter: |
Example
Example Constants and Conversions
constants:
{
severity:
{
"CLEAR" : 0,
"INDETERMINATE" : 1,
"WARNING" : 2,
"MINOR" : 3,
"MAJOR" : 4,
"CRITICAL" : 5
}
},
conversions:
{
sevConverter:
{
lookup: "severity",
input: "STRING",
output: "INTEGER"
},
stringToInt:
{
input: "STRING",
output: "INTEGER"
},
timeConverter:
{
timeFormat: "yyyy-MM-dd'T'HH:mm:ss",
input: "STRING",
output: "INTEGER"
}
},
Custom Info
Events are displayed in Cisco Crosswork Situation Manager, and the data in the fields of the event mapped in the mapping section are shown in the respective columns of Cisco Crosswork Situation Manager columns. The incident fields which are not mapped in the mapping section are displayed in the Custom Info field for alert. An example of Custom Info is as follows:

Severity Reference
Moogsoft Severity Levels
severity:
{
"CLEAR" : 0,
"INDETERMINATE" : 1,
"WARNING" : 2,
"MINOR" : 3,
"MAJOR" : 4,
"CRITICAL" : 5,
}
| Level |
Description |
| 0 |
Clear |
| 1 |
Indeterminate |
| 2 |
Warning |
| 3 |
Minor |
| 4 |
Major |
| 5 |
Critical |
Service Operation Reference
| Process Name |
Service Name |
| uim_lam |
uimlamd |
Start the LAM Service:
service uimlamd start
Stop the LAM Service:
service uimlamd stop
Check the LAM Service status:
service uimlamd status
Command Line Reference
To see the available optional attributes of the uim_lam, run the following command:
uim_lam --help
The uim_lam is a command line executable, and has the following optional attributes:
| Option |
Description |
| --config |
Points to a pathname to find the configuration file for the LAM. This is where the entire configuration for the LAM is specified. |
| --help |
Displays all the command line options. |
| --version |
Displays the component’s version number. |
| --loglevel |
Specifies the level of debugging. By default, user gets everything. In common with all executables in Cisco Crosswork Situation Manager, having it set at that level can result in a lot of output (many messages per event message processed).In all production implementations, it is recommended that log level is set to WARN. This ensures only warning, error and fatal messages are recorded. |
UIM Configuration
This doc covers the integration steps to provide an alarm integration from UIM to Cisco Crosswork Situation Manager. The integration has following steps:
· Add the UIM SDK to Cisco Crosswork Situation Manager.
· Create/Identify the queue on the hub which is active and attach the alarm messages
· Enter the queue name and hub IP/hostname/FQDN in the Monitor section of the uim_lam.conf file.
Knowledge of the SNAP and UIM system is required. The SSL is currently not supported in the UIM LAM.
Add the UIM SDK to Cisco Crosswork Situation Manager
SNAP/UIM installation has proprietary JAVA SDK included with it. It is used by multiple components in the SNAP or UIM. The SDK jar has to be added to Cisco Crosswork Situation Manager.
Copy the nimsoft-SDK.jar to the following location in Cisco Crosswork Situation Manager: $MOOGSOFT_HOME/lib/cots/nonDist.
The nimsoft-SDK.jar can be found in the UIM installation home directory. The SDK jar is located here:
<nimsoft_home>\probes\service\wasp\webapps\nisapi\WEB-INF\lib
The nimsoft-SDK.jar for Linux can be found in the directory system/opt/nimsoft.
The name of the UIM SDK jar can be different for different versions. Fully qualified domain name (FQDN) and hostname entry should be made in the host file.
The nimsoft-SDK.jar can only be used if the user has the UIM license.
UIM Queue creation/selection
The subscribe mechanism enables the client to select alarms based on the alarms subject. A client that is configured to receive UIM alarms sends a subscribe request to the hub. The client then receives alarms matching the subscribed subjects from the hub.
The subscribed alarms are received by the UIM LAM from an attached queue in UIM. If an attached queue is present in UIM then it can be used, otherwise, a new attached queue can be created. The queue is created in the hub view part of the Infrastructure Manager application of UIM.
Note:
For UIM SNAP, the Infrastructure Manager application is not available, therefore the steps mentioned below will not be applicable. To get the queue details of UIM SNAP navigate to C:\Program Files\CA\UIM Snap\hub\q . Check if event_management is present; this will be the default queue name
Note:
The below-mentioned steps are only applicable for UIM.
Note:
The Infrastructure Manager can only be installed on a windows machine. For UIM installed on Linux, the Infrastructure Manager application installed on windows OS and connected to it is used for queue creation.The Infrastructure Manager is accessed by taking a remote connection of the windows machine on which it is installed.
The steps to create a queue are as follows:
1. Click on the Windows Start button and navigate to All Programs > Nimsoft Monitoring. Click on Infrastructure Manager.
2. Click on Security and then select Login
3. Enter the user Credentials in the Login dialog and click on OK.
4. Navigate to the Robot in the left panel where hub is deployed.
5. Select the Robot. It displays the probes in the right panel.
6. Double-click the hub probe to open the hub dialog, then select the Queues tab.
7. Click the New button in the Queues tab of the hub configuration dialog. The New Queue dialog opens. Complete the details as follows:
a. Name: "Queue_Name"
b. Type: attach
c. Address: Leave blank (not required)
d. Message: alarm2 - Will provide enriched alarm.
e. Alarm message can be used but this will not provide an enrichment alarms process by UIM.
8. Enter the following details in the New Queue dialog and then click OK:
a. Active: Select the check box. If the check box is not selected, then the queue will not send the alarms from UIM
b. Name: Enter the desired name of the queue
c. Type: Select attach. Selecting attach disables the Address and Bulk Size field
d. Address: The field remains disabled
e. Subject: Select alarm
f. Bulk size: It is automatically set to <default> and disabled
The queue is added to the Queues tab in the hub configuration window.
9. Click Apply in the hub configuration window.
10. The queue is added to the Queues tab of hub configuration window.
11. Click on Apply in the hub configuration window.
12. When prompted to restart the hub, click Yes.
The queue is created and its status can be checked in the Status tab.
Catchpoint
You can configure a Catchpoint webhook to post alert data to Cisco Crosswork Situation Manager when an event occurs in Catchpoint. After you configure the integration, Catchpoint sends alert data to Cisco Crosswork Situation Manager.
Refer to the LAM and Integration Reference to see the integration's default properties. When you use the integrations UI, you can only configure the visible properties.
If you want to implement a more complex Catchpoint integration with custom settings, see Configure the Catchpoint LAM.
See the Catchpoint documentation for details on Catchpoint components.
Before You Begin
The Catchpoint integration has been validated with Catchpoint 2019. Before you start to set up your integration, ensure you have met the following requirements:
· You have an active Catchpoint account with administrator privileges.
· Catchpoint can make requests to external endpoints over port 443.
Configure the Integration
To configure the Catchpoint integration:
1. Navigate to the Integrations tab.
2. Click Catchpoint in the Monitoring section.
3. Provide a unique integration name. You can use the default name or customize the name according to your needs.
4. Set a Basic Authentication username and password.
Configure Catchpoint
Log into the Catchpoint Administration UI to configure an alert webhook endpoint to send event data to Cisco Crosswork Situation Manager. For more help, see the Catchpoint documentation.
1. Create a new alert webhook endpoint with the following details:
| Field |
Value |
| Name |
Cisco Crosswork Situation Manager |
| Status |
Active |
| Endpoint URL |
<your Catchpoint integration URL> For example: https://example.Moogsoft.com/events/catchpoint_catchpoint1 |
| On Failure Alert |
An email address to notify in case of failure |
| Format |
Template |
2. Add a new template with the following custom JSON payload and add it to the endpoint:
{
"source":"${testURL}",
"source_id":"${testURL}",
"external_id":"${testId}",
"agent_location":"${nodeDetails(${nodeName};)}",
"severity":"${notificationLevelId}",
"type":"${Switch(${AlertTypeId},'0', 'Unknown','2', 'Byte Length','3','Content Match','4', 'Host Failure','5', 'http Header Match','7', 'Response Time','8', 'Traffic (RU Only)','9', 'Page Failure', '10','Insight', '11','Javascript Failure', '12', 'Ping','13', 'Requests','14', 'Zone','15', 'Availability','16', 'Address')}",
"manager":"Catchpoint",
"class":"${productName}",
"description":"${testName}",
"agent_time":"${alertCreateDateUtcEpoch}"
}
3. Add the following API request header fields to endpoint:
| Field |
Value |
| Content-Type |
application/json |
| Authorization |
<your Basic Authorization key> |
4. Add the webhook to any alert policies that will send notifications to Cisco Crosswork Situation Manager.
After you complete the integration, Catchpoint sends new events to Cisco Crosswork Situation Manager.
Configure the Catchpoint LAM
The Catchpoint LAM receives and processes Catchpoint events forwarded to Cisco Crosswork Situation Manager. The LAM parses the data into Cisco Crosswork Situation Manager events.
You can install a basic Catchpoint integration in the UI. See Catchpoint for integration steps.
Configure the Catchpoint LAM if you want to configure custom properties, set up high availability or configure advanced options that are not available in the UI integration.
Before You Begin
The Catchpoint LAM has been validated with Catchpoint 2019. Before you configure the LAM, ensure you have met the following requirements:
· You have an active Catchpoint account with administrator privileges.
· Catchpoint can make requests to external endpoints over port 443.
If you are configuring a distributed deployment refer to /document/preview/77155#UUIDbea404d9dd1afee65fa1471105d1b3c6 first. You will need the details of the server configuration you are going to use for HA.High Availability Overview
Configure the LAM
Edit the configuration file to control the behavior of the Catchpoint LAM. You can find the file at $MOOGSOFT_HOME/config/catchpoint_lam.conf.
The Catchpoint LAM is a REST-based LAM as it provides an HTTP endpoint for data ingestion. Note that only the generic REST LAM properties in catchpoint_lam.conf apply to integrating with Catchpoint; see the LAM and Integration Reference for a full description of all properties.
Some properties in the file are commented out by default; remove the '#' character to enable them.
1. Configure the connection properties for the REST connection:
a. address: Address on the Cisco Crosswork Situation Manager server that listens for REST messages. Defaults to all interfaces.
b. port: Port on the Cisco Crosswork Situation Manager server that listens for REST messages. Defaults to 8888.
2. Configure authentication:
a. authentication_type: Type of authentication used by the LAM. Defaults to none.
b. basic_auth_static: Username and password used for Basic Auth Static authentication.
c. authentication_cache: Whether to cache the username and password for the current connection when the authentication type is Basic.
3. Configure the LAM behavior:
a. accept_all_json: Allows the LAM to read and process all forms of JSON.
b. lists_contain_multiple_events: Whether Cisco Crosswork Situation Manager interprets a JSON list as multiple events.
c. num_threads: Number of worker threads to use for processing events.
d. rest_response_mode: When to send a REST response. See the LAM and Integration Reference for the options.
e. rpc_response_timeout: Number of seconds to wait for a REST response.
f. event_ack_mode: When Moogfarmd acknowledges events from the Catchpoint LAM during the event processing pipeline.
4. Configure the SSL properties if you want to encrypt communications between the LAM and the REST connection:
a. use_ssl: Whether to use SSL certification.
b. path_to_ssl_files: Path to the directory that contains the SSL certificates.
c. ssl_key_filename: The SSL server key file.
d. ssl_cert_filename: The SSL root CA file.
e. use_client_certificates: Whether to use SSL client certification.
f. client_ca_filename: The SSL client CA file.
g. auth_token or encrypted_auth_token: Authentication token in the request body.
h. header_auth_token or encrypted_header_auth_token: Authentication token in the request header.
i. ssl_protocol: Sets the allowed SSL protocols.
5. Optionally configure the LAM identification and logging details in the agent and log:
a. name: Identifies events the LAM sends to the Message Bus.
b. capture_log: Name and location of the LAM's capture log file.
c. configuration_file: Name and location of the LAM's process log configuration file.
6. Optionally configure severity conversions. See /document/preview/11721#UUID8b183a1e1278a7a652d3ae86944d7379 for further information and "Conversion Rules" in /document/preview/95030#UUIDc06d3f9c8b3d99f90b7227c2e2d8afae for details on conversions in general.Severity ReferenceData Parsing
Example
An example Catchpoint configuration is as follows:
monitor:
{
name : "Catchpoint Lam",
class : "CRestMonitor",
port : 8888,
address : "0.0.0.0",
use_ssl : false,
#path_to_ssl_files : "config",
#ssl_key_filename : "server.key",
#ssl_cert_filename : "server.pem",
#use_client_certificates : false,
#client_ca_filename : "ca.crt",
#auth_token : "my_secret",
#encrypted_auth_token : "dfJtTQMGiFHfiq7sCmxguBt6Jv+eytkoiKCquSB/7iWxpgGsG2aez3z2j7SuBtKj",
#header_auth_token : "my_secret",
#encrypted_header_auth_token : "dfJtTQMGiFHfiq7sCmxguBt6Jv+eytkoiKCquSB/7iWxpgGsG2aez3z2j7SuBtKj",
#ssl_protocols : [ "TLSv1.2" ],
authentication_type : "none",
authentication_cache : true,
accept_all_json : false,
lists_contain_multiple_events : true,
num_threads : 5,
rest_response_mode : "on_receipt",
rpc_response_timeout : 20,
event_ack_mode : "queued_for_processing"
},
agent:
{
name : "Catchpoint",
capture_log : "$MOOGSOFT_HOME/log/data-capture/catchpoint_lam.log"
},
log_config:
{
configuration_file : "$MOOGSOFT_HOME/config/logging/catchpoint_lam_log.json"
},
Configure for High Availability
Configure the Catchpoint LAM for high availability if required. See /document/preview/77155#UUIDbea404d9dd1afee65fa1471105d1b3c6 for details.High Availability Overview
Configure LAMbot processing
The Catchpoint LAMbot processes and filters events before sending them to the Message Bus. You can customize or bypass this processing if required. You can also load JavaScript files into the LAMbot and execute them.
See LAMbot Configuration for more information. An example Catchpoint LAM filter configuration is shown below.
filter:
{
presend: "CatchpointLam.js",
modules: [ "CommonUtils.js" ]
}
Start and Stop the LAM
Restart the Catchpoint LAM to activate any changes you make to the configuration file or LAMbot.
The LAM service name is catchpointlamd.
See /document/preview/11677#UUID1a2205c3aae40b26fdfe94490043f3c3 for the commands to start, stop and restart the LAM.Control Processes
You can use a GET request to check the status of the Catchpoint LAM. See "Check the LAM Status" in Configure the REST LAM for further information and examples.
Configure Catchpoint
After you have the Catchpoint LAM running and listening for incoming requests, you can configure Catchpoint. See "Configure Catchpoint" in Catchpoint.
Cherwell
You can integrate with Cherwell Service Management to create and update Cherwell incidents from open Situations in Cisco Crosswork Situation Manager.
You can enable auto-assign so new Cherwell incidents created from Cisco Crosswork Situation Manager are automatically assigned to the logged in user.
See the Cherwell Service Management documentation for information on Cherwell components.
Before You Begin
The Cherwell integration has been validated with Cherwell Service Management v9.3. Before you start to set up your Cherwell integration, ensure you have met the following requirements:
· You have the URL of your Cherwell installation.
· You know the Cherwell credentials for Cisco Crosswork Situation Manager to authenticate to Cherwell. The user you are using for authentication is also a customer in Cherwell.
· You know the API user and the Client REST API key.
· You know the Business Object Name to map to Situations. For example, "Incident".
· If you are using auto-assign, the Cisco Crosswork Situation Manager user accounts map directly to users in Cherwell. The username and full name must have the same value in both systems.
Configure the Cherwell Integration
To configure the Cherwell integration:
1. Navigate to the Integrations tab.
2. Click Cherwell in the Ticketing section.
3. Provide a unique integration name. You can use the default name or customize the name according to your needs.
4. Provide connection details for your Cherwell system.
Cherwell Configuration
1. To integrate Cherwell, download the MoogsoftAIOps-Cherwell-Blueprint-1.0.bpp.
2. Open and publish the blueprint in Cherwell Service Management Administrator.
3. Launch the Cherwell Service Management console and go to Settings > Open Stored Values Manager.
4. Find "MoogsoftAIOpsCherwellEndpoint" under Global, copy the URL from the UI and paste it into the Value field.
5. Save the changes.
After you complete the Cherwell integration, you can right-click a Situation and select Open Cherwell Incident from the contextual menu. Cisco Crosswork Situation Manager maintains a link to the Cherwell incident and updates it with your comments and status changes. For more information see /document/preview/24336#UUID5dfdd9e1a956fd58d1b87db8a70ab35f.Cherwell Workflow
You may have to wait up to a minute (60 seconds) for the bi-directional endpoint to complete its setup.
DataDog
You can integrate Cisco Crosswork Situation Manager with Datadog via two products. Choose your integration process below according to your Datadog and Cisco Crosswork Situation Manager environments:
· Datadog Polling: The polling method is useful when Datadog cannot push events to Cisco Crosswork Situation Manager due to firewall or security issues. You may therefore want to use this method if you are using Cisco Crosswork Situation Manager on-premises and Datadog in the cloud.
· Datadog Webhook: For all other Datadog and Cisco Crosswork Situation Manager deployments, use this integration to set up a webhook notification channel in Datadog.
Datadog Polling
The Datadog Polling integration allows you to retrieve events from one or more Datadog servers and send them to Cisco Crosswork Situation Manager as events.
Refer to the Datadog Polling Reference and LAM and Integration Reference to see the integration's default properties. When you use the integrations UI, you can only configure the visible properties.
If you want to implement a more complex Datadog Polling LAM with custom settings, see Configure the Datadog Polling LAM.
See the Datadog documentation for details on Datadog components.
Before You Begin
The Datadog Polling integration has been validated with Datadog v2018. Before you set up your integration, ensure you have met the following requirements for each Datadog instance:
· The port for your Datadog server is open and accessible from Cisco Crosswork Situation Manager.
· Your Datadog system can accept HTTPS requests.
· You know your Datadog server URL.
· You know your Datadog API key and Application Key.
Additionally, you can provide optional configuration details. See the Datadog Polling Reference and LAM and Integration Reference for a description of all properties.
Configure the Datadog Polling Integration
To configure the Datadog Polling integration:
1. Navigate to the Integrations tab.
2. Click Datadog Polling in the Monitoring section.
3. Provide a unique integration name. You can use the default name or customize the name according to your needs.
4. Provide connection details for your Datadog system.
Configure Datadog Polling
You do not need to perform any integration-specific steps on your Datadog system. After you configure the integration, it polls your Datadog servers at regular intervals to collect data (every 60 seconds by default).
If the integration fails to connect to one or more sources, Cisco Crosswork Situation Manager creates an alert and writes the details to the process log. Refer to the logging details for LAMs and integrations for more information.Configure Logging
Configure the Datadog Polling LAM
The Datadog Polling LAM allows you to retrieve alerts from Datadog. The Datadog Polling LAM is an HTTPS client that polls one or more Datadog servers at configurable intervals. It parses the JSON responses it receives into Cisco Crosswork Situation Manager events.
You can install a basic Datadog Polling integration in the UI. See Datadog Polling for integration steps.
Configure the Datadog Polling LAM if you want to configure custom properties, set up high availability or configure advanced options that are not available in the UI integration.
Before You Begin
The Datadog Polling LAM has been validated with Datadog v2018. Before you set up the LAM, ensure you have met the following requirements for each Datadog server:
· You know your Datadog server URL.
· You know your Datadog API key and Application Key.
· The port for your Datadog server is open and accessible from Cisco Crosswork Situation Manager.
· Your Datadog system can accept HTTPS requests.
Configure the LAM
Edit the configuration file to control the behavior of the Datadog Polling LAM. You can find the file at $MOOGSOFT_HOME/config/datadog_client_lam.conf
See the Datadog Polling Reference and LAM and Integration Reference for a full description of all properties. Some properties in the file are commented out by default. Uncomment properties to enable them.
1. Configure the connection properties for each Datadog target:
a. url: Datadog request URL including host and port.
b. user: Datadog account user.
c. password or encrypted password: Datadog account password or encrypted password.
d. Determine how to select and process Datadog events for each target:
e. enable_epoch_converter: You can use an epoch timestamp instead of a machine timestamp.
f. params_date_format: Date format to include in Datadog query.
g. request_query_params: SQL query to select Datadog events. See Datadog Polling Reference for an example.
h. overlap_identity_fields: List of payload tokens the LAM uses to identify duplicate events when Datadog returns all open events and not just updated events. Defaults to id.
i. requests_overlap: Period of time to delay processing duplicates.
j. results_path: Location of the JSON results objects in the data structure. Default to results.
2. Configure the LAM behavior for each target:
a. request_interval: Length of time to wait between requests, in seconds.
b. timeout: Length of time to wait before halting a connection or read attempt, in seconds.
c. num_threads: Number of worker threads to use when processing events.
3. Configure the SSL properties if you want to use SSL to encrypt communications between Datadog and Cisco Crosswork Situation Manager:
a. disable_certificate_validation: Whether to disable SSL certificate validation.
b. path_to_ssl_files: Path to the directory that contains the SSL certificates.
c. server_cert_filename: Name of the SSL root CA file.
d. client_key_filename: Name of the SSL client key file.
e. client_cert_filename: Name of the SSL client certificate.
4. If you want to connect to Datadog through a proxy server, configure the host, port, user, and password or encrypted password properties in the proxy section for the target.
5. Optionally configure the LAM identification and logging details in the agent and log_config sections of the file:
a. name: Identifies events the LAM sends to the Message Bus.
b. capture_log: Name and location of the LAM's log file.
c. configuration_file: Name and location of the LAM's process log configuration file.
6. Optionally configure severity conversions. See /document/preview/11721#UUID8b183a1e1278a7a652d3ae86944d7379 for further information and "Conversion Rules" in /document/preview/11720#UUID5c67156b667b1a28ec648cd779393914 for details on conversions in general.Severity ReferenceData Parsing
Example
You can configure the Datadog LAM to retrieve events from one or more targets. The following example demonstrates a configuration that targets two Datadog sources. For a single source, comment out the target2 section. If you have more than two sources, add a target section for each one and uncomment properties to enable them.
In the following example, the Datadog LAM is configured to poll two different Datadog instances. The LAM uses the tokens NodeID and EventID to identify duplicate events. These configurations specify use variables $from and $to for the query time window; the LAM specifies UNIX epoch values for these fields when it sends a poll request.
monitor:
{
name : "Datadog REST Client Monitor",
class : "CRestClientMonitor",
request_interval : 60,
targets:
{
target1:
{
url : "https://instance1.datadoghq.com/api/v1/events",
proxy:
{
host : "localhost",
port : 8181,
user : "user",
password : "pass",
#encrypted_password : "ieytOFRUdLpZx53nijEw0rOh07VEr8w9lBxdCc7229o="
},
request_interval : 60,
timeout : 120
disable_certificate_validation : false,
path_to_ssl_files : "config",
server_cert_filename : "server.crt",
client_key_filename : "client.key",
client_cert_filename : "client.crt",
requests_overlap : 10,
enable_epoch_converter : true,
results_path : "events",
overlap_identity_fields : [ "NodeID", "EventID" ],
request_query_params:
{
start : "$from",
end : "$to",
api_key : "1234",
application_key : "1234"
},
params_date_format : "%s"
}
target2:
{
url : "https://instance2.datadoghq.com/api/v1/events",
user : "user2",
host : "localhost",
port : 8181,
request_interval : 60,
timeout : 120
disable_certificate_validation : false,
path_to_ssl_files : "config",
server_cert_filename : "server.crt",
client_key_filename : "client.key",
client_cert_filename : "client.crt",
path_to_ssl_files : "config",
requests_overlap : 10,
enable_epoch_converter : true,
results_path : "events",
overlap_identity_fields : [ "NodeID", "EventID" ],
request_query_params:
{
start : "$from",
end : "$to",
api_key : "1234",
application_key : "1234"
},
params_date_format : "%s",
}
}
},
agent:
{
name : "Datadog Client",
capture_log : "$MOOGSOFT_HOME/log/data-capture/datadog_client_lam.log"
},
log_config:
{
configuration_file : "$MOOGSOFT_HOME/config/logging/datadog_client_lam_log.json"
},
Configure for High Availability
Configure the Datadog LAM for high availability if required. See /document/preview/77155#UUIDbea404d9dd1afee65fa1471105d1b3c6 for details.High Availability Overview
Configure LAMbot Processing
The Datadog Polling LAMbot processes and filters events before sending them to the Message Bus. You can customize or bypass this processing if required. You can also load JavaScript files into the LAMbot and execute them.
See LAMbot Configuration for more information. An example Datadog Polling LAM filter configuration is shown below.
filter:
{
presend: "DatadogClientLam.js",
modules: [ "CommonUtils.js" ]
}
Map LAM Properties
You can configure custom mappings in the Datadog Polling LAMbot. See /document/preview/11720#UUID5c67156b667b1a28ec648cd779393914 information for details.Data Parsing
By default, the following DataDog event properties map to the following Cisco Crosswork Situation Manager Datadog Polling LAM properties:
| Datadog Event Property |
Datadog LAM Event Property |
| $host:$device_name:$id:$source |
signature |
| $device_name |
source_id |
| $id |
external_id |
| Datadog:$source |
manager |
| $host |
source |
| Datadog Event |
class |
| $source |
agent |
| $host |
agent_location |
| $alert_type |
severity |
| $title |
description |
| $priority", conversion: "sevConverter" |
severity |
| $date_happened |
agent_time |
The overflow properties are mapped to "custom info" and appear under custom_info in Cisco Crosswork Situation Manager alerts. This mapping requires Event Monitor tag values in the correct format ({{event.tags.example-tag}}) as described in the Datadog documentation.
| DataDog Event Property |
Datadog LAM Overflow Property |
| url |
eventDetails.url |
| is_aggregate |
eventDetails.is_aggregate |
| tags |
eventDetails.tags |
| resource |
eventDetails.resource |
| priority |
eventDetails.priority |
| text |
eventDetails.text |
| value |
eventDetails.value |
| threshold |
eventDetails.threshold |
Start and Stop the LAM
Restart the Datadog LAM to activate any changes you make to the configuration file or LAMbot.
The LAM service name is datadoglamd.
See /document/preview/11677#UUID1a2205c3aae40b26fdfe94490043f3c3for further details.Control Processes
If the LAM fails to connect to one or more Datadog sources, Cisco Crosswork Situation Manager creates an alert and writes the details to the process log. Refer to the logging details for LAMs and integrations for more information.Configure Logging
Datadog Polling Reference
This is a reference for the Datadog Polling LAM and UI integration. The Datadog LAM configuration file is located at: $MOOGSOFT_HOME/config/datadog_client_lam.conf.
The following properties are unique to the Datadog Polling LAM and UI integration.
See the LAM and Integration Reference for a full description of all common properties used to configure LAMs and UI intergrations.
See the Datadog documentation for details on Datadog components.
url
Datadog request URL including host and port.
Type: String
Required: Yes
Default: N/A
request_query_params
The query used to select Datadog data. The $from and $to properties define the time period. Specify strings in the format defined in the params_date_format property. Include your Datadog API Key and Application Key.
Type: String
Required: Yes
Default: N/A
Example:
request_query_params:
{
start : "$from",
end : "$to",
api_key : "7470e8b910bf84ba30bd79b437414ba4",
application_key : "3f7ae69fe49de64a3e166c8693fb11653073f560"
}
params_date_format
Date format to use in the $from and $to properties in request_query_params.
Type: String
Required: Yes
Default: "yyyy-MM-dd'T'HH:mm:ss"
enable_epoch_converter
Defines whether to use an epoch timestamp instead of a machine timestamp.
Type: Boolean
Required: Yes
Default: False
results_path
Location of the JSON results objects in the data structure.
Type: String
Required: Yes
Default: "results"
Datadog Webhook
You can configure a Datadog Webhook to post data to Cisco Crosswork Situation Manager when an event occurs in Datadog.
Refer to the LAM and Integration Reference to see the integration's default properties. When you use the integrations UI, you can only configure the visible properties.
If you want to implement a more complex Datadog Webhook LAM with custom settings, see Configure the Datadog Webhook LAM.
See the Datadog documentation for details on Datadog components.
Before You Begin
Before you start to set up your Datadog integration, ensure you have met the following requirements:
· You have an active Datadog account.
· You have the necessary permissions to create a webhook in Datadog.
· Datadog can make requests to external endpoints over port 443. This is the default.
Configure the Datadog Integration
To configure the Datadog Webhook integration:
1. Navigate to the Integrations tab.
2. Click DataDog in the Monitoring section.
3. Provide a unique integration name. You can use the default name or customize the name according to your needs.
4. Set a Basic Authentication username and password.
Configure Datadog
Log in to Datadog to create a webhook to send event data to your system. For more help, see Datadog documentation.
1. Create a webhook in Datadog.
2. Add a name and enter the URL for this system:
| Field |
Value |
| New Name |
Event Webhook |
| New URL |
<your Datadog integration URL> For example: https://example.Cisco.com/events/datadog_datadog1 |
3. Enable 'Custom Payload' and apply this template:
{
"source": "$HOSTNAME",
"external_id": "$ALERT_ID",
"severity": "$ALERT_TYPE",
"type": "$EVENT_TYPE",
"class": "$EVENT_TITLE",
"agent_time": "$LAST_UPDATED",
"id":"$ID",
"alert_transition":"$ALERT_TRANSITION",
"user":"$USER",
"email":"$EMAIL",
"username":"$USERNAME",
"snapshot":"$SNAPSHOT",
"link":"$LINK",
"text_only_msg":"$TEXT_ONLY_MSG",
"priority":"$PRIORITY",
"tags":"$TAGS",
"date":"$DATE",
"alert_metrc":"$ALERT_METRIC",
"alert_type":"$ALERT_TYPE",
"metric_namespace":"$METRIC_NAMESPACE",
"aggreg_key":"$AGGREG_KEY",
"org_id":"$ORG_ID",
"alert_status":"$ALERT_STATUS",
"alert_scope":"$ALERT_SCOPE",
"alert_title":"$ALERT_TITLE",
"alert_cycle_key":"$ALERT_CYCLE_KEY"
}
4. Encode the credentials from the Integrations UI in Base64 using the format "<userid>:<password>".
5. For example "datadog:mqgrLAzahG2GJ9My" becomes "ZGF0YWRvZzptcWdyTEF6YWhHMkdKOU15".
6. Create a 'Custom Header' using the encoded credentials as follows:
{
"Content-Type": "application/json",
"Authorization": "Basic <base64 encoded credentials>"
}
7. For example:
{
"Content-Type": "application/json",
"Authorization": "Basic ZGF0YWRvZzptcWdyTEF6YWhHMkdKOU15"
}
8. Add your webhook name as a service to notify for any Monitors that will send events to Cisco Crosswork Situation Manager.
After you complete the configuration, Datadog sends new events to Cisco Crosswork Situation Manager.
Configure the Datadog Webhook LAM
The Datadog Webhook LAM receives and processes Datadog events forwarded to Cisco Crosswork Situation Manager. The LAM parses the data into Cisco Crosswork Situation Manager events.
You can install a basic Datadog Webhook integration in the UI. See Datadog Webhook for integration steps.
Configure the Datadog Webhook LAM if you want to configure custom properties, set up high availability or configure advanced options that are not available in the UI integration.
Before You Begin
Before you configure the Datadog Webhook LAM, ensure you have met the following requirements:
· You have an active Datadog account.
· You have the necessary permissions to create a webhook in Datadog.
· Datadog can make requests to external endpoints over port 443. This is the default.
If you are configuring a distributed deployment refer to /document/preview/77155#UUIDbea404d9dd1afee65fa1471105d1b3c6 first. You will need the details of the server configuration you are going to use for HA.High Availability Overview
Configure the LAM
Edit the configuration file to control the behavior of the Datadog Webhook LAM. You can find the file at $MOOGSOFT_HOME/config/datadog_lam.conf
The Datadog Webhook LAM is a REST-based LAM as it provides an HTTP endpoint for data ingestion. Note that only the generic REST LAM properties in datadog_lam.conf apply to the Datadog Webhook LAM; see the LAM and Integration Reference for a full description of all properties.
Some properties in the file are commented out by default. Uncomment properties to enable them.
1. Configure the connection properties for the REST connection:
a. address: Address on the Cisco Crosswork Situation Manager server that listens for REST messages. Defaults to all interfaces.
b. port: Port on the Cisco Crosswork Situation Manager server that listens for REST messages. Defaults to 48007.
2. Configure authentication:
a. authentication_type: Type of authentication used by the LAM. Defaults to none.
b. authentication_cache: Whether to cache the username and password for the current connection when the authentication type is Basic.
3. Configure the LAM behavior:
a. accept_all_json: Allows the LAM to read and process all forms of JSON.
b. lists_contain_multiple_events: Whether Cisco Crosswork Situation Manager interprets a JSON list as multiple events.
c. num_threads:Number of worker threads to use.
d. rest_response_mode: When to send a REST response. See the LAM and Integration Reference for the options.
e. rpc_response_timeout: Number of seconds to wait for a REST response.
f. event_ack_mode: When Moogfarmd acknowledges events from the Datadog Webhook LAM during the event processing pipeline.
4. Configure the SSL properties if you want to encrypt communications between the LAM and the REST connection:
a. use_ssl: Whether to use SSL certification.
b. path_to_ssl_files: Path to the directory that contains the SSL certificates.
c. ssl_key_filename: The SSL server key file.
d. ssl_cert_filename: The SSL root CA file.
e. use_client_certificates: Whether to use SSL client certification.
f. client_ca_filename: The SSL client CA file.
g. auth_token or encrypted_auth_token: Authentication token in the request body.
h. header_auth_token or encrypted_header_auth_token: Authentication token in the request header.
i. ssl_protocols:Sets the allowed SSL protocols.
5. Optionally configure the LAM identification and logging details in the agent and log_config sections of the file:
a. name:Identifies events the LAM sends to the Message Bus.
b. capture_log: Name and location of the LAM's capture log file.
c. configuration_file: Name and location of the LAM's process log configuration file.
6. Optionally configure severity conversion. See /document/preview/11721#UUID8b183a1e1278a7a652d3ae86944d7379 for further information and "Conversion Rules" in /document/preview/11720#UUID5c67156b667b1a28ec648cd779393914 for details on conversions in general.Severity ReferenceData Parsing
Example
An example Datadog Webhook LAM configuration is as follows.
monitor:
{
name : "Datadog Lam",
class : "CRestMonitor",
port : 48007,
address : "0.0.0.0",
use_ssl : false,
#path_to_ssl_files : "config",
#ssl_key_filename : "server.key",
#ssl_cert_filename : "server.pem",
#use_client_certificates : false,
#client_ca_filename : "ca.crt",
#auth_token : "my_secret",
#encrypted_auth_token : "dfJtTQMGiFHfiq7sCmxguBt6Jv+eytkoiKCquSB/7iWxpgGsG2aez3z2j7SuBtKj",
#header_auth_token : "my_secret",
#encrypted_header_auth_token : "dfJtTQMGiFHfiq7sCmxguBt6Jv+eytkoiKCquSB/7iWxpgGsG2aez3z2j7SuBtKj",
#ssl_protocols : [ "TLSv1.2" ],
authentication_type : "none",
authentication_cache : true,
accept_all_json : true,
lists_contain_multiple_events : true,
num_threads : 5,
rest_response_mode : "on_receipt",
rpc_response_timeout : 20,
event_ack_mode : "queued_for_processing"
},
agent:
{
name : "DataDog",
capture_log : "$MOOGSOFT_HOME/log/data-capture/datadog_lam.log"
},
log_config:
{
configuration_file : "$MOOGSOFT_HOME/config/logging/datadog_lam_log.json"
{,
Configure for High Availability
Configure the Datadog Webhook LAM for high availability if required. See /document/preview/77155#UUIDbea404d9dd1afee65fa1471105d1b3c6 for details.High Availability Overview
Configure LAMbot Processing
The Datadog Webhook LAMbot processes and filters events before sending them to the Message Bus. You can customize or bypass this processing if required. You can also load JavaScript files into the LAMbot and execute them.
See LAMbot Configuration for more information. An example Datadog Webhook LAM filter configuration is shown below.
filter:
{
presend: "DatadogLam-SolutionPak.js",
modules: [ "CommonUtils.js" ]
}
Start and Stop the LAM
Restart the Datadog Webhook LAM to activate any changes you make to the configuration file or LAMbot.
The LAM service name is datadoglamd.
See /document/preview/11677#UUID1a2205c3aae40b26fdfe94490043f3c3 for the commands to start, stop and restart the LAM.Control Processes
You can use a GET request to check the status of the Datadog Webhook LAM. See "Check the LAM Status" in Configure the REST LAM for further information and examples.
Configure Datadog
After you have the Datadog Webhook LAM running and listening for incoming requests, you can configure Datadog. See "Configure Datadog" in Datadog Webhook.
Dynatrace
You can integrate Cisco Crosswork Situation Manager with the Dynatrace application performance management tool via several mechanisms. The method you choose is dependent upon the details of your Dynatrace and Cisco Crosswork Situation Manager implementations. The options are:
· Dynatrace Notification: If you are using Dynatrace SaaS and Cisco Crosswork Situation Manager SaaS, use the Dynatrace Notification method. It was designed to be used with cloud platforms and is the most effective and efficient integration method for this deployment.
· Dynatrace APM Plugin: If you are using Cisco Crosswork Situation Manager SaaS but your Dynatrace implementation is on-premises, we recommend using the Dynatrace APM Plugin method. It uses a push mechanism which sends triggered incidents to Cisco Crosswork Situation Manager.
· Dynatrace APM Polling: The Dynatrace APM integration method employs a polling technique which is useful when Dynatrace cannot push events to Cisco Crosswork Situation Manager due to firewall or security issues. You may therefore want to use this method if you are using Cisco Crosswork Situation Manager on-premises and Dynatrace SaaS.
· Dynatrace Synthetic: Use the Dynatrace Synthetic integration method to receive events from Dynatrace Synthetic SaaS.
Dynatrace APM Polling
You can install the Dynatrace APM Polling integration to collect event data from one or more Dynatrace APM servers.
See the Dynatrace documentation for details on Dynatrace components.
Before You Begin
Before you start to set up your integration, ensure you have met the following requirements for each Dynatrace APM server:
· You have the URL for your Dynatrace APM server.
· You have the credentials to connect to Dynatrace APM.
· The port for your Dynatrace APM server is open and accessible from the Cisco Crosswork Situation Manager server.
Additionally, you can provide optional configuration details. See the LAM and Integration Reference for a description of all properties.
Configure the Dynatrace APM Integration
To configure the Dynatrace APM integration:
1. Navigate to the Integrations tab.
2. Click Dynatrace APM (Polling) in the Monitoring section.
3. Provide a unique integration name. You can use the default name or customize the name according to your needs.
4. Provide connection details for your Dynatrace APM system.
Configure Dynatrace APM
You do not need to perform any integration-specific steps on your Dynatrace APM systems. After you configure the integration, it polls each Dynatrace server at regular intervals to collect event data (every 60 seconds by default).
If the integration fails to connect to one or more sources, Cisco Crosswork Situation Manager creates an alert and writes the details to the process log. Refer to the logging details for LAMs and integrations for more information.Configure Logging
Configure the Dynatrace APM Polling LAM
Introduction
Dynatrace AppMon provides comprehensive application monitoring and performance lifecycle management. Moogsoft Dynatrace APM Polling LAM connects with Dynatrace AppMon, fetches incidents from it and forwards them to Cisco Crosswork Situation Manager.
See Dynatrace APM Polling for UI configuration instructions.
1. LAM reads the configuration from the dynatrace_apm_lam.conf file.
2. LAM will connect with Dynatrace APM REST API with the given host name.
3. The response is received with event data in the JSON format.
4. Dynatrace APM LAM has an option to filter event data based on the set filters. If filters are set, then the events are fetched based on the defined filters in the config file.
5. The incidents are parsed and converted into normalized Cisco Crosswork Situation Manager events.
6. The normalized events are then published to MooMS bus.
Configuration
The incidents received from Dynatrace AppMon are processed according to the configuration in the dynatrace_apm_lam.conf file. The processed incidents are published to Cisco Crosswork Situation Manager.
The configuration file contains a JSON object. At the first layer of the object, the LAM has a parameter called config, and the object that follows config has all the necessary information to control the LAM.
Monitor
The Dynatrace APM LAM takes the incidents from the Dynatrace AppMon. You can configure parameters here to establish a connection with Dynatrace AppMon:
General
| Field |
Type |
Description |
| name and class |
String |
Reserved fields: do not change. Default values are DynatraceApm Lam Monitor and CDynatraceApmMonitor. |
| targets |
JSON Object |
A top-level container for which you can define one or more target Dynatrace APM sources. You can specify the configuration for each target. If you don't specify a request_interval the target uses the globally defined interval. |
| host_url |
String |
Enter theDynatrace APM Server Base URL or Host Namealong with its port. You can use one of the below mentioned configuration for host_url: If base_url is localhost:8020 and ssl is set to false, then the lam will form the host_url as http://localhost:8020/. If base_url is localhost:8021 and ssl is set to true, then the lam will form the host_url as https://localhost:8021. You can directly enter the host_url as http://localhost:8020. In this case, ssl should be false. You can directly enter the host_url ashttps://localhost:8021. In this case, ssl can be true or false. |
| user_name and Password |
String |
Enter the username and password for accessing Dynatrace AppMon server. |
| encrypted_password |
String |
If the password is encrypted, then enter the encrypted password in this field and comment out the password field. At a time, either password or the encrypted_password field is used. If both the fields are not commented, then the field encrypted_password will be used by the Dynatrace APM LAM. |
| polling_interval |
Integer |
The polling time interval, in seconds, between the requests after which the event data is fetched from Dynatrace. Default = 10 seconds. If 0 is entered, the time interval is set to 10 seconds. |
| max_retries |
Integer |
The maximum number of retry attempts to reconnect with Dynatrace in case of a connection failure. Default = -1, if no value is specified, then there will be infinite retry attempts. If the specified value is greater than 0, then the LAM will try that many times to reconnect; in case of any other value less than 0, max retries will set to default. |
| retry_interval |
Integer |
The time interval between two successive retry attempts. Default = 60 seconds, if 0 is entered, the time interval will set to default. |
| timeout |
Integer |
The value in seconds to wait for a request to complete before timing out. If a timeout occurs, the LAM will wait for the next poll before trying again. Default value is 120 seconds. |
| request_interval |
Integer |
Length of time to wait between requests, in seconds. Can be overridden by request_interval in individual targets. Defaults to 60. |
Filter
| Field |
Type |
Description |
| filter |
Object |
Parameters to filter incidents: profileName: Enter the Dynatrace profile name. incidentRule: Enter the incident rule. Setting both these parameters will fetch the incidents from the single incident rule of the profile. A profile name takes only one incident rule. If only the profileName filter is set, then the incidents will be fetched from all the incident rules of the profile. state: The incidents with the mentioned state will be fetched from the Dynatrace AppMon server. At a time, you can give only one state. The states that can be given here are Created, InProgress and Confirmed. time_from: The incidents will be fetched from the time given here. The time should be given in the yyyy-mm-ddThh:mm:ss.SSSz format. time_till: The incidents will be fetched till the time given here. The time should be given in the yyyy-mm-ddThh:mm:ss.SSSz format. The Dynatrace API is limited to 3 days, and therefore, the Dynatrace LAM will not fetch incidents which are older than 3 days. However, open incidents have no limits. |
Secure Sockets Layer
| Field |
Type |
Description |
| ssl |
Boolean |
Enter true here, to enable SSL Communication: ssl_keystore_file_path: Enter the path of the keystore file. This is the path where the generated keystore file is copied e.g. "/usr/local/dynatrace_ssl/KeyStore.jks". ssl_keystore_password: Enter the password of keystore. It is the same password that was entered when the keystore was generated. |
Example
You can configure the Dynatrace APM LAM to retrieve events from one or more sources. The following example demonstrates a configuration that targets two Dynatrace APM sources. For a single source comment out the target2 section. If you have more than two sources, add a target section for each one and uncomment properties to enable them.
monitor:
{
name : "DynatraceApm Lam Monitor",
class : "CDynatraceApmMonitor",
request_interval : 60,
max_retries : -1,
retry_interval : 60,
targets:
{
target1:
{
url : "http://exampledynatraceapm1:8021",
user_name : "dynatraceapm_user1",
#password : "password",
encrypted_password : "qJAFVXpNDTk6ANq65pEfVGNCu2vFdcoj70AF5BIebEc=",
disable_certificate_validation : false,
path_to_ssl_files : "config",
server_cert_filename : "server1.crt",
client_key_filename : "client1.key",
client_cert_filename : "client1.crt",
ssl_protocols : [ "TLSv1.2" ]
request_interval : 60,
timeout : 120,
max_retries : -1,
retry_interval : 60,
filter :
{
#profilename: "",
#incidentRule: "",
#state: "",
#time_from: "",
#time_till: "",
}
}
target2:
{
url : "http://exampledynatraceapm2:8021",
user_name : "dynatraceapm_user2",
#password : "password",
encrypted_password : "bDGFSClSHBn8DSw43nGwSPLSv2dGwdsj50WD4BHdfVa&",
disable_certificate_validation : false,
path_to_ssl_files : "config",
server_cert_filename : "server2.crt",
client_key_filename : "client2.key",
client_cert_filename : "client2.crt",
ssl_protocols : [ "TLSv1.2" ]
request_interval : 60,
timeout : 120,
max_retries : -1,
retry_interval : 60,
filter :
{
profilename: "Profile1",
incidentRule: "Rule1",
state: "Created",
time_from: "2018-01-31T12:00:00.235-0700",
time_till: "2018-02-30T12:00:00.235-0700",
}
}
}
}
Agent and Process Log
Agent and Process Log allow you to define the following parameters:
· name: Identifies events the LAM sends to the Message Bus.
· capture_log: Name and location of the LAM's capture log file.
· configuration_file: Name and location of the LAM's process log configuration file.
Mapping
For incidents received in JSON format, you can directly map the (Incident) alarm/event fields of Dynatrace AppMon with Cisco Crosswork Situation Manager fields. In the case of an event received in text format, the event is first tokenised in the Variable section, and then the tokenised event is mapped in the mapping section. The parameters of the received alarm/event are displayed in the Cisco Crosswork Situation Manager according to the mapping done here:
mapping :
{
catchAll: "overflow",
rules:
[
{ name: "signature", rule: "$systemprofile :: $rule" },
{ name: "source_id", rule: "Dynatrace APM" },
{ name: "external_id", rule: "$id" },
{ name: "manager", rule: "Dynatrace APM" },
{ name: "source", rule: "$source" },
{ name: "class", rule: "$rule" },
{ name: "agent", rule: "$LamInstanceName" },
{ name: "agent_location", rule: "$LamInstanceName" },
{ name: "type", rule: "$state" },
{ name: "severity", rule: "$severity", conversion:"sevConverter" },
{ name: "description", rule: "$message" },
{ name: "agent_time", rule: "$start", conversion:"timeConverter"}
]
},
filter:
{
presend:"DynatraceApmLam.js"
}
The above example specifies the mapping of the Dynatrace AppMon incident fields with the Cisco Crosswork Situation Manager fields. Data not mapped to Cisco Crosswork Situation Manager Fields goes into "Custom Info".
The stringToInt is used to convert the data received in the string format into an integer format.
Note:
The signature field is used by the LAM to identify correlated incidents.
Constants and Conversions
| Field |
Description |
Example |
| Severity and sevConverter |
has a conversion defined as sevConverter in the Conversions section, this looks up the value of severity defined in the severity section of constants and returns back the mapped integer corresponding to the severity |
severity: sevConverter: |
| stringToInt |
used in a conversion, which forces the system to turn a string token into an integer value |
stringToInt: |
| timeConverter |
used in conversion which forces the system to convert time. If epoch time is to be used, then timeFormat mentioned in timeConverter should be commented. Otherwise, the user should provide the timeFormat |
timeConverter: |
Example
Example Constants and Conversions
constants:
{
severity:
{
"informational" : 1,
"warning" : 2,
"severe" : 5
},
},
conversions:
{
sevConverter:
{
lookup: "severity",
input: "STRING",
output: "INTEGER"
},
stringToInt:
{
input: "STRING",
output: "INTEGER"
},
timeConverter:
{
timeFormat: "yyyy-MM-dd'T'HH:mm:ss.SSS",
input: "STRING",
output: "INTEGER"
}
},
Service Operation Reference
| Process Name |
Service Name |
| dynatrace_apm_lam |
dynatraceapmlamd |
Start the LAM Service:
service dynatraceapmlamd start
Stop the LAM Service:
service dynatraceapmlamd stop
Check the LAM Service status:
service dynatraceapmlamd status
If the LAM fails to connect to one or more Dynatrace APM sources, Cisco Crosswork Situation Manager creates an alert and writes the details to the process log.
Command Line Reference
To see the available optional attributes of the dynatrace_apm_lam, run the following command:
dynatrace_apm_lam --help
The dynatrace_apm_lam is a command line executable, and has the following optional attributes:
| Option |
Description |
| --config |
Points to a pathname to find the configuration file for the LAM. This is where the entire configuration for the LAM is specified. |
| --help |
Displays all the command line options. |
| --version |
Displays the component’s version number. |
| --loglevel |
Specifies the level of debugging. By default, user gets everything. In common with all executables in Cisco Crosswork Situation Manager, having it set at that level can result in a lot of output (many messages per event message processed). In all production implementations, it is recommended that log level is set to WARN. This ensures only warning, error and fatal messages are recorded. |
Dynatrace APM Polling LAM Reference
This is a reference for the Dynatrace APM Polling LAM and UI integration. The Dynatrace APM Polling LAM configuration file is located at $MOOGSOFT_HOME/config/dynatrace_apm_lam.conf.
The following properties are unique to the Dynatrace APM Polling LAM and UI integration.
See the LAM and Integration Reference for a full description of all common properties used to configure LAMs and UI integrations.
See the Dynatrace documentation for details on Dynatrace components.
url
URL of your Dynatrace Server.
| Type |
String |
| Required |
Yes |
| Default |
N/A |
username
Your Dynatrace username.
| Type |
String |
| Required |
Yes |
| Default |
N/A |
password
Your Dynatrace password.
| Type |
String |
| Required |
If you are not using encrypted_password |
| Default |
N/A |
encrypted_password
If you are using an encrypted password to log in to Dynatrace, enter it into this field and comment the password field. The encrypted_password property overrides password.
| Type |
String |
| Required |
If you are not using password |
| Default |
N/A |
filter
Filters events received from Dynatrace.
| Type |
Object |
| Required |
No |
| Default |
N/A |
| Valid Values |
See the profileName, incidentRule, state, time_from and time_till properties below. |
filter :
{
{
profileName : "myServer",
}
{
incidentRule : "Heavy CPU Usage",
}
{
state : "InProgress",
}
{
time_from : "2019-08-16T09:07:21.205Z",
}
{
time_till : "2019-08-16T09:55:21.205+01:00",
}
}
profileName
Filters events by the name of the Dynatrace server.
| Type |
String |
| Required |
No |
| Default |
N/A |
incidentRule
Filters events by an incident rule on the Dynatrace APM server.
| Type |
String |
| Required |
No |
| Default |
N/A |
state
Filters events by their current state.
| Type |
String |
| Required |
No |
| Default |
N/A |
| Valid Values |
Created, InProgress, Confirmed |
time_from
Filters by events the system created at or after the specified time.
| Type |
DateTime |
| Required |
No |
| Default |
N/A |
| Valid Values |
Use the format "yyyy-mm-ddThh:mm:ss.SSSZ", where SSS denotes milliseconds and Z denotes UTC. To change the timezone, replace Z with an offset, eg. +01:00. |
time_till
Filters by events the system created before or at the specified time.
| Type |
DateTime. Use the format "yyyy-mm-ddThh:mm:ss.SSSZ". |
| Required |
No |
| Default |
N/A |
| Valid Values |
Use the format "yyyy-mm-ddThh:mm:ss.SSSZ", where SSS denotes milliseconds and Z denotes UTC. To change the timezone, replace Z with an offset, eg. +01:00. |
Dynatrace APM Plugin
To integrate with Dynatrace you can install and configure a plugin on your Dynatrace server, then set up a rule in Dynatrace to forward incidents to the plugin.
The Dynatrace APM Plugin integration does not require authentication. The integration listens without requiring password information.
When you use the integrations UI, you can only configure the visible properties. If you want to implement a more complex Dynatrace APM Plugin LAM with custom settings, see Configure the Dynatrace APM Plugin LAM.
See the Dynatrace documentation for details on Dynatrace components.
Before You Begin
Before you start to set up your Dynatrace APM Plugin integration, ensure you have met the following requirements:
· You have an active Dynatrace account.
· You have the necessary permissions to install and configure a plugin in Dynatrace.
· You know the path to your Dynatrace installation, for example C:\Program Files\Dynatrace\Dynatrace<version>\server.
· You have the necessary permissions to edit incident rules in Dynatrace.
· Dynatrace can make requests to external endpoints over port 443.
Configure the Dynatrace APM Plugin Integration
To configure the Dynatrace APM Plugin integration:
1. Navigate to the Integrations tab.
2. Click Dynatrace APM Plugin in the Monitoring section.
3. Provide a unique integration name. You can use the default name or customize the name according to your needs.
Configure Dynatrace
1. Download the Moogsoft Alert Plugin to a location where you can open the Dynatrace client.
2. Use the Manage Plugins tool in the Dynatrace client to install the plugin.
3. Open and configure the Moogsoft Alert Plugin properties as follows:
| Property Name |
Value |
| Moog REST URL |
The URL of the Dynatrace APM Plugin LAM along with its default port. For example http://localhost:48004 |
| Enable Proxy |
Optional. Enable if the plugin connects to this host through a proxy. |
| Proxy Host |
The IP address or hostname for the proxy, if a proxy is enabled. |
| Proxy Port |
The port for the proxy, if a proxy is enabled. |
| Enable Proxy Authentication |
Optional. Enable if the plugin provides credentials to the proxy. |
| Proxy User |
The proxy user, if a proxy is enabled. |
| Proxy Password |
The proxy password, if a proxy is enabled. |
| Enable SSL |
Leave SSL disabled when you are initially configuring the integration. You can enable it later, see Dynatrace APM Plugin Configuration. |
The log level defaults to INFO. You can change it if desired.
Change the visibility of the fields if desired and apply your changes.
4. Add the Moogsoft Alert Plugin to a Rule Action for an Incident Rule.
5. Configure the Action as you would any Action for Dynatrace.
Once configured, the plugin sends an event to Cisco Crosswork Situation Manager when a Dynatrace incident triggers the rule.
Configure the Dynatrace APM Plugin LAM
The Dynatrace APN Plugin LAM is an endpoint for HTTP notifications from Dynatrace. The LAM parses the alerts from Dynatrace into Cisco Crosswork Situation Manager events.
You can install a basic Dynatrace APM Plugin integration in the UI. See Dynatrace APM Plugin for integration steps.
The Dynatrace APM Plugin LAM does not require authentication. It listens without requiring password information.
Configure the Dynatrace APM Plugin LAM if you want to configure custom properties, set up high availability or configure advanced options that are not available in the UI integration.
Before You Begin
Before you start to set up your Dynatrace APM Plugin LAM, ensure you have met the following requirements:
· You have an active Dynatrace account.
· You have the necessary permissions to install and configure a plugin in Dynatrace.
· You know the path to your Dynatrace installation, for example C:\Program Files\Dynatrace\Dynatrace<version>\server.
· You have the necessary permissions to edit incident rules in Dynatrace.
· Dynatrace can make requests to external endpoints over port 443.
If you are configuring a distributed deployment refer to /document/preview/77155#UUIDbea404d9dd1afee65fa1471105d1b3c6 first. You will need the details of the server configuration you are going to use for HA.High Availability Overview
Configure the LAM
Edit the configuration file to control the behavior of the Dynatrace APM Plugin LAM. You can find the file at $MOOGSOFT_HOME/config/dynatrace_apm_plugin_lam.conf
The Dynatrace APM Plugin LAM is a REST-based LAM as it provides an HTTP endpoint for data ingestion. Note that only the generic REST LAM properties in dynatrace_apm_plugin_lam.conf apply to the Dynatrace APM Plugin LAM; see the LAM and Integration Reference for a full description of all properties.
Some properties in the file are commented out by default. Uncomment properties to enable them.
1. Configure the properties for the REST connection:
a. address: Address on the Cisco Crosswork Situation Manager server that listens for REST messages. Defaults to all interfaces.
b. port: Port on the Cisco Crosswork Situation Manager server that listens for Dynatrace messages. Defaults to 48004.
2. Configure the SSL properties if you want to encrypt communications between the LAM and the REST connection:
a. use_ssl: Whether to use SSL certification.
b. path_to_ssl_files: Path to the directory that contains the SSL certificates.
c. ssl_key_filename: The SSL server key file.
d. ssl_cert_filename: The SSL root CA file.
e. ssl_protocols: Sets the allowed SSL protocols.
3. Configure the LAM behavior:
a. num_threads: Number of worker threads to use when processing events.
b. rest_response_mode: When to send a REST response. See the LAM and Integration Reference for the options.
c. rpc_response_timeout: Number of seconds to wait for a REST response.
d. event_ack_mode: When Moogfarmd acknowledges events from the REST LAM during the event processing pipeline.
e. accept_all_json: Allows the LAM to read and process all forms of JSON.
f. lists_contain_multiple_events: Whether Cisco Crosswork Situation Manager interprets a JSON list as multiple events.
4. Optionally configure the LAM identification and logging details in the agent and log_config sections of the file:
a. name: Identifies events the LAM sends to the Message Bus.
b. capture_log: Name and location of the LAM's capture log file.
c. configuration_file: Name and location of the LAM's process log configuration file.
5. Optionally configure severity conversions. See /document/preview/11721#UUID8b183a1e1278a7a652d3ae86944d7379 for further information and "Conversion Rules" in /document/preview/11720#UUID5c67156b667b1a28ec648cd779393914 for details on conversions in general.Severity ReferenceData Parsing
Unsupported Properties
Dynatrace APM Plugin alerts do not support client authentication. Do not uncomment or change the following properties:
· use_client_certificates
· client_ca_filename
· auth_token or encrypted_auth_token
· header_auth_token or encrypted_header_auth_token
· authentication_type
· authentication_cache
Example
The following example demonstrates a Dynatrace APM Plugin LAM configuration.
monitor:
{
name : "DynatraceApmPlugin Lam Monitor",
class : "CRestMonitor",
port : 48004,
address : "0.0.0.0",
use_ssl : false,
#path_to_ssl_files : "config",
#ssl_key_filename : "server.key",
#ssl_cert_filename : "server.pem",
#use_client_certificates : false,
#client_ca_filename : "ca.crt",
#auth_token : "my_secret",
#encrypted_auth_token : "dfJtTQMGiFHfiq7sCmxguBt6Jv+eytkoiKCquSB/7iWxpgGsG2aez3z2j7SuBtKj",
#header_auth_token : "my_secret",
#encrypted_header_auth_token : "dfJtTQMGiFHfiq7sCmxguBt6Jv+eytkoiKCquSB/7iWxpgGsG2aez3z2j7SuBtKj",
#ssl_protocols : [ "TLSv1.2" ],
authentication_type : "none",
authentication_cache : false,
accept_all_json : true,
lists_contain_multiple_events : true,
num_threads : 5,
rest_response_mode : "on_receipt",
rpc_response_timeout : 20,
event_ack_mode : "queued_for_processing"
},
agent:
{
name : "Dynatrace APM Plugin",
#capture_log : "$MOOGSOFT_HOME/log/data-capture/dynatrace_apm_plugin_lam.log"
},
log_config:
{
configuration_file : "$MOOGSOFT_HOME/config/logging/dynatrace_apm_plugin_lam_log.json"
},
Configure for High Availability
Configure the Dynatrace APM Plugin LAM for high availability if required. See /document/preview/77155#UUIDbea404d9dd1afee65fa1471105d1b3c6 for details.High Availability Overview
Configure LAMbot Processing
The Dynatrace APM Plugin LAMbot processes and filters events before sending them to the Message Bus. You can customize or bypass this processing if required. You can also load JavaScript files into the LAMbot and execute them.
See LAMbot Configuration for more information. An example Dynatrace APM Plugin LAM filter configuration is shown below.
filter:
{
presend: "DynatraceApmPluginLam.js",
modules: [ "CommonUtils.js" ]
}
Mapping
By default the following Dynatrace properties map to the following Cisco Crosswork Situation Manager Dynatrace APM Plugin LAM properties. You can configure custom mappings in the Dynatrace APM Plugin LAMbot.
| Dynatrace Event Property |
Dynatrace APM Plugin LAM Property |
| Dynatrace APM Plugin LAM |
agent |
| Dynatrace APM Plugin LAM |
agent_location |
| startTime |
agent_time |
| key.systemProfile |
class |
| Message |
description |
| key.uuid |
external_id |
| Dynatrace APM |
manager |
| severity |
severity |
| key.systemProfile::$incidentRule.name |
signature |
| serverName |
source |
| serverName |
source_id |
| incidentRule.name |
type |
Start and Stop the LAM
Restart the Dynatrace APM Plugin LAM to activate any changes you make to the configuration file or LAMbot.
The LAM service name is dynatraceapmpluginlamd.
See /document/preview/11677#UUID1a2205c3aae40b26fdfe94490043f3c3 for the commands to start, stop and restart the LAM.Control Processes
You can use a GET request to check the status of the Dynatrace APM Plugin LAM. See "Check the LAM Status" in Configure the REST LAM for further information and examples.
Configure Dynatrace
After you have the Dynatrace APM Plugin LAM running and listening for incoming requests, you can configure Dynatrace. See "Configure Dynatrace" in Dynatrace APM Plugin.
Dynatrace Notification
To integrate with Dynatrace Notification, configure a Dynatrace webhook to post data to Cisco Crosswork Situation Manager when events occur.
See the Dynatrace documentation for details on Dynatrace components.
Before You Begin
Before you start to set up your Dynatrace Notification integration, ensure you have met the following requirements:
· You have an active Dynatrace account.
· You have the necessary permissions to create a Webhook integration in Dynatrace.
· Dynatrace can make requests to external endpoints over port 443.
Configure the Dynatrace Notification Integration
Configure the Dynatrace Notification integration in Cisco Crosswork Situation Manager as follows:
1. Navigate to the Integrations tab.
2. Click Dynatrace Notification in the Monitoring section.
3. Provide a unique integration name. You can use the default name or customize the name according to your needs.
4. Set a Basic Authentication username and password.
Configure Dynatrace Notification
Log in to Dynatrace to create a webhook integration to send event data:
1. Create a webhook in Dynatrace.
2. Add a name and enter the URL for your Cisco Crosswork Situation Manager instance:
| Field |
Value |
| Name |
Event webhook |
| URL |
<your Dynatrace Notification integration URL> For example: https://example.Cisco.com/events/dynatrace_notification_dynatracenotification1 |
3. Enable 'Custom Payload' and apply this template:
Custom Payload
{
"State":"{State}",
"ProblemID":"{ProblemID}",
"ProblemTitle":"{ProblemTitle}",
"ImpactedEntity":"{ImpactedEntity}",
"PID":"{PID}",
"ProblemDetailsText": "{ProblemDetailsText}",
"ProblemImpact":"{ProblemImpact}",
"ProblemURL":"{ProblemURL}",
"Tags":"{Tags}",
ImpactedEntities":{ImpactedEntities}
}
4. Encode the credentials from the Integrations UI in Base64 using the format "<userid>:<password>". For example "dynatrace_notification:mqgrLAzahG2GJ9My" becomes "ZGF0YXRvZrptcWdyTEF8YWhHMkdKOU68".
5. Add your webhook name as a service to notify for any monitors that should send events.
After you complete the configuration, Dynatrace Notification sends new events to Cisco Crosswork Situation Manager.
Configure the Dynatrace Notification LAM
The Dynatrace Notification LAM receives and processes Dynatrace events forwarded to Cisco Crosswork Situation Manager. The LAM parses the data into Cisco Crosswork Situation Manager events.
You can install a basic Dynatrace Notification integration in the UI. See Dynatrace Notification for integration steps.
Configure the Dynatrace Notification LAM if you want to configure custom properties, set up high availability or configure advanced options that are not available in the UI integration.
Before You Begin
Before you configure the Dynatrace Notification LAM, ensure you have met the following requirements:
· You have an active Dynatrace account.
· You have the necessary permissions to create a Webhook in Dynatrace.
· Dynatrace can make requests to external endpoints over port 443. This is the default.
If you are configuring a distributed deployment refer to /document/preview/77155#UUIDbea404d9dd1afee65fa1471105d1b3c6 first. You will need the details of the server configuration you are going to use for HA.High Availability Overview
Configure the LAM
Edit the configuration file to control the behavior of the Dynatrace Notification LAM. You can find the file at $MOOGSOFT_HOME/config/dynatrace_notification_lam.conf.
The Dynatrace Notification LAM is a REST-based LAM as it provides an HTTP endpoint for data ingestion. Note that only the generic REST LAM properties in dynatrace_notification_lam.conf apply to the Dynatrace Notification LAM; see the LAM and Integration Reference for a full description of all properties.
Some properties in the file are commented out by default. Uncomment properties to enable them.
1. Configure the connection properties for the REST connection:
a. address: Address on the Cisco Crosswork Situation Manager server that listens for REST messages. Defaults to all interfaces.
b. port: Port on the Cisco Crosswork Situation Manager server that listens for REST messages. Defaults to 48016.
2. Configure authentication:
a. authentication_type: Type of authentication used by the LAM. Defaults to Basic.
b. authentication_cache: Whether to cache the username and password for the current connection when the authentication type is Basic.
3. Configure the LAM behavior:
a. accept_all_json: Allows the LAM to read and process all forms of JSON.
b. lists_contain_multiple_events: Whether Cisco Crosswork Situation Manager interprets a JSON list as multiple events.
c. num_threads:Number of worker threads to use.
d. rest_response_mode: When to send a REST response. See the LAM and Integration Reference for the options.
e. rpc_response_timeout: Number of seconds to wait for a REST response.
f. event_ack_mode: When Moogfarmd acknowledges events from the Dynatrace Notification LAM during the event processing pipeline.
4. Configure the SSL properties if you want to encrypt communications between the LAM and the REST connection:
a. use_ssl: Whether to use SSL certification.
b. path_to_ssl_files: Path to the directory that contains the SSL certificates.
c. ssl_key_filename: The SSL server key file.
d. ssl_cert_filename: The SSL root CA file.
e. use_client_certificates: Whether to use SSL client certification.
f. client_ca_filename: The SSL client CA file.
g. auth_token or encrypted_auth_token: Authentication token in the request body.
h. header_auth_token or encrypted_header_auth_token: Authentication token in the request header.
i. ssl_protocols:Sets the allowed SSL protocols.
5. Optionally configure the LAM identification and logging details in the agent and log_config sections of the file:
a. name:Identifies events the LAM sends to the Message Bus.
b. capture_log: Name and location of the LAM's capture log file.
c. configuration_file: Name and location of the LAM's process log configuration file.
6. Optionally configure severity conversion. See /document/preview/11721#UUID8b183a1e1278a7a652d3ae86944d7379 for further information and "Conversion Rules" in /document/preview/11720#UUID5c67156b667b1a28ec648cd779393914 for details on conversions in general.Severity ReferenceData Parsing
Example
An example Dynatrace Notification LAM configuration is as follows.
monitor:
{
name : "Dynatrace Notification Lam Monitor",
class : "CRestMonitor",
port : 48016,
address : "0.0.0.0",
use_ssl : false,
#path_to_ssl_files : "config",
#ssl_key_filename : "server.key",
#ssl_cert_filename : "server.pem",
#use_client_certificates : false,
#client_ca_filename : "ca.crt",
#auth_token : "my_secret",
#encrypted_auth_token : "dfJtTQMGiFHfiq7sCmxguBt6Jv+eytkoiKCquSB/7iWxpgGsG2aez3z2j7SuBtKj",
#header_auth_token : "my_secret",
#encrypted_header_auth_token : "dfJtTQMGiFHfiq7sCmxguBt6Jv+eytkoiKCquSB/7iWxpgGsG2aez3z2j7SuBtKj",
#ssl_protocols : [ "TLSv1.2" ],
authentication_type : "basic",
authentication_cache : true,
accept_all_json : true,
lists_contain_multiple_events : true,
num_threads : 5,
rest_response_mode : "on_receipt",
rpc_response_timeout : 20,
event_ack_mode : "queued_for_processing"
},
agent:
{
name : "Dynatrace",
capture_log : "$MOOGSOFT_HOME/log/data-capture/dynatrace_notification_lam.log"
},
log_config:
{
configuration_file : "$MOOGSOFT_HOME/config/logging/dynatrace_notification_log.json"
{,
Configure for High Availability
Configure the Dynatrace Notification LAM for high availability if required. See /document/preview/77155#UUIDbea404d9dd1afee65fa1471105d1b3c6 for details.High Availability Overview
Configure LAMbot Processing
The Dynatrace Notification LAMbot processes and filters events before sending them to the Message Bus. You can customize or bypass this processing if required. You can also load JavaScript files into the LAMbot and execute them.
See LAMbot Configuration for more information. An example Dynatrace Notification LAM filter configuration is shown below.
filter:
{
presend: "DynatraceNotificationLam.js",
modules: [ "CommonUtils.js", "DynatraceNotificationSeverityUtil.js" ]
}
Start and Stop the LAM
Restart the Dynatrace Notification LAM to activate any changes you make to the configuration file or LAMbot.
The LAM service name is dynatracenotificationlamd.
See /document/preview/11677#UUID1a2205c3aae40b26fdfe94490043f3c3 for the commands to start, stop and restart the LAM.Control Processes
You can use a GET request to check the status of the Dynatrace Notification LAM. See "Check the LAM Status" in Configure the REST LAM for further information and examples.
Configure Dynatrace Notification
After you have the Dynatrace Notification LAM running and listening for incoming requests, you can configure Dynatrace. See "Configure Dynatrace Notification" in Dynatrace Notification.
Dynatrace Synthetic
You can install the Dynatrace Synthetic integration to collect event data from Dynatrace Synthetic.
See the Dynatrace documentation for details on Dynatrace components.
Before You Begin
The Dynatrace Synthetic integration has been validated with Synthetic Monitoring Platform 2017. Before you start to set up your Dynatrace Synthetic integration, ensure you have met the following requirements:
· You have the WSDL (Web Services Definition Language) location of the Dynatrace Synthetic server.
· You have the credentials to connect to the Dynatrace Synthetic server.
· The port for your Dynatrace Synthetic server is open and accessible from the Cisco Crosswork Situation Manager server.
· Your Dynatrace Synthetic server is able to accept HTTP/HTTPS requests.
Configure the Dynatrace Synthetic Integration
To configure the Dynatrace Synthetic integration:
1. Navigate to the Integrations tab.
2. Click Dynatrace Synthetic in the Monitoring section.
3. Provide a unique integration name. You can use the default name or customize the name according to your needs.
4. Provide connection details for your Dynatrace Synthetic system.
Configure Dynatrace Synthetic
You do not need to perform any integration-specific steps on your Dynatrace Synthetic system. After you configure the integration, it polls your Dynatrace Synthetic server at regular intervals to collect messages (every 60 seconds by default).
Configure the Dynatrace Synthetic LAM
Dynatrace Synthetic provides deep application monitoring and performance lifecycle management. The Dynatrace Synthetic LAM connects with Dynatrace Synthetic and fetches alerts from it. The alerts are then forwarded to Cisco Crosswork Situation Manager.
See Dynatrace Synthetic for UI configuration instructions.
1. LAM reads the configuration from dynatrace_synthetic_lam.conf file.
2. LAM connects to the Alert Management Web Services API with the provided WSDL location, username, and password.
3. LAM calls the Web Service Method GetAlertHistory and GetLMAlertHistory with parameters like username, password, start time, and end time.
4. When LAM starts for the first time, it takes the end time as the current time and the start time as 24 hrs before the current time. In case of subsequent calls, it takes start time as the end time of the previous call and the end time is set with the current time.
5. The response is received with incident data in XML format.
6. The alerts are parsed and converted into normalized Cisco Crosswork Situation Manager events.
7. The normalized events are then published to MooMS bus.
Configuration
The alerts received from Dynatrace Synthetic are processed according to the configurations in the dynatrace_synthetic_lam.conf file. The processed alerts are published to Cisco Crosswork Situation Manager.
The configuration file contains a JSON object. At the first layer of the object, the LAM has a parameter called config, and the object that follows config has all the necessary information to control the LAM.
Monitor
The Dynatrace Synthetic LAM takes the alerts from Dynatrace Synthetic Server. You can configure parameters here to establish a connection with Dynatrace Synthetic:
General
| Field |
Type |
Description |
Example |
| name and class |
String |
Reserved fields: do not change. Default values are Dynatrace Synthetic Monitorand CDynatraceSyntheticMonitorrespectively. |
|
| wsdl_location |
String |
Enter the WSDL (Web Services Definition Language) location of the Dynatrace Synthetic server. |
|
| user_name and Password |
String |
Enter the username and password for accessing Dynatrace Synthetic server. |
|
| encrypted_password |
String |
If the password is encrypted, then enter the encrypted password in this field and comment the password field. At a time either password or the encrypted_password field is used. If both the fields are not commented, then Dynatrace Synthetic Lam will use the encrypted_password field. |
|
| polling_interval |
Integer |
The polling time interval, in seconds, between the requests after which the event data is fetched from Dynatrace Synthetic. Default = 60 seconds, if 0 is entered the time interval will set to 60 seconds. |
|
| max_retries |
Integer |
The maximum number of retry attempts. Default = -1, if no value is specified, then there will be infinite retry attempts. If the specified value is less than 1, then it will switch to default i.e. -1. If the specified value is greater than 1, then the LAM will try that many times to reconnect. |
|
| retry_interval |
Integer |
The time interval between two successive retry attempts. Default = 60 seconds, if 0 is entered the time interval will set to 60 seconds. |
|
Example
Config File
config :
{
monitor:
{
name : "Dynatrace Synthetic Monitor",
class : "CDynatraceSyntheticMonitor",
wsdl_location : "https://gpn.webservice.gomez.com/AlertManagementService20/AlertManagementWS.asmx",
user_name : "username",
password : "password",
#encrypted_password : "ieytOFRUdLpZx53nijEw0rOh07VEr8w9lBxdCc7229o=",
polling_interval : 60,
max_retries : -1,
retry_interval : 60,
},
Agent and Process Log
Agent and Process Log allow you to define the following properties:
· name: Identifies events the LAM sends to the Message Bus.
· capture_log: Name and location of the LAM's capture log file.
· configuration_file: Name and location of the LAM's process log configuration file.
Mapping
For alerts received in JSON format, you can directly map the alert fields of Dynatrace Synthetic with Cisco Crosswork Situation Manager fields. In case of an alert received in text format, the alert is first tokenised in the Variable section, and the tokenised alert is then mapped here in the mapping section. The parameters of the received alert are displayed in Cisco Crosswork Situation Manager according to the mapping done here:
mapping :
{
builtInMapper: "CJsonDecoder",
catchAll: "overflow",
rules:
[
{ name: "signature", rule: "$monitorId" },
{ name: "source_id", rule: "$siteIP" },
{ name: "external_id", rule: "$alertId" },
{ name: "manager", rule: "Dynatrace Synthetic" },
{ name: "source", rule: "$siteIP" },
{ name: "class", rule: "$alertType" },
{ name: "agent", rule: "$LamInstanceName" },
{ name: "agent_location", rule: "$siteName" },
{ name: "type", rule: "$alertType" },
{ name: "severity", rule: "$alertState", conversion: "sevConverter" },
{ name: "description", rule: "$description" },
{ name: "agent_time", rule: "$timeStamp"}
]
},
filter:
{
presend: "DynatraceSyntheticLam.js"
}
The above example specifies the mapping of the Dynatrace Synthetic alert fields with the Cisco Crosswork Situation Manager fields. The stringToInt is used to convert the data received in the string format into an integer format.
Note::
The signature field is used by the LAM to identify correlated alerts.
Constants and Conversions
Constants and Conversions allows you to convert format of the received data.
| Field |
Description |
Example |
| Severity and sevConverter |
has a conversion defined as sevConverter in the Conversions section, this looks up the value of severity defined in the severity section of constants and returns back the mapped integer corresponding to the severity. |
severity: "CLEAR" : 0, }, sevConverter: |
| stringToInt |
used in a conversion, which forces the system to turn a string token into an integer value. |
stringToInt: |
Example
Example Constants and Conversions
constants:
{
severity:
{
"CLEAR" : 0,
"GOOD" : 2,
"WARNING" : 3,
"BAD" : 4,
"SEVERE" : 5
}
},
conversions:
{
sevConverter:
{
lookup: "severity",
input: "STRING",
output: "INTEGER"
},
stringToInt:
{
input: "STRING",
output: "INTEGER"
}
},
Custom Info
The fields in Custom Info shows those events which are not listed in the Mapping section. An example of Custom Info is as follows:

Service Operation Reference
| Process Name |
Service Name |
| dynatrace_synthetic_lam |
dynatracesyntheticlamd |
Start the LAM Service:
service dynatracesyntheticlamd start
Stop the LAM Service:
service dynatracesyntheticlamd stop
Check the LAM Service status:
service dynatracesyntheticlamd status
Command Line Reference
To see the available optional attributes of the dynatrace_synthetic_lam, run the following command:
dynatrace_synthetic_lam --help
The dynatrace_synthetic_lam is a command line executable, and has the following optional attributes:
| Option |
Description |
| --config |
Points to a pathname to find the configuration file for the LAM. This is where the entire configuration for the LAM is specified. |
| --help |
Displays all the command line options. |
| --version |
Displays the component’s version number. |
| --loglevel |
Specifies the level of debugging. By default, user gets everything. In common with all executables in Cisco Crosswork Situation Manager, having it set at that level can result in a lot of output (many messages per event message processed). In all production implementations, it is recommended that log level is set to WARN. This ensures only warning, error and fatal messages are recorded. |
The Email integration allows you to retrieve email messages from one or more mail servers and send them to Cisco Crosswork Situation Manager as events.
Refer to the Email LAM Reference to see the integration's default properties. When you use the integrations UI, you can only configure the visible properties.
If you want to implement a more complex Email LAM with custom settings, see Configure the Email LAM.
Before You Begin
Before you set up your Email integration, ensure you have met the following requirements for each mail source:
· You know the details of the mail source:
— Host name or IP address
— Port
— Username and password
— Name of messages folder
· You know the protocol used by your mail server: IMAP, IMAPS, POP3, or POP3S.
· The port for your mail server is open and accessible from Cisco Crosswork Situation Manager.
· You know whether the body of the incoming email messages contain JSON.
· If you are using the Email integration to connect to Gmail, you must configure the Gmail account to allow access for less secure apps. See the Google Help Center for more information.
Additionally, you can provide optional configuration details. See the Email LAM Reference and LAM and Integration Reference for a description of all properties.
Note::
If your mail servers use SSL (POP3 or POP3S protocol) the integration looks for SSL keys and certificates with the default names and locations outlined in the Email LAM Reference. If your details are different, see Configure the Email LAM instead of using the integration.
Configure the Email Integration
To configure the Email integration:
1. Navigate to the Integrations tab.
2. Click Email in the Monitoring section.
3. Provide a unique integration name. You can use the default name or customize the name according to your needs.
4. Provide connection details for your mail system.
You do not need to perform any integration-specific steps on your email systems. After you configure the integration, it polls your mail servers at regular intervals to collect messages (every 60 seconds by default).
If the integration fails to connect to one or more sources, Cisco Crosswork Situation Manager creates an alert and writes the details to the process log. Refer to the logging details for LAMs and integrations for more information.Configure Logging
Configure the Email LAM
The Email LAM allows you to retrieve email messages from mail servers using JavaMail API and send them to Cisco Crosswork Situation Manager as events.
You can install a basic Email integration in the UI. See Email for integration steps.
Configure the Email LAM if you want to configure custom properties, set up high availability or configure advanced options that are not available in the UI integration.
Before You Begin
Before you configure the Email LAM, ensure you have met the following requirements:
· You have command line (SSH) access to the server where the Email LAM is installed.
· You know the details of each mail source you want to target (host name, port, username and password, name of messages folder).
· You know the protocol used by each of your mail servers: IMAP, IMAPS, POP3, or POP3S.
· If your mail servers use SSL (POP3 or POP3S) you know the file names and locations of the SSL keys and certificates.
· The port for each mail server is open and accessible from Cisco Crosswork Situation Manager.
· You know whether the body of the incoming email messages contain JSON.
· If you are using the Email integration to connect to Gmail, you must configure the Gmail account to allow access for less secure apps. See the Google Help Center for more information.
Note::
The Email LAM does not support Outlook 365. Microsoft do not recommend configuring Outlook 365 with IMAP or POP. See Microsoft support information for more details.
If you are configuring a distributed deployment refer to /document/preview/77155#UUIDbea404d9dd1afee65fa1471105d1b3c6 first. You will need the details of the server configuration you are going to use for HA.High Availability Overview
Configure the LAM
Edit the configuration file to control the behavior of the Email LAM.You can find the file at $MOOGSOFT_HOME/config/email_lam.conf.
See the Email LAM Reference and LAM and Integration Reference for a full description of all properties. Some properties in the file are commented out by default. Uncomment properties to enable them.
1. Configure the connection properties for each target email source:
a. protocol: IMAP, POP3, IMAPS, or POP3S.
b. host: IP address or host name of the mail server.
c. port: Port of the mail server.
d. folder_path: Name of the folder containing the email messages, for example INBOX.
e. username: Username of the account used to connect to your mail server.
f. password or encrypted password: Password or encrypted password of the account used to connect to your mail server.
2. Determine how to treat messages for each target:
a. retrieve: Whether to receive all email messages or only unread messages.
b. retrieve_filter: One or more filters to limit the email messages to retrieve.
c. mark_as_read: Marks unread emails as read.
d. delete_on_retrieve: Whether to delete email messages on retrieval.
e. remove_html_tags: Whether to remove HTML tags from email messages.
f. treat_body_as_json: Decodes the email body into a JSON object and makes it available for mapping.
3. Configure the LAM behavior for each target:
a. num_threads: Number of worker threads to use when processing events.
b. event_ack_mode: When Moogfarmd acknowledges events from the Email LAM.
c. request_interval: Length of time to wait between requests, in seconds.
d. max_retries: Number of times the LAM attempts to reconnect after connection failure.
e. retry_interval: Length of time to wait between reconnection attempts, in seconds.
f. recovery_interval: Length of time to wait between requests, in seconds, when the LAM re-establishes a connection after a failure.
g. max_lookback: Period of time for which to recover missed events, in seconds, when the LAM re-establishes a connection after a failure.
h. timeout: Length of time to wait before halting a connection or read attempt, in seconds.
i. javamail_debug: Enables JavaMail debug mode.
4. Configure the SSL properties for each target using IMAPS or POP3S protocol:
a. disable_certification_validation: Whether to disable SSL certificate validation.
b. path_to_ssl_files: Path to the directory that contains the SSL certificates.
c. server_cert_filename: Name of the SSL root CA file.
d. client_key_filename: Name of the SSL client key file.
e. client_cert_filename: Name of the SSL client certificate.
f. ssl_protocols: Sets the allowed SSL protocols.
5. If you want to connect to your Email system through a proxy server, configure the host and port properties in the proxy section for the target.
6. Optionally configure the LAM identification and logging details in the agent and log_config sections of the file:
a. name: Identifies events the LAM sends to the Message Bus. Defaults to Email.
b. capture_log: Name and location of the LAM's capture log file.
c. configuration_file: Name and location of the LAM's process log configuration file.
7. Optionally configure severity conversions. See /document/preview/11721#UUID8b183a1e1278a7a652d3ae86944d7379 for further information and "Conversion Rules" in /document/preview/11720#UUID5c67156b667b1a28ec648cd779393914 for details on conversions in general.Severity ReferenceData Parsing
Example
You can configure the Email LAM to retrieve messages from one or more sources. If you use more than one mail server or multiple email folders on a single server, configure multiple targets according to the example.
The following example demonstrates a configuration that targets two email sources. For a single source comment out the target2 section. If you have more than two sources, add a target section for each one and uncomment properties to enable them.
monitor:
{
name : "Email Monitor",
class : "CEmailMonitor",
request_interval : 60,
max_retries : -1,
retry_interval : 60,
targets:
{
target1:
{
protocol : "IMAPS",
host : "imap.gmx.com",
port : 993,
folder_path : "INBOX",
username : "support@gmx.com",
password : "93pm73xn",
retrieve : "UNREAD",
retrieve_filter:
{
to : [ "support@moogsoft.com", "support1@moogsoft.com" ],
from : [ "abc@xyz.com", "pqr@xyz.com" ],
#recipient : [ ],
subject : [ "Alert", "Event" ],
#body : ""
},
mark_as_read : false,
delete_on_retrieve : false,
remove_html_tags : true,
treat_body_as_json : false;
disable_certificate_validation : true,
#path_to_ssl_files : "config",
#server_cert_filename : "server.crt",
#client_key_filename : "client.key",
#client_cert_filename : "client.crt",
#ssl_protocols : [ "TLSv1.2" ],
num_threads : 5
event_ack_mode : "queued_for_processing",
request_interval : 60,
max_retries : -1,
retry_interval : 60,
timeout : 120,
#javamail_debug : true,
retry_recovery:
{
recovery_interval : 20,
max_lookback : -1
}
},
target2:
{
protocol : "IMAPS",
host : "imap.mail.yahoo.com",
port : 993,
folder_path : "INBOX",
username : "support@yahoo.com",
encrypted_password : "qJAFVXpNDTk6ANq65pEfVGNCu2vFdcoj70AF5BIebEc=",
retrieve : "ALL",
mark_as_read : true,
delete_on_retrieve : false,
remove_html_tags : true,
treat_body_as_json : false;
disable_certificate_validation : false,
path_to_ssl_files : "config",
server_cert_filename : "server.crt",
client_key_filename : "client.key",
client_cert_filename : "client.crt",
ssl_protocols : [ "TLSv1.1, TLSv1.2" ],
num_threads : 5
event_ack_mode : "event_processed",
request_interval : 60,
max_retries : 20,
retry_interval : 120,
timeout : 180,
#javamail_debug : true,
proxy:
{
host : "localhost",
port : 8080
},
retry_recovery:
{
recovery_interval : 20,
max_lookback : -1
}
}
}
},
agent:
{
name : "Email",
capture_log : "$MOOGSOFT_HOME/log/data-capture/email_lam.log"
},
log_config:
{
configuration_file : "$MOOGSOFT_HOME/config/logging/email_lam_log.json"
},
Configure for High Availability
Configure the Email LAM for high availability if required. See /document/preview/77155#UUIDbea404d9dd1afee65fa1471105d1b3c6 for details.High Availability Overview
Configure LAMbot Processing
The Email LAMbot processes and filters events before sending them to the Message Bus. You can customize or bypass this processing if required. You can also load JavaScript files into the LAMbot and execute them.
See LAMbot Configuration for more information. An example Email LAM filter configuration is shown below.
filter:
{
presend: "EmailLam.js"
}
Map LAM Properties
Email header properties are mapped by default to the following Cisco Crosswork Situation Manager Email LAM properties. The overflow properties are mapped to "custom info" and appear under Overflow in Cisco Crosswork Situation Manager alerts. You can configure custom mappings in the Email LAMbot.
| Email Header Property |
Email LAM Event Property |
| Agent Host |
$x_mailer |
| Agent Time |
$sent_date |
| Description |
$message |
| External ID |
$message_id |
| From |
$from |
| Host |
$hostname |
| Manager |
$from |
| Severity |
$severity |
| Signature |
$hostname::$subject |
| Source ID |
$hostname |
| Type |
$subject |
| Email Header Property |
Email LAM Overflow Property |
| Content-Type |
$content_type |
| Message-ID |
$message_id |
| Received |
$received |
| Return-Path |
$return_path |
| X-Client-IP |
$hostname |
| X-Mailer |
$x_mailer |
| X-Originating-IP |
$originating_ip |
| X-Priority |
$priority |
| X-WM-AuthUser |
$AuthUser |
Start and Stop the LAM
Restart the Email LAM to activate any changes you make to the configuration file or LAMbot.
The LAM service name is emaillamd.
See /document/preview/11677#UUID1a2205c3aae40b26fdfe94490043f3c3 for further details.Control Processes
If the LAM fails to connect to one or more email sources, creates an alert and writes the details to the process log. Refer to the logging details for LAMs and integrations for more information.Configure Logging
Email LAM Reference
This is a reference for the Email LAM. and UI integration The Email LAM configuration file is located at $MOOGSOFT_HOME/config/email_lam.conf.
The following properties are unique to the Email LAM and UI integration.
See the LAM and Integration Reference for a full description of all common properties used to configure LAMs and UI integrations.
protocol
Protocol used to access email on a remote web server from a local client. Can be IMAP or POP3 (email protocols) or IMAPS or POP3S (SSL protocols). If you are using an SSL-secured protocol,provide SSL certificate details using the properties below.
Type: String
Required: Yes
One of: IMAP, POP3, IMAPS, POP3S
Default: "IMAP"
host
IP address or host name of the mail server.
Type: String
Required: Yes
Default: "localhost"
port
Port of the mail server.
Type: Integer
Required: Yes
Default: 143 for IMAP, 110 for POP3, 993 for IMAPS, 995 for POP3S
username
Username of the account used to connect to your mail server.
Type: String
Required: Yes
Default: N/A
password
Password of the account used to connect to your mail server.
Type: String
Required: If you are not using encrypted_password
Default: N/A
encrypted_password
If you are using an encrypted password to connect to your mail server, enter it into this field and comment the password field. The encrypted_password property overrides password.
Type: String
Required: If you are not using password
Default: N/A
javamail_debug
Enables JavaMail debug mode. Can be useful when investigating problems with the POP3 or IMAP protocols and the target email server.
Type: Booean
Required: No
Default: Disabled
EMC Smarts
You can install the EMC Smarts integration (now VMware Smarts) to collect event data from a RabbitMQ Server.
See the VMware Smart Assurance documentation for details on Smarts components.
Depending on which EMC Smarts suite you install, you may need to set up RabbitMQ separately. See the EMC Smarts documentation for more information.
Before You Begin
The Smarts integration has been validated with RabbitMQ v3.7.4 and Smarts v9.5. Before you start to set up your integration, ensure you have met the following requirements:
· You have the host address and port of the RabbitMQ server.
· You have credentials to connect to RabbitMQ.
· You know the names of the Topic Exchange and Topic Queue used by RabbitMQ.
· You have the name of your RabbitMQ Virtual Host, if used.
You can add multiple RabbitMQ Brokers and Topics to meet your requirements.
Configure the EMC Smarts Integration
To configure the Smarts integration:
1. Navigate to the Integrations tab.
2. Click EMC Smarts in the Monitoring section.
3. Provide a unique integration name. You can use the default name or customize the name according to your needs.
4. Provide connection details for your Smarts system.
You do not need to perform any integration-specific steps on your Smarts system. After you configure the integration, Smarts sends the events to Cisco Crosswork Situation Manager.
Configure the EMC Smarts LAM
The EMC Smarts LAM receives and processes events forwarded to Cisco Crosswork Situation Manager from a RabbitMQ server. The LAM parses the data into Cisco Crosswork Situation Manager events.
You can install a basic EMC Smarts integration in the UI. See EMC Smarts for integration steps.
Depending on which EMC Smarts suite you install, you may need to set up RabbitMQ separately. See the EMC Smarts documentation for more information.
Configure the EMC Smarts LAM if you want to configure custom properties, set up high availability or configure advanced options that are not available in the UI integration.
Before You Begin
The EMC Smarts LAM has been validated with RabbitMQ v3.7.4 and Smarts v9.5. Before you configure the LAM, ensure you have met the following requirements:
· You have the host address and port of the RabbitMQ server.
· You have credentials to connect to RabbitMQ.
· You know the names of the Topic Exchange and Topic Queue used by RabbitMQ.
· You have the name of your RabbitMQ Virtual Host, if used.
If you are configuring a distributed deployment refer to /document/preview/77155#UUIDbea404d9dd1afee65fa1471105d1b3c6 first. You will need the details of the server configuration you are going to use for HA.High Availability Overview
Configure the LAM
Edit the configuration file to control the behavior of the EMC Smarts LAM. You can find the file at $MOOGSOFT_HOME/config/emc_smarts_lam.conf.
See the LAM and Integration Reference for a full description of all properties. Some properties in the file are commented out by default; remove the '#' character to enable them.
1. Configure the connection properties of the RabbitMQ nodes you want to connect to:
a. host: Address of the RabbitMQ server to connect to.
b. port: Port on the Cisco Crosswork Situation Manager server that listens for REST messages. Defaults to 5672.
c. virtual_host:
d. username: Username of the RabbitMQ account used to connect to the RabbitMQ server.
e. password or encrypted_password: Password or encrypted password of the account used to log in to your RabbitMQ account.
2. Configure the topic queue:
a. topic_queue_name: A list of topics for the topic queue.
b. topic_exchange: The topic exchange for the topic queue.
c. topic_queue_durable: Determines whether the server maintains the queue contents when it isn't in use.
d. topic_queue_exclusive: Determines whether to restrict the topic queue to the LAM's connection.
3. Configure the LAM behavior:
a. accept_all_json: Allows the LAM to read and process all forms of JSON.
b. lists_contain_multiple_events: Whether Cisco Crosswork Situation Manager interprets a JSON list as multiple events.
c. num_threads: Number of worker threads to use for processing events.
d. rest_response_mode: When to send a REST response. See the LAM and Integration Reference for the options.
e. rpc_response_timeout: Number of seconds to wait for a REST response.
f. message_prefetch: Controls how many messages the LAM takes from the RabbitMQ queues and holds in memory as a processing buffer.
g. event_ack_mode: When Moogfarmd acknowledges events from the EMC Smarts LAM during the event processing pipeline.
4. Configure the SSL properties if you want to encrypt communications between the LAM and the REST connection:
a. ssl_protocol: Sets the allowed SSL protocol.
b. server_cert_file: Name of the SSL root CA file.
c. client_cert_file: Name of the SSL client certificate.
d. client_key_file: Name of the SSL client key file.
5. Optionally configure the LAM identification and logging details in the agent and log:
a. name: Identifies events the LAM sends to the Message Bus.
b. capture_log: Name and location of the LAM's capture log file.
c. configuration_file: Name and location of the LAM's process log configuration file.
6. Optionally configure severity conversions. See /document/preview/11721#UUID8b183a1e1278a7a652d3ae86944d7379 for further information and "Conversion Rules" in /document/preview/95030#UUIDc06d3f9c8b3d99f90b7227c2e2d8afae for details on conversions in general.Severity ReferenceData Parsing
Example
An example EMC Smarts configuration is as follows:
monitor:
{
name : "EMC Smarts Monitor",
class : "CRabbitMQMonitor",
brokers:
[
{
host : "<Hostname/IP-Address>",
port : 5672
},
{
host: "<Hostname/IP-Address2>",
port: 5673
}
],
virtual_host : "emc.smarts.notifications",
username : "username",
password : "password",
#encrypted_password : "4DZkk9W294Z+dDKMS1EMO8BCi7vyhGFNzra3T1w/Na4=",
topic_queue_name : "Moogsoft_AIOps_EMCSmarts",
topics : ["#"],
topic_exchange : "emc.smarts.notifications",
topic_queue_durable: true,
topic_queue_autodelete: false,
topic_queue_exclusive: false,
accept_all_json : true,
lists_contain_multiple_events : true,
message_prefetch : 100,
event_ack_mode : "queued_for_processing",
num_threads: 5
}
ssl :
{
{
ssl_protocol : "TLSv1.2",
server_cert_file : "server/cert.pem",
client_cert_file : "client/cert.pem",
client_key_file : "client/key.key"
},
},
agent:
{
name : "EMC Smarts",
capture_log : "$MOOGSOFT_HOME/log/data-capture/emc_smarts_lam.log"
},
log_config:
{
configuration_file : "$MOOGSOFT_HOME/config/logging/emc_smarts_lam_log.json"
},
Configure for High Availability
Configure the EMC Smarts LAM for high availability if required. See /document/preview/77155#UUIDbea404d9dd1afee65fa1471105d1b3c6 for details.High Availability Overview
Configure LAMbot processing
The EMC Smarts LAMbot processes and filters events before sending them to the Message Bus. You can customize or bypass this processing if required. You can also load JavaScript files into the LAMbot and execute them.
See LAMbot Configuration for more information. An example EMC Smarts LAM filter configuration is shown below.
filter:
{
presend: "EMCSmartsLam.js",
modules: [ "CommonUtils.js" ]
}
Start and Stop the LAM
Restart the EMC Smarts LAM to activate any changes you make to the configuration file or LAMbot.
The LAM service name is emcsmartslamd.
See /document/preview/11677#UUID1a2205c3aae40b26fdfe94490043f3c3 for the commands to start, stop and restart the LAM.Control Processes
You can use a GET request to check the status of the EMC Smarts LAM. See "Check the LAM Status" in Configure the REST LAM for further information and examples.
Configure EMC Smarts
After you have the EMC Smarts LAM running and listening for incoming requests, you can configure Smarts. See "Configure Smarts" in EMC Smarts.
EMC Smarts LAM Reference
This is a reference for the EMC Smarts LAM and UI integration. The EMC Smarts LAM configuration file is located at $MOOGSOFT_HOME/config/emc_smarts_lam.conf.
The following properties are unique to the EMC Smarts LAM and UI integration.
See the LAM and Integration Reference for a full description of all common properties used to configure LAMs and UI integrations.
See the VMware Smart Assurance documentation for details on Smarts components.
host
Hostname or IP address of the RabbitMQ server to connect to.
| Type |
String |
| Required |
Yes |
| Default |
N/A |
port
RabbitMQ port to connect to.
| Type |
Integer |
| Required |
Yes |
| Default |
5672 |
virtual_host
Hostname of a RabbitMQ virtual host.
| Type |
String |
| Required |
Yes |
| Default |
emc.smarts.notifications |
username
Username of the account used to connect to your RabbitMQ server.
| Type |
String |
| Required |
Yes |
| Default |
N/A |
password
Password of the account used to connect to your RabbitMQ server.
| Type |
String |
| Required |
If you are not using encrypted_password |
| Default |
N/A |
encrypted_password
If you are using an encrypted password to connect to your RabbitMQ server, enter it into this field and comment the password field. The encrypted_password property overrides password.
| Type |
String |
| Required |
If you are not using password |
| Default |
N/A |
topic_queue_name
A list of topics for the topic queue.
| Type |
String |
| Required |
No |
| Default |
"#" |
| Valid Values |
The default value "#" means "match all". To set a different value, use the format emc.smarts.notification.domain.ClassName.EventName.InstanceName. |
Example
topics : ["emc.smarts.notifications.*.Router.#"],
topic_exchange
The topic exchange for the topic queue.
| Type |
String |
| Required |
Yes |
| Default |
emc.smarts.notifications |
topic_queue_durable
Determines whether the server maintains the queue contents when it isn't in use.
| Type |
Boolean |
| Required |
Yes |
| Default |
true |
topic_queue_exclusive
Determines whether to restrict the topic queue to the LAM's connection.
| Type |
Boolean |
| Required |
Yes |
| Default |
false |
message_prefetch
Controls how many messages the LAM takes from the RabbitMQ queues (both topic and direct) and holds in memory as a processing buffer. Configuring this allows processes to have throttled message consumption which can ease backlog and memory consumption issues. The higher the value, the more messages held in memory.
To achieve high availability and ensure messages are processed, we advise the value of this property being higher than the default value of 0, which tells the process to take as many messages as it can.
| Type |
Integer |
| Required |
Yes |
| Default |
0 |
ExtraHop
You can configure the ExtraHop integration to post data to Cisco Crosswork Situation Manager when an alert occurs in ExtraHop.
Refer to the LAM and Integration Reference to see the integration's default properties. When you use the integrations UI, you can only configure the visible properties.
If you want to implement a more complex ExtraHop LAM with custom settings, see Configure the ExtraHop LAM.
See the ExtraHop documentation for details on ExtraHop components.
Before You Begin
The ExtraHop integration has been validated with ExtraHop v7.4. Before you start to set up your ExtraHop integration, ensure you have met the following requirements:
· You have an active ExtraHop account.
· You have the necessary permissions to access system configuration and add data stream targets in ExtraHop.
· ExtraHop can make requests to external endpoints over port 443.
Configure the ExtraHop Integration
To configure the ExtraHop integration:
1. Navigate to the Integrations tab.
2. Click ExtraHop in the Monitoring section.
3. Provide a unique integration name. You can use the default name or customize the name according to your needs.
4. Set a Basic Authentication username and password.
Configure ExtraHop
Log in to ExtraHop to configure a data stream target and trigger to send alert data to your system. For more help, see the ExtraHop documentation.
1. Create a new data stream target connection in ExtraHop with the following details:
| Field |
Value |
| Name |
Cisco Crosswork Situation Manager |
| Host |
<your ExtraHop integration URL> Copy the URL and paste into ExtraHop without https://, for example: https://examplehost.com becomes examplehost.com. |
| Port |
443 |
| Type |
HTTPS |
| Authentication |
Basic |
| Username |
<Username that Cisco Crosswork Situation Manager generates in the UI> |
| Password |
<Password that Cisco Crosswork Situation Manager generates in the UI> |
2. Test the target configuration with the following details:
| Field |
Value |
| Method |
GET |
| Options |
{ |
3. Ensure the new configuration has been saved and is running.
4. Create an ExtraHop trigger with the following details:
| Field |
Value |
| Name |
Cisco Crosswork Situation Manager |
| Events |
ALERT_RECORD_COMMIT |
5. Add the following trigger script. The value of REST_DEST must match the name of your data stream target.
// The name of the HTTP destination defined in the ODS config
var REST_DEST = "Moogsoft AIOps";
var headers = { "Content-Type": "application/json" };
var msg = {
"time": AlertRecord.time/1000,
"description": AlertRecord.description,
"id": AlertRecord.id,
"name": AlertRecord.name,
"severityLevel": AlertRecord.severityLevel,
"object": AlertRecord.object
};
//debug(JSON.stringify(msg));
Remote.HTTP(REST_DEST).post( {path: "/", headers: headers, payload:
JSON.stringify(msg) } );
Once you complete the configuration, ExtraHop sends new alerts to Cisco Crosswork Situation Manager.
Configure the ExtraHop LAM
The ExtraHop LAM receives and processes ExtraHop alerts forwarded to Cisco Crosswork Situation Manager. The LAM parses the data into Cisco Crosswork Situation Manager events.
You can install a basic ExtraHop integration in the UI. See ExtraHop for integration steps.
Configure the ExtraHop LAM if you want to configure custom properties, set up high availability or configure advanced options that are not available in the UI integration.
Before You Begin
Before you configure the ExtraHop LAM, ensure you have met the following requirements:
· You have an active ExtraHop account.
· You have the necessary permissions to access system configuration and add data stream targets in ExtraHop.
· ExtraHop can make requests to external endpoints over port 443. This is the default.
If you are configuring a distributed deployment refer to /document/preview/77155#UUIDbea404d9dd1afee65fa1471105d1b3c6 first. You will need the details of the server configuration you are going to use for HA.High Availability Overview
Configure the LAM
Edit the configuration file to control the behavior of the ExtraHop LAM. You can find the file at $MOOGSOFT_HOME/config/extrahop_lam.conf
The ExtraHop LAM is a REST-based LAM as it provides an HTTP endpoint for data ingestion. Note that only the generic REST LAM properties in extrahop_lam.conf apply to integrating with Extrahop; see the LAM and Integration Reference for a full description of all properties.
Some properties in the file are commented out by default. Uncomment properties to enable them.
1. Configure the connection properties for the REST connection:
a. address: Address on the Cisco Crosswork Situation Manager server that listens for REST messages. Defaults to all interfaces.
b. port: Port on the Cisco Crosswork Situation Manager server that listens for REST messages. Defaults to 48021.
2. Configure authentication:
a. authentication_type: Type of authentication used by the LAM. Defaults to none.
b. authentication_cache: Whether to cache the username and password for the current connection when the authentication type is Basic.
3. Configure the LAM behavior:
a. accept_all_json: Allows the LAM to read and process all forms of JSON.
b. lists_contain_multiple_events: Whether Cisco Crosswork Situation Manager interprets a JSON list as multiple events.
c. num_threads:Number of worker threads to use when processing events.
d. rest_response_mode: When to send a REST response. See the LAM and Integration Reference for the options.
e. rpc_response_timeout: Number of seconds to wait for a REST response.
f. event_ack_mode: When Moogfarmd acknowledges events from the ExtraHop LAM during the event processing pipeline.
4. Configure the SSL properties if you want to encrypt communications between the LAM and the REST connection:
a. use_ssl: Whether to use SSL certification.
b. path_to_ssl_files: Path to the directory that contains the SSL certificates.
c. ssl_key_filename: The SSL server key file.
d. ssl_cert_filename: The SSL root CA file.
e. use_client_certificates: Whether to use SSL client certification.
f. client_ca_filename: The SSL client CA file.
g. auth_token or encrypted_auth_token: Authentication token in the request body.
h. header_auth_token or encrypted_header_auth_token: Authentication token in the request header.
i. ssl_protocols:Sets the allowed SSL protocols.
5. Optionally configure the LAM identification and logging details in the agent and log_config sections of the file:
a. name: Identifies events the LAM sends to the Message Bus.
b. capture_log: Name and location of the LAM's capture log file.
c. configuration_file: Name and location of the LAM's process log configuration file.
6. Optionally configure severity conversion. See /document/preview/11721#UUID8b183a1e1278a7a652d3ae86944d7379 for further information and "Conversion Rules" in /document/preview/11720#UUID5c67156b667b1a28ec648cd779393914 for details on conversions in general.Severity ReferenceData Parsing
Example
An example ExtraHop LAM configuration is as follows.
monitor:
{
name : "ExtraHop LAM",
class : "CRestMonitor",
port : 48021,
address : "0.0.0.0",
use_ssl : false,
#path_to_ssl_files : "config",
#ssl_key_filename : "server.key",
#ssl_cert_filename : "server.pem",
#use_client_certificates : false,
#client_ca_filename : "ca.crt",
#auth_token : "my_secret",
#encrypted_auth_token : "dfJtTQMGiFHfiq7sCmxguBt6Jv+eytkoiKCquSB/7iWxpgGsG2aez3z2j7SuBtKj",
#header_auth_token : "my_secret",
#encrypted_header_auth_token : "dfJtTQMGiFHfiq7sCmxguBt6Jv+eytkoiKCquSB/7iWxpgGsG2aez3z2j7SuBtKj",
#ssl_protocols : [ "TLSv1.2" ],
authentication_type : "basic",
authentication_cache : true,
accept_all_json : true,
lists_contain_multiple_events : true,
num_threads : 5,
rest_response_mode : "on_receipt",
rpc_response_timeout : 20,
event_ack_mode : "queued_for_processing"
},
agent:
{
name : "ExtraHop",
capture_log : "$MOOGSOFT_HOME/log/data-capture/extrahop_lam.log"
},
log_config:
{
configuration_file : "$MOOGSOFT_HOME/config/logging/extrahop_lam_log.json"
{,
Configure for High Availability
Configure the ExtraHop LAM for high availability if required. See /document/preview/77155#UUIDbea404d9dd1afee65fa1471105d1b3c6 for details.High Availability Overview
Configure LAMbot Processing
The ExtraHop LAMbot processes and filters events before sending them to the Message Bus. You can customize or bypass this processing if required. You can also load JavaScript files into the LAMbot and execute them.
See LAMbot Configuration for more information. An example ExtraHop LAM filter configuration is shown below.
filter:
{
presend: "ExtraHopLam.js",
modules: [ "CommonUtils.js" ]
}
Start and Stop the LAM
Restart the ExtraHop LAM to activate any changes you make to the configuration file or LAMbot.
The LAM service name is extrahoplamd.
See /document/preview/11677#UUID1a2205c3aae40b26fdfe94490043f3c3 for the commands to start, stop and restart the LAM.Control Processes
You can use a GET request to check the status of the ExtraHop LAM. See "Check the LAM Status" in Configure the REST LAM for further information and examples.
Configure ExtraHop
After you have the ExtraHop LAM running and listening for incoming requests, you can configure ExtraHop. See "Configure ExtraHop" in ExtraHop.
Fluentd
You can configure the Fluentd integration to post data to Cisco when an alert occurs in Fluentd. The integration uses the Cisco Crosswork Situation Manager plugin for Fluentd.
Refer to the LAM and Integration Reference to see the integration's default properties. When you use the integrations UI, you can only configure the visible properties.
If you want to implement a more complex Fluentd LAM with custom settings, see Configure the Fluentd LAM.
See the Fluentd documentation for details on Fluentd components.
Before You Begin
The Fluentd integration has been validated with Fluentd v0.12. Before you start to set up your integration, ensure you have met the following requirements:
· You have installed Fluentd.
· You have the permissions to edit the Fluentd configuration file.
· You have installed Ruby Gems for Fluentd.
· Fluentd can make requests to external endpoints over port 443. This is the default.
Configure the Fluentd Integration
To configure the Fluentd integration:
1. Navigate to the Integrations tab.
2. Click Fluentd in the Monitoring section.
3. Provide a unique integration name. You can use the default name or customize the name according to your requirements.
4. Set a Basic Authentication username and password.
Configure Fluentd
Install the Cisco Crosswork Situation Manager plugin for Fluentd and add the configuration to your Fluentd configuration file. See fluent-plugin-moogaiops.
1. To install the Cisco Crosswork Situation Manager plugin for Fluentd, edit your application Gemfile to include the plugin:
gem 'fluent-plugin-moogaiops'
Alternatively, install the plugin yourself from the command line:
$ gem install fluent-plugin-moogaiops
2. Edit fluentd.conf and include the following configuration for the plugin:
<match system.** *.access.* error.**>
@type moogaiops
uri https://<YOUR MOOGAIOPS>.moogsoft.com/events/generic_generic1
auth <YOUR USER>:<YOUR PASSWORD>
sourcetype fluentd
location london
severity 3
</match>
| Field |
Value |
| Request URL |
<your Fluentd integration URL> For example: https://example.Cisco.com/events/fluentd_fluentd1 |
| User |
Username generated in the Cisco Crosswork Situation Manager UI |
| Password |
Password generated in the Cisco Crosswork Situation Manager UI |
3. Restart Fluentd.
The plugin forwards events that conform to the matcher in the Fluentd integration. The default Fluentd Cookbook shows all failed jobs that impact the same or overlapping hosts.
Configure the Fluentd LAM
The Fluentd LAM receives and processes Fluentd alerts forwarded to Cisco Crosswork Situation Manager. The LAM parses the data into Cisco Crosswork Situation Manager events.
You can install a basic Fluentd integration in the UI. See Fluentd for integration steps.
Configure the Fluentd LAM if you want to configure custom properties, set up high availability or configure advanced options that are not available in the UI integration.
Before You Begin
The Fluentd LAM has been validated with Fluentd v0.12. Before you start to set up the LAM, ensure you have met the following requirements:
· You have installed Fluentd.
· You have the permissions to edit the Fluentd configuration file.
· You have installed Ruby Gems for Fluentd.
· Fluentd can make requests to external endpoints over port 443. This is the default.
If you are configuring a distributed deployment refer to /document/preview/77155#UUIDbea404d9dd1afee65fa1471105d1b3c6 first. You will need the details of the server configuration you are going to use for HA.High Availability Overview
Configure the LAM
Edit the configuration file to control the behavior of the Fluentd LAM. You can find the file at $MOOGSOFT_HOME/config/fluentd_lam.conf.
The Fluentd LAM is a REST-based LAM as it provides an HTTP endpoint for data ingestion. Note that only the generic REST LAM properties in fluentd_lam.conf apply to integrating with Fluentd; see the LAM and Integration Reference for a full description of all properties.
Some properties in the file are commented out by default. Uncomment properties to enable them.
1. Configure the connection properties for the REST connection:
a. address: Address on the Cisco Crosswork Situation Manager server that listens for REST messages. Defaults to all interfaces.
b. port: Port on the Cisco Crosswork Situation Manager server that listens for REST messages. Defaults to 48008.
2. Configure authentication:
a. authentication_type: Type of authentication used by the LAM. Defaults to none.
b. authentication_cache: Whether to cache the username and password for the current connection when the authentication type is Basic.
3. Configure the LAM behavior:
a. accept_all_json: Allows the LAM to read and process all forms of JSON.
b. lists_contain_multiple_events: Whether Cisco Crosswork Situation Manager interprets a JSON list as multiple events.
c. num_threads: Number of worker threads to use when processing events.
d. rest_response_mode: When to send a REST response. See the LAM and Integration Reference for the options.
e. rpc_response_timeout: Number of seconds to wait for a REST response.
f. event_ack_mode: When Moogfarmd acknowledges events from the Fluentd LAM during the event processing pipeline.
4. Configure the SSL properties if you want to encrypt communications between the LAM and the REST connection:
a. use_ssl: Whether to use SSL certification.
b. path_to_ssl_files: Path to the directory that contains the SSL certificates.
c. ssl_key_filename: The SSL server key file.
d. ssl_cert_filename: The SSL root CA file.
e. use_client_certificates: Whether to use SSL client certification.
f. client_ca_filename: The SSL client CA file.
g. auth_token or encrypted_auth_token: Authentication token in the request body.
h. header_auth_token or encrypted_header_auth_token: Authentication token in the request header.
i. ssl_protocols: Sets the allowed SSL protocols.
5. Optionally configure the LAM identification and logging details in the agent and log_config sections of the file:
a. name: Identifies events the LAM sends to the Message Bus.
b. capture_log: Name and location of the LAM's capture log file.
c. configuration_file: Name and location of the LAM's process log configuration file.
6. Optionally configure severity conversion. See /document/preview/11721#UUID8b183a1e1278a7a652d3ae86944d7379 for further information and "Conversion Rules" in /document/preview/11720#UUID5c67156b667b1a28ec648cd779393914 for details on conversions in general.Severity ReferenceData Parsing
Example
An example Fluentd LAM configuration is as follows.
monitor:
{
name : "Fluentd Lam",
class : "CRestMonitor",
port : 48008,
address : "0.0.0.0",
use_ssl : false,
#path_to_ssl_files : "config",
#ssl_key_filename : "server.key",
#ssl_cert_filename : "server.pem",
#use_client_certificates : false,
#client_ca_filename : "ca.crt",
#auth_token : "my_secret",
#encrypted_auth_token : "dfJtTQMGiFHfiq7sCmxguBt6Jv+eytkoiKCquSB/7iWxpgGsG2aez3z2j7SuBtKj",
#header_auth_token : "my_secret",
#encrypted_header_auth_token : "dfJtTQMGiFHfiq7sCmxguBt6Jv+eytkoiKCquSB/7iWxpgGsG2aez3z2j7SuBtKj",
#ssl_protocols : [ "TLSv1.2" ],
authentication_type : "none",
authentication_cache : true,
accept_all_json : false,
lists_contain_multiple_events : true,
num_threads : 5,
rest_response_mode : "on_receipt",
rpc_response_timeout : 20,
event_ack_mode : "queued_for_processing"
},
agent:
{
name : "Fluentd",
capture_log : "$MOOGSOFT_HOME/log/data-capture/fluentd_lam.log"
},
log_config:
{
configuration_file : "$MOOGSOFT_HOME/config/logging/fluentd_lam_log.json"
{,
Configure for High Availability
Configure the Fluentd LAM for high availability if required. See /document/preview/77155#UUIDbea404d9dd1afee65fa1471105d1b3c6 for details.High Availability Overview
Configure LAMbot Processing
The Fluentd LAMbot processes and filters events before sending them to the Message Bus. You can customize or bypass this processing if required. You can also load JavaScript files into the LAMbot and execute them.
See LAMbot Configuration for more information. An example Fluentd LAM filter configuration is shown below.
filter:
{
presend: "FluentdLam-SolutionPak.js",
modules: [ "CommonUtils.js" ]
}
Start and Stop the LAM
Restart the Fluentd LAM to activate any changes you make to the configuration file or LAMbot.
The LAM service name is fluentdlamd.
See /document/preview/11677#UUID1a2205c3aae40b26fdfe94490043f3c3 for the commands to start, stop and restart the LAM.Control Processes
You can use a GET request to check the status of the Fluentd LAM. See "Check the LAM Status" in Configure the REST LAM for further information and examples.
Configure Fluentd
After you have the Fluentd LAM running and listening for incoming requests, you can configure Fluentd. See "Configure Fluentd" in Fluentd.
Grafana
The Cisco Crosswork Situation Manager app for reporting and dashboards is available in the Grafana app store. It is called the "Moogsoft AIOps App". It comes with a default dashboard and enables you to create custom reports.
See the Grafana documentation for details on Grafana components.
Before You Begin
The Grafana integration has been validated with Grafana v4.6.3. Before you start to set up your Grafana integration, ensure you have met the following requirements:
· You have installed Grafana or you have a hosted instance of Grafana. See the Configure Grafana Example for instructions.
· If you have installed Grafana, enable HTTPS.
· You have set up the "Moogsoft AIOps App" within Grafana. Get the app here.
· You have the URL for your Grafana instance.
· You have credentials to connect to Grafana.
Configure the Grafana Integration
To configure the Grafana integration:
1. Navigate to the Integrations tab.
2. Click Grafana in the Reporting & Dashboards section.
3. Provide a unique integration name. You can use the default name or customize the name according to your requirements.
Configure Grafana
To enable Grafana to access your system data, set up the "Moogsoft AIOps App" for Grafana as follows:
| Field |
Value |
| URL |
Your Cisco Crosswork Situation Manager URL |
| User |
<Graze username> |
| Password |
<Graze password> |
After you have configured the app you can see the default dashboard in Grafana.
Configure Grafana Example
This document outlines how to install and configure an on-premise instance of Grafana alongside Cisco Crosswork Situation Manager.
These instructions relate to Grafana v5.0.4. You may need to make changes if you are installing another version of Grafana.
Before You Begin
Before you begin to install and configure Grafana, ensure you have met the following requirements:
· You have installed and set up Cisco Crosswork Situation Manager on RHEL/Centos 7.
· You have the SSL certificate used by Cisco Crosswork Situation Manager.
· You have the URL for Grafana. In this example configuration we can use the IP address of the Cisco Crosswork Situation Manager machine. For example, 192.0.2.0.
Install Grafana
To begin the integration setup, install Grafana and enable SSL. For more information see the Grafana installation documentation.
1. Connect to your Cisco Crosswork Situation Manager instance and download the Grafana installation file:
wget https://s3-us-west-2.amazonaws.com/grafana-releases/release/grafana-5.2.4-1.x86_64.rpm
2. Install Grafana:
sudo yum -y localinstall grafana-5.2.4-1.x86_64.rpm
3. To enable SSL, edit the Grafana configuration file at /etc/grafana/grafana.ini. Remove the semicolons (;) used to comment properties in .ini files:
| Field |
Value |
| protocol |
HTTPS |
| root_url |
<Your full Grafana URL> https://<ip>:3000 |
| cert_file |
/etc/nginx/ssl/certificate.pem |
| cert_key |
/etc/nginx/ssl/certificate.key |
For example:
[server]
protocol = https
root_url = https://example.grafana.com:3000
cert_file = /etc/nginx/ssl/mycertificate.pem
cert_key = /etc/nginx/ssl/mycertificate.key
The default port is 3000. If you want to configure a different port or change any of the other properties see the Grafana configuration documentation.
4. Restart Grafana:
service grafana-server restart
If you want to configure a custom base URL for your Grafana instance see Configure Grafana Base URL.
Install the App
You must install the "Moogsoft AIOps App" to connect Grafana to Cisco Crosswork Situation Manager. For more information about the app see Moogsoft AIOps Plugin.
1. To install the app for a local instance of Grafana, use this CLI command:
grafana-cli plugins install moogsoft-aiops-app
2. Restart the Grafana server:
service grafana-server restart
Configure the App
After you have installed the app, configure it to pass data from Cisco Crosswork Situation Manager to Grafana.
1. Log in to your Grafana instance at https://<ip>:3000. The default login credentials are admin:admin.
2. Navigate to Plugins and find the app.
3. Edit the settings as follows:
| Field |
Value |
| URL |
<your Cisco Crosswork Situation Manager url> |
| Username |
<Graze username> |
| Password |
<Graze password> |
4. The default Graze credentials are graze:graze.
5. Enable the app. A 'Test Success' message appears if successful.
After enabling the app, Cisco Crosswork Situation Manager is automatically set up as a data source. If you want to change the data source later, you can edit Data Sources.
Configure Grafana Base URL
You can configure Grafana to use a base URL path instead of an open port.
By default, Grafana uses a given an IP address to bind to and port 3000 for HTTP. If you use proxies or firewalls that block port 3000, you can configure Cisco Crosswork Situation Manager to use a custom base URL for Grafana using an Nginx reverse proxy. See the Nginx documentation for more information on Nginx reverse proxies.
Configure Nginx
Before you can add a custom base URL for Grafana, ensure you have set up an Nginx reverse proxy:
1. Open the Nginx SSL configuration file: $MOOGSOFT_HOME/common/config/nginx/moog-ssl.conf
2. If you have Grafana installed on the same machine as Cisco Crosswork Situation Manager, check the section relating to Grafana. The default sub-path is /grafana/. You can change this to meet your requirements:
location /grafana/ {
proxy_pass http://localhost:3000/;
}
If you are using GrafanaCloud, go to the same section and change localhost to your Grafana domain name:
location /grafana/ {
proxy_pass http://<your_domain_name>:3000/;
}
3. Save your changes and restart Nginx.
After completing these steps, you can configure a new base URL for Grafana.
Add the Base URL in Grafana
To add the new base URL in Grafana:
1. Edit the Grafana configuration file: /etc/grafana/grafana.ini.
2. Modify the domain and root_url properties as follows:
3. Delete the semi-colons to uncomment.
4. Update the values to reflect your new domain and base URL:
domain = <your_domain_name>
root_url = %(protocol)s://%(domain)s:/grafana
If you are using GrafanaCloud, you only need to change the domain to your Grafana domain name.
5. Save the changes and restart the Grafana server.
After you have completed these steps, you can access Grafana at the new base URL.
HP
You can integrate Cisco Crosswork Situation Manager with the HP monitoring tools. The method you choose is dependent upon your HP Environment. Choose from the following:
· HP NNMi: Install the HP Network Node Manager (NNMi) integration to collect event data from HP NNMi.
· HP OMi Polling: Install the HP Operations Manager i (OMi) integration to collect event data from HP OMi.
· HP OMi Plugin: Install the HP OMi Plugin to set up an event forwarding script in HP OMi that sends event data to Cisco Crosswork Situation Manager.
HP NNMi
You can install the HP Network Node Manager (NNMi) integration to collect event data from one or more HP NNMi systems. The integration polls your HP NNMi system for new data every 60 seconds. It uses HTTP/HTTPS with basic user credentials to authenticate with HP NNMi.
See the HP NNMi documentation for details on HP NNMi components.
Before You Begin
The HP NNMi integration has been validated with HP NNMi v10.2. Before you start to set up your integration, ensure you have met the following requirements for each HP NNMi system:
· You have the URL of the HP NNMi webservice.
· You have credentials to connect to HP NNMi.
· The port for your HP NNMi server is open and accessible from Cisco Crosswork Situation Manager.
· Your HP NNMi system is able to accept HTTP/HTTPS requests.
Additionally, you can provide optional configuration details. You can:
· Select the origin of the incidents.
· Configure the maximum number of incidents that Cisco Crosswork Situation Manager can fetch in each poll.
· Set a request interval and retry interval time in seconds. Both default to 60.
Configure the HP NNMi Integration
To configure the HP NNMi integration:
1. Navigate to the Integrations tab.
2. Click HP NNMi in the Monitoring section.
3. Provide a unique integration name. You can use the default name or customize the name according to your needs.
4. Provide connection details for your HP NNMi system.
Configure HP NNMi
You do not need to perform any integration-specific steps on your HP NNMi systems. After you configure the integration, it polls your HP NNMi servers at regular intervals to collect event data (every 60 seconds by default).
If the integration fails to connect to one or more sources, Cisco Crosswork Situation Manager creates an alert and writes the details to the process log. Refer to the logging details for LAMs and integrations for more information.Configure Logging
Configure the HP NNMi LAM
HP Network Node Manager i (HP NNMi) discovers the devices that are in the network and shows their relative location and status. It helps in ascertaining the level of congestion in the network and identifying the root cause of the congestion. It can monitor networks, isolate issues, find outages, and improve network availability and performance.
See HP NNMi for UI configuration instructions.
When a device fails, it generates events associated with the failures. HP NNMi creates incidents for each event which are fetched by the HP NNMi LAM and displayed in Cisco Crosswork Situation Manager.
1. LAM reads the configuration from the hp_nnmi_lam.conf file.
2. LAM connects with HP NNMi Webservice using the given webservice endpoint in the config file.
3. LAM sends request to HP NNMi Server to fetch incidents.
4. The response is received with incident data in an object form.
5. LAM filters incident data based on the filters set in the config file.
6. The events are parsed and converted into normalized Cisco Crosswork Situation Manager events.
7. The normalized events are then published to MooMS bus.
HP NNMi LAM Configuration
The incidents received from HP NNMi are processed according to the configurations in the hp_nnmi_lam.conf file. The processed incidents are published to the Cisco Crosswork Situation Manager.
The configuration file contains a JSON object. At the first layer of the object, the LAM has a parameter called config, and the object that follows config has all the necessary information to control the LAM.
The following sections are available for configuration in the hp_nnmi_lam.conf file.
The HP NNMi LAM takes the incidents from the HP NNMi Server. You can configure the parameters here to establish a connection with HP NNMi:
General
| Field |
Type |
Description |
| name and class |
String |
Reserved fields: do not change. Default values are HpNnmi Lam Monitor and CHpNnmiMonitor. |
| target |
JSON Object |
A top-level container for which you can define one or more target HP NNMi sources. You can specify the configuration for each target. If you don't specify a request_interval the target uses the globally defined interval. |
| webservice_endpoint |
String |
Enter the endpoint location of HP NNMi webservice where hpnnmi is hostname or IP address. For example: http://examplehpnnmi/IncidentBeanService/IncidentBean |
| user_name and Password |
String |
Enter the username and password of the HP NNMi console. |
| encrypted_password |
String |
If you are using an encrypted password, then enter the encrypted password in this field and comment the password field. Either password or the encrypted_password field is used. If both the fields are specified, then only the encrypted_password value will be used by the HP NNMi LAM. |
| polling_interval |
Integer |
The polling time interval, in seconds, between the requests after which the event data is fetched from HP NNMi. Default = 10 seconds. If 0 is entered, the time interval will set to 10 seconds. |
| max_retries |
Integer |
The maximum number of retry attempts to reconnect with HP NNMi in case of a connection failure. Default = -1, if no value is specified, then there will be infinite retry attempts. If the specified value is greater than 0, then the LAM will try that many times to reconnect; in case of any other value less than 0, max retries will set to default. |
| retry_interval |
Integer |
The time interval between two successive retry attempts. Default = 60 seconds, if 0 is entered, the time interval is set to 60 seconds. |
| request_interval |
Integer |
Length of time to wait between requests, in seconds. Can be overridden by request_interval in individual targets. Defaults to 60. |
Secure Sockets Layer
| Field |
Type |
Description |
| ssl |
Boolean |
Set to true, to enable SSL Communication: ssl_keystore_file_path: Enter the path of the keystore file. This is the path where the generated keystore file is copied in Cisco Crosswork Situation Manager, e.g. "/usr/local/hpnnmi_ssl/keystore.jks". ssl_keystore_password: Enter the password of keystore. It is the same password that was entered when the keystore was generated. ssl_truststore_file_path: Enter the path of the truststore file. This is the path where the generated truststore file is copied in Cisco Crosswork Situation Manager. e.g. "/usr/local/hpnnmi_ssl/keystore.jks". ssl_truststore_password: Enter the password of truststore. Note The keystore.jks generated in the SSL configuration section is used both as a keystore and truststore. Therefore, the path to the keystore.jks is entered in the fields ssl_keystore_file_path and ssl_truststore_file_path. |
Filter
| Field |
Type |
Description |
| filter |
Object |
Parameters to filter incidents: Origin: Specify the source from where the incident has been generated, if nothing is mentioned in this field, then incidents from all the sources will be fetched. The following sources are supported: SNMPTRAP MANAGEMENTSOFTWARE SYSLOG REMOTELYGENERATED MANUALLYCREATED OTHER maxObjects: The number of incidents that can be fetched in a poll will be entered here. If nothing is entered, then by default 1000 incidents will be fetched in one poll. |
Note::
The entry in the fields maxObjects, polling_interval, max_retries and retry_interval should be an integer, and therefore, enter the values in these fields without quotation mark.
Example
You can configure the HP NNMi LAM to retrieve events from one or more sources. The following example demonstrates a configuration that targets two HP NNMi sources. For a single source comment out the target2 section. If you have more than two sources, add a target section for each one and uncomment properties to enable them.
monitor:
{
name : "HpNnmi Lam Monitor",
class : "CHpNnmiMonitor",
request_interval : 60,
max_retries : -1,
retry_interval : 60,
targets:
{
target1:
{
request_interval : 60,
max_retries : -1,
retry_interval : 60,
webservice_endpoint : "http://examplehpnnmi1/IncidentBeanService/IncidentBean",
user_name : "hpnnmi_user1",
#password : "password",
encrypted_password : "qJAFVXpNDTk6ANq65pEfVGNCu2vFdcoj70AF5BIebEc=",
disable_certificate_validation : false,
path_to_ssl_files : "config",
server_cert_filename : "server1.crt",
client_key_filename : "client1.key",
client_cert_filename : "client1.crt",
filter:
{
origin : "",
maxObjects : 1000
}
}
target2:
{
request_interval : 60,
max_retries : -1,
retry_interval : 60,
webservice_endpoint : "http://examplehpnnmi2/IncidentBeanService/IncidentBean",
user_name : "hpnnmi_user2",
#password : "password",
encrypted_password : "bDGFSClSHBn8DSw43nGwSPLSv2dGwdsj50WD4BHdfVa&",
disable_certificate_validation : false,
path_to_ssl_files : "config",
server_cert_filename : "server2.crt",
client_key_filename : "client2.key",
client_cert_filename : "client2.crt",
filter:
{
origin : "SNMPTRAP",
maxObjects : 1000
}
}
}
}
Agent and Process Log
Agent and Process Log allows you to define the following properties:
· name: Identifies events the LAM sends to the Message Bus.
· capture_log: Name and location of the LAM's capture log file.
· configuration_file: Name and location of the LAM's process log configuration file.
Example
Agent
agent:
{
name : "HP NNMi"
#log : "$MOOGSOFT_HOME/log/data-capture/hp_nnmi_lam.log"
},
Mapping
For incidents received from HP NNMi, you can directly map the incident fields of HP NNMi with Cisco Crosswork Situation Manager fields. The parameters of the received incidents will be displayed in the Cisco Crosswork Situation Manager according to the mapping done here:
mapping :
{
catchAll: "overflow",
rules:
[
{ name: "signature", rule: "$family" },
{ name: "source_id", rule: "$sourceName" },
{ name: "external_id", rule: "$sourceNodeName" },
{ name: "manager", rule: "HP NNMi" },
{ name: "source", rule: "$origin" },
{ name: "class", rule: "$nature" },
{ name: "agent", rule: "$LamInstanceName" },
{ name: "agent_location", rule: "$category" },
{ name: "type", rule: "$sourceType" },
{ name: "severity", rule: "$severity", conversion:"sevConverter" },
{ name: "description", rule: "$formattedMessage" },
{ name: "agent_time", rule: "$lastOccurrenceTime"}
]
},
filter:
{
presend:"HpNnmiLam.js"
}
Constants and Conversions
Constants and Conversions allow you to convert formats of the received data.
| Field |
Description |
Example |
| Severity and sevConverter |
has a conversion defined as sevConverter in the Conversions section, this looks up the value of severity defined in the severity section of constants and returns back the mapped integer corresponding to the severity. |
severity: "CLEAR" : 0, }, sevConverter: |
| stringToInt |
used in a conversion, which forces the system to turn a string token into an integer value. |
stringToInt: |
| timeConverter |
used in conversion which forces the system to convert time. If epoc time is to be used, then timeFormat mentioned in timeConverter should be commented. Otherwise, the user should provide the timeFormat. |
timeConverter: |
Example
Example Constants and Conversions
constants:
{
severity:
{
"NORMAL" : 1,
"WARNING" : 2,
"MINOR" : 3,
"MAJOR" : 4,
"CRITICAL" : 5
}
},
conversions:
{
sevConverter:
{
lookup: "severity",
input: "STRING",
output: "INTEGER"
},
stringToInt:
{
input: "STRING",
output: "INTEGER"
},
timeConverter:
{
timeFormat: "yyyy-MM-dd'T'HH:mm:ss.SSS",
input: "STRING",
output: "INTEGER"
}
},
Service Operation Reference
| Process Name |
Service Name |
| hp_nnmi_lam |
hpnnmilamd |
Start the LAM Service:
service hpnnmilamd start
Stop the LAM Service:
service hpnnmilamd stop
Check the LAM Service status:
service hpnnmilamd status
If the LAM fails to connect to one or more HP NNMi sources, Cisco Crosswork Situation Manager creates an alert and writes the details to the process log.
Command Line Reference
To see the available optional attributes of the hp_nnmi_lam, run the following command:
hp_nnmi_lam --help
The hp_nnmi_lam is a command line executable, and has the following optional attributes:
| Option |
Description |
| --config |
Points to a pathname to find the configuration file for the LAM. This is where the entire configuration for the LAM is specified. |
| --help |
Displays all the command line options. |
| --version |
Displays the component’s version number. |
| --log level |
Specifies the level of debugging. By default, user gets everything. In common with all executables in Cisco Crosswork Situation Manager, having it set at that level can result in a lot of output (many messages per event message processed). In all production implementations, it is recommended that log level is set to WARN, which only informs user of matters of importance. |
HP NNMi LAM Reference
This is a reference for the HP NNMi LAM and UI integration. The HP NNMi LAM configuration file is located at $MOOGSOFT_HOME/config/TBD.conf.
The following properties are unique to the HP NNMi LAM and UI integration.
See the LAM and Integration Reference for a full description of all common properties used to configure LAMs and UI integrations.
See the Microfocus documentation for details on NNMi components.
webservice_endpoint
Location of the HP NNMi webservice endpoint.
| Type |
String |
| Required |
Yes |
| Default |
N/A |
username
Your HP NNMi console username.
| Type |
String |
| Required |
Yes |
| Default |
N/A |
password
Your HP NNMi console password.
| Type |
String |
| Required |
If you are not using encrypted_password |
| Default |
N/A |
encrypted_password
If you are using an encrypted password to log in to the HP NNMi console, enter it into this field and comment the password field. The encrypted_password property overrides password.
| Type |
String |
| Required |
If you are not using password |
| Default |
N/A |
filter
Filters by incident source and/or specifies the number of events that are fetched in a single call.
| Type |
Object |
| Required |
No |
| Default |
N/A |
| Valid Values |
See the origin and maxObjects properties below. |
Example
filter :
{
{
origin : "REMOTELYGENERATED",
maxObjects : "999",
}
}
origin
Filters by incident source.
| Type |
String |
| Required |
No |
| Default |
N/A |
| Valid Values |
SNMPTRAP, MANAGEMENTSOFTWARE, SYSLOG, REMOTELYGENERATED, MANUALLYCREATED, OTHER. |
maxObjects
Specifies the number of events that are fetched in a single call.
| Type |
Integer |
| Required |
No |
| Default |
1000 |
HP OMi Polling
You can install the HP Operations Manager i (OMi) Polling integration to collect event data from one or more HP OMi systems.
See the HP OMi documentation for details on HP OMi components.
Before You Begin
The HP OMi integration has been validated with HP OMi v10.1. Before you start to set up your integration, ensure you have met the following requirements for each HP OMi server:
· You have the URL of the HP OMi Server.
· You have credentials to connect to the HP OMi server.
· You have the URI of the REST server where the HP OMi integration can fetch events.
· The port for your HP OMi server is open and accessible from Cisco Crosswork Situation Manager.
Additionally, you can provide optional configuration details. See the LAM and Integration Reference for a description of all properties.
Configure the HP OMi Integration
To configure the HP OMi integration:
1. Navigate to the Integrations tab.
2. Click HP OMi (Polling) in the Monitoring section.
3. Provide a unique integration name. You can use the default name or customize the name according to your needs.
4. Provide connection details for your HP OMi system.
Configure HP OMi
You do not need to perform any integration-specific steps on your HP OMi systems. After you configure the integration, it polls your HP OMi systems at regular intervals to collect event data (every 60 seconds by default).
If the integration fails to connect to one or more sources, Cisco Crosswork Situation Manager creates an alert and writes the details to the process log. Refer to the logging details for LAMs and integrations for more information.Configure Logging
Configure the HP OMi Polling LAM
HP Operations Manager (OMi) is an automated IT operations management software application. HP OMi provides automated monitoring, root cause identification and prioritization with automated remedial action.
See HP OMi Polling for UI configuration instructions.
The HP OMi Polling LAM fetches events from the HP OMi and forwards it to Cisco Crosswork Situation Manager.
1. LAM reads the configuration from the hp_omi_lam.conf file.
2. LAM connects to HP OMi REST API with given host name.
3. The response is received with event data in JSON format.
4. Events are parsed and converted into normalized Cisco Crosswork Situation Manager events.
5. The normalized events are then published to the Message Bus.
HP OMi LAM Configuration
The events received from HP OMi are processed according to the configurations in the hp_omi_lam.conf file. The processed events are published to Cisco Crosswork Situation Manager.
The configuration file contains a JSON object. At the first layer of the object, the LAM has a parameter called config, and the object that follows config has all the necessary information to control the LAM.
Monitor
The HP OMi Polling LAM takes the alerts from the HP OMi Server. You can configure the parameters here to establish a connection with HP OMi:
General
| Field |
Type |
Description |
| name and class |
String |
Reserved fields: do not change. Default values are HpOMi Lam Monitor and CHpOMiMonitor. |
| target |
JSON Object |
A top-level container for which you can define one or more target HP OMi sources. You can specify the configuration for each target. If you don't specify a request_interval the target uses the globally defined interval. |
| url |
String |
Enter the IP address or the host name or the FQDN of the HP OMi server along with the port on which it will communicate. For example: http://examplehpomi:80 In case of SSL communication, https will be used instead of http. |
| user_name and Password |
String |
Enter the username and password of the HP OMi console. The username and password of the user who has the permissions for handling all the events should be given here. If a user does not have permissions for handling all the events, then the LAM will not fetch all the events present in HP OMi. |
| encrypted_password |
String |
If you are using an encrypted password, enter the encrypted password in this field and comment the password field. Either password or the encrypted_password field is used. If both the fields are specified, then only the encrypted_password value will be used by the HP Omi LAM. |
| events_date_format |
String |
The format of the date/time in event response. The possible value would be like "yyyy-MM-dd'T'HH:mm:ss" or "yyyy-MM-dd'T'HH:mm:ss.SSSXXX". If this value is set to blank, then event date/time will be epoch time. |
| event_uri |
String |
This is the uri of the REST Server from which the events will be fetched. The version given here is 9.10 i.e. the current version of the OMi Event Web Service (not the current OMi version). If the version number is omitted, versions lower than 9.10 of the Event Web Service are addressed. You can change the version in case there is an upgrade of the API of HP OMi. For example: /opr-web/rest/9.10/event_list |
| polling_interval |
Integer |
The polling time interval, in seconds, between the requests after which the event data is fetched from HP OMi. Default = 10 seconds. If 0 is entered the time interval is set to 10 seconds. |
| max_retries |
Integer |
The maximum number of retry attempts to reconnect with HP OMi in case of a connection failure. Default = -1, if no value is specified, then there will be infinite retry attempts. If the specified value is greater than 0, then the LAM will try that many times to reconnect; in case of any other value less than 0, max retries will set to default. |
| retry_interval |
Integer |
The time interval between two successive retry attempts. Default = 60 seconds, if 0 is entered the time interval will set to 60 seconds. |
| timeout |
Integer |
The value in seconds to wait for a request to complete before timing out. If a timeout occurs, the LAM will wait for the next poll before trying again. Default value is 120 seconds. |
| request_interval |
Integer |
Length of time to wait between requests, in seconds. Can be overridden by request_interval in individual targets. Defaults to 60. |
Secure Sockets Layer
| Field |
Type |
Description |
| ssl |
Boolean |
Set to true, to enable SSL Communication: ssl_keystore_file_path: Enter the path of the keystore file. This is the path where the generated keystore file is copied in Cisco Crosswork Situation Manager, e.g. "/usr/local/hpomi_ssl/keystore.jks". ssl_keystore_password: Enter the password of keystore. It is the same password that was entered when the keystore was generated. |
Note::
The HP OMi has a functionality of duplicating events within its event browser. The LAM does not fetch all the duplicated events, instead it will fetch only single event which is duplicated into multiple events.
Example
You can configure the HP OMi LAM to retrieve events from one or more sources. The following example demonstrates a configuration that targets two HP OMi sources. For a single source comment out the target2 section. If you have more than two sources, add a target section for each one and uncomment properties to enable them.
monitor:
{
name : "HpOmi Lam Monitor",
class : "CHpOmiMonitor",
request_interval : 60,
max_retries : -1,
retry_interval : 60,
targets:
{
target1:
{
url : "http://examplehpomi1:80",
user_name : "hpomi_user1",
#password : "password",
encrypted_password : "qJAFVXpNDTk6ANq65pEfVGNCu2vFdcoj70AF5BIebEc=",
events_date_format : "yyyy-MM-dd'T'HH:mm:ss.SSSXXX",
event_uri : "/opr-web/rest/9.10/event_list",
request_interval : 60,
max_retries : -1,
retry_interval : 60,
timeout : 120,
disable_certificate_validation : false,
path_to_ssl_files : "config",
server_cert_filename : "server1.crt",
client_key_filename : "client1.key",
client_cert_filename : "client1.crt",
ssl_protocols : [ "TLSv1.2" ]
}
target2:
{
url : "http://examplehpomi2:80",
user_name : "hpomi_user2",
#password : "password",
encrypted_password : "bDGFSClSHBn8DSw43nGwSPLSv2dGwdsj50WD4BHdfVa&",
events_date_format : "yyyy-MM-dd'T'HH:mm:ss.SSSXXX",
event_uri : "/opr-web/rest/9.10/event_list",
request_interval : 60,
max_retries : -1,
retry_interval : 60,
timeout : 120,
disable_certificate_validation : false,
path_to_ssl_files : "config",
server_cert_filename : "server2.crt",
client_key_filename : "client2.key",
client_cert_filename : "client2.crt",
ssl_protocols : [ "TLSv1.2" ]
}
}
}
Agent and Process Log
The Agent and Process Log sections allow you to configure the following properties:
· name: Identifies events the LAM sends to the Message Bus.
· capture_log: Name and location of the LAM's capture log file.
· configuration_file: Name and location of the LAM's process log configuration file.
Mapping
For alerts received from HP OMi, you can directly map the alert fields of HP OMi with Cisco Crosswork Situation Manager fields. The parameters of the received alert are displayed in the Cisco Crosswork Situation Manager according to the mapping done here:
mapping :
{
catchAll: "overflow",
rules:
[
{ name: "signature", rule: "$originating_server.ip_address::$related_ci.configuration_item.root_class" },
{ name: "source_id", rule: "$originating_server.ip_address" },
{ name: "external_id", rule: "$originating_server.dns_name" },
{ name: "manager", rule: "HP OMi" },
{ name: "source", rule: "$originating_server.ip_address" },
{ name: "class", rule: "$state" },
{ name: "agent", rule: "$LamInstanceName" },
{ name: "agent_location", rule: "$category" },
{ name: "type", rule: "$priority" },
{ name: "severity", rule: "$severity", conversion:"sevConverter" },
{ name: "description", rule: "$title" },
{ name: "agent_time", rule: "$time_changed", conversion:"timeConverter"}
]
},
filter:
{
presend:"HpOmiLam.js"
}
Data not mapped to Cisco Crosswork Situation Manager Fields goes into "Custom Info".
Constants and Conversions
Constants and Conversions allows you to convert formats of the received data.
| Field |
Description |
Example |
| Severity and sevConverter |
has a conversion defined as sevConverter in the Conversions section, this looks up the value of severity defined in the severity section of constants and returns back the mapped integer corresponding to the severity. |
severity: "unknown" : 0,
}, sevConverter: |
| stringToInt |
used in a conversion, which forces the system to turn a string token into an integer value. |
stringToInt: |
| timeConverter |
used in conversion which forces the system to convert time. If epoc time is to be used, then timeFormat mentioned in timeConverter should be commented. Otherwise, the user should provide the timeFormat. |
timeConverter: |
Example
Example Constants and Conversions
constants:
{
severity:
{
"unknown" : 0,
"normal" : 1,
"warning" : 2,
"minor" : 3,
"major" : 4,
"critical" : 5
}
},
conversions:
{
sevConverter:
{
lookup: "severity",
input: "STRING",
output: "INTEGER"
},
stringToInt:
{
input: "STRING",
output: "INTEGER"
},
timeConverter:
{
timeFormat: "yyyy-MM-dd'T'HH:mm:ss.SSS",
input: "STRING",
output: "INTEGER"
}
},
Service Operation Reference
| Process Name |
Service Name |
| hp_omi_lam |
hpomilamd |
Start the LAM Service:
service hpomilamd start
Stop the LAM Service:
service hpomilamd stop
Check the LAM Service status:
service hpomilamd status
If the LAM fails to connect to one or more HP OMi sources, Cisco Crosswork Situation Manager creates an alert and writes the details to the process log.
Command Line Reference
To see the available optional attributes of the hp_omi_lam, run the following command:
hp_omi_lam --help
HP OMi Plugin
You can configure the HP OMi Plugin integration to post data to Cisco Crosswork Situation Manager when an event occurs in HP OMi. The integration requires you to configure external event processing in HP OMi.
The HP OMi Plugin does not require authentication. The integration listens without requiring password information.
Refer to the LAM and Integration Reference to see the integration's default properties. When you use the integrations UI, you can only configure the visible properties.
If you want to implement a more complex HP OMi LAM with custom settings, see Configure the HP OMi Plugin LAM.
See the HP OMi documentation for details on HP OMi components.
Before You Begin
The HP OMi Plugin integration has been validated with HP OMi v10.1. Before you start to set up your integration, ensure you have met the following requirements:
· You have the URL for your HP OMi workspace.
· You have credentials to connect to HP OMi with permissions to configure External Event Processing.
· HP OMi can make requests to external endpoints over port 443. This is the default.
Configure the HP OMi Plugin Integration
Configure the HP OMi Plugin integration in Cisco Crosswork Situation Manager as follows:
1. Navigate to the Integrations tab.
2. Click HP OMi Plugin in the Monitoring section.
3. Provide a unique integration names. You can use the default name or customize the name according to your requirements.
Configure HP OMi
To configure HP OMi to work with the integration, create a connected server to Cisco Crosswork Situation Manager. Then configure the server as the target server for an event forwarding rule. See the HP OMi documentation for details.
1. Log into HP OMi and create a Connected Server with type External Event Processing as follows:
| Step |
Field |
Value |
| General |
Display Name |
Cisco Crosswork Situation Manager Server |
|
|
Name |
AIOps_Server |
| Server Properties |
Request URL |
<your HP OMi Plugin integration URL> For example: https://example.Cisco.com/events/hpomiplugin_hpomiplugin1 |
|
|
CI Type |
Management System. Any CI Type will work. |
| Integration Type |
Call Script Adaptor |
Selected |
|
|
Script Display Name |
AIOps_Push_Adaptor. Use Manage Scripts to create a new script. |
|
|
Script Description |
Adaptor to send alerts to HP OMi Plugin integration |
|
|
Script |
Contents of CHpomiPushAdapter |
| Outgoing Connection |
Port |
<Port for HP OMi Plugin integration>. 48015 by default. |
|
|
Use Secure HTTP |
Selected. Retrieve the certificate from the server or supply the certificate files. |
2. Create an event forwarding rule or edit an existing rule to target the server:
a. Select the "Cisco Crosswork Situation Manager Server" as the Target Server for the rule.
b. Set Forwarding Type to Notify and Update.
When an event triggers the rule, HP OMi forwards the event to Cisco Crosswork Situation Manager.
Configure the HP OMi Plugin LAM
The HP OMi Plugin LAM is an endpoint for HTTP notifications from HP OMi. The LAM parses the alerts from HP OMi into Cisco Crosswork Situation Manager events.
You can install a basic HP OMi Plugin integration in the UI. See HP OMi Plugin for integration steps.
The HP OMi Plugin LAM does not require authentication. It listens without requiring password information.
Configure the HP OMi Plugin LAM if you want to configure custom properties, set up high availability or configure advanced options that are not available in the UI integration.
See the HP OMi documentation for details on HP OMi components.
Before You Begin
The HP OMi Plugin integration has been validated with HP OMi v10.1. Before you start to set up the LAM, ensure you have met the following requirements:
· You have the URL for your HP OMi workspace.
· You have credentials to connect to HP OMi with permissions to configure External Event Processing.
· HP OMi can make requests to external endpoints over port 443. This is the default.
If you are configuring a distributed deployment refer to /document/preview/77155#UUIDbea404d9dd1afee65fa1471105d1b3c6 first. You will need the details of the server configuration you are going to use for HA.High Availability Overview
Configure the LAM
Edit the configuration file to control the behavior of the HP OMi LAM. You can find the file at $MOOGSOFT_HOME/config/hp_omi_plugin_lam.conf
The HP OMi Plugin LAM is a REST-based LAM as it provides an HTTP endpoint for data ingestion. See the LAM and Integration Reference for a full description of all properties.
Some properties in the file are commented out by default. Uncomment properties to enable them.
1. Configure the properties for the REST connection:
a. address: Address on the Cisco Crosswork Situation Manager server that listens for REST messages. Defaults to all interfaces.
b. port: Port on the Cisco Crosswork Situation Manager server that listens for HP OMi messages. Defaults to 48015.
2. Configure the SSL properties if you want to encrypt communications between the LAM and the REST connection:
a. use_ssl: Whether to use SSL certification.
b. path_to_ssl_files: Path to the directory that contains the SSL certificates.
c. ssl_key_filename: The SSL server key file.
d. ssl_cert_filename: The SSL root CA file.
e. ssl_protocols: Sets the allowed SSL protocols.
3. Configure the LAM behavior:
a. num_threads: Number of worker threads to use when processing events.
b. rest_response_mode: When to send a REST response. See the LAM and Integration Reference for the options.
c. rpc_response_timeout: Number of seconds to wait for a REST response.
d. event_ack_mode: When Moogfarmd acknowledges events from the REST LAM during the event processing pipeline.
e. accept_all_json: Allows the LAM to read and process all forms of JSON.
f. lists_contain_multiple_events: Whether Cisco Crosswork Situation Manager interprets a JSON list as multiple events.
4. Optionally configure the LAM identification and logging details in the agent and log_config sections of the file:
a. name: Identifies events the LAM sends to the Message Bus.
b. capture_log: Name and location of the LAM's capture log file.
c. configuration_file: Name and location of the LAM's process log configuration file.
5. Optionally configure severity conversions. See /document/preview/11721#UUID8b183a1e1278a7a652d3ae86944d7379 for further information and "Conversion Rules" in /document/preview/11720#UUID5c67156b667b1a28ec648cd779393914 for details on conversions in general.Severity ReferenceData Parsing
Unsupported Properties
HP OMi Plugin alerts do not support client authentication. Do not uncomment or change the following properties:
· use_client_certificates
· client_ca_filename
· auth_token or encrypted_auth_token
· header_auth_token or encrypted_header_auth_token
· authentication_type
· authentication_cache
Example
The following example demonstrates a HP OMi Plugin LAM configuration.
monitor:
{
name : "HpOmiPlugin Monitor",
class : "CRestMonitor",
port : 48015,
address : "0.0.0.0",
use_ssl : false,
path_to_ssl_files : "config",
ssl_key_filename : "server.key",
#use_client_certificates : false,
#client_ca_filename : "ca.crt",
#auth_token : "my_secret",
#encrypted_auth_token : "dfJtTQMGiFHfiq7sCmxguBt6Jv+eytkoiKCquSB/7iWxpgGsG2aez3z2j7SuBtKj",
#header_auth_token : "my_secret",
#encrypted_header_auth_token : "dfJtTQMGiFHfiq7sCmxguBt6Jv+eytkoiKCquSB/7iWxpgGsG2aez3z2j7SuBtKj",
authentication_type : "none",
authentication_cache : false,
accept_all_json : true,
lists_contain_multiple_events : true,
num_threads : 5,
rest_response_mode : "on_receipt",
rpc_response_timeout : 20,
event_ack_mode : "queued_for_processing"
},
agent:
{
name : "HP OMi",
capture_log : "$MOOGSOFT_HOME/log/data-capture/hp_omi_plugin_lam.log"
},
log_config:
{
configuration_file : "$MOOGSOFT_HOME/config/logging/hp_omi_plugin_lam_log.json"
},
Configure for High Availability
Configure the HP OMi Plugin LAM for high availability if required. See /document/preview/77155#UUIDbea404d9dd1afee65fa1471105d1b3c6 for details.High Availability Overview
Configure LAMbot Processing
The HP OMi Plugin LAMbot processes and filters events before sending them to the Message Bus. You can customize or bypass this processing if required. You can also load JavaScript files into the LAMbot and execute them.
See LAMbot Configuration for more information. An example HP OMi Plugin LAM filter configuration is shown below.
filter:
{
presend: "HpOmiPluginLam.js",
modules: [ "CommonUtils.js" ]
}
Configure Mapping
By default the following HP OMi properties map to the following Cisco Crosswork Situation Manager HP OMi Plugin LAM properties. You can configure custom mappings in the HP OMi Plugin LAMbot.
| HP OMi Event Property |
HP OMi Plugin LAM Property |
| $LamInstanceName |
agent |
| $event.category |
agent_location |
| $event.time_changed", conversion:"timeConverter |
agent_time |
| $event.title |
class |
| $event.title |
description |
| $event.originating_server.dns_name |
external_id |
| HP OMi |
manager |
| $event.severity", conversion:"sevConverter |
severity |
| $event.originating_server.ip_address::$event.id |
signature |
| $event.originating_server.ip_address |
source |
| $event.originating_server.ip_address |
source_id |
| $event.priority |
type |
Start and Stop the LAM
Restart the HP OMi Plugin LAM to activate any changes you make to the configuration file or LAMbot.
The LAM service name is hpomipluginlamd.
See /document/preview/11677#UUID1a2205c3aae40b26fdfe94490043f3c3 for the commands to start, stop and restart the LAM.Control Processes
You can use a GET request to check the status of the HP OMi Plugin LAM. See "Check the LAM Status" in Configure the REST LAM for further information and examples.
Configure HP OMi
After you have the HP OMi Plugin LAM running and listening for incoming requests, you can configure HP OMi. See "Configure HP OMi" in HP OMi Plugin.
IBM
You can integrate Cisco Crosswork Situation Manager with the following IBM products:
· Netcool Legacy LAM: Install the Netcool Legacy LAM to collect event data from IBM Tivoli Netcool Omnibus. Note that there is no UI integration for this LAM.
· Tivoli EIF LAM: Install the Tivoli EIF LAM to retrieve Tivoli Event Integration Format (EIF) messages and send them to Cisco Crosswork Situation Manager as events. Note that there is no UI integration for this LAM.
· WebSphere MQ: Install the WebSphere MQ integration to collect messages from WebSphere MQ for a subscribed queue or topic.
Netcool Legacy LAM
The Legacy Netcool LAM enables Cisco Crosswork Situation Manager to receive data from IBM Tivoli Netcool Omnibus.
IBM Tivoli Netcool Omnibus includes a socket gateway which is able to pass data to a third party system. This permits integration between IBM Tivoli Netcool Omnibus and Cisco Crosswork Situation Manager.
In its default configuration, the LAM will ingest data from a default IBM Tivoli Netcool Omnibus set up. Mapper utilities are also provided to enable data ingestion from a non-default IBM Tivoli Netcool Omnibus setup. In addition, the following Moobots are provided:
| File |
Description |
| AlertBuilderNetcool.js |
Allows special handling for the 'repeatDetection' and 'stopDeduplication' processes. |
| AlertRulesEngineNetcool.js |
Used to process DELETE and REPEAT type events. |
| SituationMgrNetcool.js |
Creates description labels for Situations based around root cause and symptom detection, based on IBM Tivoli Network Manager parameters. |
Capabilities
· Data received from IBM Tivoli Netcool Omnibus has fields checked to identify event type (eg. Problem, Resolution), state (eg. INSERT, UPDATE, DELETE) and severity.
· Events are then created by the Legacy LAMbot (based on the LAMbot configuration), containing all the mandatory Netcool event fields, and any additional optional fields.
· Events are passed to the Netcool Alert Builder for de-duplication and alert creation.
· Alerts are then passed to the Netcool Alert Rules Engine for filtering and passing on to Sigalisers for further processing.
· Legacy LAM can process ITNM (IBM Tivoli Network Manager) root cause and symptom events, using /document/preview/11777#UUIDf7ebeb66bd2fd4cd5be93559136d00a6 to create Situations.Cookbook
Requirements
The ingestion of data from IBM Tivoli Netcool Omnibus requires that its gateway be configured according to the configurations set within Cisco Crosswork Situation Manager. To be able to get data from IBM Tivoli Netcool Omnibus, Cisco Crosswork Situation Manager must be configured to allow inbound communication from IBM Tivoli Netcool Omnibus.
To ingest data there must be mapping in the NetcoolLAM between Cisco Crosswork Situation Manager Alert fields and IBM Tivoli Netcool Omnibus alert fields. Mapping of some IBM Tivoli Netcool Omnibus fields is mandatory, as they are required in any IBM Tivoli Netcool Omnibus system. These fields are mapped by default. Mapping of the remaining IBM Tivoli Netcool Omnibus fields is optional; they are not mapped by default.
The configuration of IBM Tivoli Netcool Omnibus to send data and the configuration for Cisco Crosswork Situation Manager to ingest and process the data are explained below.
IBM Tivoli Netcool Omnibus configuration
Note::
An IBM Tivoli Netcool Omnibus system administrator is required.
Configure the socket gateway and socket map files to send data to Cisco Crosswork Situation Manager.
Socket Gateway Configuration
In the IBM Netcool Omnibus gateway configuration file (by default named NCO_GATE.props) configure the following:
| Field |
Set to: |
| Gate.Socket.Host |
Hostname or IP address of the Cisco Crosswork Situation Manager system. |
| Gate.Socket.Port |
Port number defined in the Legacy LAM. For example 8411. |
| Gate.Socket.Separator |
The delimiter used in the data sent to Cisco Crosswork Situation Manager. Set this to double pipe - || |
| Gate.Socket.InsertTrailer |
NC_EVENT_END;\n |
| Gate.Socket.UpdateTrailer |
NC_EVENT_END;\n |
| Gate.Socket.DeleteTrailer |
NC_EVENT_END;\n |
| Gate.Socket.InsertHeader |
INSERT|| |
| Gate.Socket.UpdateHeader |
UPDATE|| |
| Gate.Socket.DeleteHeader |
DELETE|| |
Socket Map Configuration
In the gateway mappings configuration file (by default named socket.map), set the fields to be sent to Cisco Crosswork Situation Manager, ensuring that no field is set to be ON INSERT ONLY. Gateway mapping should include all the mandatory fields, and any additional optional ones (such as @NodeAlias).
Mappings should look similar to the example below:
CREATE MAPPING StatusMap
(
'' = '@Identifier',
'' = '@Serial',
'' = '@Node',
'' = '@LocalNodeAlias',
'' = '@Manager',
'' = '@Agent',
'' = '@AlertGroup',
'' = '@AlertKey',
'' = '@Severity',
'' = '@Summary',
'' = '@FirstOccurrence',
'' = '@LastOccurrence',
'' = '@Class',
'' = '@OwnerUID',
'' = '@Acknowledged',
'' = '@ExpireTime',
'' = '@SuppressEscl',
'' = '@TaskList',
'' = '@LocalRootObj',
'' = '@RemoteNodeAlias',
'' = '@RemoteRootObj',
'' = '@ServerName',
'' = '@ServerSerial',
'' = '@StateChange',
'' = '@InternalLast',
'' = '@Tally',
'' = '@Type',
'' = '@EventId',
'' = '@NodeAlias'
);
Cisco Crosswork Situation Manager Configuration
In the above example mappings configuration, the fields in red are optional. All other fields are mandatory, and are required to be able to ingest data into Cisco Crosswork Situation Manager.
To run the Legacy LAM, the following Cisco Crosswork Situation Manager files are required and are installed by default:
| File |
Description |
| $MOOGSOFT/config/netcool_lam.conf |
Legacy LAM configuration file. |
| $MOOGSOFT/bots/lambots/NetcoolLam.js |
LAMbot file; performs the main processing of the events received from IBM Tivoli Netcool Omnibus. |
| $MOOGSOFT/bots/lambots/NetcoolUtility.js |
Holds additional functions and configurations required for the LAMbot. |
| $MOOGSOFT_HOME/bin/utils/netcool_lam.conf.template |
Used by the moog_netcool_lam_mapper script as a base template for generating a new Legacy LAM configuration file. See the following sections. |
The following sections detail the steps required to configure the Legacy LAM, LAMbot and Moobots:
Legacy LAM Configuration
Mapping between IBM Tivoli Netcool Omnibus data fields and Cisco Crosswork Situation Manager fields is defined in the Legacy LAM configuration file netcool_lam.conf. As installed, netcool_lam.conf maps to the data fields in a default set up of IBM Tivoli Netcool Omnibus. If ingesting data from a non-default IBM Tivoli Netcool Omnibus set up, a mapping utility moog_netcool_lam_mapper is available to map between IBM Tivoli Netcool Omnibus data fields and Cisco Crosswork Situation Manager fields. You can also enter the mapping by manually editing netcool_lam.conf.
The mapping utility can use either an IBM Tivoli Netcool Omnibus map file, or a log file containing Event data from IBM Tivoli Netcool Omnibus:
Note::
Before running the mapping utility, back up the existing netcool_lam.conf file.
To use a map file with the mapping utility, enter the command and arguments as in the following example (the map file is socket.map):
sh $MOOGSOFT_HOME/bin/utils/moog_netcool_lam_mapper -f socket.map -t map
To use a log file with the mapping utility, enter the command and arguments as in the following example (the log file is event-data.txt):
sh $MOOGSOFT_HOME/bin/utils/moog_netcool_lam_mapper -f event-data.txt -t logfile
When running the mapping utility (using either a map file or a log file), you can also optionally set the address (using the -a argument in the command line) and port number (using the -p argument in the command line), as shown in the following example:
sh $MOOGSOFT_HOME/bin/utils/moog_netcool_lam_mapper -a remote_host -f socket.map -p 8455 -t map
The above example sets the address to remote_host and the port number to 8455.
Note::
Once the mapping utility has successfully completed, a new Legacy LAM configuration file netcool_lam.conf is generated and is automatically placed in the default configuration directory ($MOOGSOFT/config), overwriting the existing netcool_lam.conf file
Check the Legacy LAM configuration file to ensure that the following fields are set correctly:
| Field |
Description |
Example |
| port |
The port number where the Legacy LAM will be receiving data from IBM Tivoli Netcool Omnibus |
Port number 8411 |
| address |
This should be localhost or the hostname of the system running Cisco Crosswork Situation Manager |
If Cisco Crosswork Situation Manager is running on premise the default address is : 0.0.0.0 If Cisco Crosswork Situation Manager is running on e.g. Amazon web services, it may be similar to ew2.234.234.compute.amazonaws.com |
| mode |
The operation mode in which the socket LAM will run should be set to SERVER |
|
LAMbot Configuration
The LAMbot performs the core processing of the data received from IBM Tivoli Netcool Omnibus. The main configuration option in the LAMbot is whether DELETE type events are processed or not. By default this is disabled (the keepDeletes value set to 0 in the LAMbot. This may be changed if necessary, by editing the NetcoolLam.js file.
Additionally, there is an optional configuration in the LAMbot that will enable the processing of ITNM (IBM Tivoli Network Manager) Route Cause and Symptom events, based on the values of the fields @NmosCauseType and @NmosSerial. These two fields must be included in the event to be able to enable processing. By default, it is set to disabled. To enable it, set the usingITNM value to true in the NetcoolLam.jsfile.
Only proceed with the remaining steps in this section if you have enabled the use of ITNM (see above)
Then go to the next section "Moobot Configuration".
Enabling the processing of ITNM fields requires the associated Moolets, Cookbook and Recipe to be enabled in the Moogfarmd configuration file $MOOGSOFT/config/moog_farmd.conf as follows:
1. In the sig_resolution section, uncomment the following merge group, making it available as an additional merge group:
merge_groups:
[
{
name: "ITNM Route Causes & Symptoms",
moolets: ["ITNM"],
alert_threshold : 2,
sig_similarity_limit : 0.65
}
],
2. In the moolets section, uncomment the ITNM Cookbook and recipe:
{
# Moolet
name : "ITNM",
classname : "CCookbook",
run_on_startup : true,
metric_path_moolet : true,
moobot : "Cookbook.js",
#process_output_of : "AlertRulesEngine",
process_output_of : "AlertBuilder",
# Algorithm
membership_limit : 1,
scale_by_severity : false,
entropy_threshold : 0,
single_recipe_matching : false,
recipes : [
{
chef : "CValueRecipe",
name : "ITNM Route Cause & Symptom Detection",
description : "Root cause and Symptom alerts detected based on ITNM",
recipe_alert_threshold : 1,
exclusion : "custom_info.nmosCauseType = 0",
trigger : "custom_info.suppressedSerial > 0",
rate : 0,
min_sample_size : 5,
max_sample_size : 10,
cook_for : 1200,
matcher : {
components:[
{ name: "custom_info.suppressedSerial", similarity: 1.0 }
]
}
}
],
cook_for : 1200
}
3. Enable the Netcool Situation Manager Moolet:
a. Set the run_on_startup value to true for the SituationMgr Moolet
b. Uncomment the line containing the Netcool Moobot - SituationMgrNetcool.js (the file is installed by default) • Uncomment ITNM in the section process_output_of to include the ITNM Cookbook.
The Moolet section should now look similar to the one below:
name : "SituationMgr",
classname : "CSituationMgr",
run_on_startup : true,
metric_path_moolet : false,
#moobot : "SituationMgr.js",
moobot : "SituationMgrNetcool.js",
process_output_of : [
"ITNM",
"Sigaliser",
"TemplateMatcher",
"Speedbird"
]
4. Save the Moogfarmd configuration file.
Moobot Configuration
Alert Builder Moobot
The Netcool Alert Builder is used to detect whether an event received is repeating or not, and whether an alert should be created from it. This detection is performed in addition to the standard functionality of the Alert Builder.
To enable the repeat detection functionality, in the Moogfarmd configuration file ($MOOGSOFT/config/moog_farmd.conf) in the AlertBuilder moolet section, uncomment the Alert Builder Moobot file AlertBuilderNetcool.js as shown below:
name : "AlertBuilder",
classname : "CAlertBuilder",
run_on_startup : true,
#moobot : "AlertBuilder.js",
moobot : "AlertBuilderNetcool.js",
Ensure that run_on_startup is set to true
Save the changes
In the Alert Builder Moobot ($MOOGSOFT/bots/moobots/AlertBuilderNetcool.js), there are three configuration settings that can be set as follows:
var repeatDetection=true;
var stopDeduplication=true;
var overwriteCustomInfo=false;
repeatDetection
If an incoming Event is an UPDATE type, repeat detection is enabled (DELETE and INSERT types cannot be repeating events). The Event signature is then matched to existing alerts. If no match is found, or a match is found to a closed alert, a new alert is created. If an open alert match is found, de-duplication is carried out (see below).
· Set the repeatDetection value to true to enable the repeat detection process, where the Netcool Alert Builder Moobot determines if newly created alerts are similar to existing alerts.
stopDeduplication
This determines whether the repeat detection process is carried out before or after an alert is created.
· Set stopDeduplication to true to prevent the de-duplication process from occurring. The repeat detection process is then performed before an alert is created.
· Set stopDeduplication to false to create a new alert based on the event that has been received. Then the repeat detection process is performed, based on the newly created alert and existing alerts.
Note::
Setting stopDeduplication to false (repeat detection after alert creation) will also allow you to forward the alert to a different Moolet chain, if required.
overwriteCustomInfo
This defines whether the custom_info is updated when updating (de-duplicating) alerts.
· Set overwriteCustomInfo to true to update alerts custom_info from new event data.
· Set overwriteCustomInfo to false to leave alerts custom_info unchanged when an alert is updated.
Note::
If IBM Tivoli Netcool Omnibus is sending Route Cause and Symptom events from ITNM (IBM Tivoli Network Manager), and using ITNM is set to to true in the LAMbot configuration file (see LAMbot configuration above), then the alerts custom_info field must be updated when de-duplicating: set overwriteCustomInfo to true.
AlertRulesEngine Moobot
Enable the AlertRulesEngineNetcool.js Moobot, along with the associated action states and transitions. It is used to process DELETE and REPEAT type alerts, determining whether they are discarded or passed onto the Sigalisers for further processing.
To do this, open the Moogfarmd configuration file and uncomment the line containing the AlertRulesEngineNetcool.js Moobot within the AlertRulesEngine moolet section, as shown below:
name : "AlertRulesEngine",
classname : "CAlertRulesEngine",
run_on_startup : true,
metric_path_moolet : true,
#moobot : "AlertRulesEngine.js",
moobot : "AlertRulesEngineNetcool.js",
#standalone : true
process_output_of : "AlertBuilder"
Ensure that run_on_startup is set to true
Save the changes
The rules (action states and transitions) to process DELETE and INSERT type Alerts should be added to the Cisco Crosswork Situation Manager instance by entering the following command:
sh $MOOGSOFT_HOME/bin/utils/moog_netcool_are_installer
Final steps
Restart the Moogfarmd process and then start the Legacy LAM to begin listening and receiving data from IBM Tivoli Netcool Omnibus on the defined socket.
To do this:
service moogfarmd restart
service netcoollamd start
Note::
To check the Legacy LAM status:
service netcoollamd status
To stop the Legacy LAM:
service netcoollamd stop
Default Field Mapping
The following table shows the default IBM Tivoli Netcool Omnibus field mappings to Cisco Crosswork Situation Manager fields. These mappings are defined either in the Legacy LAM configuration file or within the LAMbot:
| IBM Tivoli Netcool Omnibus > Cisco Crosswork Situation Manager Field Mappings |
|
|
|
| ActionType |
type |
varchar(255) |
Yes |
| Identifier |
signature |
varchar(255) |
Yes |
| Serial |
external_id |
incr |
Yes |
| Node |
source |
varchar(64) |
Yes |
| LocalNodeAlias |
source_id |
varchar(64) |
Yes |
| Manager |
manager |
varchar(64) |
Yes |
| Agent |
agent |
varchar(64) |
No |
| AlertKey |
agent_location |
varchar(255) |
Yes |
| AlertGroup |
agent_location |
varchar(255) |
No |
| Severity |
severity |
integer |
Yes |
| Summary |
description |
varchar(255) |
Yes |
| FirstOccurrence |
first_occurred |
integer |
Yes |
| LastOccurrence |
agent_time |
integer |
Yes |
| Class |
class |
integer |
Yes |
| OwnerUID |
custom_info.ownerUID |
integer |
Yes |
| Acknowledged |
custom_info.acknowledged |
integer |
Yes |
| ExpireTime |
custom_info.expireTime |
integer |
Yes |
| SuppressEscl |
custom_info.suppressEscl |
integer |
Yes |
| TaskList |
custom_info.taskList |
integer |
Yes |
| LocalRootObj |
custom_info.localRootObj |
varchar(255) |
Yes |
| RemoteNodeAlias |
custom_info.remoteNodeAlias |
varchar(64) |
Yes |
| RemoteRootObj |
custom_info.remoteRootObj |
varchar(255) |
Yes |
| ServerName |
custom_info.serverName |
varchar(64) |
Yes |
| ServerSerial |
custom_info.serverSerial |
integer |
Yes |
| StateChange |
custom_info.stateChange |
integer |
Yes |
| InternalLast |
custom_info.internalLast |
integer |
Yes |
| Tally |
custom_info.tally |
integer |
Yes |
| Type |
custom_info.eventType |
integer |
No |
| EventId |
custom_info.eventId |
varchar(255) |
No |
| NodeAlias |
custom_info.NodeAlias |
varchar(64) |
No |
| NmosCauseType |
custom_info.nmosCauseType |
integer |
No |
| NmosSerial |
custom_info.nmosSerial |
varchar(64) |
No |
Note::
The severity mapping, as set in the Legacy LAM configuration severity section, is set by default to be identical to the severity values used within IBM Tivoli Netcool Omnibus. This can be changed if necessary under the severity section in the Legacy LAM configuration file.
For example:
constants:
{
severity:
{
"0" : 0,
"1" : 1,
"2" : 2,
"3" : 3,
"4" : 4,
"5" : 5
}
},
Tivoli EIF LAM
The Tivoli EIF LAM allows you to retrieve Tivoli Event Integration Format (EIF) messages and send them to Cisco Crosswork Situation Manager as events.
A range of Tivoli products generate EIF messages. Refer to IBM Tivoli Netcool/OMNIbus probes and gateways for further information.
There is no UI integration for Tivoli EIF. See Configure the Tivoli EIF LAM for configuration instructions.
Configure the Tivoli EIF LAM
The Tivoli EIF LAM allows you to retrieve Tivoli EIF (Event Integration Format) messages and send them to Cisco Crosswork Situation Manager as events.
There is no UI integration for Tivoli EIF. Follow these instructions to configure the LAM.
Refer to IBM Tivoli Netcool/OMNIbus probes and gateways for further information on Tivoli products that generate EIF messages.
Before You Begin
Before you start to set up your Tivoli EIF LAM, ensure you have met the following requirements:
· You know the connection mode. It can be either Server or Client.
· You have identified the IP address and port of your Tivoli server.
· The port for your Tivoli connection is open and accessible from Cisco Crosswork Situation Manager.
· You know whether your Tivoli server is configured to use UDP or TCP protocol.
If you are configuring the Tivoli EIF LAM for high availability, refer to /document/preview/77155#UUIDbea404d9dd1afee65fa1471105d1b3c6first. You will need the details of the server configuration you are going to use for HA.High Availability Overview
Configure the LAM
Edit the configuration file to control the behavior of the Tivoli EIF LAM. You can find the file at $MOOGSOFT_HOME/config/tivoli_eif_lam.conf
See the Tivoli EIF LAM Reference and LAM and Integration Reference for a full description of all properties. Some properties in the file are commented out by default. Uncomment properties to enable them.
1. Configure the connection properties for your Tivoli server:
a. mode: Client or Server.
b. address: IP address or host name of the Tivoli server.
c. port: Port of the Tivoli server.
d. protocol_type: TCP or UDP.
2. Configure the LAM behavior:
a. event_ack_mode: When Moogfarmd acknowledges events from the Tivoli EIF LAM during the event processing pipeline.
b. num_threads: Number of worker threads to use when processing events.
3. Optionally configure the LAM identification and logging details in the agent and log_config sections of the file:
a. name: Identifies events the LAM sends to the Message Bus. Defaults to EIF_LAM.
b. capture_log: Name and location of the LAM's capture log file.
c. configuration_file: Name and location of the LAM's process log configuration file.
4. Optionally configure severity conversions. See /document/preview/11721#UUID8b183a1e1278a7a652d3ae86944d7379 for further information and "Conversion Rules" in /document/preview/11720#UUID5c67156b667b1a28ec648cd779393914 for details on conversions in general.Severity ReferenceData Parsing
Example
The following example demonstrates a Tivoli EIF LAM configuration.
monitor:
{
name : "ITM EIF LAM",
class : "CSockMonitor",
mode : "SERVER",
address : "216.3.128.12",
port : 8412,
protocol_type : "TCP",
event_ack_mode : "queued_for_processing",
num_threads : 1
},
agent:
{
name : "EIF_LAM",
capture_log : "$MOOGSOFT_HOME/log/data-capture/tivoli_eif_lam.log"
},
log_config:
{
configuration_file : "$MOOGSOFT_HOME/config/logging/tivoli_eif_lam_log.json"
},
Configure the Tivoli EIF Utility
The Tivoli EIF LAMbot requires the Tivoli EIF utility in order to work. The utility replaces the standard mapping usually performed in the LAMbot and allows multiple mappings for different event types.
See Configure the Tivoli EIF Utility for details.
Configure for High Availability
Configure the Tivoli EIF LAM for high availability if required. See /document/preview/77155#UUIDbea404d9dd1afee65fa1471105d1b3c6 for details.High Availability Overview
Start and Stop the LAM
Restart the Tivoli EIF LAM to activate any changes you make to the configuration file, utility or LAMbot.
The LAM service name is tivolieiflamd.
See /document/preview/11677#UUID1a2205c3aae40b26fdfe94490043f3c3 for further details.Control Processes
Configure the Tivoli EIF Utility
The Tivoli EIF LAM requires both the LAMbot and the Tivoli EIF utility in order to work. Unlike other LAMs that handle their own mapping in a LAMbot, the Tivoli EIF LAM uses a utility to perform the mapping. The utility allows you to specify multiple mappings for different event types.
The Tivoli EIF utility file is located at $MOOGSOFT_HOME/bin/utils/TivoliEIFUtility.js
Modify the utility file as follows.
1. Create one or more event classes for incoming Tivoli EIF events.
a. srcType: The event source name.
b. srcClass: A regular expression or literal text to match against the event class.
c. attributes: Optional additional attributes to add to the class signature.
The following example creates event classes ITM and ITMRecon:
eventClasses:
[
{ srcType : "ITM", srcClass : /^ITM_.*/ },
{ srcType : "ITM", srcClass : "ITM_ControlSignal" , attributes : [ "control" ] },
{ srcType : "ITM", srcClass : "ITM_Generic" , attributes : [ "msg" ] },
{ srcType : "ITMRecon", srcClass : "ITM_K54_GIAAPP_MONITORING_OIM_RECON_VUE" , attributes : [] }
]
2. Map each event class to the Cisco Crosswork Situation Manager event fields in the eifMapping section of the file. The following example shows mappings for the ITM and ITMRecon event classes.
eifMappings:
{
"ITM":
{
"signature" : [ "hostname" , "situation_name" , "situation_origin" , "situation_displayitem" ],
"source_id" : [ "origin" ],
"external_id" : [ "sub_origin" ],
"source" : [ "hostname" ],
"class" : [ "eventClass" ],
"agent_location" : [ "situation_thrunode" ],
"type" : [ "situation_name" ],
"severity" : [ "severity" ],
"description" : [ "msg" ],
},
"ITMRecon":
{
"signature" : [ "hostname" , "situation_name" , "situation_origin" ],
"source_id" : [ "origin" ],
"external_id" : [ "sub_origin" ],
"source" : [ "hostname" ],
"class" : [ "eventClass" ],
"agent_location" : [ "situation_thrunode" ],
"type" : [ "situation_name" ],
"severity" : [ "severity" ],
"description" : [ "msg" ],
}
}
3. Configure the processing of mapped events in the elfProcessing section of the file. The following example contains processing for the ITM event class. It sets the event description and updates the severity according to the event status.
eifProcessing:
{
// -------------------------------------------
// Processing unique to an ITM event.
// -------------------------------------------
"ITM" : function(event,custom_info,eifValues) {
// Check for a valid source - some ITM events may be missing a hostname.
if ( !eifValues.hostname ) {
eifLogger.debug("ITM: Hostname not found - attempting to use alternatives");
if ( eifValues.cms_hostname ) {
event.set("source",eifValues.cms_hostname);
event.set("description","Unknown Host: " + event.value("description"));
}
else if ( eifValues.situation_thrunode ){
event.set("source",eifValues.situation_thrunode);
event.set("description","Unknown Host: " + event.value("description"));
}
else {
event.set("source","Unknown Host");
event.set("description","Unknown Host: " + event.value("description"));
}
// Update the signature as it will not contain a hostname
event.set("signature",event.value("source") + event.value("signature"));
}
// Normalise the hostname to lowercase.
event.set("source",event.value("source").toLowerCase());
// Description
if ( event.value("description") === this.default_value ) {
event.set("description",eifValues.situation_name ? eifValues.situation_name + " - Unknown condition" : "No msg text");
}
// Do a severity conversion
var convertedSeverity = commonUtils.basicSeverityLookup(event.value("severity"));
event.set("severity",convertedSeverity);
// Determine situation status and modify the severity.
// A : The situation event has been acknowledged.
// D : The situation has been deleted.
// X : The situation is in a problem state.
// F : The acknowledgement has expired and the situation is still true.
// Y : The situation is running and is true.
// N : The situation is running, has been true, and is now false.
// E : he acknowledgement was removed before it had expired and the situation is still true.
// S : The situation is being started.
// P : The situation has been stopped.
var situation_states = {
"A" : { value : "Acknowledged" },
"D" : { value : "Deleted" , severity : 0 },
"X" : { value : "Problem" },
"F" : { value : "Ack Expired" },
"Y" : { value : "True" },
"N" : { value : "False" , severity : 0},
"E" : { value : "Expired and True" },
"S" : { value : "Started" },
"P" : { value : "Stopped" , severity : 0 }
};
if ( situation_states[eifValues.situation_status] ) {
custom_info.eventDetails.situation_state = situation_states[eifValues.situation_status].value;
// Modify severity if needed based on status.
if ( typeof situation_states[eifValues.situation_status].severity !== 'undefined' ) {
event.set("severity",situation_states[eifValues.situation_status].severity);
eifLogger.debug("Modifying severity based on a status of " + eifValues.situation_status);
}
}
},
Tivoli EIF LAM Reference
This is a reference for the Tivoli EIF LAM. The Email LAM configuration file is located at $MOOGSOFT_HOME/config/eif_lam.conf.
The following properties are unique to the Tivoli EIF LAM.
See the LAM and Integration Reference for a full description of all common properties used to configure LAMs.
See IBM Tivoli Netcool/OMNIbus probes and gateways for further information on the range of Tivoli products that generate EIF messages.
This is a reference for the Tivoli EIF LAM. The Tivoli EIF LAM configuration file is located at $MOOGSOFT_HOME/config/eif_lam.conf
It contains the following sections and properties:
mode
Client or Server. If set to Client the LAM attempts to connect to the defined address and port. If set to Server the LAM opens the address and port as a listening socket that can accept inbound connections. When the source makes a TCP connection it spawns a standard TCP socket on which to accept input.
Type: String
Required: Yes
One of: CLIENT, SERVER
Default: "SERVER"
address
IP address or host name of the Tivoli server.
Type: String
Required: Yes
Default: N/A
port
Port of the Tivoli server.
Type: Integer
Required: Yes
Default: 8412
protocol_type
Transmission Control Protocol (TCP) or User Datagram Protocol (UDP). If mode=Client, the LAM uses TCP regardless.
Type: String
Required: Yes
One of: TCP, UDP
Default: "TCP"
WebSphere MQ
Overview
The WMQ LAM is a link access module that communicates with the WebSphere MQ Application Server and takes its input from Java Messaging Services.
This document explains the basic configuration for enabling the Java based Application Server and the configuration of the WMQ LAM config file (wmq_lam.conf).
Process Workflow
The workflow of gathering alarms from the Application Server and publishing it to Cisco Crosswork Situation Manager is as follows:
· WMQ LAM monitors message data being written to a Queue/Topic in the server
· It then parses this message data according to the LAM’s configuration file
· Events are constructed from the monitored message data and then are passed to the MOOMs bus
· The events are then published to the subject “/Events”
Add the Websphere MQ Jars to Cisco Crosswork Situation Manager
The com.ibm.mq.jmqi.jar and com.ibm.mqjms.jar has to be added to Cisco Crosswork Situation Manager to establish a connection with Websphere MQ. Copy the com.ibm.mq.jmqi.jar and com.ibm.mqjms.jar to the $MOOGSOFT_HOME/lib/cots/nonDist directory in Cisco Crosswork Situation Manager.
Note::
The com.ibm.mq.jmqi.jar and com.ibm.mqjms.jar for Linux can be found in the directory /opt/mqm/java/lib
Note::
The com.ibm.mq.jmqi.jar and com.ibm.mqjms.jar for windows can be found in the directory C:\Program Files\IBM\WebSphere MQ\java\lib.
Installing the IBM JDK on the Cisco Crosswork Situation Manager Server
Install the IBM JDK on the Cisco Crosswork Situation Manager Server and set the java class path in the wmq_lam to the installed IBM JDK class path. To set the classpath proceed as follows:
1. Enter the commandcd $MOOGSOFT_HOME/bin/ to navigate to the bin directory of Cisco Crosswork Situation Manager.
2. Open the wmq_lam using any editor e.g. vi or vim
3. Enter the path /opt/ibm/java-x86_64-80/jre/bin/java in the java_vm field of the wmq_lam binary file.
Note::
The path given here should be the path where the IBM JDK is installed.
Configure the WebSphere MQ LAM
The alarms received from the WebSphere MQ server are processed according to the configurations in the wmq_lam.conf file. The processed alarms are published to Cisco Crosswork Situation Manager.
The configuration file contains a JSON object. At the first layer of the object, LAM has a parameter called config, and the object that follows config has all the necessary information to control the LAM.
The following sections are available for configuration in the WMQ LAM configuration file.
Monitor
Monitor section defines the object to be monitored:
monitor:
{
name :"WMQ Lam Monitor",
class :"CWmqMonitor",
manager_name :"QueueManagerName",
host_name :"localhost",
port_number : 1414,
channel_name :"MyRemoteChannel",
destination_name :"TestQueue",
user_name :"username",
password :"password",
#encrypted_password :"ieytOFRUdLpZx53nijEw0rOh07VEr8w9lBxdCc7229o=",
destination_type :"queue",
max_retries : 10,
retry_interval : 60,
message_type :"TextMessage",
response_require :false,
feedback_queue :"TempQueue",
ssl_connection :false,
ssl_truststore_filename :"",
ssl_truststore_password : "",
ssl_truststore_type :"",
ssl_ciphersuite_value :"SSL_RSA_WITH_3DES_EDE_CBC_SHA",
ssl_fipsRequired :false,
ssl_protocol :""
},
The above example specifies:
· name and class: These fields are reserved and should not be changed. The default values are WMQ Lam Monitor and CWmqMonitor respectively
· manager_name: The manager name is the queue manager name created in WebSphere MQ. E.g. QueueManagername
· host_name: The host name of the WebSphere MQ server. E.g. localhost
· port_number: The port number of the queue manager configured in WebSphere MQ. E.g. 1414. The default port is 1414.
Note::
The entry in the field port_number should be an integer, therefore enter the values in this field without quotation marks
· channel_name: The channel name of the queue created in the WebSphere MQ E.g. MyRemoteChannel
· destination_name: The name of the queue or topic created in WebSphere MQ. E.g. TestQueue
· user_name and password: The queue or topic username and password is entered in these fields. If there is no user name and password configured for the queue or topic then leave it blank
· encrypted_password: If queue or topic password is encrypted then enter the encrypted password in this field and comment the password field. At a time either password or the encrypted_password field is used. If both the fields are not commented then the field encrypted_password will be used by the WMQ LAM
· destination type: The type of the message provider that is either a queue or a topic. E.g. queue
· max_retries: The maximum number of retry attempts to reconnect with the WebSphere MQ server in case of a connection failure
Note::
The default value is set to 10, if 0 is entered in this field then the LAM by default takes the value 10 and will try at least 10 times to reconnect
Note::
If all the number of retries are exhausted, then an alarm is sent to Cisco Crosswork Situation Manager about the connection failure. For re-establishing the connection the LAM has to be restarted
· retry_interval: The time interval between two successive retry attempts
Note::
The default value is set to 60 seconds, if 0 is entered in this field then the time interval is by default set to 60 seconds
Note::
The entry in the fields max_retries and retry_interval should be an integer, therefore enter the values in these fields without quotation marks
· message_type: The message type of the messages received from the application can be set here. The following 3 message types are supported:
— TextMessage
— MapMessage
— ObjectMessage
· response_require: If response is to be sent back to queue or topic for received messages, enter true in this field
· feedback_queue: Enter the queue name in which the response feedback is sent to WebSphere MQ
· ssl_connection: To enable an SSL communication with WebSphere MQ enter true in this field
· ssl_truststore_filename: If an SSL connection is enabled then enter the ssl truststore filename along with its path in Cisco Crosswork Situation Manager, E.g. if the ssl keystore is in the directory usr/share/moogsoft/ssl, then enter usr/share/moogsoft/ssl/client.jks
Note::
The client.jks certificate must be copied from the WebSphere MQ Server at a desired location on the Cisco Crosswork Situation Manager system E.g. usr/share/moogsoft/ssl. The client.jks certificate can be found in the WebSphere MQ Server at the location where it was generated in the above steps.
· ssl_truststore_password: If an SSL connection is enabled then enter the ssl truststore password in this field
· ssl_truststore_type: SSL truststore typeof the certificate created at the server end has to be entered here. The following truststore types can be entered here
— JKS,
— JCEKS,
— PKCS12,
— PKCS11
— DKS
· ssl_ciphersuite_value: The SSL cipher specification indicates which data encryption algorithm and key size are used. For SSL V3, the hashing algorithm is included. For example, cipher specification DES SHA (56 bit) uses the DES encryption algorithm, a 56-bit key size and the SHA hashing algorithm. Some of the available ciphersuites are as follows:
— SSL_RSA_WITH_3DES_EDE_CBC_SHA
— SSL_DES_192_EDE3_CBC_WITH_MD5
— SSL_RC4_128_WITH_MD5
— SSL_RC2_CBC_128_CBC_WITH_MD5
— SSL_DES_64_CBC_WITH_MD5
— SSL_RC4_128_EXPORT40_WITH_MD5
— SSL_RC2_CBC_128_CBC_EXPORT40_WITH_MD5
· ssl_fipsRequired: If fips is required then select true otherwise set it to false. The Federal Information Processing Standard (FIPS) Publication 140-2, (FIPSPUB 140-2), is a U.S. government computer security standard used to accredit cryptographic modules
· ssl_protocol: Its value depends on the CipherSuites value and its equivalent SSL Protocol support, Some of the ssl protocols are as follows:
— TLSv1
— TLSv1.1
— TLSv1.2
— SSLv3
Agent and Process Log configuration
The Agent and Process Log sections allow you to configure the following properties:
· name: Identifies events the LAM sends to the Message Bus.
· capture_log: Name and location of the LAM's capture log file.
· configuration_file: Name and location of the LAM's process log configuration file.
Data parsing
Any received data needs to be broken up into tokens. Once user have the tokens, user can start assembling an event. There are a number of parameters that allow user to control how this will work. The first 2 are start and end character. User can have multiple start and end characters. The system generates an event after all the tokens between a start and an end character are assembled.
Parsing:
{
type: "",
start_and_end:
{
start: [],
end: ["\n"],
delimiters:
{
ignoreQuotes: true,
stripQuotes: true,
ignores: "",
delimiter: [",","\r"]
}
}
},
# Parsing block with regular expressions, using delimter
# based tokenising:
#
# parsing:
# {
# type: "regexp",
# regexp:
# {
# pattern : "(?mU)^(.*)$",
# capture_group: 1,
# tokeniser_type: "delimiters",
# delimiters:
# {
# ignoreQuotes: true,
# stripQuotes: false,
# ignores: "",
# delimiter: ["\r"]
# }
# }
# },
#
The above example specifies the following 3 types of parsing:
· JSON parsing: To enable this parsing the type is set to blank
· Text Messgae: To enable this parsing the type is set to Start_and_End
· Regular Expression: To enable this the type is set to regexp
In the above example only one parsing method is used at a time. Either regexp or Text Message/JSON.
JSON Parsing
Any received data needs to be broken up into tokens. Once the tokens are received, the assembling of an event starts. There are a number of parameters that allow the user to control how this will work. The first 2 are a start and end character. The square brackets [] are the JSON notation for a list. You can have multiple start and end characters. The system considers an event as all of the tokens between any start and end character.
The above example specifies:
· There is nothing defined in start; however, a carriage return (new line) is defined as the end character
In the example above, the LAM is expecting a whole line to be written followed by a return, and it will process the whole line as one event.
If set up carefully, user can accept multi-line events.
Text Message Parsing
The Type should be set start_and_end and as shown in the below example.
type: start_and_end:
{
start: [WMQ_MSG],
end: ["\n"],
The parsing in above example the parsing will start when it gets WMQ_MSG and end when it gets new line.
Regular Expression Parsing
In regular expression the parser searches for strings as per the expression defined in pattern. The extracted string is then delimited as per the defined delimiters. In the above example the parser searches for the expression "(?mU)^(.*)$".
Delimiters
Delimiters define how a line is split into tokens – “tokenising”. For example, if you have a line of text data, it needs to be split up into a sequence of sub strings that are referenced by position from the start. So if you were processing a comma-separated file, where a comma separates each value, it would make sense to have the delimiter defined as a comma. Then the system would take all the text between start and end and break it up into tokens between the commas. The tokens could then be referenced by position number in the string starting from one, not zero.
For example if the input string was “the,cat,sat,on,the,mat” and comma was used as a separator, token 1 would be “the”, token 2 “cat” and so on.
Be aware, there are complications when you come to tokenisation and parsing. For example, if you say comma is the delimiter, and the token contains a comma, you will end up with that token containing a comma to be split into 2 tokens. To avoid this it is recommended that you quote strings. You must then allow the system to know whether it should strip or ignore quotes, hence the stripQuotes and ignoreQuotes parameters.
ignoreQuotes: true,
stripQuotes: false,
ignores: "",
delimiter: [",","\r"]
The above example specifies:
· If you have strings that are quoted between delimiters, ignoreQuotes set to true will look for delimiters inside the quote. For example, <delimiter>”hello “inside quote” goodbye”<delimiter> gives a token [hello inside quote goodbye].
· Setting stripQuotes to true removes start and end quotes from tokens. For example, “hello world” gives a token [hello world].
· ignores is a list of characters to ignore. Ignored characters are never included in tokens.
· Delimiter is the list of valid delimiters used to split strings into tokens.
Variables
For each event in the file, there is a positioned collection of tokens. Cisco Crosswork Situation Managerenables a user to name these positions. Naming of the positions helps the user to identify the tokens.In the below given example token at position number 6 is a Manager name, so the user names the token as "Manager".
This section is used for text message.
variables:
[
#
# Note that positions start at 1, and go up
# rather than array index style counting from zero
#
{ name: "signature", position: 1 },
{ name: "source_id", position: 4 },
{ name: "external_id", position: 3 },
{ name: "Manager", position: 6 },
{ name: "AlertGroup", position: 7 },
{ name: "Class", position: 8 },
{ name: "Agent", position: 9 },
{ name: "severity", position: 5 },
{ name: "description", position: 10 },
{ name: "agent_time", position: 1 }
],
The above example specifies:
Token at position 1 is assigned to signature; Token at position 4 is assigned to source_id and so on. Token positions starts from 1, and go up.
Note::
The variable section is used when the message type is TextMessage
The variable section is only used for text message. For JSON, MapMessage and ObjectMessage the mapping section is used. In mapping there is a value called rules, which is a list of assignments.
mapping :
{
#
# All unused variables live as a JSON object
# referenced by this variable (if defined)
#
builtInMapper: "CJsonDecoder",
# Input is restricted to Json so the builtInMapper option is not
# used for this LAM
#
catchAll: "overflow",
rules:
[
{ name: "signature", rule: "$signature" },
{ name: "source_id", rule: "$source_id" },
{ name: "external_id", rule: "$external_id" },
{ name: "manager", rule: "WMQ" },
{ name: "source", rule: "$source" },
{ name: "class", rule: "$class" },
{ name: "agent", rule: "$LamInstanceName" },
{ name: "agent_location", rule: "$agent_location" },
{ name: "type", rule: "$type" },
{ name: "severity", rule: "$severity", conversion: "sevConverter" },
{ name: "description", rule: "$description" },
{ name: "agent_time", rule: "$agent_time", conversion: "stringToInt" }
]
},
filter:
{
presend: "WmqLam.js"
}
}
}
In the example above mapping assignments are shown, the first assignment name: "signature”, rule:"$signature” (“$signature is a string with $ syntax) means for signature field take the tokens called signature. User defines a number of these rules covering the base attributes of an event. For reference, the system expects a minimum set of attributes in an event that are shown in the above example. For JSON, MapMessage and ObjectMessage, enable the builtInMapper: "CJsonDecoder" by uncommenting it. The variable section is ignored if builtInMapper is uncommented. For TextMessage builtInMapper option should be commented.
Note::
The above mapping is a generic mapping given for example. The user has to configure the mapping according to fields of the received alarm/event
Constants and conversions
There are rules in mapping section for which conversions are to be defined. The conversions convert the received input from one format to another. E.g. in the above example of mapping, for the mapped field severity, an integer is received which is converted to text and displayed on the Cisco Crosswork Situation Manager UI. The lookup for conversions is kept in the constants section. The available conversions are kept in the conversions section and called during mapping. The example of calling a conversion is as follows:
{ name: "severity", rule: "$severity", conversion: "sevConverter" }
The example of constants and conversions sections are as follows:
constants:
{
severity:
{
"CLEAR" : 0,
"INDETERMINATE" : 1,
"WARNING" : 2,
"MINOR" : 3,
"MAJOR" : 4,
"CRITICAL" : 5
}
},
conversions:
{
sevConverter:
{
lookup: "severity",
input: "STRING",
output: "INTEGER"
},
stringToInt:
{
input: "STRING",
output: "INTEGER"
},
timeConverter:
{
timeFormat: "%D %T",
input: "STRING",
output: "INTEGER"
}
},
The above example specifies:
· Severity and sevConverter: Has a conversion defined as sevConverter in the Conversions section, this looks up the value of severity defined in the severity section of constants and returns back the mapped integer corresponding to the severity
· stringToInt: Is used in a conversion, which forces the system to turn a string token into an integer value
· timeConverter: Is used in conversion which forces the system to convert to time. If time is epoc time, then timeFormat mentioned in timeConverter should be commented. Otherwise, user should provide the timeFormat i.e. (%D %T) and it should be uncommented
JSON Events
The WMQ LAM has the ability to consume JSON events. JSON is a sequence of attribute/value, and the attribute is used as a name. Under mapping, user must define the following attribute builtInMapper: "CJsonDecoder". It automatically populates all of the values contained in the JSON object, prior to the rules being run.
For example, if the JSON object to be parsed was:
{"signature": "11898.9","source_id": "Server1", "severity": "MINOR"……so on}
The attributes available to the rules in the mapping section would be $signature=”11898.9”, $Severity=” Minor” and so on. Similarly, user can map ObjectMessage and MapMessage.
For TextMessage user should use variable section.
Below are few samples of TextMessage, MapMessage and ObjectMessage.
TextMessage
WMQ_MSG:3600de30-92f8-71e2-0408-97bfd0490000||1||26||13639605v53||1364210285||1363960556||NEO||delta-server-loggingAdaptor||default.log||2013-03-25 11:17:19.560 ERROR [Response--6 - BlockingEntitlementsCheckHandle] Unauthorised access detected, throwing UnauthorisedAccessException||xstm3022xpap.stm.swissbank.com||NEO-PROD
MapMessage
hostname=10.112.70.125
port=8080
destination-jndi=wmq/topic/test
username=administrator
password=India@123
signature=8.9
source_id=server1
external_id=123.1345
manager=WMQ
source=server1
class=server
agent=test
agent_location=test
type=test
severity=MAJOR
description=Test server1
agent_time=07/24/12 18:06:01
ObjectMessage
hostname=10.112.70.123
port=8080
connection-factory-jndi=wmq/RemoteConnectionFactory
destination-jndi=wmq/queue/test
#connection-factory-jndi=ConnectionFactory
#destination-jndi=dynamicQueues/final
username=administrator
password=India@123
server-name=Jboss
# Properties related to Websphere mq
message-type=object
# Properties related to object message
signature=1234.8.9
source_id=server2
external_id=hmoscsysd2
manager=WMQ
source=server2
class=test
agent=test
agent_location=test
type=server
severity=MAJOR
description=test server2
agent_time=07/24/12 18:06:01
catchAll
The attribute that is never referenced in a rule is collected and placed as a JSON object in a variable called overflow defined here and passed as part of the event.
catchAll: "overflow",
rules:
[
{ name: "signature", rule: "$signature" },
{ name: "source_id", rule: "$source_id" },
{ name: "external_id", rule: "$external_id" },
{ name: "manager", rule: "WMQ" },
{ name: "source", rule: "$source" },
{ name: "class", rule: "$class" },
{ name: "agent", rule: "$LamInstanceName" },
{ name: "agent_location", rule: "$agent_location" },
{ name: "type", rule: "$type" },
{ name: "severity", rule: "$severity", conversion: "sevConverter" },
{ name: "description", rule: "$description" },
{ name: "agent_time", rule: "$agent_time", conversion: "stringToInt" }
]
The above example specifies the mapping of tokens and the variable overflow for catchAll.
The attribute test1 and test2 is not mapped with a field in the wmq_lam.conf file, it is placed in the overflow JSON object. The fields that are placed in the overflow variable can be viewed in the WMQ LAM log file.
Example of a message sent through a WebSphere MQ queue.
Message
[{"signature":"0.1.8","source_id":"xvsdfgdg","external_id":"dduncan9","manager":"Sonsitng","source":"Indonesian","class":180,"agent_location":"Liangwa","type":"Violet","severity":"WARNING","description":"Yuan
Renminbi","agent_time":"07/27/12 19:06:01","test1":"1","test":"2"}]
Example of an overflow JSON object containing the unmapped test1 and test2 tokens, created in the WMQ LAM log file:
NFO: [EventFa][20161027 17:04:38.701 +0530] [CMooMsg.java]:1099 +|Encoded size
[376]
json[{"_MOOTADATA_":{"creation_time":1477568078591},"agent":"WMQLAM","agent_location":"Liangwa","agent_time":0,"class":180,"description":"Yuan
Renminbi","external_id":"dduncan9","manager":"Sonsitng","overflow":"{\"test\":\"2\",\"test1\":\"1\"}","severity":2,"signature":"0.1
Configure WebSphere MQ
Websphere MQ Configuration
This section covers the integration steps to provide an alarm integration from Websphere MQ to Cisco Crosswork Situation Manager. The integration has following steps:
· Adding the jars com.ibm.mq.jmqi.jar and com.ibm.mqjms.jar to Cisco Crosswork Situation Manager.
· Installing the IBM JDK on the Cisco Crosswork Situation Manager server.
· Creating a queue or Topic in WebSphere MQ.
After completing the above 3 steps the wmq_config file in Cisco Crosswork Situation Manager is configured to receive events from Websphere MQ.
Add the Websphere MQ Jars to Cisco Crosswork Situation Manager
The com.ibm.mq.jmqi.jar and com.ibm.mqjms.jar has to be added to Cisco Crosswork Situation Manager to establish a connection with Websphere MQ. Copy the com.ibm.mq.jmqi.jar and com.ibm.mqjms.jar to the $MOOGSOFT_HOME/lib/cots/nonDist directory in Cisco Crosswork Situation Manager.
Note::
The com.ibm.mq.jmqi.jar and com.ibm.mqjms.jar for Linux can be found in the directory /opt/mqm/java/lib
Note::
The com.ibm.mq.jmqi.jar and com.ibm.mqjms.jar for windows can be found in the directory C:\Program Files\IBM\WebSphere MQ\java\lib.
Install the IBM JDK on the Cisco Crosswork Situation Manager Server
Install the IBM JDK on the Cisco Crosswork Situation Manager Server and set the java class path in the wmq_lam to the installed IBM JDK class path. To set the classpath proceed as follows:
1. Enter the command cd $MOOGSOFT_HOME/bin/ to navigate to the bin directory of Cisco Crosswork Situation Manager.
2. Open the wmq_lam using any editor e.g. vi or vim.
3. Enter the path /opt/ibm/java-x86_64-80/jre/bin/java in the java_vm field of the wmq_lam binary file.
Note::
The path given here should be the path where the IBM JDK is installed.
Create a queue and Topic in WebSphere MQ on Linux
1. Add a user E.g. user2 to the group mqm by executing the following command:
useradd -G mqm user2
2. Create a queue manager E.g. qm1 by executing the following command:
./crtmqm qm1
3. Check the status of all the queue managers by executing the following command:
./dspmq
4. Start the queue manager E.g. qm1 by executing the following command:
./strmqm qm1
5. Create a server connection channel in the created queue manager qm1 by executing the following command.
./runmqsc qm1
DEFINE CHANNEL('CHAN2') CHLTYPE(SVRCONN) TRPTYPE(TCP) +
DESCR('Server-connection to Client_1')
6. Disable the channel authentication for a non SSL connection execute the following command:
./runmqsc qm1
ALTER QMGR CHLAUTH(DISABLED)
7. Create a client connection channel in the created queue manager qm1 by executing the following commad:
DEFINE CHANNEL('CHAN2') CHLTYPE(CLNTCONN) TRPTYPE(TCP) +
CONNAME(9.20.4.26) QMNAME(QM1) DESCR('Client-connection to Server_1')
8. Create a queue E.g. queue1 in the queue manager qm1 by executing the following command:
./runmqsc qm1
DEFINE QLOCAL('queue1')
9. Create a topic E.g. topic11 in the queue manager qm1 by executing the following command:
./runmqsc qm1
DEFINE TOPIC(‘topic1’)
10. Execute the command 'end' to exit the CLI.
Create a queue and Topic in WebSphere MQ on Windows
WebSphere MQ is an IBM standard for program-to-program messaging across multiple platforms. It sends messages across networks of diverse components. The application connects to WebSphere MQ to send or receive a message. Configuring WebSphere MQ to function with LAM has the following steps:
Note::
The following steps are only for Windows
1. Creating a queue manager.
2. Creating a queue in WebSphere MQ.
3. Creating a topic in Websphere MQ.
4. Creating a server connection channel.
5. Creating a client connection channel.
Create a Queue Manager
A queue manager manages the resources associated with it, in particular the queues and topics that it owns. To add a queue manager in Websphere MQ, proceed as follows:
Note::
The following steps are for WebSphere MQ installed on a windows system.
1. Click on the Windows Start button and navigate to All Programs > IBM WebSphere MQ, then click on WebSphere MQ Explorer (Installation1). The WebSphere MQ Explorer (Installation1) application opens.
2. Right click on Queue Managers, then navigate to New in the context menu and select Queue Manager.
3. Go to the Create Queue Manager dialog box, Enter basic values view, and enter the name of the queue manager in the field Queue manager name and click Next. E.g. Queue_Manager1
4. In the Enter data and log values view of the Create Queue Manager dialog box, click Next.
5. In the Enter configuration options view of the Create Queue Manager dialog box, select the check box Create server-connection channel and click Next.
6. In the Enter listener options view of the Create Queue Manager dialog box, enter the port required for listening in the Listen on port no. and click Next. The port which is not used anywhere can only be entered here. By default the port no. 1414 is assigned here and if it is used by any other queue manager, then enter any other port. E.g. 1417.
7. In the Enter MQ Explorer options of the Create Queue Manager dialog box, click on Finish.
The queue manager is created.
Create a Queue in WebSphereMQ
1. Expand the queue manager created in the above procedure and select Queues.
2. Right click on Queues, then navigate to New in the context menu and select Local Queue.
3. Enter the queue name in the Name field of the New Local queue dialog box E.g. Queue1 and click on Finish.
The queue is created.
Create a Topic in WebSphereMQ
1. Expand the queue manager created in the above procedure and select Topics.
2. Right click on Topics, then navigate to New in the context menu and select Topic.
3. Enter the topic name in the Name field of the New Topic dialog box E.g. Topic1 and click on Next.
4. Enter the topic string in the Topic String field of the Change Properties view of the New Topic dialog box E.g. Topic1, then click on Finish.
The topic is created.
Create a Server Connection Channel
1. Expand the queue manager created in the above procedure and select Channels.
2. Right click on Channels, then navigate to New in the context menu and select Server-connection Channel.
3. Enter the channel name in the Name field of the New Server-connection Channel dialog box E.g. Serverchannel1
4. Click on Select, then select SYSTEM.ADMIN.SVRCONN in the Select the Like Object dialog box and click on OK.
5. Click on Next. TheChange properties view of the New Server-connection Channel dialog box opens.
6. Select MCA in the Change properties view of the New Server-connection Channel dialog box.
7. Enter the user id for the connection in the MCA User ID field and click on Finish.
The server connection channel is created.
Create a Client Connection Channel
1. Expand Channels of queue manager created in the above procedure and select Client Connections.
2. Right click on Client Connections, then navigate to New in the context menu and select Client-connection Channel.
3. Enter the client connection channel name in the Name field of the New Client-connection Channel and click Next. E.g.Serverchannel1
Note::
The client connection channel name should be the same as the server connection channel name
1. Enter the queue manger name in the Queue Manager name field E.g. QueueManger1, then enter localhost in the Connection name field of the Change Properties view and click Finish.
The client connection channel is created.
JDBC
Java Database Connectivity (JDBC) is an application programming interface (API) for the programming language Java. It defines a database access mechanism for a client. It's a Java based data access technology and is used for Java database connectivity. It is a part of Java Standard Edition platform from the Oracle Corporation. It provides methods to query and update data in a database, and is oriented towards relational databases. The JDBC Integration (LAM) connects with a JDBC enabled database and fetches events from it.
1. The JDBC LAM reads the configuration from the jdbc_lam.conf file.
2. It connects with the specified database provided all the required connection parameters are listed and valid.
3. It retrieves records from the specified table as per defined filters.
4. The records are converted to JSON and then passed to Lambot.
5. The Lambot converts the records to Cisco Crosswork Situation Manager events and passes them to the message bus.
6. The last value of indicator field is persisted in a state file.
Configuration
The records received from JDBC are processed according to the configurations in the jdbc_lam.conffile. The processed records are published to Cisco Crosswork Situation Manager.
The configuration file contains a JSON object. At the first layer of object, LAM has a parameter called config, and the object that follows config has all the necessary information to control the LAM.
Monitor
The JDBC LAM accesses the records from a JDBC enabled database. You can configure the parameters here to establish a connection with the JDBC:
General
| Field |
Type |
Description |
| name and class |
String |
Reserved fields: do not change. Default values are JDBC Lam Monitor and CJdbcMonitor. |
| target |
JSON Object |
A top-level container for which you can define one or more target JDBC sources. You can specify the configuration for each target. If you don't specify a request_interval the target uses the globally defined interval. |
| type |
String |
The type of the database used. This is a mandatory field. It can be either MySQL, SQL Server, DB2, oracle or postgreSQL. If type is omitted, you must specify the URL, jar files and JDBC class name. To use an external database other than those in the supported list, omit the type from the connection properties. |
| host |
String |
The host name or the IP address of the Machine where the database server is running. The default host is localhost. |
| port |
Integer |
The port on which the database service is running. Default port values are: MySQL - 3306 SQL Server - 1433 DB2 - 50000 Oracle - 1521 PostgreSQL - 5432 |
| database |
String |
Name of the database where the lam will connect. This is a mandatory field. |
| user and Password |
String |
Enter the username and password of the database server. If username and password is mentioned in the URL, then you don't have to specify it here. If a username and password is specified at both the places, then their values will get overwritten. |
| encrypted_password |
String |
If the encrypted password is to be used, then enter the encrypted password in this field and comment the password field. At a time, either the password or the encrypted_password field is used. If both the fields are not commented, then the field encrypted_password will be used by the JDBC LAM. |
| properties |
String |
A mapping of key-value pairs of properties to specify the connection properties. key1: 'val1', key2: 'val2' To enable SSL for MySQL: useSSL : "true", trustCertificateKeyStoreUrl : "file:///keystorefilename", trustCertificateKeyStorePassword : "password" |
| alias |
String |
It can be any user defined name the LAM would use to identify the connection. This name has to be unique. |
| jar_files |
String |
It is a list of file locations which indicates the JDBC driver jar file location. Default values are: SQL Server - sqljdbc4.jar DB2 - db2jcc4.jar Oracle - ojdbc6.jar PostgreSql - postgresql-9.3-1102.jdbc41.jar For example: "/export/jdbcDrivers/postgresql-9.3-1102.jdbc41.jar" |
| class_name |
String |
The name of the JDBC driver class. Default values are: SQL Server - com.microsoft.sqlserver.jdbc.SQLServerDriver MySQL - com.mysql.jdbc.Driver DB2 - com.ibm.db2.jcc.DB2Driver Oracle - oracle.jdbc.OracleDriver PostgreSql - org.postgresql.Driver |
| url |
String |
It's a fully constructed database connection url. If url contains username and password, then you don't have to mention username and password attributes. If url is not there in the config file, then you can mention type, host, port, and database information. Using this data, the LAM will construct the database connection url. For example: jdbc: "mysql://localhost:1321/customers" type : "mysql", host : "localhost", port : "1321", database : "customers", |
| Connection_order |
String |
The connection order is mandatory when there is more than one database. Lam will pick alias names mentioned in the connection order one by one. First it will configure them and then on failover, it will iterate the configured connection order to establish a new connection. If no alias is present under databases mentioned in the connection order, the Lam will fail. |
| table_name |
String |
Enter the table name from the database from where you want to fetch the data. |
| indicator_column |
Integer |
A unique identifier for each polling cycle. It should be of numeric type, else you have to specify the raw SQL. This forms the basis on which the updated events are fetched. The LAM will use the column mentioned here in a where clause along with the ">" operator. Note The Jdbc_lam will look for the value of indicator_column in the jdbc_lam.state file. If it finds any value in the .state file, then it will start polling the data from that point. If it fails to find any value in the ‘.state’ file, then it will first fetch the max value of indicator_column from the table using the SQL Query: Select max(indicator_column) as indicator from tablename where filterclause; and then from the second poll , it will start fetching the data. If you want the lam to start polling the data from a particular point, then you can create/modify .state file manually. See the.state filefor your reference. Download this state file and paste it in the config folder, and then you can enter the pointer value as per your preference. Note The state file is generated in the same folder where the config file is present e.g. $MOOGSOFT_HOME/config. The LAM generates the name of the state file as <proc_name>.state. Here the default proc_name (process name) is jdbc_lam, therefore, the state file name is jdbc_lam.state. proc_name is defined in the jdbc_lam.sh file located at $MOOGSOFT_HOME/bin. For example: where event_id > 0 indicator_column: "from_unixtime(myTimestampColumn)" indicator_column : "convert(datetime, event_id)", indicator_column : "event_id", |
| filter_clause |
String |
This will enable the LAM to fetch more filtered data. For example: type like 'event' and error_type = 'syserror' The filter clause will be wrapped in closing parenthesis and appended as an AND with the indicator_column clause. filter_clause : "something > 2" will be appneded to the core query as: AND ( "something" > 2 ) |
| flood_control |
Integer |
JDBC provides a paging mechanism to return the result set in pages. This allows the large return data sets to be returned in manageable pages. Flood_control determines the size of the pages,especially, the number of events the lam will process simultaneously. page_size: This indicates the total number of records that are displayed on the current page. The default page size is 100. If the specified value is less than 100, then it will switch to default. interval: This is the time interval, in milliseconds, between requests. The default value is 100. If the specified value is less than 1, then it will switch to default. For example: If the poll found 1000 rows, and the page_size was 100, and the interval is also set to 100, thenthe result set would be paged into 10 pages (1000/100) with an inter-page interval of 100ms i.e. the entire result set of 1000 events would be passed through the lam in 1s (10 x 100ms). |
| polling_interval |
Integer |
The polling time interval, in seconds, between the requests after which the event data is fetched from JDBC LAM. Default = 10 seconds. If 0 is entered, the time interval is set to 10 seconds. |
| max_retries |
Integer |
The maximum number of retry attempts to reconnect with JDBC in case of a connection failure. Default = -1, if no value is specified, then there will be infinite retry attempts. If the specified value is less than 1, then it will switch to default i.e. -1. If the specified value is greater than 1, then the LAM will try that many times to reconnect. |
| retry_interval |
Integer |
The time interval between two successive retry attempts. Default = 60 seconds, if 0 is entered, the time interval is set to 60 seconds. |
| request_interval |
Integer |
Length of time to wait between requests, in seconds. Can be overridden by request_interval in individual targets. Defaults to 60. |
Note::
The entry in the fields polling_interval , max_retries and retry_interval should be an integer, therefore enter the values in these fields without quotation marks.
Example
You can configure the JDBC LAM to retrieve events from one or more sources. The following example demonstrates a configuration that targets one JDBC source (target1). If you have more than one source, add a target section for each one and uncomment properties to enable them.
monitor:
{
name : "JDBC Lam Monitor",
class : "CJdbcMonitor",
request_interval : 60,
max_retries : -1,
retry_interval : 60,
targets:
{
target1:
{
databases:
{
"alias":
{
type : "mysql",
host : "localhost",
database : "testdb",
port : "3306",
user : "user_jdbc",
#password : "password",
encrypted_password : "X868Dl3TSJOlMC9GrdbchTygJtisAURGzhjWZKW53EA=",
properties :
{
#key1: "val1",
#key2: "val2"
}
}
"alias1":
{
jar_files : [ "/export/jdbcDrivers/postgresql-9.3-1102.jdbc41.jar" ],
class_name : "org.postgresql.Driver",
url : "jdbc:mysql://localhost:3306/testdb",
properties :
{
user: "user_jdbc2",
password: "password"
}
}
}
connection_order : [ "alias", "alias1" ],
table_name : "tablename",
indicator_column : "event_id",
filter_clause : "",
flood_control :
{
page_size: 100,
interval: 100,
}
request_interval : 60,
max_retries : -1,
retry_interval : 60
}
}
Database specific information
Microsoft SQL Server
Example declarations:
testdb: {
type: "sqlServer",
host: "localhost",
port: "1433",
database: "moog",
user: "sa",
password: "password"
}
or:
testdb: {
jar_files: ["/usr/share/moogsoft/lib/cots/sqljdbc4.jar"],
class_name: "com.microsoft.sqlserver.jdbc.SQLServerDriver",
url: "jdbc:sqlserver://localhost:1433;databaseName=moog",
properties: { user: "sa", password: "password" }
}
MySQL
Example declarations:
testdb: {
type: "mySql",
host: "localhost",
port: "3306",
database: "moog",
user: "root",
password: "m00gsoft"
}
or:
testdb: {
jar_files: ["/usr/share/moogsoft/lib/cots/mysql-connector-java-5.1.37-bin.jar"],
class_name: "com.mysql.jdbc.Driver",
url: "jdbc:mysql://localhost:3306/moog",
properties: { user: "root", password: "m00gsoft" ,useSSL }
}
IBM DB2
Example declarations:
testdb: {
type: "db2",
host: "localhost",
port: "50000",
database: "moog",
user: "db2admin",
password: "m00gsoft"
}
or:
testdb: {
jar_files: ["/usr/share/moogsoft/lib/cots/db2jcc4.jar"],
class_name: "com.ibm.db2.jcc.DB2Driver",
url: "jdbc:db2://localhost:50000/moog",
properties: { user: "db2admin", password: "m00gsoft" }
}
Oracle
Example declarations:
testdb: {
type: "oracle",
host: "localhost",
port: "1521",
database: "moog",
user: "System",
password: "2pass"
}
or:
testdb: {
jar_files: ["/usr/share/moogsoft/lib/cots/ojdbc6.jar"],
class_name: "oracle.jdbc.OracleDriver",
url: "jdbc:oracle:thin:System/m00gsoft@localhost:1521:moog"
}
PostgreSql
Example declarations:
testdb: {
type: "postgresql",
host: "localhost",
port: "5432",
database: "moog",
user: "anotherUser",
password: "password"
}
or:
testdb: {
jar_files: ["/usr/share/moogsoft/lib/cots/postgresql-9.3-1102.jdbc41.jar"],
class_name: "org.postgresql.Driver",
url: "jdbc:postgresql://localhost:5432/moog",
properties: { user: "anotherUser", password: "password" }
}
Secure Sockets Layer
| To enable SSL for any database, you have to specify the SSL properties for that particular database in the properties section of the config file. |
| Example properties for MySQL: useSSL : "true", trustCertificateKeyStoreUrl : " file:///keystorefilename ", trustCertificateKeyStorePassword : "password" |
| Example properties for MS SQL Server: encrypt:"true", trustServerCertificate:"false", trustStore: "truststorefilename", trustStorePassword: "password" |
Agent and Process Log
The Agent and Process Log sections allow you to configure the following properties:
· name: Identifies events the LAM sends to the Message Bus.
· capture_log: Name and location of the LAM's capture log file.
· configuration_file: Name and location of the LAM's process log configuration file.
Mapping
Variable section is not required in the JDBC LAM, you can directly map events field of JDBC with Cisco Crosswork Situation Manager fields displayed in the Cisco Crosswork Situation Manager.
mapping :
{
catchAll: "overflow",
rules:
[
{ name: "signature", rule: "$signature" },
{ name: "source_id", rule: "$source_id" },
{ name: "external_id", rule: "$external_id" },
{ name: "manager", rule: "$manager" },
{ name: "source", rule: "$source" },
{ name: "class", rule: "$class" },
{ name: "agent", rule: "$LamInstanceName" },
{ name: "agent_location", rule: "$agent_location" },
{ name: "type", rule: "$type" },
{ name: "severity", rule: "$severity", conversion: "stringToInt" },
{ name: "description", rule: "$description" },
{ name: "agent_time", rule: "$moog_now" }
]
},
filter:
{
#stream: "myStream",
presend:"JdbcLam.js"
}
}
The above example specifies the mapping of the JDBC alarm fields with the Cisco Crosswork Situation Manager fields. Data not mapped to Cisco Crosswork Situation Manager Fields goes into "Custom Info".
Note::
The signature field is used by the LAM to identify correlated alarms.
Constants and Conversions
Constants and Conversions allows you to convert format of the received data.
| Field |
Description |
Example |
| Severity and sevConverter |
has a conversion defined as sevConverter in the Conversions section, this looks up the value of severity defined in the severity section of constants and returns back the mapped integer corresponding to the severity. |
severity: "clear" : 0, moog_lookup_default : 1 }, sevConverter: |
| stringToInt |
used in a conversion, which forces the system to turn a string token into an integer value. |
stringToInt: |
| timeConverter |
used in conversion which forces the system to convert time. If epoch time is to be used, then timeFormat mentioned in timeConverter should be commented. Otherwise, the user should provide the timeFormat. |
timeConverter: |
Example
Example Constants and Conversions
constants:
{
severity:
{
"clear" : 0,
"info" : 1,
"warning" : 2,
"minor" : 3,
"major" : 4,
"critical" : 5,
moog_lookup_default : 1
}
},
conversions:
{
sevConverter:
{
lookup: "severity",
input: "STRING",
output: "INTEGER"
},
stringToInt:
{
input: "STRING",
output: "INTEGER"
},
timeConverter:
{
timeFormat: "yyyy-MM-dd'T'HH:mm:ss.SSS",
input: "STRING",
output: "INTEGER"
}
},
Service Operation Reference
| Process Name |
Service Name |
| jdbc_lam |
jdbclamd |
Start the LAM Service:
service jdbclamd start
Stop the LAM Service:
service jdbclamd stop
Check the LAM Service status:
service jdbclamd status
If the LAM fails to connect to one or more JDBC sources, Cisco Crosswork Situation Manager creates an alert and writes the details to the process log.
Command Line Reference
To see the available optional attributes of the jdbc_lam, run the following command:
jdbc_lam --help
The jdbc_lam is a command line executable, and has the following optional attributes:
| Option |
Description |
| --config |
Points to a pathname to find the configuration file for the LAM. This is where the entire configuration for the LAM is specified. |
| --help |
Displays all the command line options. |
| --version |
Displays the component’s version number. |
| --loglevel |
Specifies the level of debugging. By default, user gets everything. In common with all executables in Cisco Crosswork Situation Manager, having it set at that level can result in a lot of output (many messages per event message processed). In all production implementations, it is recommended that log level is set to WARN. This ensures only warning, error and fatal messages are recorded. |
JIRA
Cisco Crosswork Situation Manager supports bidirectional integration with JIRA products. Follow the links below for more information about configuring the integrations and their bidirectional functionality:
· JIRA Software: If you are using JIRA, you can set up an integration to synchronise your Situations with JIRA tickets.
· JIRA Service Desk: If you are using JIRA Service Desk, you can set up an integration to synchronise your Cisco Crosswork Situation Manager Situations with JIRA Service Desk tickets.
JIRA Service Desk
To integrate with Atlassian JIRA Service Desk, enter your Service Desk information in the form below.
After you complete the integration you can create and update a Service Desk issue from an open Cisco Crosswork Situation Manager Situation. You can enable auto-assign so new Service Desk issues created from Cisco Crosswork Situation Manager are automatically assigned to the logged in user. See JIRA Service Desk Integration Workflow for more information.
See the JIRA Service Desk documentation for information on JIRA components.
Before You Begin
The JIRA Service Desk integration has been validated with JIRA Service Desk v7.6. Before you start to set up your JIRA Service Desk integration, ensure you have met the following requirements:
· You have the URL for your Service Desk installation. The JIRA Service Desk integration only supports on-premises deployments of JIRA Service Desk.
· You have created user credentials for the integration to use to authenticate to Service Desk. The user requires access to the project where the system opens issues.
· You have the username (typically the email address) and password of the JIRA Service Desk integration user. If you are using JIRA with Atlassian Cloud, their password needs to be an API token. For instructions on how to create an API token, see the Atlassian Cloud documentation.
· The project type is 'IT Service Desk'.
· If you want to enable auto-assign, you have created user accounts with the same names in both Cisco Crosswork Situation Manager and JIRA Service Desk.
Configure the JIRA Service Desk Integration
Configure the JIRA Service Desk integration in Cisco Crosswork Situation Manager as follows:
1. Navigate to the Integrations tab.
2. Click JIRA Service Desk in the Ticketing section.
3. Follow the instructions to create an integration name and enter the other details relating to your JIRA Service Desk instance.
JIRA Service Desk Configuration
Log in to JIRA to create the webhook to send event data. For more help, see the JIRA documentation.
1. Open the JIRA site administration console and create a webhook.
2. Add a name, set the status to 'Enabled' and enter the URL for this integration:
| Field |
Value |
| Name |
Cisco Crosswork Situation Manager Webhook |
| Status |
Enabled |
| URL |
<url of your integration webhook> For example: https://<localhost>/graze/v1/integrations/jira |
3. Select only 'updated' issues and 'created' comments as your webhook events.
After you complete the JIRA Service Desk integration, you can right-click a Situation and select Open JIRA Service Desk Issue from the contextual menu. Cisco Crosswork Situation Manager maintains a link to the JIRA issue and updates it with your comments and status changes.
This integration prefixes JIRA tickets with 'Cisco Crosswork Situation Managers Situation [number]'. Do not remove this prefix as it is needed to synchronize comments, status changes and descriptions.
You may have to wait up to a minute (60 seconds) for the bi-directional endpoint to configure itself.
JIRA Service Desk Integration Workflow
The bidirectional JIRA Service Desk integration keeps critical information synchronized between Cisco Crosswork Situation Manager and JIRA Service Desk.
If enabled, this integration allows you to:
· Create a JIRA Service Desk issue from an open Situation in Cisco Crosswork Situation Manager.
· Add comments in a Situation Room for them to appear on the linked JIRA Service Desk issue and vice versa.
· Change the status of a Situation to change the status of the linked JIRA Service Desk issue and vice versa.
Note::
It is not possible to create a Situation from a JIRA Service Desk issue.
Create a Service Desk Issue from a Situation
You can create a Service Desk issue from a Situation in Cisco Crosswork Situation Manager as follows:
1. Log in to Cisco Crosswork Situation Manager.
2. Open a Situation view such as Open Situations or My Situations.
3. Right-click on the Situation you want to create a Service Desk issue from.
4. Click Tools and Open JIRA Service Desk Ticket in the drop-down menu.
5. Click OK on the response status pop-up window to continue.
After completing these steps, a new issue appears in JIRA Service Desk. By default new issues created from Situations are given the summary 'New issue has been opened for Cisco Crosswork Situation Manager Situation [<sig_id>]' and the description 'Created from Cisco Crosswork Situation Manager Situation <sig_id>' above the Cisco Crosswork Situation Manager Situation description. This contains a hyperlink back to the Situation in Cisco Crosswork Situation Manager.
If you enable auto-assign when installing the integration, the logged in user automatically becomes the assignee for any new JIRA issues created from Situations. Your username must match exactly in Cisco Crosswork Situation Manager and JIRA for this feature to work.
You can create multiple issues from the same Situation but the latest issue replaces the previous issue associated with the Situation.
Create a Service Desk Issue from an Alert
You can create a JIRA Service Desk issue from an alert in Cisco Crosswork Situation Manager as follows:
1. Open an alert view such as Open Alerts or select the Alerts tab in a Situation Room.
2. Right-click on the alert you want to create a Service Desk issue from.
3. Click Tools and Open JIRA Service Desk Ticket in the drop-down menu.
4. Click OK on the response status pop-up window to continue.
After completing these steps, a new issue appears in JIRA. You can only create a single issue from each alert. Each new issue has the default summary 'New issue has been opened for Cisco Crosswork Situation Manager Alert [<alert_id>]' and the description 'Created from Cisco Crosswork Situation Manager Alert <alert_id>'.
The issue created in JIRA Service Desk adopts the default priority set in Service Desk. You can configure the JIRA Moobot to customize the priority settings based on Cisco Crosswork Situation Manager's Situation priority.
Change a Service Desk Issue or Situation Status
When you change the status of a Situation in Cisco Crosswork Situation Manager, the status of the associated issue in Service Desk changes and vice versa.
If you close a Situation, the integration attempts to resolve the associated Service Desk issue. If this is rejected, the integration moves the Service Desk issue to the next status in the workflow.
Create Bidirectional Comments
When you add a comment to a Situation Room, the same comment appears on the associated Service Desk issue and vice versa. Any new comment is prefixed by the commenter's username. For example, if a user called 'Operator' makes a comment, it appears in JIRA Service Desk as "operator: <comment text>".
If you add a journal entry when you close a Situation this also appears as a new comment on the associated Service Desk issue.
JIRA Software
Configuring the JIRA Software enables you to create and update a JIRA Software ticket from an open Cisco Crosswork Situation Manager Situation. You can enable auto-assign so new JIRA issues created from Cisco Crosswork Situation Manager are automatically assigned to the logged in user. See JIRA Software Integration Workflow for more information.
See the JIRA documentation for information on JIRA components.
Before You Begin
The JIRA Software integration has been validated with JIRA Software v7 and JIRA Cloud. Before you start to set up your integration, ensure you have met the following requirements:
· You have the URL for your JIRA Software system.
· You have created an integration user in JIRA Software with access to the project where the system opens issues.
· You have the username (typically the email address) and password of the JIRA Software integration user. If you are using JIRA with Atlassian Cloud, their password needs to be an API token. For instructions on how to create an API token, see the Atlassian Cloud documentation.
· The project type is either Basic Software Development (also called Bug Tracking in some versions), Scrum or Kanban.
· If you want to enable auto-assign, you have created user accounts with the same names in both Cisco Crosswork Situation Manager and JIRA Software.
Configure the JIRA Software Integration
To configure the JIRA Software integration:
1. Navigate to the Integrations tab.
2. Click JIRA Software in the Ticketing section.
3. Follow the instructions to create an integration name and enter the other details relating to your JIRA instance.
JIRA Software Configuration
Log in to JIRA to create the webhook to send event data. For more help, see theJIRA documentation.
1. Open the JIRA site administration console and create a webhook.
2. Add a name, set the status to 'Enabled' and enter the URL for this integration:
| Field |
Value |
| Name |
Cisco Crosswork Situation Manager Webhook |
| Status |
Enabled |
| URL |
URL of your Webhook |
3. Select only 'updated' issues and 'created' comments as your webhook events.
After you complete the JIRA Software integration, you can right-click a Situation and select Open JIRA Issue from the contextual menu. Cisco Crosswork Situation Manager maintains a link to the JIRA ticket and updates it with your comments and status changes.
This integration prefixes JIRA tickets with 'Cisco Crosswork Situation Manager Situation [number]'. Do not remove this prefix as it is needed to synchronize comments, status changes and descriptions.
JIRA Software Integration Workflow
The bidirectional JIRA Software integration keeps critical information synchronized between Cisco Crosswork Situation Manager and JIRA Software.
If enabled, this integration allows you to:
· Create a JIRA issue from an open Situation in Cisco Crosswork Situation Manager.
· Add comments in a Situation Room for them to appear on the linked JIRA issue and vice versa.
· Change the status of a Situation to change the status of the linked JIRA issue and vice versa.
Note::
It is not possible to create a Situation from a JIRA issue.
Create a JIRA Issue from a Situation
You can create a JIRA issue from a Situation in Cisco Crosswork Situation Manager as follows:
1. Open a Situation view such as Open Situations.
2. Right-click on the Situation you want to create a JIRA issue from.
3. Click Tools and Open JIRA Ticket in the drop-down menu.
4. Click OK on the response status pop-up window to continue.
After completing these steps, a new issue appears in JIRA. You can create multiple issues from the same Situation but the latest issue replaces the previous issue associated with the Situation. Each new issue has the default summary 'New ticket has been opened for Cisco Crosswork Situation Manager Situation [<sig_id>]' and the description 'Created from Cisco Crosswork Situation Manager Situation <sig_id>'. This contains a hyperlink back to the Situation in Cisco Crosswork Situation Manager.
If you enable auto-assign when installing the integration, the logged in user automatically becomes the assignee for any new JIRA issues created from Situations. Your username must match exactly in Cisco Crosswork Situation Manager and JIRA for this feature to work.
Create a JIRA Issue from an Alert
You can create a JIRA issue from an alert in Cisco Crosswork Situation Manager as follows:
1. Open an alert view such as Open Alerts or select the Alerts tab in a Situation Room.
2. Right-click on the alert you want to create a JIRA issue from.
3. Click Tools and Open JIRA Ticket in the drop-down menu.
4. Click OK on the response status pop-up window to continue.
After completing these steps, a new issue appears in JIRA. You can only create a single issue from each alert. Each new issue has the default summary 'New issue has been opened for Cisco Crosswork Situation Manager Alert [<alert_id>]' and the description 'Created from Cisco Crosswork Situation Manager Alert <alert_id>'.
Change a JIRA Issue or Situation Status
When you change the status of a Situation in Cisco Crosswork Situation Manager, the status of the associated issue in JIRA changes and vice versa.
If you close a Situation, the integration marks the associated JIRA issue as 'Done'. If you change the status of a JIRA issue to 'Done', the integration also closes the associated Situation.
The default status mapping for the integration is as follows:
| Cisco Crosswork Situation Manager |
JIRA Software |
| Opened |
To Do |
| Resolved |
Done |
| Closed |
Done |
Create Bidirectional Comments
When you add a comment to a Situation Room, the same comment appears on the associated JIRA issue and vice versa. Any new comment is prefixed by the commenter's username. For example, if a user called 'Operator' makes a comment, it appears in JIRA as "operator: <comment text>".
If you add a journal entry when you close a Situation this also appears as a new comment on the associated JIRA issue.
JMS
The Java Messaging Service (JMS) LAM is a link access module that communicates with application servers and message brokers, and takes its input from Java Messaging Services.
See Configure the JMS LAM for advanced configuration information.
Enter the following information for the JMS integration:
· Unique instance name: This could be any name, it is used to identify this JMS integration. The name entered here should be unique e.g. jms_lam1.
· initial_context_factory: The LAM identifies the JMS server provider by this field. The value entered in this field is the JNDI name of the context factory of the provider. The values entered for the 3 server providers are as follows:
| JMS Server Provider |
intial_context_factory |
| ActiveMQ |
org.apache.activemq.jndi.ActiveMQInitialContextFactory |
| JBoss |
org.jboss.naming.remote.client.InitialContextFactory |
| WebLogic |
weblogic.jndi.WLInitialContextFactory |
• provider_url: This field contains the URL of the provider to establish connection with the JMS Server provider
| JMS Server Provider |
provider_url |
| ActiveMQ |
tcp:// IP address of ActiveMQ server:61616 |
| JBoss |
http-remoting://IP address of JBoss server :8080 |
| WebLogic |
t3:// IP address of the WebLogic server:7001 |
For SSL the following URLs are used
| JMS Server Provider |
provider_url |
| ActiveMQ |
ssl:// IP address of ActiveMQ server:61616 |
| JBoss |
https-remoting://IP address of JBoss server :8443 |
| WebLogic |
t3s:// IP address of the WebLogic server:7002 |
· provider_user_name and provider_password: The provider user name and password which is required for the connection to be established between the JMS server provider and the JMS LAM. If there is no password configured then leave it blank. For JBoss it is the user name and password of the user which is both a management and an application user, created in JBoss. For Active MQ the user name is admin and password is also admin. For WebLogic it is the user name and password of the Administration Console, created during its installation
· connection_factory_name: The connection factory name of the JMS server provider is entered here. The connection factory names of the 3 JMS server providers are as follows:
| JMS Server Provider |
connection_factory_name |
| ActiveMQ |
ConnectionFactory |
| JBoss |
jms/RemoteConnectionFactory |
| WebLogic |
It is the name of the connection factory that is created in the WebLogic administration console |
· entity_name: The name of the queue or topic is entered in this field. The format in which the entity name is to be entered is as follows:
| JMS Server Provider |
entity_name |
| ActiveMQ |
dynamicQueues/name of the queue or topic |
| JBoss |
jms/queue/name of the queue or topic |
| WebLogic |
JNDI name of the queue or topic.e.g. jms/queue/queue1 |
· user_name and password: The queue or topic username and password are entered in these fields. If there is no username and password configured for the queue or topic then leave it blank. For JBoss it is the username and password of the user which is both a management and an application user, created in JBoss. For Active MQ the username is admin and password is also admin. For WebLogic it is the username and password of the Administration Console, created during its installation.
Note::
Polling will continue every 60 seconds.
After adding all the above information, click Confirm.
Configure the JMS LAM
The Java Messaging Service (JMS) LAM is a link access module that communicates with the following Application Servers and message brokers, and takes its input from Java Messaging Services.
· JBoss: JBoss now known as WildFly is an Application Server which takes messages from Java Messaging Services in a queue or topic and forward them to application that are connected or subscribed to it
· ActiveMQ: Apache ActiveMQ is an open source message broker written in Java together with a full Java Message Service (JMS) client
· WebLogic: WebLogic is a server software application that runs on a middle tier, between back-end databases and related applications and browser-based thin clients. WebLogic server include connectors that make it possible for any legacy application on any client to inter-operate with server applications, Enterprise Java Bean (EJB) components, resource pooling, and connection sharing that make applications very scalable
See JMS for UI configuration instructions.
This documentation explains the basic configuration for enabling the above mentioned 3 Java based Application Servers and the configuration of the JMS LAM config file (jms_lam.conf).
Process Workflow
The workflow of gathering alarms from the Application Server and publishing it to Cisco Crosswork Situation Manager is:
1. JMS LAM monitors message data being written to a Queue/Topic in the JMS provider.
2. JMS LAM parses this message data according to the configuration file.
3. Events are constructed from the monitored message data and then are passed to the MOOMs bus.
4. Events are then published to the subject Events.
JMS LAM Configuration
The alarms received from the any of the 3 servers are processed according to the configuration in the jms_lam.conf file. The processed alarms are published to Cisco Crosswork Situation Manager.
The configuration file contains a JSON object. At the first layer of the object, LAM has a parameter called config, and the object that follows config has all the necessary information to control the LAM.
The following sections are available for configuration in the JMS LAM configuration file.
Monitor
monitor defines the object to be monitored:
monitor:
{
name : "JMS Lam Monitor",
class : "CJMSMonitor",
initial_context_factory : "x.x.x.x",
provider_url : "tcp://localhost:61616",
provider_user_name : "user_name",
provider_password : "password",
encrypted_provider_password : "ieytOFRUdLpZx53nijEw0rOh07VEr8w9lBxdCc7229o=",
connection_factory_name : "ConnectionFactory",
entity_name : "queuename",
user_name : "username",
password : "password",
encrypted_password : "ieytOFRUdLpZx53nijEw0rOh07VEr8w9lBxdCc7229o=",
max_retries : 10,
retry_interval : 60,
message_type : "TextMessage",
ssl_conn_activemq : false,
ssl_connection : false,
ssl_keystore_filename : "",
ssl_truststore_filename : "",
ssl_keystore_password : "",
ssl_truststore_password : "",
response_require : true,
feedback_queue : "feedback_queue_name"
},
The above example specifies:
· name and class: These fields are reserved and should not be changed the default values are JMS Lam Monitor and CJMSMonitor respectively
· initial_context_factory: The LAM identifies the JMS server provider by this field. The value entered in this field is the JNDI name of the context factory of the provider. The values entered for the 3 server providers are as follows:
| JMS Server Provider |
intial_context_factory |
| ActiveMQ |
org.apache.activemq.jndi.ActiveMQInitialContextFactory |
| JBoss |
org.jboss.naming.remote.client.InitialContextFactory |
| WebLogic |
weblogic.jndi.WLInitialContextFactory |
· provider_url: This field contains the URL of the provider to establish connection with the JMS Server provider
| JMS Server Provider |
provider_url |
| ActiveMQ |
tcp:// IP address of ActiveMQ server:61616 |
| JBoss |
http-remoting://IP address of JBoss server :8080 |
| WebLogic |
t3:// IP address of the WebLogic server:7001 |
For SSL the following URLs are used
| JMS Server Provider |
provider_url |
| ActiveMQ |
ssl:// IP address of ActiveMQ server:61616 |
| JBoss |
https-remoting://IP address of JBoss server :8443 |
| WebLogic |
t3s:// IP address of the WebLogic server:7002 |
Note::
The above given ports are the default ports that the providers use. The port number in the LAM config file should be given as per the configurations in the provider server. E.g. if JBOSS is running on port 8081, then in the config file also it should be 8081
· provider_user_name and provider_password: The provider user name and password which is required for the connection to be established between the JMS server provider and the JMS LAM. If there is no password configured then leave it blank. For JBoss it is the user name and password of the user which is both a management and an application user, created in JBoss. For Active MQ the user name is admin and password is also admin. For WebLogic it is the user name and password of the Administration Console, created during its installation
· encrypted_provider_password: If the provider password is encrypted then enter the encrypted password in this field and comment the provider_password field. At a time either provider_password or the encrypted_provider_password field is used. If both the fields are not commented then the field encrypted_provider_password will be used by the JMS LAM
· connection_factory_name: The connection factory name of the JMS server provider is entered here. The connection factory names of the 3 JMS server providers are as follows:
| JMS Server Provider |
connection_factory_name |
| ActiveMQ |
ConnectionFactory |
| JBoss |
jms/RemoteConnectionFactory |
| WebLogic |
It is the name of the connection factory that is created in the WebLogic administration console |
· entity_name: The name of the queue or topic is entered in this field. The format in which the entity name is to be entered is as follows:
| JMS Server Provider |
entity_name |
| ActiveMQ |
dynamicQueues/name of the queue or topic |
| JBoss |
jms/queue/name of the queue or topic |
| WebLogic |
JNDI name of the queue or topic.e.g. jms/queue/queue1 |
· user_name and password: The queue or topic username and password is entered in these fields. If there is no user name and password configured for the queue or topic then leave it blank. For JBoss it is the user name and password of the user which is both a management and an application user, created in JBoss. For Active MQ the user name is admin and password is also admin. For WebLogic it is the user name and password of the Administration Console, created during its installation
· encrypted_password: If queue or topic password is encrypted then enter the encrypted password in this field and comment the password field. At a time either password or the encrypted_password field is used. If both the fields are not commented then the field encrypted_password will be used by the JMS LAM
· max_retries: The maximum number of retry attempts to reconnect with the JMS provider in case of a connection failure
Note::
The default value is set to 10, if 0 is entered in this field then the LAM by default takes the value 10 and will try at least 10 times to reconnect
Note::
If all the number of retries are exhausted, then an alarm is sent to Cisco Crosswork Situation Manager about the connection failure. For re-establishing the connection the LAM has to be restarted
· retry_interval: The time interval between two successive retry attempts
Note::
The default value is set to 60 seconds, if 0 is entered in this field then the time interval is by default set to 60 seconds
Note::
The entry in the fields max_retries and retry_interval should be an integer, therefore enter the values in these fields without quotation marks
· message_type: The message type of the messages received from the application can be set here. The following 3 message types are supported:
— TextMessage
— MapMessage
— ObjectMessage
· ssl_conn_activemq: To enable an SSL connection for ActiveMQ server provider enter true in this field
· ssl_connection: To enable an SSL connection for JBoss or WebLogic enter true in this field
· ssl_keystore_filename: If an SSL connection is enabled then enter the ssl keystore filename along with its path in Cisco Crosswork Situation Manager, E.g. if the ssl keystore is in the directory usr/share/moogsoft /ssl, then enter usr/share/moogsoft/ssl/client.ks
· ssl_truststore_filename: If an SSL connection is enabled then enter the ssl truststore filename along with its path in Cisco Crosswork Situation Manager, E.g. if the ssl keystore is in the directory usr/share/moogsoft/ssl, then enter usr/share/moogsoft/ssl/client.ts
· ssl_keystore_password: If an SSL connection is enabled then enter the ssl keystore password in this field
· ssl_truststore_password: If an SSL connection is enabled then enter the ssl truststore password in this field
· response_require: If response is to be sent back to queue or topic for received messages, enter true in this field
· feedback_queue: Enter the queue name in which the response feedback is sent at the JMS server provider
Agent and Process Log configuration
The Agent and Process Log sections allow you to configure the following properties:
· name: Identifies events the LAM sends to the Message Bus.
· capture_log: Name and location of the LAM's capture log file.
· configuration_file: Name and location of the LAM's process log configuration file.
Data parsing
Any received data needs to be broken up into tokens. When you have the tokens, you can start assembling an event. There are a number of parameters that allow you to control how this will work. The first two are start and end character. You can have multiple start and end characters. The system generates an event after all the tokens between a start and an end character is assembled.
Parsing:
{
type: "",
start_and_end:
{
start: [],
end: ["\n"],
delimiters:
{
ignoreQuotes: true,
stripQuotes: true,
ignores: "",
delimiter: [",","\r"]
}
}
},
# Parsing block with regular expressions, using delimter
# based tokenising:
#
# parsing:
# {
# type: "regexp",
# regexp:
# {
# pattern : "(?mU)^(.*)$",
# capture_group: 1,
# tokeniser_type: "delimiters",
# delimiters:
# {
# ignoreQuotes: true,
# stripQuotes: false,
# ignores: "",
# delimiter: ["\r"]
# }
# }
# },
#
The above example specifies the following 3 types of parsing:
· JSON parsing: To enable this parsing the type is set to blank
· Text Messgae: To enable this parsing the type is set to Start_and_End
· Regular Expression: To enable this the type is set to regexp
In the above example only one parsing method is used at a time. Either regexp or Text Message/JSON.
JSON Parsing
Any received data needs to be broken up into tokens. Once the tokens are received, the assembling of an event starts. There are a number of parameters that allow the user to control how this will work. The first 2 are a start and end character. The square brackets [] are the JSON notation for a list. You can have multiple start and end characters. The system considers an event as all of the tokens between any start and end character.
start: [],
end: ["\n"],
The above example specifies:
· There is nothing defined in start; however, a carriage return (new line) is defined as the end character
In the example above, the LAM is expecting a whole line to be written followed by a return, and it will process the whole line as one event.
If set up carefully, user can accept multi-line events.
Text Message Parsing
The Type should be set start_and_end and as shown in the below example.
type: start_and_end:
{
start: [JMS_MSG],
end: ["\n"],
...
The parsing in above example the parsing will start when it gets JMS_MSG and end when it gets new line.
Regular Expression Parsing
In regular expression the parser searches for strings as per the expression defined in pattern. The extracted string is then delimited as per the defined delimiters. In the above example the parser searches for the expression "(?mU)^(.*)$".
Delimiters
Delimiters define how a line is split into tokens. For example, if you have a line of text data, it needs to be split up into a sequence of sub strings that are referenced by position from the start. So if you were processing a comma-separated file, where a comma separates each value, it would make sense to have the delimiter defined as a comma. Then the system would take all the text between start and end and break it up into tokens between the commas. The tokens could then be referenced by position number in the string starting from one, not zero.
For example if the input string was the,cat,sat,on,the,mat and comma was used as a separator, token 1 would be the, token 2 cat and so on.
Be aware, there are complications when you come to tokenisation and parsing. For example, if you say comma is the delimiter, and the token contains a comma, you will end up with that token containing a comma to be split into 2 tokens. To avoid this it is recommended that you quote strings. You must then allow the system to know whether it should strip or ignore quotes, hence the stripQuotes and ignoreQuotes parameters.
ignoreQuotes: true,
stripQuotes: false,
ignores: "",
delimiter: [",","\r"]
The above example specifies:
· If you have strings that are quoted between delimiters, ignoreQuotes set to true will look for delimiters inside the quote. For example, <delimiter>hello inside quote goodbye<delimiter> gives a token [hello inside quote goodbye]
· Setting stripQuotes to true removes start and end quotes from tokens. For example, hello world gives a token [hello world]
· ignores is a list of characters to ignore. Ignored characters are never included in tokens
· Delimiter is the list of valid delimiters used to split strings into tokens
Variables
For each event in the file, there is a positioned collection of tokens. Cisco Crosswork Situation Manager enables a user to name these positions. Naming of the positions helps the user to identify the tokens.In the below given example token at position number 6 is a Manager name, so the user names the token as "Manager".
This section is used for text message.
variables:
[
#
# Note that positions start at 1, and go up
# rather than array index style counting from zero
#
{ name: "signature", position: 1 },
{ name: "source_id", position: 4 },
{ name: "external_id", position: 3 },
{ name: "Manager", position: 6 },
{ name: "AlertGroup", position: 7 },
{ name: "Class", position: 8 },
{ name: "Agent", position: 9 },
{ name: "severity", position: 5 },
{ name: "description", position: 10 },
{ name: "agent_time", position: 1 }
],
The above example specifies:
position 1 is assigned to signature; position 4 is assigned to source_id and so on. Positions start at 1, and go up.
Note::
Note::: The variable section is used when the message type is TextMessage
The variable section is only used for text message. For JSON, MapMessage and ObjectMessage the mapping section is used. In mapping there is a value called rules, which is a list of assignments.
mapping :
{
#
# All unused variables live as a JSON object
# referenced by this variable (if defined)
#
builtInMapper: "CJsonDecoder",
# Input is restricted to Json so the builtInMapper option is not
# used for this LAM
#
catchAll: "overflow",
rules:
[
{ name: "signature", rule: "$signature" },
{ name: "source_id", rule: "$source_id" },
{ name: "external_id", rule: "$external_id" },
{ name: "manager", rule: "JMS },
{ name: "source", rule: "$source" },
{ name: "class", rule: "$class" },
{ name: "agent", rule: "$LamInstanceName" },
{ name: "agent_location", rule: "$agent_location" },
{ name: "type", rule: "$type" },
{ name: "severity", rule: "$severity", conversion: "sevConverter" },
{ name: "description", rule: "$description" },
{ name: "agent_time", rule: "$agent_time", conversion: "stringToInt" }
]
},
filter:
{
presend: "JmsLam.js"
}
}
}
In the example above, the first assignment name: "signature, rule:"$signature ($signature is a string with $ syntax) means for signature field take the tokens called signature.
User defines a number of these rules covering the base attributes of an event. For reference, the system expects a minimum set of attributes in an event that are shown in the above example.
Note::
For JSON, MapMessage and ObjectMessage enable the builtInMapper: "CJsonDecoder" by uncommenting it. The variable section is ignored if builtInMapper is uncommented
Note::
For TextMessage builtInMapper option should be commented
Note::
In JMS the event fields depends on the events that are fed in the queue or topic. The above mapping is just an example and has to be changed according to the alarms/events received from the queue/topic
Constants and conversions
There are rules in mapping section for which conversions are to be defined. The conversions convert the received input from one format to another. E.g. in the above example of mapping, for the mapped field severity, an integer is received which is converted to text and displayed on the Cisco Crosswork Situation Manager UI. The lookup for conversions is kept in the constants section. The available conversions are kept in the conversions section and called during mapping. The example of calling a conversion is as follows:
{ name: "severity", rule: "$severity", conversion: "sevConverter" }
The example of constants and conversions sections are as follows:
constants:
{
severity:
{
"CLEAR" : 0,
"INDETERMINATE" : 1,
"WARNING" : 2,
"MINOR" : 3,
"MAJOR" : 4,
"CRITICAL" : 5
}
},
conversions:
{
sevConverter:
{
lookup: "severity",
input: "STRING",
output: "INTEGER"
},
stringToInt:
{
input: "STRING",
output: "INTEGER"
},
timeConverter:
{
timeFormat: "%D %T",
input: "STRING",
output: "INTEGER"
}
},
The above example specifies:
· Severity and sevConverter: The severity field has a conversion defined as sevConverter in the Conversions section, this looks up the value of severity defined in the severity section of constants and returns back the mapped integer corresponding to the severity
· stringToInt: It is used in a conversion, which forces the system to turn a string token into an integer value
· timeConverter: It is used in conversion which forces the system to convert to time. If time is epoc time, then timeFormat mentioned in timeConverter should be commented. Otherwise, user should provide the timeFormat i.e. (%D %T) and it should be uncommented
JSON Events
The capability of JMS LAM is the ability to consume JSON events. JSON is a sequence of attribute/value, and the attribute is used as a name. Under mapping, you must define the following attribute builtInMapper: "CJsonDecoder". It automatically populates all of the values contained in the JSON object, prior to the rules being run.
For example, if the JSON object to be parsed was:
{"signature": "11898.9","source_id": "Server1", "severity": "MINOR" so on}
The attributes available to the rules in the mapping section would be $signature=11898.9, $Severity= Minor and so on. Similarly, user can map ObjectMessage and MapMessage.
For TextMessage user should use variable section.
Below are few samples of TextMessage, MapMessage and ObjectMessage.
TextMessage
JMS_MSG:3600de30-92f8-71e2-0408-97bfd0490000||1||26||13639605v53||1364210285||1363960556||NEO||delta-server-loggingAdaptor||default.log||2013-03-25 11:17:19.560 ERROR [Response--6 - BlockingEntitlementsCheckHandle] Unauthorised access detected, throwing UnauthorisedAccessException||xstm3022xpap.stm.swissbank.com||NEO-PROD
MapMessage
hostname=10.112.70.125
port=8080
destination-jndi=jms/topic/test
username=administrator
password=India@123
signature=8.9
source_id=server1
external_id=123.1345
manager=JMS
source=server1
class=server
agent=test
agent_location=test
type=test
severity=MAJOR
description=Test server1
agent_time=07/24/12 18:06:01
ObjectMessage
hostname=10.112.70.123
port=8080
connection-factory-jndi=jms/RemoteConnectionFactory
destination-jndi=jms/queue/test
#connection-factory-jndi=ConnectionFactory
#destination-jndi=dynamicQueues/final
username=administrator
password=India@123
server-name=Jboss
# Properties related to Websphere mq
message-type=object
# Properties related to object message
signature=1234.8.9
source_id=server2
external_id=hmoscsysd2
manager=JMS
source=server2
class=test
agent=test
agent_location=test
type=server
severity=MAJOR
description=test server2
agent_time=07/24/12 18:06:01
catchAll
The attribute that is never referenced in a rule is collected and placed as a JSON object in a variable called overflow defined here and passed as part of the event.
catchAll: "overflow",
rules:
[
{ name: "signature", rule: "$signature" },
{ name: "source_id", rule: "$source_id" },
{ name: "external_id", rule: "$external_id" },
{ name: "manager", rule: "JMS" },
{ name: "source", rule: "$source" },
{ name: "class", rule: "$class" },
{ name: "agent", rule: "$LamInstanceName" },
{ name: "agent_location", rule: "$agent_location" },
{ name: "type", rule: "$type" },
{ name: "severity", rule: "$severity", conversion: "sevConverter" },
{ name: "description", rule: "$description" },
{ name: "agent_time", rule: "$agent_time", conversion: "stringToInt" }
]
The above example specifies the mapping of tokens and the variable overflow for catchAll.
The attribute test1 and test2 is not mapped with a field in the jms_lam.conf file, it is placed in the overflow JSON object. The fields that are placed in the overflow variable can be viewed in the JMS LAM log file.
Example of a message sent through a JMS queue.
Message
[{"signature":"0.1.8","source_id":"xvsdfgdg","external_id":"dduncan9","manager":"Sonsitng","source":"Indonesian","class":180,"agent_location":"Liangwa","type":"Violet","severity":"WARNING","description":"Yuan
Renminbi","agent_time":"07/27/12 19:06:01","test1":"1","test":"2"}]
Example of an overflow JSON object containing the unmapped test1 and test2 tokens, created in the JMS LAM log file:
INFO
: [EventFa][20161027 17:04:38.701 +0530] [CMooMsg.java]:1099 +|Encoded size
[376]
json[{"_MOOTADATA_":{"creation_time":1477568078591},"agent":"JMSLAM","agent_location":"Liangwa","agent_time":0,"class":180,"description":"Yuan
Renminbi","external_id":"dduncan9","manager":"Sonsitng","overflow":"{\"test\":\"2\",\"test1\":\"1\"}","severity":2,"signature":"0.1
Starting the JMS LAM
To start the JMS LAM enter the following command:
service jmslamd start
Note::
To stop the JMS LAM enter the following command:
service jmslamd stop
To view the status of JMS LAM enter the following command:
service jmslamd status
Quotes
In some instances, the attribute strings are quoted. Our JSON parser ignores it, but the standard requires quoting for all strings, so Cisco recommends that user quote all strings.
Comments
A user can comment out lines by appending them with a hash.
Command Line Attributes
The jms_lam is a command line executable that can be run as a service daemon, and takes 4 attributes, which can be viewed by typing:
jms_lam--help
| Option |
Description |
| --config |
Points to a pathname to find the configuration file for the LAM. This is where the entire configuration for the LAM is specified |
| --help |
Displays all the command line options |
| --version |
Displays the components version number |
| -- loglevel |
Specifies the level of debug. By default, you get everything. In common with all executables in Cisco Crosswork Situation Manager, having it set at that level can result in a lot of output (many messages per event message processed). In all production implementations it is recommended that log level be set to WARN, which only informs you of matters of importance |
Configure ActiveMQ
ActiveMQ Configuration
Apache ActiveMQ is an open source message broker written in Java together with a full Java Message Service (JMS) client.
Configuring ActiveMQ to function with JMS LAM has following three steps:
1. Creating a JMS Queue.
2. Creating a JMS Topic.
3. SSL configuration for ActiveMQ.
Creating a JMS Queue for ActiveMQ
1. Enter the URL http://127.0.0.1:8161/admin/ in a browser. The browser prompts for login.
2. Enter the following details and click OK:
a. User: admin
b. Password: admin
3. Select Queues from the menu bar of the ActiveMQ admin console.
4. Enter a queue name in the field Queue Name E.g. Test_queue and click on Create. The queue is created and displayed in the Queues section.

The JMS Queue is created.
Creating a JMS Topic for ActiveMQ
1. Enter the URL http://127.0.0.1:8161/admin/ in a browser. The browser prompts for login.
2. Enter the following details and click OK:
a. User: admin
b. Password: admin
3. Select Topics from the menu bar of ActiveMQ admin console.
4. Enter a topic name in the field Topic Name, for example, Test_topic, and click on Create. The topic is created and displayed in the Topics section.

SSL Configuration for ActiveMQ(Optional)
To configure SSL in ActiveMQ, proceed as follows:
Note::
The following procedure is same for both Windows and Linux.
Note::
If the SSL configuration is already implemented for ActiveMQ, then this configuration can be skipped.
1. Open a CLI and create a folder using the command mkdir SSL.
2. Navigate to SSL directory using the command cd SSL.
3. Execute the following commands one by one.
$ keytool -genkey -alias localhost -keyalg RSA -keysize 2048 -validity 90 -keystore amq-server.ks
$ keytool -export -alias localhost -keystore amq-server.ks -file amq-server_cert
$ keytool -genkey -alias localhost -keyalg RSA -keysize 2048 -validity 90 -keystore amq-client.ks
$ keytool -import -alias localhost -keystore amq-client.ts -file amq-server_cert
$ keytool -export -alias localhost -keystore amq-client.ks -file amq-client_cert
$ keytool -import -alias localhost -keystore amq-server.ts -file amq-client_cert
4. The following files are generated in the SSL directory.
a. amq-clients.ks
b. amq-client.ts
c. amq-client_cert
d. amq-server.ks
e. amq-server.ts
f. amq-server_cert
5. Copy the amq-server.ks and amq-server.ts files from the SSL folder to the .conf folder of the unzipped downloaded ActiveMQ setup.
6. Change the transportConnectors element for "ssl" in the .activemq.xml file in the .conf folder, set needClientAuth=true in the element. If the transport connector for SSL is not present then add it in the <transport connectors> section and delete all the other transport connectors.
7. Enter the <sslcontext> section in the activemq.xml file in the .conf folder. Add the ssl context as follows:
<transportConnectors>
<transportConnector name="ssl" uri="ssl://0.0.0.0:61617?trace=true&needClientAuth=true"/>
</transportConnectors>
<sslContext>
<sslContext keyStore="file:${activemq.base}/conf/amq-server.ks"
keyStorePassword="PASSWORD"
trustStore="file:${activemq.base}/conf/amq-server.ts"
trustStorePassword="PASSWORD" />
</sslContext>
Note::
The password mentioned in the above section should be the same password that you have given while creating the certificates
8. Start the ActiveMQ service by executing the command activemq start.
Configure JBoss (Wildfly)
JBoss (WildFly) Configuration
Configuring JBoss (WildFly) to function with the JMS LAM has 4 steps:
1. Adding the jboss-client jar to Cisco Crosswork Situation Manager
2. Creating a user for WildFly application (optional).
3. Creating a JMS Queue.
4. Creating a JMS Topic.
5. SSL Configuration for WildFly (optional).
Add the JBoss Jar to Cisco Crosswork Situation Manager
The jboss-client.jar has to be added to Cisco Crosswork Situation Manager to establish a connection with JBoss. Copy the jboss-client.jar to the $MOOGSOFT_HOME/lib/cots/nonDist directory in Cisco Crosswork Situation Manager.
Note::
The jboss-client.jar for Linux can be found in the directory $JBOSS_HOME/wildfly10/bin/client.
Note::
The jboss-client.jar for Windows can be found in the directory C:\wildfly10\bin\client
Create a user for WildFly (Optional)
Note::
If a user is already created and its user credentials are available, then do not add a user for WildFly. The user is required to log into the Administration Console
WildFly is distributed with security enabled for the management interfaces. For adding a queue or topic, a user has to be added for accessing WildFly. To create a user, proceed as follows:
1. Open a Linux CLI.
2. Navigate to the bin directory of the extracted WildFly application using the cd command.
3. Enter the command add-user.sh and pressthe enter key.
Note::
For Windows, navigate to the bin directory of the extracted WildFly application using the cd command in command prompt, then enter the command add-user.bat
The following question is displayed:
What type of user do you wish to add?
a) Management User (mgmt-users.properties)
b) Application User (application-users.properties)

1. Type a and press the enter key.
2. Enter the username, password and retype the password when prompted and then press the enter key.
3. Press the enter key when the question What groups do you want this user to belong to? (please enter a comma separated list, or leave blank for none) [ ]: is displayed.
4. Press the enter key when the question About to add user username for the realm ManagementRealm Is this correct yes/no? is displayed.
Note::
It is important to leave the name of the realm as ManagementRealm for management user, as it is required for matching the user name in the server configuration
1. Enter yes when the question Is this correct yes/no? is displayed and press the enter key.
2. Enter yes when the question Is this new user going to be used for one AS process to connect to another AS process? is displayed and press the enter key.
Note::
The user will be written to the properties files used for authentication and a confirmation message will be displayed
The user for WildFly is added and can be used to log into the Administration Console.
Create a JMS Queue for WildFly using Linux CLI
The queue can be created using a Linux CLI or by accessing the Administration Console from a browser in Windows or Linux.
To create a queue using Linux CLI:
1. Navigate to the bin directory of WildFly using the cd command.
2. Stop the WildFly Server using the following command:
jboss-cli.sh -c --command=:shutdown
3. Navigate to the configuration folder by entering the following commands:
cd ..
cd standalone/configuration
4. Open the standalone-full.xml file by using either the vi or the vim editor.
Note::
For Windows, navigate to the configuration directory where WildFly is extracted, and open the standalone-full.xml file in a notepad or a wordpad.
Note::
Take a backup of the standalone-full.xml file before making any changes.
5. Find the messaging subsystem section in the standalone-full.xml file:
<subsystem xmlns="urn:jboss:domain:messaging:2.0">
6. Scroll to the end of the messaging subsystem section and add the following XML after the </jms-connection-factories> end tag but before the </hornetq-server> element:
<jms-destinations>
<jms-queue name="testQueue">
<entry name="java:jboss/exported/jms/queue/test"/>
</jms-queue>
</jms-destinations>
a. The queue name is entered in <jms-queue name>
b. The JNDI is entered in <entry name>
c. Save the changes and close the file using the command :wq!.
d. Navigate back to the bin directory.
7. Start the server by executing the following command:
./standalone.sh -c standalone-full.xml -b=0.0.0.0 -bmanagement=0.0.0.0
Note::
For Windows, to start the WildFly server execute the following command in the command prompt:
standalone.bat -c standalone-full-ssl.xml -b=0.0.0.0 -bmanagement=0.0.0.0
Note::
After making the changes to the standalone-full.xml file, copy it to the bin folder and then run the above command.
The JMS queue is created in WildFly.
Create a JMS Queue for WildFly using Administration Console
1. Open the welcome screen by entering the URL http://localhost:8080 in a browser, then click on Administration Console.
2. Alternatively, the Administration Console can also be accessed by entering the URL http://localhost:9990 in a browser.
3. Enter the username and password of the user defined for WildFly.
4. Click on Start, adjacent to Create a JMS Queue.
5. Select Subsystems in the Configuration section, then select Messaging-ActiveMQ in the Subsystem section.
6. Click on default. The Queues/Topic fieldis displayed.
7. Click on Queues/Topics. The Messaging Destinations view opens. Click Add in the Queues tab of the JMS Endpoints: Provider default view.
8. Enter the name of the JMS queue in the Name field, for example, Test_Queue.
9. Specify the JNDI Name as java:/jboss/exported/jms/queue/<name of queue>. For example, java:/jboss/exported/jms/queue/Test_Queue.
Note::
A queue which needs to be accessed by a remote client should have an entry in the "java:jboss/exported" namespace.
10. Select the Durable checkbox.
Note::
Durable subscription in JMS means that if subscriber is disconnected and then connected again to a JMS destination, then the destination will receive all messages that have been sent to it and have not expired.
11. Leave the Selector field blank and click Save.
The queue is added and can be viewed in the Queues tab.
Note::
For WildFly 8, in the Administration Console, navigate to messaging>Destinations, then click view. Now add the queue as described above.
Create a JMS Topic for WildFly using Linux CLI
The topic can be created using a Linux CLI or by accessing the Administration Console from a browser in Windows or Linux.
To create a topic using Linux CLI, proceed as follows:
1. Navigate to the bin directory of WildFly using the cd command.
2. Stop the WildFly Server using the following command:
jboss-cli.sh -c --command=:shutdown
3. Navigate to the configuration folder by entering the following commands:
cd ..
cd standalone/configuration
4. Open the standalone-full.xml file by using either the vi or the vim editor.
Note::
For Windows, navigate to the directory where wildfly is extracted, and open the standalone-full.xml file in a notepad or a wordpad.
Note::
Take a backup of the standalone-full.xml file before making any changes.
5. Find the messaging subsystem section in the standalone-full.xml file:
<subsystem xmlns="urn:jboss:domain:messaging:2.0">
6. Scroll to the end of the messaging subsystem section and add the following XML after the </jms-connection-factories> end tag but before the </hornetq-server> element:
<jms-destinations>
<jms-topic name="testtopic">
<entry name="java:jboss/exported/jms/topic/test"/>
</jms-topic>
</jms-destinations>
– The queue name is entered in <name>.
– The JNDI is entered in <entry name>.
7. Save the changes and close the file using the command :wq!.
8. Navigate back to the bin directory.
9. Start the server by executing the following command:
standalone.sh -c standalone-full.xml
Note::
For Windows, to start the WildFly server execute the following command in the command prompt:
standalone.bat -c standalone-full.xml
The JMS topic is created in WildFly.
Create a JMS Topic for WildFly using Administration Console
To create a topic by accessing the Administration Console from a browser, proceed as follows:
1. Open the welcome screen by entering the URL http://localhost:8080/ in a browser, and click on Administration Console.
2. Alternatively, the Administration Console can also be accessed by entering the URL http://localhost:9990 in a browser.
3. Enter the username and password of the user defined for WildFly.
4. Click on Start, adjacent to Create a JMS Queue.
5. Select Subsystems in the Configuration section, and select Messaging-ActiveMQ in the Subsystem section.
6. Click on default. The Queues/Topic fieldis displayed.
7. Click on Queues/Topic. The Messaging Destinations view opens. Click on the Add button in the Topics tab of the JMS Endpoints: Provider default view.
8. Enter the name of the JMS queue in the Name field e.g. Test_topic.
9. Specify the JNDI Name as java:/jboss/exported/jms/topic/<name of the topic>. For example, java:/jboss/exported/jms/topic/Test_topic.
Note::
A topic which needs to be accessed by a remote client should have an entry in the "java:jboss/exported" namespace.
10. Click on Save. The topic is added and can be viewed in the Topics tab.
Note:
For WildFly 8, in the Administration Console, navigate to messaging>Destinations, then click on view. Now add the queue as described above.
SSL Configuration for WildFly (Optional)
To configure SSL in JBoss proceed as follows:
Note:
If the SSL configuration is already implemented for JBoss, then this configuration can be skipped.
Note:
For JBoss SSL communication the WildFly 8.2.1 version is supported.
Note:
The following procedure is same for both Windows and Linux.
1. Open a Linux CLI and create a folder using the command mkdir SSL.
2. Navigate to SSL directory using the command cd SSL.
3. Execute the following commands one by one.
keytool -genkeypair -alias serverkey -keyalg RSA -keysize 2048 -validity 7360 -keystore server.keystore
keytool -genkeypair -alias clientkey -keyalg RSA -keysize 2048 -validity 7360 -keystore client.keystore
keytool -export -alias serverkey -keystore server.keystore -rfc -file server.crt
keytool -export -alias clientkey -keystore client.keystore -rfc -file client.crt
keytool -import -file server.crt -keystore client.truststore
keytool -import -file client.crt -keystore server.truststore
4. The following files are generated:
a. client
b. client.keystore
c. client.truststore
d. server
e. server.keystore
f. server.truststore
5. Copy the server.keystore and server.truststore generated in the SSL directory to the configuration directory in JBoss. E.g. wildfly8.2\standalone\configuration.
6. Go to the configuration folder and find the standalone-full.xml file. Navigate to the <security-realm name="ApplicationRealm">, then enter the below given configuration with the server.keystore and server.truststore password in the Keystore-password field as shown below:
<server-identities>
<ssl>
<keystore path="server.keystore" relative-to="jboss.server.config.dir" keystore-password="India@123" alias="serverkey" key-password="India@123"/>
</ssl>
</server-identities>
<authentication>
<truststore path="server.truststore" relative-to="jboss.server.config.dir" keystore-password="India@123"/>
.....
</authentication>
7. The section should look something like the screenshot given below:
8. In the <subsystem xmlns="urn:jboss:domain:remoting:2.0"> section add or edit the following configuration er the following example:
<http-connector name="https-remoting-connector" connector-ref="default-https" security-realm="ApplicationRealm"/>
9. The section should look something like the screenshot given below:![]()
10. In the <subsystem xmlns="urn:jboss:domain:undertow:1.2"> section add the following configuration:
<https-listener name="default-https" socket-binding="https" security-realm="ApplicationRealm" verify-client="REQUIRED"/>
11. The section should look something like the screenshot given below:
12. Restart the WildFly service.
The SSL configuration is completed for JBoss server.
Configure WebLogic
WebLogic Configuration
Configuring WebLogic using the Administration Console to function with JMS LAM has following steps:
1. Creating a WebLogic JMS Server.
2. Creating a WebLogic JMS Module.
3. Creating a Subdeployment for a WebLogic JMS Module
4. Creating a WebLogic JMS Connection Factory.
5. Creating a JMS Queue.
6. Creating a JMS Topic.
Create a WebLogic JMS Server
A JMS server is the container that manages JMS queue and topic destinations. A JMS Server can be configured to persist messages, so they can be delivered even if the server instance they were received at went down.
1. Enter the URL http://localhost:7001/console in a browser.The Oracle WebLogic Server Administration Console 12c login page opens.
2. Enter the Username and Password that were defined during the WebLogic installation.The Oracle WebLogic Server Administration Console 12c opens.
3. Expand Services, in the Domain Structure panel on the left, and expand Messaging, then select JMS Servers.
4. Click New in the Summary of JMS Servers view in the right panel to create a new JMS Server.
5. Enter the server name E.g. MyJMSServer in the Name field and click on Next in the JMS Server Properties view of the Create a New JMS Server dialog.
6. Leave the Persistent Store settings view and click Next.
7. Select the target, for example, AdminServer, in the Target field of the Select targets view, and click Finish.

Note:
The server shown in the drop down of the Target field is the server created during installation of WebLogic
The JMS Server is created and can be viewed in the Summary of JMS Servers view.
Create a WebLogic JMS Module
A JMS System Module contains the created queue or topic and the connection factory.
The Oracle WebLogic Server Administration Console 12c is open.
1. In the left-hand panel in Domain Structure, click on JMS Modules under Messaging.
2. Create a new JMS Module by clicking New in the Summary of JMS Modules view.
3. Enter the Name of the module, for example, MyJMSModule, in the Create JMS System Module dialog and click Next.
4. Select the checkbox AdminServer in the target setting view and click Next.
5. Select the check box to add resource to the new JMS System Module and click Finish.
The JMS Module is created and can be viewed in the Summary of JMS Modules view.
Creating a Subdeployment for a WebLogic JMS Module
The Oracle WebLogic Server Administration Console 12c is open.
1. In the left hand panel in Domain Structure, click JMS Modules under Messaging.
2. Click on the JMS Module MyJMSModule in the Summary of JMS Modules view and select the Subdeployments tab. The MyJMSModule was created in the above procedure.
3. Click New, then enter the Subdeployment Name e.g. MySubdeployment in the Create a New Subdeployment dialog and click Next.
4. Select the checkbox MyJMSServer in the target setting view and click Finish.
5. The sub deployment of the JMS Module is created and can be viewed in the Subdeployments tab of the JMS Module.
6. Creating a WebLogic JMS Connection Factory
7. A Connection Factory defines a set of connection configuration parameters that are used to create connections for JMS clients.
8. The Oracle WebLogic Server Administration Console 12c is open.
9. Go to the left hand panel in Domain Structure and click on JMS Modules under Messaging.
10. Click on the JMS Module MyJMSModule in the Summary of JMS Modules view. The MyJMSModule was created in the above procedure.
11. Click on New in the Settings for MyJMSModule dialog.
12. Select the Connection Factory check box from the list of resources and click Next.
13. Enter the name in the Name field. E.g. MyConnectionFactory and JNDI name E.g. jms/MyConnectionFactory in the JNDI Name field, then click Next.
14. The AdminServer is selected by default. Click Finish.

The Connection Factory is created and can be viewed in the Summary of Resources section.
Creating a WebLogic JMS Queue
1. Go to the left hand panel in Domain Structure, click on JMS Modules under Messaging.
2. Click on the JMS Module MyJMSModule in the Summary of JMS Modules view.
3. Click New in the Summary of Resources of the JMS Module MyJMSModule.
4. Select the Queue check box from the list of resources and click Next.
5. Enter the name in the Name field. E.g. MyTestQueue and JNDI name E.g. jms/MyTestQueue in the JNDI Name field, then click Finish.
The Queue is created and can be viewed in the Summary of JMS Modules view.
Creating a WebLogic JMS Topic
1. Go to the left hand panel in Domain Structure, click JMS Modules under Messaging.
2. Click the JMS Module MyJMSModule in the Summary of JMS Modules view.
3. Click New in the Summary of Resources of the JMS Module MyJMSModule.
4. Select the Topic check box from the list of resources and click Next.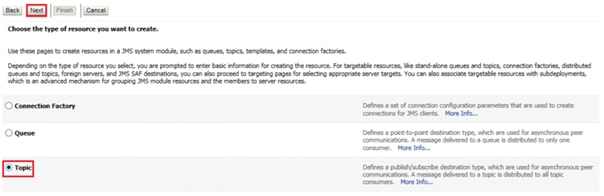
5. Enter the name in the Name field. E.g. MyTestTopic and JNDI name E.g. jms/MyTestTopic in the JNDI Name field, then click Finish.

The Topic is created and can be viewed in the Summary of Resources view of the module.
SSL Configuration for WebLogic (Optional)
To enable SSL communication via queue the SSL configuration is done in the WebLogic. It includes creation of SSL server and client certificates which are used for authentication during communication.
Note:
The following procedure is same for both Windows and Linux
Note:
If the SSL configuration is already implemented for WebLogic, then this configuration can be skipped
To create the certificates:
1. Create a new directory, SSL, in the directory where the Weblogic jar file is stored. For example, navigate to a directory using the command cd setup, then use the command mkdir SSL.
2. Navigate to the newly created directory SSL using the command cd SSL.
3. Enter the command mkdir serverstore and mkdir castore. This creates two new directories in the SSL directory.
Note:
The serverstore directory stores the server certificates, while the castore store directory will store the client certificates
1. Create, sign and install the client certificates by entering the following commands one by one:
cd castore
keytool -genkeypair -keystore castore.jks -storepass welcome1 -alias rootca -keypass welcome1 -keyalg RSA
keytool -certreq -keystore castore.jks -storepass welcome1 -alias rootca -keypass welcome1 -file rootca.csr -v
keytool -gencert -alias rootca -keypass welcome1 -keystore castore.jks -storepass welcome1 -ext BC=2 -rfc -infile rootca.csr -outfile rootca.cer
keytool -importcert -alias rootca -keypass welcome1 -keystore catruststore.jks -storepass welcome1 -file rootca.cer
2. The following files are generated in the castore directory after executing the above commands:
a. castore.jks
b. catruststore.jks
c. rootca
d. rootca.csr
3. Create, sign and install the server certificates enter the following commands one by one:
cd ..
cd serverstore
keytool -genkeypair -keystore server.jks -storepass welcome1 -alias 100bytesServer -keypass welcome1 -keyalg RSA
keytool -certreq -keystore server.jks -storepass welcome1 -alias 100bytesServer -keypass welcome1 -file 100bytesServer.csr -v
keytool -gencert -alias rootca -keypass welcome1 -keystore ../castore/castore.jks -storepass welcome1 -ext BC=2 -rfc -infile 100bytesServer.csr -outfile 100bytesServer.cer
keytool -importcert -alias rootca -keypass welcome1 -keystore server.jks -storepass welcome1 -file ../castore/rootca.cer
keytool -importcert -alias 100bytesServer -keypass welcome1 -keystore server.jks -storepass welcome1 -file 100bytesServer.cer
keytool -importcert -alias rootca -keypass welcome1 -keystore servertruststore.jks -storepass welcome1 -file ../castore/rootca.cer
Note:
The path given in the commands above is for Linux, for windows you have to replace "/" with "\"
4. The following files are generated in the serverstore directory after executing the above commands:
a. 100bytesServer
b. 100bytesServer.csr
c. server.jks
d. servertruststore.jks
5. Enter the URL http://localhost:7001/console in a browser.The Oracle WebLogic Server Administration Console 12c login page opens.
6. Enter the Username and Password defined during the WebLogic installation. The Oracle WebLogic Server Administration Console 12c opens.
7. Go the left hand panel Domain Structure and click on Servers under Environment.
8. Go to the Summary of Servers page in the right panel and click on the listed server E.g. AdminServer.
9. Go to the General tab of the Settings for AdminServer, select the check box SSL Listen Port Enabled and enter 7002 in SSL Listen Port. TheListen Port Enabled is already selected and 7001 is entered in the Listen Port field.
10. Go to the Keystore tab of the Settings for AdminServer, click Change.
11. Select Custom Identity and Custom Trust in Keystores dropdown, then click Save.
12. Enter the following parameters:
a. Custom Identity Keystore: The path of the server.jks file created after running SSL configuration commands. E.g. setup/ssl/serverstore/server.jks
b. Custom Identity Keystore Type: jks
c. Custom Identity Keystore Passphrase: The keypass used in the commands. E.g. welcome1
d. Custom Trust Keystore: The path of the serverstore.jks file created after running SSL configuration commands . E.g. setup/ssl/serverstore/servertruststore.jks
e. Custom Trust Keystore Type: jks
f. Custom Trust Keystore Passphrase: The keypass used in the commands. E.g. welcome1
g. Confirm Custom Identity Keystore Passphrase and Confirm Custom Trust Keystore Passphrase: Enter the same keypass
13. Go to the SSL tab of the Settings for AdminServer and set the following parameters:
a. Private Key Alias: The alias used in the commands. E.g. 100bytesServer
b. Private Key Passphrase: The keypass used in the commands. E.g. welcome1
c. Confirm Private Key Passphrase: The keypass used in the commands. E.g. welcome1
The SSL configuration is completed for WebLogic.
Lenovo XClarity LAM
The Lenovo XClarity LAM allows you to retrieve data from Lenovo XClarity and send them to Cisco Crosswork Situation Manager as events.
See the Lenovo XClarity documentation for information on XClarity components.
There is no UI integration for Lenovo XClarity. See Configure the Lenovo XClarity LAM for configuration instructions.
Configure the Lenovo XClarity LAM
Lenovo XClarity is an Infrastructure Monitoring Application which monitors network, server, storage, power devices, etc. It is a distributed software that monitors the IT environment and generate events based on data which has been exposed with rest APIs or from third parties. This document describes the configurations required to establish a connection between the Lenovo XClarity application and the XClarity LAM.
The workflow for gathering events from an XClarity server, and publishing it to Cisco Crosswork Situation Manager is as follows:
1. The LAM reads configuration from given xclarity_lam.conf file.
2. The LAM connects with the host and sends the GET REST request based on uri provided in LAM Config.
3. The event data of all the devices monitored in XClarity is received by the LAM as a response. The format of received events is JSON.
4. If filter variable in monitor section is set, then LAM will filter the events based on the filter criteria set in the config file.
5. The LAM parses the events and then publishes it to the MooMS bus.
6. The unmapped event data is sent to the overflow variable.
7. The events are published to the subject “Events”.
Note:
HTTP/HTTPS request with basic user authentication is used in the XClarity LAM.
XClarity LAM Configuration
The events received from the XClarity server are processed according to the configurations in the xclarity_lam.conf file. The processed events are published to Cisco Crosswork Situation Manager.
The configuration file contains a JSON object. At the first layer of the object, LAM has a parameter called config, and the object that follows config has all the necessary information to control the LAM.
Monitor
The XClarity LAM fetches the events from the XClarity Rest Server. You can configure parameters here to establish a connection with XClarity:
General
| Field |
Type |
Description |
| name and class |
String |
Reserved fields: do not change. Default values are Xclarity Lam Monitor and CXclarityMonitor. |
| host_name |
String |
Enter the hostname/IP address/FQDN address of xclarity server. Its default value is localhost. |
| uri |
String |
This is the XClarity URI that will be used to fetch events. The following two URI's are available: events: Enter this to fetch events available in the event log. events/audit: Enter this to fetch events available in the audit log. Note To fetch events from both the logs, i.e. event log and audit log of the XClarity Server, enter both the URI in the uri field. Only events will be fetched by default. If you want to audit logs, then you have to mention the uri for that as well. |
| user_name |
String |
Enter the username of XClarity users who have the privileges to fetch events. |
| password |
String |
Enter the password of XClarity users who have the privileges to fetch events. |
| encrypted_password |
String |
If the password is encrypted, then enter the encrypted password in this field and comment out the password field. At a time, either password or the encrypted_password field is used. If both the fields are not commented, then the field encrypted_password will be used by the XClarity LAM. |
| polling_interval |
Integer |
The polling time interval, in seconds, between the requests after which the event data is fetched from XClarity LAM. Default = 10 seconds. If specified value is less than 1, the time interval will set to 10 seconds. |
| max_retries |
Integer |
The maximum number of retry attempts to reconnect with XClarity Server in case of a connection failure. Default = -1, if no value is specified, then there will be infinite retry attempts. If the specified value is greater than 0, then the LAM will try that many times to reconnect; in case of 0 or any other value less than 0, max retries will set to default. |
| retry_interval |
Integer |
The time interval between two successive retry attempts. Default = 60 seconds. If specified value is less than 1, the retry_interval will set to default. |
| timeout |
Integer |
This is the timeout value in seconds, which will be used to timeout a connection, socket and request. If no value is specified, then the timeout will set to 120 seconds. |
| events_date_format |
String |
This is the date/time format of the event received in response . The possible value would be like "yyyy-MM-dd HH:mm:ss", "yyyy-MM-dd'T'HH:mm:ss'Z'", etc. If this value is set to blank, then event date/time will be epoch time. |
Filter
| Field |
Sub Field |
Type |
Description |
| filter |
filter_type |
Object |
Enter true here to enable filters. The following filters are used in combination to filter out the received events: filter_type is the type of filter that has to be used for XClarity events. Here the events will be filtered on the basis of comparisons done on the event fields. The filter criteria is defined by using thefilter_comparison_operator, filter_field_names and filter_field_values fields. The filter_type field defines the type of a filter used. Either a regular expression filter or a non regular expression filter (operators) is used for filtering. Regular Expression filter types FIELDREGEXAND: Regular expression filter of type AND. This will filter only those events which meets the condition of filter criteria. FIELDREGEXOR: Regular expression of type OR. This will filter those events which meets any one of the condition of filter criteria. FIELDREGEXNOT: Regular expression of type NOT. This will filter those events which do not meet the filter criteria. Non-Regular Expression filter types FIELDNOTREGEXAND: Non-Regular Expression filter of type AND. This will filter only those events which meets the condition of filter criteria. FIELDNOTREGEXOR: Non-Regular Expression filter of type OR. This will filter those events which meets any one of the condition of filter criteria. FIELDNOTREGEXNOT: Non-Regular Expression filter of type NOT. This will filter those events which do not meet the filter criteria. |
|
|
filter_comparison_operators |
Integer |
When you are using non-Regular Expression filter type, then this field will be used. The operators that will be used for comparing event field values are: EQ: Equal To operator GT: Greater Than operator GTE: Greater Than Equal To operator LT: Less Than operator LTE: Less Than Equal To operator NOT: NOT operator |
|
|
filter_field_names |
String |
Enter the event fields on the basis of which events are filtered. You can also enter multiple fields here. |
|
|
filter_field_values |
String |
Enter the value by which event fields value will be compared.The sequence of field names infilter_field_names, and the corresponding values with which the field values will be compared in filter_field_values, should be same. If field names and field values are not defined in the correct sequence, then events will be filtered incorrectly. |
Secure Sockets Layer
| Field |
Type |
Description |
| ssl |
Boolean |
Enter true here, to enable SSL Communication: ssl_keystore_file_path: Enter the path of the XClarity keystore certificate. This is the path where the generated keystore file is copied in Cisco Crosswork Situation Manager, e.g. "usr/share/moogsoft/xclarity/Keystore/KeyStore.jks". ssl_keystore_password: Enter the password of XClarity keystore certificate. It is the same password that was entered when the keystore was generated. |
The following table lists the fields which are included in an event and the operators which can be used on a field:
| CN |
EQ |
GT |
GTE |
LT |
LTE |
NOT |
| userID |
X |
|
|
|
|
X |
| eventClass |
X |
X |
X |
X |
X |
X |
| severity |
X |
X |
X |
X |
X |
X |
| timeStamp |
X |
X |
X |
X |
X |
X |
| sourceID |
X |
X |
X |
X |
X |
X |
| sourceLogSequence |
X |
X |
X |
X |
X |
X |
| localLogID |
X |
X |
X |
X |
X |
X |
| localLogSequence |
X |
X |
X |
X |
X |
X |
| eventID |
X |
|
|
|
|
X |
| eventDate |
X |
X |
X |
X |
X |
X |
| args |
X |
|
|
|
|
X |
| msgID |
X |
|
|
|
|
X |
| msg |
X |
|
|
|
|
X |
| serialnum |
X |
|
|
|
|
X |
| mtm |
X |
|
|
|
|
X |
| service |
X |
X |
X |
X |
X |
X |
| action |
X |
X |
X |
X |
X |
X |
| location |
X |
|
|
|
|
X |
| failSNs |
X |
|
|
|
|
X |
| failFRUs |
X |
|
|
|
|
X |
| componentID |
X |
X |
X |
X |
X |
X |
| search |
X |
X |
X |
X |
X |
X |
Note:
In the above table, "X" indicates that this operator can be used with this field.
Example
Config File
monitor:
{
name : "Xclarity Lam Monitor",
class : "CXclarityMonitor",
host_name : "localhost",
uri : [
"events",
],
user_name : "username",
password : "password",
#encrypted_password : "ieytOFRUdLpZx53nijEw0rOh07VEr8w9lBxdCc7229o=",
ssl : false,
ssl_keystore_file_path : "KeyStore.jks",
ssl_keystore_password : "password",
polling_interval : 10,
max_retries : -1,
retry_interval : 60,
timeout : 120,
events_date_format : "yyyy-MM-dd'T'HH:mm:ss'Z'",
filter : "false",
filter_type : "FIELDREGEXAND",
filter_comparison_operators : [
"EQ"
],
filter_field_names : [
"cn"
],
filter_field_values : [
""
]
},
Note:
The entry in the fields polling_interval, max_retries, retry_interval andtimeout should be an integer, and hence, enter values in these fields without quotation marks.
Examples of filter criteria:
Example 1: Non-regular Expression filtering with all event fields.
filter : "true",
filter_type : "FIELDNOTREGEXOR",
filter_comparison_operators : "EQ",
filter_field_names : "cn",
filter_field_values : "1",
Here the FIELDNOTREGEXOR filter type is used. Since "cn" is entered in the field filter_field_names, all the fields of an event will be compared with the value "1" in the field filter_field_values. If any of the field has value equal to "1", then events will be filtered and processed by the LAM.
Example 2: Non-regular Expression filtering with selected event fields.
filter : "true",
filter_type : "FIELDNOTREGEXOR",
filter_comparison_operators : [
"LT",
"GT"
],
filter_field_names : [
"severity",
"timeStamp"
],
filter_field_values : [
"200",
"2016-11-07T16:01:03Z"
],
Here the FIELDNOTREGEXOR filter type is used. Only two fields of an event are entered in the filter_field_names, and the filter_comparison_operators field also has two operators defined for each event field in filter_field_names. Therefore, the events with severity less than "200" or time stamp greater than "2016-11-07T16:01:03Z" will be filtered and processed by the LAM.
Note:
There should be an operator present for each field of event entered in filter_field_names, else it will throw an error.
Note:
The operators entered for a field in filter_comparison_operators should be compatible with the field for which it will be used.
Note:
The entries in the fields filter_comparison_operators, filter_field_names and filter_field_values must correspond to the positions of entries. For example, the event field at position 1 of filter_field_names will be compared with the value at position 1 of filter_field_values by using the operator at position 1 of filter_comparison_operators.
Example 3: Regular Expression filtering with selected event fields.
filter : "true",
filter_type : "FIELDREGEXOR",
filter_field_names : [
"severity",
"timeStamp"
],
filter_field_values : [
"200",
"2016-11-07T16:01:03Z"
],
Here the FIELDREGEXOR filter type is used. The operators do not work with a regular expression filter. The events with severity equal to "200" or time stamp equal to "2016-11-07T16:01:03Z" will be filtered and processed by the LAM.
Agent and Process Log
Agent and Process Log allow you to define the following properties:
· name: Identifies events the LAM sends to the Message Bus.
· capture_log: Name and location of the LAM's capture log file.
· configuration_file: Name and location of the LAM's process log configuration file.
Mapping
Variables section is not required in the XClarity LAM, you can directly map the event's field of XClarity with Cisco Crosswork Situation Manager fields. The parameters of the received events are displayed in the Cisco Crosswork Situation Manager according to the mapping done here:
mapping :
{
catchAll: "overflow",
rules:
[
{ name: "signature", rule: "$eventID" },
{ name: "source_id", rule: "$sourceID" },
{ name: "external_id", rule: "$componentID" },
{ name: "manager", rule: "XClarity" },
{ name: "source", rule: "$systemName" },
{ name: "class", rule: "$typeText" },
{ name: "agent", rule: "$LamInstanceName" },
{ name: "agent_location", rule: "$LamInstanceName" },
{ name: "type", rule: "$typeText" },
{ name: "severity", rule: "$severityText", conversion: "sevConverter" },
{ name: "description", rule: "$msg" },
{ name: "agent_time", rule: "$eventDate", conversion: "timeConverter"}
]
},
filter:
{
presend: "XclarityLam.js"
}
In the above example, the signature field is used by the LAM to identify the correlated events, it is mapped to eventID here. However, you can also change it as per the requirement. Data not mapped to Cisco Crosswork Situation Manager Fields goes into "Custom Info".
You can define number of these rules covering the base attribute of an event.
Constants and Conversions
| Field |
Description |
Example |
| Severity and sevConverter |
has a conversion defined as sevConverter in the Conversions section, this looks up the value of severity defined in the severity section of constants and returns back the mapped integer corresponding to the severity |
severity: { "OK" : 0, } sevConverter: {
|
| stringToInt |
used in a conversion, which forces the system to turn a string token into an integer value |
stringToInt: |
| timeConverter |
used in conversion which forces the system to convert time. If epoch time is to be used, then timeFormat mentioned in timeConverter should be commented. Otherwise, the user should provide the timeFormat |
timeConverter: |
Example
Example Constants and Conversions
constants:
{
severity:
{
"OK" : 0,
"Informational" : 1,
"Warning" : 2,
"Minor" : 3,
"Major" : 4,
"Critical" : 5,
"Fatal" : 5,
"Error" : 5
}
},
conversions:
{
sevConverter:
{
lookup: "severity",
input: "STRING",
output: "INTEGER"
},
stringToInt:
{
input: "STRING",
output: "INTEGER"
},
timeConverter:
{
timeFormat: "yyyy-MM-dd'T'HH:mm:ss",
input: "STRING",
output: "INTEGER"
}
},
Severity Reference
Cisco Crosswork Situation Manager Severity Levels
severity:
{
"CLEAR" : 0,
"INDETERMINATE" : 1,
"WARNING" : 2,
"MINOR" : 3,
"MAJOR" : 4,
"CRITICAL" : 5,
}
| Level |
Description |
| 0 |
Clear |
| 1 |
Indeterminate |
| 2 |
Warning |
| 3 |
Minor |
| 4 |
Major |
| 5 |
Critical |
Service Operation Reference
| Process Name |
Service Name |
| xclarity_lam |
xclaritylamd |
Start the LAM Service:
service xclaritylamd start
Stop the LAM Service:
service xclaritylamd stop
Check the LAM Service status:
service xclaritylamd status
Command Line Reference
To see the available optional attributes of the XClarity_lam, run the following command:
xclarity_lam --help
The xclarity_lam is a command line executable, and has the following optional attributes:
| Option |
Description |
| --config |
Points to a pathname to find the configuration file for the LAM. This is where the entire configuration for the LAM is specified. |
| --help |
Displays all the command line options. |
| --version |
Displays the component’s version number. |
| --loglevel |
Specifies the level of debugging. By default, user gets everything. In common with all executables in Cisco Crosswork Situation Manager, having it set at that level can result in a lot of output (many messages per event message processed). In all production implementations, it is recommended that log level is set to WARN. This ensures only warning, error and fatal messages are recorded. |
Logfile LAM
The Logfile LAM alllows you to parse data in log files and send it to Cisco Crosswork Situation Manager as events.
You can use the Logfile LAM to ingest data from applications that do not provide another way to integrate with Cisco Crosswork Situation Manager, for example via a webhook. You can also use it to harvest additional information from an application that integrates with Cisco Crosswork Situation Manager.
There is no UI integration for the Logfile LAM. See Configure the Logfile LAM for configuration instructions.
Configure the Logfile LAM
The Logfile LAM allows you to parse data in log files and send it to Cisco Crosswork Situation Manager as events.
There is no UI integration for the Logfile LAM. Follow these instructions to configure the LAM.
Before You Begin
Before you configure the Logfile LAM, ensure you have met the following requirements:
· You know the location of the log files you want to parse.
· You know the format of the log file names.
· The log files are accessible from Cisco Crosswork Situation Manager.
If you are configuring the Logfile LAM for high availability, refer to /document/preview/77155#UUIDbea404d9dd1afee65fa1471105d1b3c6 first. You will need the details of the server configuration you are going to use for HA.High Availability Overview
Configure the LAM
Edit the configuration file to control the behavior of the Logfile LAM. You can find the file at $MOOGSOFT_HOME/config/logfile_lam.conf
See the Logfile LAM Reference and LAM and Integration Reference for a full description of all properties. Some properties in the file are commented out by default. Uncomment properties to enable them.
1. Configure the location and format of the target log file name:
a. target: Path and file name of the target log file.
b. date_format: Format of the date if present in the target log file name.
2. Configure the log file processing:
a. load_at_start: Whether the LAM processes the contents of the target file at startup then waits for additional data to be written to the file.
b. exit_after_initial_load: Whether the LAM processes the contents of the target file and then exits.
3. Configure the LAM behavior:
a. event_ack_mode: When Moogfarmd acknowledges events from the Logfile LAM during the event processing pipeline.
b. num_threads: Number of worker threads to use when processing events.
4. Optionally configure the LAM identification and logging details in the agent and log_config sections of the file:
a. name: Identifies events the LAM sends to the Message Bus. Defaults to Logfile.
b. configuration_file: Name and location of the LAM's process log configuration file.
5. Optionally configure severity conversion. See /document/preview/11721#UUID8b183a1e1278a7a652d3ae86944d7379 for further information and "Conversion Rules" in /document/preview/11720#UUID5c67156b667b1a28ec648cd779393914 for details on conversions in general.Severity ReferenceData Parsing
Example
The following example demonstrates a Logfile LAM configuration.
monitor:
{
target : "/var/log/system-07-27-2018.log",
date_format : "MM-dd-yyyy",
load_at_start : true,
exit_after_initial_load : false,
event_ack_mode : "queued_for_processing",
num_threads : 5
},
agent:
{
name : "Logfile"
},
log_config:
{
configuration_file : "$MOOGSOFT_HOME/config/logging/logfile_lam_log.json"
},
Configure for High Availability
Configure the Logfile LAM for high availability if required. See /document/preview/77155#UUIDbea404d9dd1afee65fa1471105d1b3c6 for details.High Availability Overview
Configure Parsing and Mapping
You configure parsing to break the log file up into tokens that Cisco Crosswork Situation Manager uses to assemble events. You can also map parsed parameters to alert fields.
See /document/preview/11720#UUID5c67156b667b1a28ec648cd779393914 for further information and examples.Data Parsing
Configure the LAMbot
The Logfile LAMbot processes and filters events before sending them to the Message Bus. You can customize or bypass this processing if required. You can also load JavaScript files into the LAMbot and execute them.
See LAMbot Configuration for more information. An example Logfile LAM filter configuration is shown below.
filter:
{
presend: "LogfileLam.js"
}
Start and Stop the LAM
Restart the Logfile LAM to activate any changes you make to the configuration file or LAMbot.
The LAM service name is logfilelamd.
See /document/preview/11677#UUID1a2205c3aae40b26fdfe94490043f3c3 for further details.Control Processes
Logfile LAM Reference
This is a reference for the Logfile LAM. The Logfile LAM configuration file is located at $MOOGSOFT_HOME/config/logfile_lam.conf.
The following properties are unique to the Logfile LAM.
See the LAM and Integration Reference for a full description of all common properties used to configure LAMs.
target
The path and file name of the target log file.
Type: String
Required: Yes
Default: N/A
Example:
target: "/tmp/test.log"
date_format
The format of the date if it's present in the target log file name. See the SimpleDateFormat definition for information on date and time patterns.
Type: String
Required: No
Default: N/A
Examples:
date_format: dd-MM-yyyy-HH-mm-ss
date_format: yyyy-MM-dd-HH-mm-ss
date_format: dd-MM-yyyy, yyyy-MM-dd
load_at_start
Determines whether the LAM processes the contents of the target file at startup then waits for additional data to be written to the file.
Type: Boolean
Required: No
Default: True
exit_after_initial_load
Determines whether the LAM processes the contents of the target file and then exits. This is useful if you are bulk-loading data into Cisco Crosswork Situation Manager for analysis.
Type: Boolean
Required: No
Default: False
Microsoft
You can integrate Cisco Crosswork Situation Manager with the following Microsoft products:
· Microsoft Azure: Install either the Azure integration to collect event data from Azure monitor, or the Azure Classic integration to ingest from Azure.
· Microsoft SCOM: Install the Microsoft SCOM integration to collect event data from Microsoft System Center Operations Manager.
· Microsoft Teams: Install the Microsoft Teams integration to manually send messages about Cisco Crosswork Situation Manager alerts and Situations to one or more Teams channels.
· Office 365 Email: Install the Office 365 Email integration to retrieve emails using the Microsoft Graph API to connect to Office 365 accounts and send them to Cisco Crosswork Situation Manager as events.
Microsoft Azure
You can use the Integrations UI to integrate Cisco Crosswork Situation Manager with Microsoft Azure using one of the following integrations:
· Azure
Choose the integration based upon the type of alert you use in Microsoft Azure. The Azure Classic integration applies to the following types of alerts in Azure:
· Alerts (classic)
· Metric alerts (classic)
The Azure integration works for Azure Monitor alerts from both Microsoft Azure Cloud and Azure Stack deployments.
Azure
You can set up the Azure integration to ingest alert data from Azure Monitor. The integration provides an endpoint destination for webhook notifications from alerts on your Azure resource. If you are using classic alerts, see Azure Classic.
When you use the integrations UI, you can only configure the visible properties. If you want to implement a more complex Azure LAM with custom settings, see Configure the Azure LAM.
See the Microsoft Azure documentation for details on Azure components.
Before You Begin
The Azure integration has been validated with Microsoft Azure Monitor 2018. Before you start to set up your integration, ensure you have met the following requirements:
· You have an active Microsoft Azure account.
· You know how to configure alerts in Microsoft Azure Monitor, including how to define a webhook notification.
· Your Azure resource can make requests to external endpoints over port 443.
Configure the Azure Monitor Integration
To configure the Azure integration:
1. Navigate to the Integrations tab.
2. Click Azure in the Monitoring section.
3. Provide a unique integration name. You can use the default name or customize the name according to your requirements.
Configure Azure
Log in to Microsoft Azure to configure a webhook action type in the action groups for all alert rules that send event data to your system. For more help, see the Microsoft Azure documentation.
1. Configure a webhook action type with the following details in the action group for your rule:
| Field |
Value |
| Action Name |
Send to Cisco Crosswork Situation Manager |
| Action Type |
Webhook |
| URI |
<your Azure Monitor integration URL> For example: https://example.Cisco.com/events/azure_azure1 |
When Azure detects alerts matching the Monitor alert rules, it automatically notifies Cisco Crosswork Situation Manager using the webhook action.
Configure the Azure LAM
The Azure LAM is an endpoint for webhook notifications from Microsoft Azure Monitor alerts. The LAM parses the JSON events from Azure into Cisco Crosswork Situation Manager events.
You can install a basic Azure Monitor integration in the UI. See Azure for integration steps. Configure the Azure Monitor LAM if you want to configure custom properties, set up high availability or configure advanced options that are not available in the UI integration.
Before You Begin
The Azure integration has been validated with Microsoft Azure Monitor v. 2018. Before you configure the Azure Monitor LAM, ensure you have met the following requirements:
· You have an active Microsoft Azure account.
· You know how to configure alerts in Microsoft Azure Monitor, including how to define a webhook notification.
· Your Azure resource can make requests to external endpoints over port 443.
If you are configuring a distributed deployment refer to /document/preview/77155#UUIDbea404d9dd1afee65fa1471105d1b3c6 first. You will need the details of the server configuration you are going to use for HA.High Availability Overview
Configure the LAM
Edit the configuration file to control the behavior of the Azure LAM. You can find the file at $MOOGSOFT_HOME/config/azure_lam.conf.
The Azure LAM is a REST-based LAM as it provides an HTTP endpoint for data ingestion. Note that only the generic REST LAM properties in azure_lam.conf apply to the Azure LAM; see the LAM and Integration Reference for a full description of all properties.
Some properties in the file are commented out by default. Uncomment properties to enable them.
1. Configure the properties for the REST connection:
a. port: Port on the Cisco Crosswork Situation Manager server that listens for Azure Monitor messages. Defaults to 48020.
b. address: Address on the Cisco Crosswork Situation Manager server that listens for REST messages. Defaults to all interfaces.
2. Configure the SSL properties if you want to encrypt communications between the LAM and the REST connection:
a. use_ssl: Whether to use SSL certification.
b. path_to_ssl_files: Path to the directory that contains the SSL certificates.
c. ssl_key_filename: The SSL server key file.
d. ssl_cert_filename: The SSL root CA file.
e. ssl_protocols: Sets the allowed SSL protocols.
3. Configure the LAM behavior:
a. num_threads: Number of worker threads to use when processing events.
b. rest_response_mode: When to send a REST response. See the LAM and Integration Reference for the options.
c. rpc_response_timeout: Number of seconds to wait for a REST response.
d. event_ack_mode: When Moogfarmd acknowledges events from the REST LAM during the event processing pipeline.
e. accept_all_json: Allows the LAM to read and process all forms of JSON.
f. lists_contain_multiple_events: Whether Cisco Crosswork Situation Manager interprets a JSON list as multiple events.
4. Optionally configure the LAM identification and logging details in the agent and log_config sections of the file:
a. name: Identifies events the LAM sends to the Message Bus.
b. capture_log: Name and location of the LAM's capture log file.
c. configuration_file: Name and location of the LAM's process log configuration file.
5. Optionally configure severity conversions. See /document/preview/11721#UUID8b183a1e1278a7a652d3ae86944d7379 for further information and "Conversion Rules" in /document/preview/11720#UUID5c67156b667b1a28ec648cd779393914 for details on conversions in general.Severity ReferenceData Parsing
Unsupported Properties
Windows Azure Monitor alerts do not support client authentication. Do not uncomment or change the following properties:
· use_client_certificates
· client_ca_filename
· auth_token or encrypted_auth_token
· header_auth_token or encrypted_header_auth_token
· authentication_type
· authentication_cache
Example
The following example demonstrates an Azure LAM configuration.
monitor:
{
name : "Azure LAM",
class : "CRestMonitor",
port : 48018,
address : "0.0.0.0",
use_ssl : false,
#path_to_ssl_files : "config",
#ssl_key_filename : "server.key",
#ssl_cert_filename : "server.pem",
#use_client_certificates : false,
#client_ca_filename : "ca.crt",
#auth_token : "my_secret",
#encrypted_auth_token : "dfJtTQMGiFHfiq7sCmxguBt6Jv+eytkoiKCquSB/7iWxpgGsG2aez3z2j7SuBtKj",
#header_auth_token : "my_secret",
#encrypted_header_auth_token : "dfJtTQMGiFHfiq7sCmxguBt6Jv+eytkoiKCquSB/7iWxpgGsG2aez3z2j7SuBtKj",
#ssl_protocols : "TLSv1.2"
authentication_type : "none",
authentication_cache : true,
accept_all_json : true,
lists_contain_multiple_events : true,
num_threads : 5,
rest_response_mode : "on_receipt",
rpc_response_timeout : 20,
event_ack_mode : "queued_for_processing"
},
agent:
{
name : "Azure",
capture_log : "$MOOGSOFT_HOME/log/data-capture/azure_lam.log"
},
log_config:
{
configuration_file : "$MOOGSOFT_HOME/config/logging/azure_lam_log.json"
},
Configure for High Availability
Configure the Azure Monitor LAM for high availability if required. See Integrations HA Configuration for details.
Configure LAMbot Processing
The Azure LAMbot processes and filters events before sending them to the Message Bus. You can customize or bypass this processing if required. You can also load JavaScript files into the LAMbot and execute them.
See LAMbot Configuration for more information. An example Azure LAM filter configuration is shown below:
filter:
{
presend: "AzureLam.js",
modules: [ "CommonUtils.js" ]
}
Map LAM Properties
By default the following Azure Monitor event properties map to the following Cisco Crosswork Situation Manager Azure Monitor LAM properties. You can configure custom mappings in the Azure Monitor LAMbot.
| Azure Monitor Event Property |
Azure Monitor LAM Event Property |
| context.resourceGroupName::context.resourceType: :context.resourceName::context.name |
signature |
| context.resourceId |
source_id |
| context.id |
external_id |
| context.resourceGroupName |
manager |
| context.resourceName |
source |
| context.resourceType |
class |
| Azure LAM |
agent |
| context.conditionType |
type |
| 2 |
severity |
| context.name - context.description |
description |
| context.timestamp |
agent_time |
The overflow properties are mapped to "custom info" and appear under Overflow in Cisco Crosswork Situation Manager alerts:
| Azure Monitor Event Property |
Azure Monitor LAM Monitor Property |
| data |
eventDetails.data |
| schemaid |
eventDetails.schemaid |
Start and Stop the LAM
Restart the Azure Monitor LAM to activate any changes you make to the configuration file or LAMbot.
The LAM service name is azurelamd.
See /document/preview/11677#UUID1a2205c3aae40b26fdfe94490043f3c3 for the commands to start, stop and restart the LAM.Control Processes
You can use a GET request to check the status of the Azure Monitor LAM. See "Check the LAM Status" in Configure the REST LAM for further information and examples.
Configure Azure
After you have the Azure Monitor LAM running and listening for incoming requests, you can configure a webhook in Azure. See "Configure Azure" in Azure.
Azure Classic
You can set up the Azure Classic integration to ingest alert data from Azure. The integration provides an endpoint destination for webhook notifications from classic alerts on your Azure resource. If you use Azure Monitor, see Azure.
When you use the integrations UI, you can only configure the visible properties. If you want to implement a more complex Azure Classic LAM with custom settings, see Configure the Azure Classic LAM.
See the Microsoft Azure documentation for details on Azure components.
Before You Begin
The Azure Classic integration has been validated with Microsoft Azure Classic 2018. Before you start to set up your integration, ensure you have met the following requirements:
· You have an active Microsoft Azure account.
· You know how to configure classic alerts in Microsoft Azure, including how to define a webhook notification.
· Your Azure resource can make requests to external endpoints over port 443.
Configure the Azure Classic Integration
To configure the Azure Classic integration:
1. Navigate to the Integrations tab.
2. Click Azure Classic in the Monitoring section.
3. Provide a unique integration name. You can use the default name or customize the name according to your needs.
Configure Azure
Log in to Microsoft Azure to configure a webhook notification on your classic alert to send event data to your system. For more help, see the Microsoft Azure documentation.
1. Configure a webhook connection in a classic alert rule with the following details. You can create a new rule or add the webhook to an existing rule.:
| Field |
Value |
| Webhook |
<your Azure Classic integration URL> For example: https://example.Cisco.com/events/azure_classic_azureclassic1 |
2. Configure the webhook in every classic alert rule and metric alert rule that you want to send alert data to your system.
When Azure detects alerts matching the classic alert rules, it automatically notifies Cisco Crosswork Situation Manager over the webhook notification channel.
Configure the Azure Classic LAM
The Azure Classic LAM is an endpoint for webhook notifications from Microsoft Azure classic alerts. The LAM parses the JSON events from Azure into Cisco Crosswork Situation Manager events.
You can install a basic Azure Classic integration in the UI. See Azure Classic for integration steps.
Configure the Azure Classic LAM if you want to configure custom properties, set up high availability or configure advanced options that are not available in the UI integration.
Before You Begin
The Azure Classic integration has been validated with Microsoft Azure Classic 2018. Before you configure the Azure Classic LAM, ensure you have met the following requirements:
· You have an active Microsoft Azure account.
· You know how to configure classic alerts in Microsoft Azure, including how to define a webhook notification.
· Your Azure resource can make requests to external endpoints over port 443.
If you are configuring a distributed deployment refer to /document/preview/77155#UUIDbea404d9dd1afee65fa1471105d1b3c6 first. You will need the details of the server configuration you are going to use for HA.High Availability Overview
Configure the LAM
Edit the configuration file to control the behavior of the Azure Classic LAM. You can find the file at $MOOGSOFT_HOME/config/azure_classic_lam.conf.
The Azure Classic LAM is a REST-based LAM as it provides an HTTP endpoint for data ingestion. Note that only the generic REST LAM properties in azure_classic_lam.conf apply to the Azure Classic LAM; see the LAM and Integration Reference for a full description of all properties.
Some properties in the file are commented out by default. Uncomment properties to enable them.
1. Configure the properties for the REST connection:
a. address: Address on the Cisco Crosswork Situation Manager server that listens for REST messages. Defaults to all interfaces.
b. port: Port on the Cisco Crosswork Situation Manager server that listens for Azure Classic messages. Defaults to 48018.
2. Configure the SSL properties if you want to encrypt communications between the LAM and the REST connection:
a. use_ssl: Whether to use SSL certification.
b. path_to_ssl_files: Path to the directory that contains the SSL certificates.
c. ssl_key_filename: The SSL server key file.
d. ssl_cert_filename: The SSL root CA file.
e. ssl_protocols: Sets the allowed SSL protocols.
3. Configure the LAM behavior:
a. num_threads: Number of worker threads to use when processing requests.
b. rest_response_mode: When to send a REST response. See the LAM and Integration Reference for the options.
c. rpc_response_timeout: Number of seconds to wait for a REST response.
d. event_ack_mode: When Moogfarmd acknowledges events from the REST LAM during the event processing pipeline.
e. accept_all_json: Allows the LAM to read and process all forms of JSON.
f. lists_contain_multiple_events: Whether Cisco Crosswork Situation Manager interprets a JSON list as multiple events.
4. Optionally configure the LAM identification and logging details in the agent and log_config sections of the file:
a. name: Identifies events the LAM sends to the Message Bus.
b. capture_log: Name and location of the LAM's log file.
c. configuration_file: Name and location of the LAM's process log configuration file.
5. Optionally configure severity conversions. See /document/preview/11721#UUID8b183a1e1278a7a652d3ae86944d7379 for further information and "Conversion Rules" in /document/preview/11720#UUID5c67156b667b1a28ec648cd779393914 for details on conversions in general.Severity ReferenceData Parsing
Unsupported Properties
Windows Azure classic alerts do not support client authentication. Do not uncomment or change the following properties:
· use_client_certificates
· client_ca_filename
· auth_token or encrypted_auth_token
· header_auth_token or encrypted_header_auth_token
· authentication_type
· authentication_cache
Example
The following example demonstrates an Azure Classic LAM configuration.
monitor:
{
name : "Azure Classic LAM",
class : "CRestMonitor",
port : 48018,
address : "0.0.0.0",
use_ssl : false,
#path_to_ssl_files : "config",
#ssl_key_filename : "server.key",
#ssl_cert_filename : "server.pem",
#use_client_certificates : false,
#client_ca_filename : "ca.crt",
#auth_token : "my_secret",
#encrypted_auth_token : "dfJtTQMGiFHfiq7sCmxguBt6Jv+eytkoiKCquSB/7iWxpgGsG2aez3z2j7SuBtKj",
#header_auth_token : "my_secret",
#encrypted_header_auth_token : "dfJtTQMGiFHfiq7sCmxguBt6Jv+eytkoiKCquSB/7iWxpgGsG2aez3z2j7SuBtKj",
#ssl_protocols : [ "TLSv1.2" ],
authentication_type : "none",
authentication_cache : true,
accept_all_json : true,
lists_contain_multiple_events : true,
num_threads : 5,
rest_response_mode : "on_receipt",
rpc_response_timeout : 20,
event_ack_mode : "queued_for_processing"
},
agent:
{
name : "Azure (Classic)",
capture_log : "$MOOGSOFT_HOME/log/data-capture/azure_classic_lam.log"
},
log_config:
{
configuration_file : "$MOOGSOFT_HOME/config/logging/azure_classic_lam_log.json"
},
Configure for High Availability
Configure the Azure Classic LAM for high availability if required. See /document/preview/77155#UUIDbea404d9dd1afee65fa1471105d1b3c6 for details.High Availability Overview
Configure LAMbot Processing
The Azure Classic LAMbot processes and filters events before sending them to the Message Bus. You can customize or bypass this processing if required. You can also load JavaScript files into the LAMbot and execute them.
See LAMbot Configuration for more information. An example Azure Classic LAM filter configuration is shown below.
filter:
{
presend: "AzureClassicLam.js",
modules: [ "CommonUtils.js" ]
}
Map LAM Properties
By default the following Azure Classic event properties map to the following Cisco Crosswork Situation Manager Azure Classic LAM properties. You can configure custom mappings in the Azure Classic LAMbot.
| Azure Classic Event Property |
Azure Classic LAM Event Property |
| context.resourceRegion::context.resourceGroupName: :context.resourceType::context.resourceName::context.name |
signature |
| context.resourceId |
source_id |
| context.id |
external_id |
| context.resourceGroupName |
manager |
| context.resourceName |
source |
| context.resourceType |
class |
| Azure Classic LAM |
agent |
| context.conditionType |
type |
| 2 |
severity |
| context.name - context.description |
description |
| context.timestamp |
agent_time |
The overflow properties are mapped to "custom info" and appear under Overflow in Cisco Crosswork Situation Manager alerts:
| Azure Classic Event Property |
Azure Classic LAM Event Property |
| context |
eventDetails.context |
| properties |
eventDetails.properties |
| status |
eventDetails.status |
Start and Stop the LAM
Restart the Azure Classic LAM to activate any changes you make to the configuration file or LAMbot.
The LAM service name is azureclassiclamd.
See /document/preview/11677#UUID1a2205c3aae40b26fdfe94490043f3c3 for the commands to start, stop and restart the LAM.Control Processes
You can use a GET request to check the status of the Azure Classic LAM. See "Check the LAM Status" in Configure the REST LAM for further information and examples.
Configure Azure
After you have the Azure Classic LAM running and listening for incoming requests, you can configure a webhook in Azure. See "Configure Azure" in Azure Classic.
Microsoft SCOM
To integrate with Microsoft System Center Operations Manager (SCOM), install the SCOM Connector on the SCOM Server. After you have installed and configured the SCOM Connector, it posts alarm data to Cisco Crosswork Situation Manager.
These instructions apply to the SCOM Connector for single-server SCOM implementations. If you have set up multiple SCOM servers for high availability, see Configure the SCOM Connector and Configure SCOM for HA.
See the SCOM documentation for details on SCOM components.
Before You Begin
The SCOM integration has been validated with SCOM 2012 & SCOM 2016. Before you start to set up your SCOM integration, ensure you have met the following requirements:
· Your SCOM server is running Windows Server 2012 or Windows Server 2016.
· You have enabled Internet Information Services 6.0 to view the Status GUI.
· You have Administrator privileges to the SCOM server.
· You have uninstalled any versions of the SCOM Connector you had previously installed.
· You have opened a port for the SCOM Connector to receive connections from Cisco Crosswork Situation Manager. You use this port to configure the Connector URL. The default is 8085.
· If communications between the SCOM Server and the server must pass through a proxy, ensure you know the proxy details including IP address, port, and required user credentials.
Configure the SCOM Integration
Configure the SCOM integration in Cisco Crosswork Situation Manager as follows:
1. Navigate to the Integrations tab.
2. Click SCOM in the Monitoring section.
3. Follow the instructions to create an integration name.
Install the SCOM Connector
To install the SCOM Connector on your SCOM server:
1. Download the SCOM Connector from here.
2. Unzip the SCOMConnectorInstaller to a directory of your choice.
3. Right-click on the SCOMConnectorInstaller and select Run as Administrator.
4. To add your SCOM Server, click the Add SCOM Server. The SCOM Server Connection dialog opens.
5. Enter the following details in the dialog box and click the Add Connection button:
| Field |
Value |
| Domain |
Domain name of the SCOM Server |
| SCOM Server Host Name |
Host name of the SCOM Server where you are installing the Connector |
| User ID |
User name of the SCOM Server. For example, "Administrator" or "someuser@example.com" |
| Password |
Password for the SCOM Server user |
6. Click the Add Moog Server button to add your server. The Moog Server Connection dialog box opens.
7. Enter the following details in the dialog box and then click the Add Connection button.
| Field |
Value |
| Moog URL |
<your SCOM integration URL> For example: https://example.Cisco.com/events/scom_scom1 |
| Moog IP |
IP address of the server |
| Moog Port |
Port of the SCOM Integration (SCOM LAM) on the server |
| Enable SSL |
Encrypt communications with the server |
| Public Key |
Public Key for the server |
| Proxy Authentication Required |
Enable when communications must pass through a proxy server that requires authentication |
| Username |
Proxy username in the format <domain name>\<user name>. For instance, "mdomain\user1" |
| Password |
Password for the proxy user |
| Proxy IP |
IP address of the proxy server |
| Proxy Port |
Port of the proxy server |
8. Enter the Connector URL in the Connector URL field in the following format: http://<IP Address>:<port> . For example, "http://192.0.2.0:8085".
Use the IP address of the machine where you're installing the connector and the open port you selected for communications with Cisco Crosswork Situation Manager.
9. Enter an appropriate Connector Service Name, i.e. "Cisco-Connector".
10. To prevent alert storms, enter the Alert Storm Threshold on the Config tab, by default 10000.
11. The SCOM connector notifies Cisco Crosswork Situation Manager if the number of alerts breaches the threshold.
12. Select the Auto Start Service on Installation checkbox on the Config tab to start the SCOM Connector automatically after installation.
13. Click Install. The installer package installs the SCOM Connector and saves your configuration choices within the installer folder.
The connector runs as a service named "SCOM Connector". You can use the Services to control the SCOM Connector as you would any other service. If you restart the connector, ensure it stops completely before starting again. This can take 3-4 minutes.
You can view the logs for the SCOM Connector at <Install-Folder>\Logs\SCOMConnector.log.
Check SCOM Status
You can use a GET request to check the status of the SCOM connector. See "Check the LAM status" in Configure the REST LAM for more information and examples.
Configure the SCOM Connector
The SCOM Connector establishes the communication between the SCOM Server and the SCOM LAM in Cisco Crosswork Situation Manager. Installing the connector installs the REST Servers which enables the connector to receive and forward alarms/events to Cisco Crosswork Situation Manager.
Install the SCOM Connector
See Microsoft SCOM for instructions on how to install the connector on your SCOM server.
Edit the configuration file
Edit SCOMConnectorConfig.json to control the behavior of the SCOM Connector.
Some properties in the file are commented out by default. Before making any changes to the file, stop the service of the SCOM Connector you want to configure. After saving the changes, allow 3-4 minutes before restarting.
The configuration file consists of the following sections:
· SCOM Servers: You can find details of the SCOM Servers you added during installation in this section. You can only change the priority here; changing anything other than the priority can result in the the SCOM Connector becoming unstable.
· Moog Servers: You can find details of the Moog Servers you added during the installation and any proxies you have configured in this section.
· Other configurations: You can find all of the other configurations here. Some configurations are only for informational purposes and we do not recommend changing them.
The table below describes the configurable properties.
| Property |
Description |
| AlertPollCycleTime |
The time period for polling the SCOM Connector to fetch alerts from SCOM. Defaults to 45 seconds. In case of a long communication failure, the SCOM Connector will fetch alerts only up to 10 times this property's value, as long as the duration from the last poll time is greater than 10 times the property's value. If the duration is less than 10 times the AlertPollCycleTime, the alerts are fetched from the last poll time. |
| IsActiveEventPolling |
Determines whether the SCOM Connector fetches events. Defaults to False. |
| EventPollCycleTime |
The time period for polling the SCOM Connector to fetch events from SCOM. Defaults to 45 seconds.* |
| AmountOfTimeouts |
The number of attempts to try to reconnect with the SCOM Servers after a timeout. If set to "-1", the SCOM Connector continuously retries to connect with the configured SCOM Servers. Entering a positive integer will cause the SCOM Connector to make the specified number of attempts, and if it is unsuccessful in reconnecting, an alert is sent to Cisco Crosswork Situation Manager. |
| LowerTimeoutBound, UpperTimeoutBound and AmountOfTimeouts |
TheLowerTimeoutBound, UpperTimeoutBound, and AmountOfTimeouts collectively decide the time duration after which a retry is attempted. |
| Connector Name |
The name of the connector. |
| ConnectorDescription |
The description of the connector. |
| ConnectorDisplayName |
The display name of the connector. |
| MaxPollRetryAttempt |
If the SCOM Server fails to send data to the SCOM Connector, the number of retry attempts it makes. |
| WinAuthOverrid |
Determines whether to enable Windows authentication for accessing the SCOM Server. If the SCOM and SCOM Connector are on the same machine, setting this to True overrides Windows Authentication. Defaults to False. |
| AuthTokenRequired |
Determines whether an authentication token is required for SSL. |
| AuthTokenCode |
The authentication token for SSL. |
| Version |
The version of the installed SCOM Connector. |
| MaxPayloadSizeInMB and MinPayloadSizeInMB |
Determines the size of alerts to send individually, alerts are sent in batches. We recommend keeping the minimum value at 1MB. |
| PollCriteriaDateFormat |
The time format to use for polling data from the API. We do recommend changing the default value. For more details see /document/preview/28789#UUID4c8801d4cfe1777a67ca41e9516230bb.SCOM Connector Troubleshooting |
| IsPrimary, SCOMConnectorRestUrl and SiblingConnectorUrl |
For informational purposes only; do not edit. |
*The last poll time on which the SCOM Connector polled the SCOM Server is stored in SCOMConnectorInstaller/Configs/SCOMLastPollTime.json. After a communication failure, the SCOM Connector resumes fetching events from the last poll time saved in this file.
Code Example
{ "ScomServers": [
{
"ScomAddressHost": "WIN-9R4CQNMLGCS",
"Domain": "moogsoftadmin.com",
"UserId": "administrator",
"Password": "5wZmZrCfMPH2PJ5/gQmFLg==",
"Guid": "4271cd94-b7c8-4385-8cdb-be2aa7b954e0",
"Priority": 1
} ],
"MoogServers": [
{
"MoogUrl": "https://mandeepmoog63/events/scom_lam_microsoftscom1",
"MoogIp": "",
"MoogPort": "",
"MoogAddressDisplay": "https://mandeepmoog63/events/scom_lam_microsoftscom1",
"MoogPublicKey": "C:\\server.crt",
"IsSslEnabled": true,
"IsProxyRequired": false,
"ProxyUsername": "",
"ProxyPassword": "",
"MoogProxyIP": "",
"MoogProxyPort": "",
"Url": "",
"IsConnected": false
},
{
"MoogUrl": "",
"MoogIp": "10.142.24.82",
"MoogPort": "48003",
"MoogAddressDisplay": "10.142.24.82:48003",
"MoogPublicKey": "C:\\server.crt",
"IsSslEnabled": true,
"IsProxyRequired": true,
"ProxyUsername": "proxy",
"ProxyPassword": "MIg1FG7XrUWys9N/FSgQQQ==",
"MoogProxyIP": "10.142.24.92",
"MoogProxyPort": "808",
"Url": "", "IsConnected": false
} ],
"IsPrimary": true,
"SCOMConnectorRestUrl": "http://10.142.24.165:2373",
"SiblingConnectorUrl": "http://10.142.24.164:2373",
"IsActiveAlertPolling": true,
"AlertPollCycleTime": 45,
"IsActiveEventPolling": false,
"EventPollCycleTime": 45,
"AmountOfTimeouts": -1,
"LowerTimeoutBound": 10,
"UpperTimeoutBound": 360,
"ConnectorName": "SCOMConnectorv5",
"ConnectorDescription": "SCOM Connector",
"ConnectorDisplayName": "SCOMConnectorv5",
"HAServiceName": "SCOMConnectorha",
MaxPollRetryAttempt": 3,
"WinAuthOverride": false,
"AuthTokenRequired": false,
"AuthTokenCode": "",
"Version": "4.3 (Advanced)",
"MaxPayloadSizeInMB": 10.0,
"PollCriteriaDateFormat": "MM/dd/yyyy HH:mm:ss"
}
Upgrade the SCOM Connector
To upgrade the SCOM connector to the latest version:
1. Take a backup of the following SCOM configuration files:
a. SCOMConnectorInstaller/Configs/SCOMConnectorConfig.json.
b. SCOMConnectorInstaller/SCOMConnector.exe.config.
2. Additionally, if you have configured the SCOM Connector for high availability, take a backup of these files:
a. SCOMConnectorInstaller/Configs/MCMServiceConfig.json. This file has to be saved on both the machines where the Primary and the Secondary SCOM Connectors are installed.
b. SCOMConnectorInstaller/Configs/MCMService.exe.config. This file has to be saved on both the machines where the Primary and the Secondary SCOM Connectors are installed.
3. Uninstall the existing connector using the UninstallSCOM Connector uninstaller.
4. Delete the SCOMConnectorInstaller folder or copy it to any other location.
5. Unzip the new release of the SCOMConnectorInstaller folder.
6. Install the connector using the installer from the newly delivered connector installer folder.
7. Host the status page from the newly delivered connector installer folder.
8. If you need to make any configuration changes, edit the newly created configuration file. You can refer to the backed up configuration file, but do not replace the newly created configuration file with it.
Host the Status Page on IIS
The Status page displays status information for the SCOM Connector, SCOM Server, and the SCOM LAM. If you have installed multiple connectors, you will need to host separate status pages for each of them.
To host the status page on IIS (Internet Information Services):
1. Navigate to ScomConnectorInstaller\WebUI\Index.html and change the REST server's port from 8085 to the port given in the Connector URL field of the installer.
2. Navigate to Administrative Tools\Internet Services (IIS) Manager. In the Connections section, drill down to Default Web Site and right-click and select Add Virtual Directory.
3. In the dialog that opens, complete the Alias field with a name for the status page and set the Physical Path to the WebUI folder, appending an extra "\" to the end of the path.
4. Enter an alias e.g. Connector-status in the Alias field, then browse and select the WebUI folder. The WebUI folder is present in the ScomConnectorInstaller folder in the Physical path field. After selecting the path, append "\" at the end of the path.
5. To open the status page, click the Browse *:80(http) from the Actions menu.

View the statuses
The Status page displays the following information:
· The number of events and alerts the SCOM Connector has processed and sent to Cisco Crosswork Situation Manager is shown in the Total Alerts Processed field.
· The status of the connected Cisco Crosswork Situation Manager SCOM LAMs is shown in the MOOG Server Status section.
· The status of the SCOM Server currently fetching events from the SCOM Connector (typically the server with the highest priority) is shown in the SCOM Server Status section.
You can also open this page by entering http://localhost/<aliasname> in a browser on the machine where the SCOM Connector is installed. If you have administrative privileges, you can also open the page in the same domain as the SCOM server and connector.
Configure logging
You can configure the SCOM Connector logging in the SCOMConnector.exe.config file. Before making any changes, stop the SCOM Connector service. After saving the changes, allow 3-4 minutes before restarting the service.
The table below describes the configurable properties in the SCOMConnector.exe.config file.
| Field |
Description |
| Logging type |
The file logging setting is in the <appender name="RollingFileAppender" type="log4net.Appender.RollingFileAppender"> section. Defaults to enabled. The event logging setting is in the <appender name="EventLogAppender" type="log4net.Appender.EventLogAppender" > section. Defaults to enabled. |
| Logging Level |
Navigate to the <filter> section of the file logging and event logging to configure the logging level. Use <levelMin value= ""/> and <levelMax ""value=/> to set the levels, placing one of the following values within each tag: OFF, FATAL, ERROR, WARN, INFO, DEBUG, ALL. The values entered here include messages from all the log levels, from the defined min level to the defined max level. If OFF is entered in <levelMin value= ""/>, then no log messages will be added to log. if ALL is entered in <levelMin value= ""/>, then the messages from all the log levels will be added in the log. |
Maintenance Mode
In Maintenance Mode, the Primary Connector is manually stopped for maintenance and the communication is handled by the Secondary Connector. After maintenance, the Primary connector starts and takes over the communication automatically.
To start the Connector in Maintenance Mode, enter the following into your browser:
http://<SecondaryConnectorIP>: port/set_isolation_mode/
Where <SecondaryConnectorIP> is the IP address of your secondary SCOM Connector.
Configure the SCOM LAM
The SCOM LAM has been validated with SCOM 2012 & SCOM 2016. Before you configure the LAM, ensure you have met the following requirements:
Before You Begin
The SCOM LAM has been validated with SCOM 2012 and SCOM 2016. Before you configure the LAM, ensure you have met the following requirements:
· Your SCOM server is running Windows Server 2012 or Windows Server 2016.
· You have enabled Internet Information Services 6.0 to view the Status GUI.
· You have Administrator privileges to the SCOM server.
· You have uninstalled any versions of the SCOM Connector you had previously installed.
· You have opened a port for the SCOM Connector to receive connections from Cisco Crosswork Situation Manager. You use this port to configure the Connector URL. The default is 8085.
· If communications between the SCOM Server and the server must pass through a proxy, ensure you know the proxy details including IP address, port, and required user credentials.
If you are configuring a distributed deployment refer to Configure SCOM for HA first. You will need the details of the server configuration you are going to use for HA.
Configure the LAM
Edit the configuration file to control the behavior of the SCOM LAM.You can find the file at $MOOGSOFT_HOME/config/scom_lam.conf.
The SCOM LAM is a REST-based LAM as it provides an HTTP endpoint for data ingestion. Note that only the generic REST LAM properties in scom_lam.conf apply to integrating with SCOM; see the LAM and Integration Reference for a full description of all properties.
Some properties in the file are commented out by default; remove the '#' character to enable them.
1. Configure the connection properties:
a. address: Address on the Cisco Crosswork Situation Manager server that listens for messages. Defaults to all interfaces.
b. port: Port on the Cisco Crosswork Situation Manager server that listens for messages. Defaults to 8888.
2. Configure authentication:
a. authentication_type: Type of authentication used by the LAM. Defaults to basic.
b. authentication_cache: Whether to cache the username and password for the current connection when the authentication type is Basic.
3. Configure the LAM behavior:
a. accept_all_json: Allows the LAM to read and process all forms of JSON.
b. lists_contain_multiple_events: Whether Cisco Crosswork Situation Manager interprets a JSON list as multiple events.
c. num_threads:Number of worker threads to use for processing events.
d. rest_response_mode: When to send a REST response. See the LAM and Integration Reference for the options.
e. rpc_response_timeout: Number of seconds to wait for a REST response.
f. event_ack_mode: When Moogfarmd acknowledges events from the SCOM LAM during the event processing pipeline.
4. Configure the SSL properties if you want to encrypt communications between the LAM and the REST connection:
a. use_ssl: Whether to use SSL certification.
b. path_to_ssl_files: Path to the directory that contains the SSL certificates.
c. ssl_key_filename: The SSL server key file.
d. ssl_cert_filename: The SSL root CA file.
e. use_client_certificates: Whether to use SSL client certification.
f. client_ca_filename: The SSL client CA file.
g. auth_token or encrypted_auth_token: Authentication token in the request body.
h. ssl_protocols: Sets the allowed SSL protocols.
5. Optionally configure the LAM identification and logging details in the agent and log_config sections of the file:
a. name: Identifies events the LAM sends to the Message Bus.
b. capture_log: Name and location of the LAM's capture log file.
c. configuration_file: Name and location of the LAM's process log configuration file.
6. Optionally configure severity conversion. See /document/preview/11721#UUID8b183a1e1278a7a652d3ae86944d7379 for further information and "Conversion Rules" in /document/preview/95030#UUIDc06d3f9c8b3d99f90b7227c2e2d8afae for details on conversions in general.Severity ReferenceData Parsing
Example
An example SCOM LAM configuration is as follows:
monitor:
{
name : "SCOM LAM",
class : "CRestMonitor",
port : 8888,
address : "0.0.0.0",
use_ssl : false,
#path_to_ssl_files : "config",
#ssl_key_filename : "server.key",
#ssl_cert_filename : "server.pem",
#use_client_certificates : false,
#client_ca_filename : "ca.crt",
#auth_token : "my_secret",
#encrypted_auth_token : "dfJtTQMGiFHfiq7sCmxguBt6Jv+eytkoiKCquSB/7iWxpgGsG2aez3z2j7SuBtKj",
#ssl_protocols : [ "TLSv1.2" ],
authentication_type : "basic_auth_static",
basic_auth_static:
{
username: "user",
password: "pass"
#,encrypted_password : "dfJtTQMGiFHfiq7sCmxguBt6Jv+eytkoiKCquSB/7iWxpgGsG2aez3z2j7SuBtKj"
},
authentication_cache : true,
accept_all_json : true,
lists_contain_multiple_events : true,
num_threads : 5,
rest_response_mode : "on_receipt",
rpc_response_timeout : 20,
event_ack_mode : "queued_for_processing"
},
agent:
{
name : "SCOM",
capture_log : "$MOOGSOFT_HOME/log/data-capture/scom_lam.log"
},
log_config:
{
configuration_file : "$MOOGSOFT_HOME/config/logging/scom_log.json"
{,
Configure for High Availability
Configure the SCOM LAM for high availability if required. See Configure SCOM for HA for details.
Confgure LAMbot processing
The SCOM LAMbot processes and filters events before sending them to the Message Bus. You can customize or bypass this processing if required. You can also load JavaScript files into the LAMbot and execute them.
See LAMbot Configuration for more information. An example SCOM LAM filter configuration is shown below.
filter:
{
presend: "ScomLam.js",
modules: [ "CommonUtils.js" ]
}
Start and Stop the LAM
Restart the SCOM LAM to activate any changes you make to the configuration file or LAMbot.
The LAM service name is scomlamd.
See /document/preview/11677#UUID1a2205c3aae40b26fdfe94490043f3c3 for the commands to start, stop and restart the LAM.Control Processes
You can use a GET request to check the status of the SCOM LAM. See "Check the LAM Status" in Configure the REST LAM for further information and examples.
Configure SCOM
After you have the SCOM LAM running and listening for incoming requests, you can configure SCOM. See Configure the SCOM Connector for more information and examples.
Configure SCOM for HA
Configuring the SCOM Connector for HA involves installing separate REST Servers, where the IP addresses and ports provided in the UI create individual REST Servers for HA communication.
The arrangement of HA connectors are as follows:

The HA configuration requires two services: one for HA communication, and one for communicating with the SCOM Server. To understand the configuration process consider the example below, where MCM Service is the name of the HA service and SCOM Connector is the SCOM Connector service.
The two services manage the REST servers that the SCOM Connector installs. The SCOM Connector manages the REST Servers and client that receives alerts from the SCOM Server and sends them to Cisco Crosswork Situation Manager. The MCM Service meanwhile manages the REST Server and client used for establishing communication between the Primary and Secondary SCOM Connectors.
In an HA configuration, the Primary SCOM Connector receives all the alerts/events from the SCOM Servers and the Secondary SCOM Connector remains inactive. The MCM Service monitors the SCOM Connector service, taking the heartbeat between the SCOM Server and SCOM Connector Service and forwards it to the Secondary SCOM Connector.
The Secondary SCOM Connector continuously receives the heartbeat of the Primary Connector while its MCM Service monitors this heartbeat. If a connection failure between the Primary Connector and SCOM Servers occurs, the heartbeat will not be received by the MCM Service of the Secondary Connector, and it will initiate the handover. To initiate the handover, the SCOM Connector service of the Secondary Connector establishes the connection with the SCOM Servers and Cisco Crosswork Situation Manager.
Configure the SCOM Servers for HA
To set up the SCOM Connector for high availability you require two SCOM servers. See "Install the SCOM connector" in Microsoft SCOM for instructions on how to configure these.
You will need the IP addresses and ports of the REST Servers you are going to instalI. The installer requires these to configure the REST Servers.
To install the primary SCOM Connector:
1. Add the SCOM Servers and the Moog Servers. Then, in the SCOM Connector Installer window, configure the Connector URL field using the format http://<IP Address>:<port> .
2. Select the HA Installation Mode check box and click the Primary Mode radio button.
3. In HA URL field, Enter the URL of the machine you installed the SCOM Connector on. For example, if the connector is installed on the machine with IP 10.142.24.55 and 8084 is a free port, then the URL will be http://10.142.24.20:8084/. Do not enter the port used in the Connector URL field.
4. In the Sibling HA URL field, enter the URL of the Secondary SCOM Connector's HA REST Server of the Secondary SCOM Connector, installed on another machine.
5. In the Sibling Connector URL field, enter the URL of the Secondary SCOM Connector's REST server.
6. Enter the HA Service Name and the HA Display Name. There should be no space between the names entered in the HA Service Name field.
7. Click Install to commence the installation process.
The HA configurations entered during the installation are saved in the MCMServiceConfig.json file. The file is saved in the Configs folder of the SCOMConnectorInstaller folder.
To install the secondary SCOM Connector follow the procedure above, this time clicking the Secondary Mode radio button and entering the Primary SCOM Connector's URLs in the Sibling HA URL and Sibling Connector URL fields.
Example
An example SCOM HA configuration is as follows:
{
"IsHaPrimary": true,
"HaServiceUrl": "http://10.142.24.86:8012",
"SiblingHaUrl": "http://10.142.24.16:8012",
"ConnectorUrl": "http://10.142.24.86:8011",
"SiblingConnectorUrl": "http://10.142.24.16:8011",
"MCMServiceName": "SCOMMCM1",
"MCMServiceDisplayName": "SCOMMCM1",
"ConnectorName": "SCOMHA1"
}
SCOM Connector HA Logging
You can change the logging levels and path of the HA logs in the MCMservice.exe.config file; their configurations are in the "SCOM Connector Logging" section. Before making any changes to the file, stop the MCM Service. After saving your changes, allow 3-4 minutes before restarting the service.
HA Failure Scenarios
| Scenario |
Response(s) |
| The Primary Connector is fully operational |
The Secondary Connector periodically communicates with the Primary MCM to check connectivity and operational readiness. The Primary Connector periodically communicates with the Secondary MCM to check connectivity and operational readiness. |
| The Primary Connector loses connection with Moog |
The connector receives the alerts from SCOM and puts them into the queue at the time of the connection break with Cisco Crosswork Situation Manager. Once the connection is re-established, the alerts in the queue are sent to Cisco Crosswork Situation Manager. |
| The Primary Connector loses connection with SCOM |
The Primary Connector tries to reconnect to the SCOM Server until all attempts are exhausted. The Secondary Connector checks the Primary MCM to see if the Primary Connector is fully operational. The Secondary Connector recognizes that the Primary connector is not fully operational. The Secondary Connector starts downloading the alerts from last known successful poll time. The Secondary Connector periodically checks with the Primary MCM to see if it is fully operational again. If the Primary MCM is fully operational again, the Secondary Connector completes its cycle and goes into standby. |
| The Primary Connector is not fully operational, and the Secondary Connector loses connection with SCOM |
The Secondary Connector tries to reconnect to the SCOM Server until all attempts are exhausted, at which point the Connector goes down. |
| The Primary Connector is not fully operational, and the Secondary Connector loses connection with Cisco Crosswork Situation Manager |
The Secondary Connector receives the alerts from SCOM and puts them in the queue at the time of the connection break with Cisco Crosswork Situation Manager. Once the connection is re-established, the Secondary Connector sends the data to Cisco Crosswork Situation Manager. Errors are logged locally. |
| The Primary MCM cannot connect to the Primary Connector |
The Secondary connector becomes operational. |
| The Secondary Connector cannot connect to the Primary MCM |
The Secondary Connector starts downloading the alerts from the last known successful poll time. The Secondary Connector periodically checks with the Primary MCM to see if it is fully operational again. If the Primary MCM and Primary is fully operational again, the Secondary Connector completes its cycle and goes into standby. |
If both the Primary and Secondary Connectors are down, start the services for both from the installer GUI. Doing so automatically updates the necessary config files.
Microsoft Teams
The Microsoft Teams integration enables you to manually send messages about Cisco Crosswork Situation Manager alerts and Situations to one or more Teams channels.
The integration sends HTTP posts with a JSON payload including the message text to an incoming Teams webhook.
See the Microsoft Teams documentation for details on Teams components.
Before You Begin
The Teams integration has been validated with Microsoft Teams v1.2.00.3961. Before you set up your integration, ensure you have met the following requirements:
· You have a Teams account and the ability to configure an incoming webhook.
· You have created at least one team and channel for incoming messages from Cisco Crosswork Situation Manager.
Configure the Teams Webhook
To configure the Teams webhook:
1. Launch Microsoft Teams.
2. Add an Incoming Webhook to the team and channel to receive messages from Cisco Crosswork Situation Manager.
3. Copy the webhook URL.
4. Repeat steps 2 and 3 for any other teams and channels to receive messages from Cisco Crosswork Situation Manager.
See the Microsoft Teams documentation for more information on configuring incoming webhooks.
Configure the Teams Integration
Configure the Teams integration as follows:
1. Navigate to the Integrations tab.
2. Click Microsoft Teams in the Collaboration section.
3. Provide the following:
a. A unique integration name. You can use the default name or customize the name according to your needs.
b. The webhook URLs from Teams.
c. The MoogDb Situation and alert database fields to be included in the message text into the Situation Message Rule and Alert Message Rule properties
You can optionally configure the number of seconds the integration waits for a connection to Teams before timing out. Defaults to 10.
After you configure the integration, you can right-click a Situation or an alert and select Tools > Escalate to Microsoft Teams from the menu.
The integration prefixes Teams messages with the severity and the alert or Situation ID. The ID is linked to the alert or Situation in Cisco Crosswork Situation Manager.
Office 365 Email
The Office 365 Email integration allows you to retrieve emails using the Microsoft Graph API to connect to Office 365 accounts and send them to Cisco Crosswork Situation Manager as events.
Refer to the Office 365 Email LAM Reference to see the integration's default properties. When you use the integrations UI, you can only configure the visible properties.
If you want to implement a more complex Office 365 Email LAM with custom settings, see Configure the Office 365 Email LAM.
Before you begin
Before you start to set up your Office 365 Email integration, ensure you have met the following requirements:
· You have registered your Office 365 account on Microsoft Azure, and have the following details:
— ID
— Client Secret
— Tenant ID
— Email address
· In Microsoft Azure, you have enabled Access Token Grant Flow. See the Microsoft Azure documentation for more information.
· In Microsoft Graph, you have added Mail.ReadWrite and User.Read.All permissions for your account. See the Microsoft Graph Permissions Reference for more information.
Additionally, you can provide optional configuration details. See the Office 365 Email LAM Reference and LAM and Integration Reference for a description of all properties.
Configure the Office 365 Email Integration
To configure the Office 365 Email integration:
1. Navigate to the Integrations tab.
2. Click Office 365 Email in the Monitoring section.
3. Provide a unique integration name. You can use the default name or customize the name according to your needs.
4. Provide connection details for Office 365.
You do not need to perform any other integration-specific steps for Office 365. After you configure the integration, it polls Office 365 at regular intervals to collect email messages (every 60 seconds by default). For a list of the mappable attributes in the event payload, refer to the Office 365 documentation.
Note:
The Office 365 Email integration only monitors folders at root level. Subfolders are not monitored.
When using the Subject or Body filter, include at least two alpha-numeric characters.
Configure the Office 365 Email LAM
The Office 365 Email LAM allows you to retrieve emails using the Microsoft Graph API to connect to Office 365 accounts and send them to Cisco Crosswork Situation Manager as events.
You can install a basic Office 365 Email integration in the UI. See Office 365 Email for integration steps.
Configure the Office 365 Email LAM if you want to configure custom properties, set up high availability or configure advanced options that are not available in the UI integration.
Before You Begin
Before you configure the Office 365 Email LAM, ensure you have met the following requirements:
· You have registered your application on Microsoft Azure, and have the following details:
— ID
— Client Secret
— Tenant ID
— Email address
· In Microsoft Azure, you have enabled Access Token Grant Flow. See the Microsoft Azure documentation for more information.
· In Microsoft Graph, you have added Mail.ReadWrite and User.Read.All permissions for your application in Microsoft Graph. See the Microsoft Graph Permissions Reference for more information.
For more information, refer to the Microsoft Azure documentation.
Configure the LAM
Edit the configuration file to control the behavior of the Office 365 Email LAM. You can find the file at $MOOGSOFT_HOME/config/office365_email_lam.conf.
See the Office 365 Email LAM Reference and LAM and Integration Reference for a full description of all properties. Some properties in the file are commented out by default; remove the '#' character to enable them.
1. Configure the connection properties for each Office 365 account:
a. auth_url: Authentication URL to get the access token from Office 365.
b. resource_url: Resource URL to access Office 365 email.
c. folder_path: Name of the folder containing the email messages, for example INBOX.
d. client_id: The ID of the account registered on Microsoft Azure.
e. client_secret or encrypted_client_secret: Password or encrypted password of the account used to connect to Office 365.
f. tenant_id: The tenant ID of the application registered on Microsoft Azure.
g. user_email: The user email address.
2. Determine how to treat messages for each target:
a. retrieve: Whether to receive all email messages or only unread messages.
b. retrieve_filter: One or more filters to limit the email messages to retrieve.
c. mark_as_read: Marks unread emails as read.
d. delete_on_retrieve: Whether to delete email messages on retrieval.
e. remove_html_tags: Whether to remove HTML tags from email messages.
f. treat_body_as_json: Decodes the email body into a JSON object and makes it available for mapping.
3. Configure the LAM behavior for each target:
a. num_threads: Number of worker threads to use when processing events.
b. event_ack_mode: Determines whether Moogfarmd acknowledges events from the LAM when they are added to the Moolet queue, or when a Moolet processes them.
c. request_interval: Length of time to wait between requests, in seconds.
d. max_retries: Number of times the LAM attempts to reconnect after connection failure.
e. retry_interval: Length of time to wait between reconnection attempts, in seconds.
f. recovery_interval: Length of time to wait between requests, in seconds, when the LAM re-establishes a connection after a failure.
g. max_lookback: Period of time for which to recover missed events, in seconds, when the LAM re-establishes a connection after a failure.
h. timeout: Length of time to wait before halting a connection or read attempt, in seconds.
4. Configure the SSL properties for each target using IMAPS or POP3S protocol:
a. disable_certification_validation: Whether to disable SSL certificate validation.
b. path_to_ssl_files: Path to the directory that contains the SSL certificates.
c. server_cert_filename: Name of the SSL root CA file.
d. client_key_filename: Name of the SSL client key file.
e. client_cert_filename: Name of the SSL client certificate.
5. If you want to connect to your Email system through a proxy server, configure the host and port properties in the proxy section for the target.
6. Optionally configure the LAM identification and logging details in the agent and log_config sections of the file:
a. name: Identifies events the LAM sends to the Message Bus. Defaults to Office365Email.
b. capture_log: Name and location of the LAM's capture log file.
c. configuration_file: Name and location of the LAM's process log configuration file.
7. Optionally configure severity conversions. See /document/preview/11721#UUID8b183a1e1278a7a652d3ae86944d7379 for further information and "Conversion Rules" in /document/preview/11720#UUID5c67156b667b1a28ec648cd779393914 for details on conversions in general.Severity ReferenceData Parsing
Example
You can configure the Office 365 Email LAM to retrieve messages from one or more accounts. If you use more than one Office 365 email server or multiple email folders on a single server, configure multiple targets according to the example.
The following example demonstrates a scenario in which you configure the Office 365 LAM to use two email addresses as event sources. For a single account, comment out the target2 section. If you want to configure more than two accounts, add a target section for each one and uncomment properties to enable them.
monitor:
{
name : "Office 365 Email Monitor",
class : "COffice365EmailMonitor",
request_interval : 60,
max_retries : -1,
retry_interval : 60,
targets:
{
target1:
{
auth_url : "https://login.microsoftonline.com","
resource_url : "https://graph.microsoft.com",
folder_path : "INBOX",
client_id : "client_id",
client_secret : "password",
tenant_id : "tenant_id",
user_email : "johndoe@example.com",
retrieve : "UNREAD",
retrieve_filter:
{
to : [ "joebloggs@example.com", "fredbloggs@example.com" ],
from : [ "jeandupont@example.com", "m.durand@example.com" ],
#recipient : [ ],
subject : [ "Alert", "Event" ],
#body : ""
},
mark_as_read : false,
delete_on_retrieve : false,
remove_html_tags : true,
treat_body_as_json : false;
disable_certificate_validation : true,
#path_to_ssl_files : "config",
#server_cert_filename : "server.crt",
#client_key_filename : "client.key",
#client_cert_filename : "client.crt",
#ssl_protocols : [ "TLSv1.2" ],
num_threads : 5
event_ack_mode : "queued_for_processing",
request_interval : 60,
max_retries : -1,
retry_interval : 60,
timeout : 120,
retry_recovery:
{
recovery_interval : 20,
max_lookback : -1
}
},
target2:
{
auth_url : "https://login.microsoftonline.comlocalhost",
resource_url : "https://graph.microsoft.comlocalhost",
folder_path : "INBOX",
client_id : "client_id",
encrypted_client_secret : "qJAFVXpNDTk6ANq65pEfVGNCu2vFdcoj70AF5BIebEc=",
user_email : "janedoe@example.com",
tenant_id : "tenant_id",
retrieve : "UNREAD",
retrieve_filter:
{
to : [ "bobsmith@example.com", "sallysmith@example.com" ],
from : [ "johnblack@example.com", chriswong@example.com" ],
#recipient : [ ],
subject : [ "Alert", "Event" ],
#body : ""
},
proxy:
{
host: "localhost",
port: 80
},
mark_as_read : true,
delete_on_retrieve : false,
remove_html_tags : true,
treat_body_as_json : false;
disable_certificate_validation : false,
path_to_ssl_files : "config",
server_cert_filename : "server.crt",
client_key_filename : "client.key",
client_cert_filename : "client.crt",
ssl_protocols : [ "TLSv1.1, TLSv1.2" ],
num_threads : 5
event_ack_mode : "event_processed",
request_interval : 60,
max_retries : 20,
retry_interval : 120,
timeout : 180,
proxy:
{
host : "localhost",
port : 8080
},
retry_recovery:
{
recovery_interval : 20,
max_lookback : -1
}
}
}
},
agent:
{
name : "Office365Email",
capture_log : "$MOOGSOFT_HOME/log/data-capture/office365_email_lam.log"
},
log_config:
{
configuration_file : "$MOOGSOFT_HOME/config/logging/office365_Eemail_lam_log.json"
},
Configure for High Availability
Configure the Office 365 Email LAM for high availability if required. See /document/preview/77155#UUIDbea404d9dd1afee65fa1471105d1b3c6 for details.High Availability Overview
Configure LAMbot Processing
The Office 365 Email LAMbot processes and filters events before sending them to the Message Bus. You can customize or bypass this processing if required. You can also load JavaScript files into the LAMbot and execute them.
See LAMbot Configuration for more information. An example Office 365 Email LAM filter configuration is shown below.
filter:
{
presend: "Office365EmailLam.js"
}
Map LAM Properties
Office 365 Email header properties are mapped by default to the following Cisco Crosswork Situation Manager Office 365 Email LAM properties. The overflow properties are mapped to "custom info" and appear under Overflow in Cisco Crosswork Situation Manager alerts. You can configure custom mappings in the Office 365 Email LAMbot.
| Office 365 Email Header Property |
Office 365 Email LAM Event Property |
| Agent |
$LamInstanceName |
| Agent Location |
$from |
| Agent Time |
$creation_date |
| Description |
$message |
| External ID |
$message_id |
| Manager |
Office365Email |
| Severity |
$importance |
| Signature |
$tenant_id::$subject |
| Source ID |
$tenant_id |
| Type |
$subject |
For a list of the overflow properties, refer to the JSON payloads here.
Start and Stop the LAM
Restart the Office 365 Email LAM to activate any changes you make to the configuration file or LAMbot.
The LAM service name is office365emaillamd.
See /document/preview/11677#UUID1a2205c3aae40b26fdfe94490043f3c3 for further details.Control Processes
Office 365 Email LAM Reference
This is a reference for the Office 365 Email LAM and UI integration. The Office 365 Email LAM configuration file is located at $MOOGSOFT_HOME/config/office365_email_lam.conf.
The following properties are unique to the Office 365 Email LAM and UI integration.
See the LAM and Integration Reference for a full description of all common properties used to configure LAMs and UI integrations.
See the Microsoft Azure documentation for details on Office 365 Email components.
auth_url
Authentication URL to get the access token from Office 365.
| Type |
String |
| Required |
Yes |
| Default |
N/A |
resource_url
Resource URL used to access Office 365.
| Type |
String |
| Required |
Yes |
| Default: |
N/A |
client_id
Username of the account used to connect to Office 365.
| Type |
String |
| Required |
Yes |
| Default |
N/A |
client_secret
Password of the account used to connect to Office 365.
| Type |
String |
| Required |
If you are not using encrypted_client_secret |
| Default |
N/A |
encrypted_client_secret
If you are using an encrypted password to connect to Office 365, enter it into this field and comment the password field. The encrypted_client_secret property overrides client_secret.
| Type |
String |
| Required |
If you are not using client_secret |
| Default |
N/A |
tenant_id
The tenant ID of the Office 365 application registered on Microsoft Azure.
| Type |
String |
| Required |
Yes |
| Default |
N/A |
user_email
The user email address registered in Office 365.
| Type |
String |
| Required |
Yes |
| Default |
N/A |
Nagios
The Nagios integration allows you to retrieve events from Nagios and send them to Cisco Crosswork Situation Manager.
When you use the integrations UI, you can only configure the visible properties. If you want to implement a more complex Nagios LAM with custom settings, see Configure the Nagios LAM.
See the Nagios documentation for details on Nagios components.
Before You Begin
The Nagios integration has been validated with Nagios v. XI. Before you start to set up your integration, ensure you have met the following requirements:
· You have an active Nagios installation.
· You have full permissions to the Nagios installation directory and files.
· You can make requests from the Nagios server to external endpoints over port 443.
· You have installed cURL on the Nagios server.
· You have administrator access to the Nagios UI.
Configure the Nagios Integration
Configure the Nagios integration in Cisco Crosswork Situation Manager as follows:
1. Navigate to the Integrations tab.
2. Click Nagios in the Monitoring section.
3. Follow the instructions to create an integration name.
See Configure the Nagios LAM for advanced configuration information.
Install the Nagios Integration Scripts
Install the Nagios scripts and configuration files onto your Nagios server as follows:
1. Download Nagios-Files-1.2.zip to your Nagios server. The zip file contains shell scripts and configuration files for the integration.
2. Extract the files from Nagios-Files-1.2.zip. For example:
unzip Nagios-Files-1.2.zip -d /tmp
3. Navigate to the location of the unzipped files and make the scripts executable. For example:
chmod +x send-service-event.sh send-host-event.sh
4. Copy the scripts to the Nagios plugin directory libexec. For example:
cp send*event.sh /usr/local/nagios/libexec
5. Edit the configuration variables in send-host-event.sh as follows:
| Field |
Value |
| HOSTNAME |
<your Nagios integration URL> For example: https://example.Cisco.com/events/nagios_nagios1 |
| BASIC_AUTH_USER |
Username generated in the Cisco Crosswork Situation Manager UI. |
| BASIC_AUTH_PASS |
Password generated in the Cisco Crosswork Situation Manager UI. |
6. Edit the same configuration variables in send-service-event.sh.
7. Create a new directory in /nagios/etc and copy the configuration files into it. For example:
mkdir -p /usr/local/nagios/etc/cfgprep
cp commands.cfg contacts.cfg /usr/local/nagios/etc/cfgprep/
Configure Nagios
Complete the Nagios configuration in the Nagios UI as follows:
1. Log into the Nagios UI and go to the Core Config Manager. Import the configuration files:
/usr/local/nagios/etc/cfgprep/commands.cfg
/usr/local/nagios/etc/cfgprep/contacts.cfg Apply the configuration.
See the Nagios documentation for more information.
2. Go to Contacts and check that the 'moogsoftadmin' contact appears.
3. Go to Contact Groups and check that the 'moogsoftadmins' contact group appears.
4. Go to Commands and check that the commands 'send-host-event' and 'send-service-event' are listed.
5. Go to Nagios Admin and then to Manage Components. Edit settings for the Global Event Handlers and add the commands as follows:
Host State Change Handler Commands: send-host-event
Service State Change Handler Commands: send-service-event
6. Check 'Enabled' for both commands and apply the settings.
7. In the Core Config Manager, add the 'moogsoftadmin' contact and the 'moogsoftadmins' contact group to the alert settings for each host and service you want to monitor with Cisco Crosswork Situation Manager.
When configuration is complete, Nagios sends host and service related events to Cisco Crosswork Situation Manager.
Configure the Nagios LAM
The Nagios LAM receives and processes Nagios events forwarded to Cisco Crosswork Situation Manager. The LAM parses the data into Cisco Crosswork Situation Manager events.
You can install a basic Nagios integration in the UI. See Nagios for integration steps.
Configure the Nagios LAM if you want to configure custom properties, set up high availability or configure advanced options that are not available in the UI integration.
See the Nagios documentation for details on Nagios components.
Before You Begin
Before you configure the Nagios LAM, ensure you have met the following requirements:
· You have an active Nagios installation.
· You have full permissions to the Nagios installation directory and files.
· You can make requests from the Nagios server to external endpoints over port 443.
· You have installed cURL on the Nagios server.
· You have administrator access to the Nagios UI.
Configure the LAM
Edit the configuration file to control the behavior of the Nagios LAM. You can find the file at $MOOGSOFT_HOME/config/nagios_lam.conf.
The Nagios LAM is a REST-based LAM as it provides an HTTP endpoint for data ingestion. Note that only the generic REST LAM properties in nagios_lam.conf apply to integrating with Nagios; see the LAM and Integration Reference for a full description of all properties.
Some properties in the file are commented out by default. Uncomment properties to enable them.
1. Configure the connection properties for the REST connection:
a. address: Address on the Cisco Crosswork Situation Manager server that listens for REST messages. Defaults to all interfaces.
b. port: Port on the Cisco Crosswork Situation Manager server that listens for REST messages. Defaults to 48009.
2. Configure authentication:
a. authentication_cache: Whether to cache the username and password for the current connection when the authentication type is Basic.
b. Configure the LAM behavior:
c. num_threads: Number of worker threads to use when processing events.
d. rest_response_mode: When to send a REST response. See the LAM and Integration Reference for the options.
e. rpc_response_timeout: Number of seconds to wait for a REST response.
f. event_ack_mode: When Moogfarmd acknowledges events from the Nagios LAM during the event processing pipeline.
3. Configure the SSL properties if you want to encrypt communications between the LAM and the REST connection:
a. use_ssl: Whether to use SSL certification.
b. path_to_ssl_files: Path to the directory that contains the SSL certificates.
c. ssl_key_filename: SSL server key file.
d. ssl_cert_filename: SSL root CA file.
e. use_client_certificates: Whether to use SSL client certification.
f. client_ca_filename: SSL client CA file.
g. auth_token or encrypted_auth_token: Authentication token in the request body.
h. header_auth_token or encrypted_header_auth_token: Authentication token in the request header.
i. ssl_protocols: Sets the allowed SSL protocols.
4. Optionally configure the LAM identification and logging details:
a. name: Identifies events the LAM sends to the Message Bus.
b. capture_log: Name and location of the LAM's capture log file.
c. configuration_file: Name and location of the LAM's process log configuration file.
Example
The following example demonstrates a Nagios LAM configuration.
monitor:
{
name : "Nagios REST Lam",
class : "CRestMonitor",
port : 48009,
address : "0.0.0.0",
use_ssl : false,
#path_to_ssl_files : "config",
#ssl_key_filename : "server.key",
#ssl_cert_filename : "server.pem",
#use_client_certificates : false,
#client_ca_filename : "ca.crt",
#auth_token : "my_secret",
#encrypted_auth_token : "dfJtTQMGiFHfiq7sCmxguBt6Jv+eytkoiKCquSB/7iWxpgGsG2aez3z2j7SuBtKj",
#ssl_protocols : [ "TLSv1.2" ],
authentication_type : "basic",
authentication_cache : true,
accept_all_json : true,
lists_contain_multiple_events : true,
num_threads : 5,
rest_response_mode : "on_receipt",
rpc_response_timeout : 20,
event_ack_mode : "queued_for_processing"
},
agent:
{
name : "Nagios",
capture_log : "$MOOGSOFT_HOME/log/data-capture/nagios_lam.log"
},
log_config:
{
configuration_file : "$MOOGSOFT_HOME/config/logging/custom.log.json"
},
Configure for High Availability
Configure the Nagios LAM for high availability if required. See /document/preview/77155#UUIDbea404d9dd1afee65fa1471105d1b3c6 for details.High Availability Overview
Configure LAMbot Processing
The Nagios LAMbot processes and filters events before sending them to the Message Bus. You can customize or bypass this processing if required. You can also load JavaScript files into the LAMbot and execute them.
See LAMbot Configuration for more information. An example Nagios LAM filter configuration is shown below.
filter:
{
presend: "NagiosLam.js",
modules: [ "CommonUtils.js" ]
}
Map Severities
Cisco Crosswork Situation Manager maps severities from Nagios host and service events as follows by default. For example, a Nagios service event with State "Warning:" and State Type "Hard" has severity "Warning" in Cisco Crosswork Situation Manager. You can optionally change the mappings in the Nagios LAMbot file.
| Nagios Event Type |
Nagios State |
Nagios State Type |
Cisco Crosswork Situation Manager Severity |
| Host |
Up |
Soft or Hard |
Clear |
| Host |
Unreachable |
Soft |
Warning |
| Host |
Unreachable |
Hard |
Minor |
| Host |
Down |
Soft |
Major |
| Host |
Down |
Hard |
Critical |
| Service |
Ok |
Soft or Hard |
Clear |
| Service |
Unknown |
Soft |
Warning |
| Service |
Warning |
Hard |
Warning |
| Service |
Warning |
Soft |
Warning |
| Service |
Unknown |
Hard |
Minor |
| Service |
Critical |
Soft |
Major |
| Service |
Critical |
Hard |
Critical |
See /document/preview/11721#UUID8b183a1e1278a7a652d3ae86944d7379 for further information and "Conversion Rules" in /document/preview/11720#UUID5c67156b667b1a28ec648cd779393914 for details on conversions in general.Severity ReferenceData Parsing
Map LAM Properties
Nagios host and service event properties are mapped by default to the following Cisco Crosswork Situation Manager Nagios LAM properties.
Overflow properties are mapped to "custom info" and appear under Overflow in Cisco Crosswork Situation Manager alerts. You can see the properties and configure custom mappings in the Nagios LAMbot file at $MOOGSOFT_HOME/bots/lambots/NagiosLam.js
| Nagios LAM Event Property |
Nagios Host Event Property |
Nagios Service Event Property |
| Agent |
Nagios |
Nagios |
| Agent Location |
Nagios Global Event Handler |
Nagios Global Event Handler |
| Agent Time |
Current Epoch Time |
Current Epoch Time |
| Class |
Host State Type |
Service State Type |
| Description |
Host Output |
Service Output |
| External ID |
Host Alias and Hostname |
Host Alias Name or Hostname |
| Manager |
Host Group Name |
Service Group Name |
| Severity |
Host State Type and Host State ID |
Service State Type and Service State ID |
| Signature |
Hostname and check type |
Hostname and check type |
| Source |
Hostname |
Hostname |
| Source ID |
Host Event ID |
Service Event ID |
| Type |
Nagios Host Event |
Nagios Service Event |
Start and Stop the LAM
Restart the Nagios LAM to activate any changes you make to the configuration file or LAMbot.
The LAM service name is nagioslamd.
See /document/preview/11677#UUID1a2205c3aae40b26fdfe94490043f3c3 for the commands to start, stop and restart the LAM.Control Processes
You can use a GET request to check the status of the Nagios LAM. See "Check the LAM Status" in Configure the REST LAM for further information and examples.
Configure Nagios
After you have the Nagios LAM running and listening for incoming requests, you can configure Nagios. See "Configure Nagios" in Nagios.
New Relic
You can use the Integrations UI to integrate Cisco Crosswork Situation Manager with New Relic using one of the following integrations. Choose your integration according to your Cisco Crosswork Situation Manager and New Relic environments:
· New Relic Insights Polling: Use this integration to enable Cisco Crosswork Situation Manager to collect event data from New Relic Insights.
· New Relic Polling: The polling method is useful when New Relic cannot push events to Cisco Crosswork Situation Manager due to firewall or security issues. You may therefore want to use this method if you are using Cisco Crosswork Situation Manager on-premises and New Relic in the cloud.
· New Relic Webhook: For other New Relic and Cisco Crosswork Situation Manager deployments, use this integration to set up a webhook notification channel in New Relic.
New Relic Insights Polling
You can install the New Relic Insights Polling integration to enable Cisco Crosswork Situation Manager to collect event data from one or more New Relic Insights systems. The integration uses API authorization keys to authenticate with New Relic Insights.
See the New Relic documentation for details on New Relic Insights.
Before You Begin
The New Relic Insights Polling integration has been validated with New Relic Insights v2.3. Before you start to set up your integration, ensure you have met the following requirements for each New Relic system:
· You have the New Relic Insights server URL.
· You have the New Relic Insights Account ID and API Query Key.
· Your New Relic Insights server is able to accept HTTP/HTTPS requests.
Configure the New Relic Insights Polling Integration
To configure the New Relic Insights Polling integration:
1. Navigate to the Integrations tab.
2. Click New Relic Insights (Polling) in the Monitoring section.
3. Provide a unique integration name. You can use the default name or customize the name according to your needs.
4. Provide connection details for your New Relic system.
Additionally, you can provide optional configuration details. See the New Relic Insights Reference for a description of all properties.
Configure New Relic Insights
Configure a webhook to push incidents from New Relic to New Relic Insights as follows. For more help, see the New Relic Documentation.
1. Create a new notification channel in New Relic with the following properties:
| Field |
Value |
| Channel Type |
Webhook |
| Channel Name |
Send to New Relic Insights for Cisco Crosswork Situation Manager |
| Base URL |
Provide the New Relic Insights URL, for example: https://insights-collector.newrelic.com/v1/accounts/<account id>/events |
2. Add the following custom JSON payload:
{
"eventType":"Aiops_Incident",
"account_id": "$ACCOUNT_ID",
"account_name": "$ACCOUNT_NAME",
"condition_id": "$CONDITION_ID",
"condition_name": "$CONDITION_NAME",
"current_state": "$EVENT_STATE",
"details": "$EVENT_DETAILS",
"event_type": "$EVENT_TYPE",
"incident_acknowledge_url": "$INCIDENT_ACKNOWLEDGE_URL",
"incident_id": "$INCIDENT_ID",
"incident_url": "$INCIDENT_URL",
"owner": "$EVENT_OWNER",
"policy_name": "$POLICY_NAME",
"policy_url": "$POLICY_URL",
"runbook_url": "$RUNBOOK_URL",
"severity": "$SEVERITY",
"targets": "$TARGETS",
"timestamp": "$TIMESTAMP",
"violation_chart_url": "$VIOLATION_CHART_URL"
}
3. To include headers with webhooks, add Custom Headers and provide a name and value for each header.
| Name |
Value |
| X-Insert-Key |
The Insights Insert Key |
4. Optionally send a test notification to verify that Cisco Crosswork Situation Manager can receive a test event from New Relic Insights.
5. Assign the notification channel to one or more alert policies in New Relic Insights. You can create a new alert policy or add the notification to an existing alert policy.
After you configure the integration, it polls your New Relic Insights servers at regular intervals to collect event data (every 60 seconds by default).
If the integration fails to connect to one or more New Relic Insights sources, Cisco Crosswork Situation Manager creates an alert and writes the details to the process log. Refer to the logging details for LAMs and integrations for more information.Configure Logging
Configure the New Relic Insights Polling LAM
The New Relic Insights Polling LAM allows Cisco Crosswork Situation Manager to collect event data from one or more New Relic Insights systems. The integration uses API authorization keys to authenticate with New Relic Insights.
You can install a basic New Relic Insights Polling integration in the UI. See New Relic Insights Polling for integration steps.
Configure the New Relic Insights Polling LAM if you want to configure custom properties, set up high availability or configure advanced options that are not available in the UI integration.
Before You Begin
The New Relic Insights Polling integration has been validated with New Relic Insights v2.3. Before you set up the LAM, ensure you have met the following requirements for each New Relic Insights server:
· You have the New Relic Insights server URL.
· You have the New Relic Insights Account ID and API Query Key.
· Your New Relic Insights server is able to accept HTTP/HTTPS requests.
Configure the LAM
Edit the configuration file to control the behavior of the New Relic Insights Polling LAM. You can find the file at $MOOGSOFT_HOME/config/newrelic_insights_client_lam.conf
See the New Relic Insights Polling Reference for a full description of all properties. Some properties in the file are commented out by default. Uncomment properties to enable them.
1. Configure the connection properties for each New Relic Insights target:
a. url: New Relic Insights request URL including host and port.
b. account_id: Your New Relic Insights account ID.
c. query_key: Your New Relic query key.
2. Configure the LAM behavior for each target:
a. request_interval: Length of time to wait between requests, in seconds.
b. max_retries: Number of times the LAM attempts to reconnect after connection failure.
c. retry_interval: Length of time to wait between reconnection attempts, in seconds.
d. recovery_interval: Length of time to wait between requests, in seconds, when the LAM re-establishes a connection after a failure.
e. max_lookback: Period of time for which to recover missed events, in seconds, when the LAM re-establishes a connection after a failure.
f. timeout: Length of time to wait before halting a connection or read attempt, in seconds.
3. Configure the SSL properties if you want to encrypt communications between the LAM and New Relic Insights:
a. disable_certificate_validation: Whether to disable SSL certificate validation.
b. path_to_ssl_files: Path to the directory that contains the SSL certificates.
c. server_cert_filename: Name of the SSL root CA file.
d. client_key_filename: Name of the SSL client key file.
e. client_cert_filename: Name of the SSL client certificate.
4. Optionally configure the LAM identification and logging details in the agent and log_config sections of the file:
a. name: Identifies events the LAM sends to the Message Bus.
b. capture_log: Name and location of the LAM's log file.
c. configuration_file: Name and location of the LAM's process log configuration file.
5. If you want to connect to New Relic Insights through a proxy server, configure the host, port, user, and password or encrypted_password in the proxy section of the file.
6. Optionally configure severity conversions. See /document/preview/11721#UUID8b183a1e1278a7a652d3ae86944d7379 for further information and "Conversion Rules" in /document/preview/11720#UUID5c67156b667b1a28ec648cd779393914 for details on conversions in general.Severity ReferenceData Parsing
Example
You can configure the New Relic Insights LAM to retrieve events from one or more targets. The following example demonstrates a configuration that targets two New Relic Insights sources. For a single source, comment out the target2 section. If you have more than two sources, add a target section for each one and uncomment properties to enable them.
monitor:
name : "New Relic Insights Client Lam Monitor",
class : "CNewRelicInsightsClientMonitor",
request_interval : 60,
max_retries : -1,
retry_interval : 60,
retry_recovery:
{
recovery_interval : 20,
max_lookback : -1
},
targets:
{
target1:
{
url : "https://insights-api-server1.newrelic.com/",
account_id : "8729338",
query_key : "QUERY_1",
disable_certificate_validation : true,
path_to_ssl_files : "config",
server_cert_filename : "server.crt",
client_key_filename : "client.key",
client_cert_filename : "client.crt",
request_interval : 60,
max_retries : -1,
retry_interval : 60,
retry_recovery:
{
recovery_interval : 20,
max_lookback : -1
},
timeout : 120
},
target2:
{
url : "https://insights-api-server2.newrelic.com/",
account_id : "0022839",
query_key : "QUERY_2",
proxy:
{
host : "localhost",
port : 8080,
user : "proxy_user",
#password : "password",
encrypted_password : "ieytOFRUdLpZx53nijEw0rOh07VEr8w9lBxdCc7229o="
}
request_interval : 60,
max_retries : -1,
retry_interval : 60,
timeout : 120
}
}
},
agent:
{
name : "New Relic",
capture_log : "$MOOGSOFT_HOME/log/data-capture/newrelic_insights_client_lam.log"
},
log_config:
{
configuration_file : "$MOOGSOFT_HOME/config/logging/newrelic_insights_client_lam.log.json"
},
Configure for High Availability
Configure the New Relic Insights LAM for high availability if required. See /document/preview/77155#UUIDbea404d9dd1afee65fa1471105d1b3c6 for details.High Availability Overview
Configure LAMbot Processing
The New Relic Insights Polling LAMbot processes and filters events before sending them to the Message Bus. You can customize or bypass this processing if required. You can also load JavaScript files into the LAMbot and execute them.
See LAMbot Configuration for more information. An example New Relic Insights Polling LAM filter configuration is shown below.
filter:
{
presend: "NewRelicInsightsClientLam.js",
modules: [ "CommonUtils.js" ]
}
Map LAM Properties
You can configure custom mappings in the New Relic Insights Polling LAMbot. See /document/preview/11720#UUID5c67156b667b1a28ec648cd779393914 information for details.Data Parsing
By default, the following New Relic Insights event properties map to the following Cisco Crosswork Situation Manager New Relic Insights Polling LAM properties:
| New Relic Insights Event Property |
New Relic Insights LAM Event Property |
| $account_id::$condition_name |
signature |
| $account_id |
source_id |
| $incident_id |
external_id |
| "New Relic" |
manager |
| $account_name |
source |
| $condition_name |
class |
| $LamInstanceName |
agent |
| $severity |
severity |
| $details |
description |
| $timestamp |
agent_time |
| "Incident" |
type |
The overflow properties are mapped to "custom info" and appear under custom_info in Cisco Crosswork Situation Manager alerts.
Start and Stop the LAM
Restart the New Relic Insights Polling LAM to activate any changes you make to the configuration file or LAMbot.
The LAM service name is newrelicinsightsclientlamd.
See /document/preview/11677#UUID1a2205c3aae40b26fdfe94490043f3c3 for further details.Control Processes
If the LAM fails to connect to one or more New Relic Insights sources, Cisco Crosswork Situation Manager creates an alert and writes the details to the process log. Refer to the logging details for LAMs and integrations for more information.Configure Logging
New Relic Insights Polling Reference
This is a reference for the New Relic Insights Polling LAM and UI integration. The New Relic Insights Polling LAM configuration file is located at $MOOGSOFT_HOME/config/newrelic_insights_client_lam.conf.
The following properties are unique to the New Relic Insights Polling LAM and UI integration.
See the LAM and Integration Reference for a full description of all common properties used to configure LAMs and UI integrations.
See the New Relic documentation for details on New Relic Insights.
url
The URL of your New Relic Insights instance. If you are using the EU region datacentre, use the URL https://insights-api.eu.newrelic.com.
Type: String
Required: Yes
Default: N/A
Example:
url: "https://insights-api.newrelic.com/",
account_id
Your New Relic Account ID.
Type: String
Required: Yes
Default: N/A
query_key
Your New Relic Insights Query Key.
Type: String
Required: Yes
Default: N/A
New Relic Polling
You can install the New Relic Polling integration to enable Cisco Crosswork Situation Manager to collect event data from one or more New Relic systems. The integration uses API authorization keys to authenticate with New Relic.
See the New Relic documentation for details on New Relic components.
Before You Begin
The New Relic Polling integration has been validated with New Relic v2.3. Before you start to set up your integration, ensure you have met the following requirements for each New Relic system:
· You have the URL and API Key of your New Relic system.
· You know whether you want to retrieve events or violations from New Relic.
· Your New Relic server is able to accept HTTP/HTTPS requests.
Configure the New Relic Integration
To configure the New Relic Polling integration:
1. Navigate to the Integrations tab.
2. Click New Relic Polling in the Monitoring section.
3. Provide a unique integration name. You can use the default name or customize the name according to your needs.
4. Provide connection details for your New Relic system.
Additionally, you can provide optional configuration details. See the New Relic Polling Reference and LAM and Integration Reference for a description of all properties.
Configure New Relic
You do not need to perform any integration-specific steps on your New Relic systems. After you configure the integration, it polls your New Relic servers at regular intervals to collect event data (every 60 seconds by default).
If the integration fails to connect to one or more sources, Cisco Crosswork Situation Manager creates an alert and writes the details to the process log. Refer to the logging details for LAMs and integrations for more information.Configure Logging
Configure the New Relic Polling LAM
The New Relic Polling LAM allows Cisco Crosswork Situation Manager to collect event data from one or more New Relic systems.
You can install a basic New Relic Polling integration in the UI. See New Relic Polling for integration steps.
Configure the New Relic Polling LAM if you want to configure custom properties, set up high availability or configure advanced options that are not available in the UI integration.
Before You Begin
The New Relic Polling integration has been validated with New Relic v2.3. Before you set up the LAM, ensure you have met the following requirements for each New Relic server:
· You have the URL and API Key of your New Relic system.
· You know whether you want to retrieve events or violations from New Relic.
· Your New Relic server is able to accept HTTP/HTTPS requests.
Configure the LAM
Edit the configuration file to control the behavior of the New Relic Polling LAM. You can find the file at $MOOGSOFT_HOME/config/newrelic_client_lam.conf
See the New Relic Polling Reference for a full description of all properties. Some properties in the file are commented out by default. Uncomment properties to enable them.
1. Configure the connection properties for each New Relic target:
a. url: The URL of your New Relic instance.
b. retrieve_type: The type of New Relic data to retrieve: event or violation.
c. api_key: Your New Relic API key.
2. Optionally configure a filter, if you want to restrict the data collected from New Relic:
a. product: The New Relic product for which to retrieve data. Options are APM, BROWSER, MOBILE, SERVERS, PLUGINS, SYNTHETICS, ALERTS.
b. entity_type: The New Relic entity type for which to retrieve data. Options are Application, Server, KeyTransaction, Plugin, MobileApplication, BrowserApplication, Monitor.
c. event_type: The New Relic event type for which to retrieve data. Options are NOTIFICATION, DEPLOYMENT, VIOLATION_OPEN, VIOLATION_CLOSE, VIOLATION, INSTRUMENTATION.
3. Configure the LAM behavior for each target:
a. request_interval: Length of time to wait between requests, in seconds.
b. max_retries: Number of times the LAM attempts to reconnect after connection failure.
c. retry_interval: Length of time to wait between reconnection attempts, in seconds.
d. recovery_interval: Length of time to wait between requests, in seconds, when the LAM re-establishes a connection after a failure.
e. max_lookback: Period of time for which to recover missed events, in seconds, when the LAM re-establishes a connection after a failure.
f. timeout: Length of time to wait before halting a connection or read attempt, in seconds.
4. Configure the SSL properties if you want to encrypt communications between the LAM and New Relic:
a. disable_certificate_validation: Whether to disable SSL certificate validation.
b. path_to_ssl_files: Path to the directory that contains the SSL certificates.
c. server_cert_filename: Name of the SSL root CA file.
d. client_key_filename: Name of the SSL client key file.
e. client_cert_filename: Name of the SSL client certificate.
5. If you want to connect to New Relic through a proxy server, configure the host, port, user, and password or encrypted_password in the proxy section of the file.
6. Optionally configure the LAM identification and logging details in the agent and log_config sections of the file:
a. name: Identifies events the LAM sends to the Message Bus.
b. capture_log: Name and location of the LAM's log file.
c. configuration_file: Name and location of the LAM's process log configuration file.
7. Optionally configure severity conversions. See /document/preview/11721#UUID8b183a1e1278a7a652d3ae86944d7379 for further information and "Conversion Rules" in /document/preview/11720#UUID5c67156b667b1a28ec648cd779393914 for details on conversions in general.Severity ReferenceData Parsing
Example
You can configure the New Relic LAM to retrieve events from one or more targets. The following example demonstrates a configuration that targets two New Relic sources. For a single source, comment out the target2 section. If you have more than two sources, add a target section for each one and uncomment properties to enable them.
monitor:
name : "New Relic Client Lam Monitor",
class : "CNewRelicClientMonitor",
request_interval : 60,
max_retries : -1,
retry_interval : 60,
retry_recovery:
{
recovery_interval : 20,
max_lookback : -1
},
targets:
{
target1:
url : "https://api.examplenewrelic.com/",
retrieve_type : "event",
api_key : "SAMPLE_KEY_1",
filter:
{
product : "MOBILE",
entity_type : "MobileApplication",
event_type : "NOTIFICATION"
},
proxy:
{
host : "localhost",
port : 8080,
user : "proxy_user",
encrypted_password : "ieytOFRUdLpZx53nijEw0rOh07VEr8w9lBxdCc7229o="
},
disable_certificate_validation : false,
path_to_ssl_files : "config",
server_cert_filename : "server.crt",
client_key_filename : "client.key",
client_cert_filename : "client.crt",
request_interval : 60,
max_retries : 20,
retry_interval : 120,
retry_recovery:
{
recovery_interval : 40,
max_lookback : 360
},
timeout : 180
},
target2:
{
url : "https://api.example2newrelic.com/",
retrieve_type : "violation",
api_key : "SAMPLE_KEY_2",
filter:
{
product : "BROWSER",
entity_type : "BrowserApplication",
event_type : "VIOLATION"
}
polling_interval : 10,
max_retries : 30,
retry_interval : 180,
timeout : 360
}
}
},
agent:
{
name : "New Relic",
capture_log : "$MOOGSOFT_HOME/log/data-capture/newrelic_client_lam.log"
},
log_config:
{
configuration_file : "$MOOGSOFT_HOME/config/logging/newrelic_client_lam.log.json"
},
Configure for High Availability
Configure the New Relic Polling LAM for high availability if required. See /document/preview/77155#UUIDbea404d9dd1afee65fa1471105d1b3c6 for details.High Availability Overview
Configure LAMbot Processing
The New Relic Polling LAMbot processes and filters events before sending them to the Message Bus. You can customize or bypass this processing if required. You can also load JavaScript files into the LAMbot and execute them.
See LAMbot Configuration for more information. An example New Relic Polling LAM filter configuration is shown below.
filter:
{
presend: "NewRelicClientLam.js",
modules: [ "CommonUtils.js" ]
}
Start and Stop the LAM
Restart the New Relic Polling LAM to activate any changes you make to the configuration file or LAMbot.
The LAM service name is newrelicclientlamd.
See /document/preview/11677#UUID1a2205c3aae40b26fdfe94490043f3c3 for further details.Control Processes
If the LAM fails to connect to one or more New Relic sources, Cisco Crosswork Situation Manager creates an alert and writes the details to the process log. Refer to the logging details for LAMs and integrations for more information.Configure Logging
New Relic Polling Reference
This is a reference for the New Relic Polling LAM and UI integration. The New Relic Polling LAM configuration file is located at $MOOGSOFT_HOME/config/newrelic_client_lam.conf.
The following properties are unique to the New Relic Polling LAM and UI integration.
See the LAM and Integration Reference for a full description of all common properties used to configure LAMs and UI integrations.
See the New Relic documentation for details on New Relic components.
url
The URL of your New Relic instance. If you are using the EU region data centre, use the URL https://api.eu.newrelic.com.
Type: String
Required: Yes
Default: N/A
Example:
url: "https://api.newrelic.com/",
retrieve_type
Whether you want to retrieve event or violation data from New Relic.
Type: String
Required: Yes
One of: event, violation.
Default: event
api_key
Your New Relic API key.
Type: String
Required: Yes
Default: N/A
filter
An object containing product, entity type and/or event type filters to restrict the data the LAM retrieves from New Relic.
Type: Object
Required: No
Default: N/A
product
The New Relic product for which to retrieve data. You can specify a single product.
Type: String
Required: No
One of: APM, BROWSER, MOBILE, SERVERS, PLUGINS, SYNTHETICS, ALERTS.
Default: N/A
entity_type
The New Relic entity type for which to retrieve data. You can specify a single entity type.
Type: String
Required: No
One of: Application, Server, KeyTransaction, Plugin, MobileApplication, BrowserApplication, Monitor.
Default: N/A
event_type
The New Relic event type for which to retrieve data. You can specify a single event type.
Type: String
Required: No
One of: NOTIFICATION, DEPLOYMENT, VIOLATION_OPEN, VIOLATION_CLOSE, VIOLATION, INSTRUMENTATION.
Default: N/A
New Relic Webhook
To integrate with New Relic, set up a webhook notification channel in New Relic. After you configure the integration, New Relic sends alert data to Cisco Crosswork Situation Manager.
See the New Relic documentation for details on New Relic components.
Before You Begin
The New Relic integration has been validated with New Relic 2016. Before you start to set up your integration, ensure you have met the following requirements:
· You have an active New Relic account.
· You have the permissions to configure notification channels in New Relic.
· New Relic can make requests to external endpoints over port 443. This is the default.
Configure the New Relic Integration
Configure the New Relic integration in Cisco Crosswork Situation Manager as follows:
1. Navigate to the Integrations tab.
2. Click New Relic in the Monitoring section.
3. Follow the instructions to create a unique integration name. You can use the default name or customize the name according to your needs.
Additionally, set a Basic Authentication username and password.
See Configure the New Relic Webhook LAM for advanced configuration information.
Configure New Relic
Configure a notification channel in New Relic to send event data to Cisco Crosswork Situation Manager as follows. For more help, see the New Relic documentation.
You can create a channel using the REST API or by using the New Relic UI.
Create a channel using the REST API
You can create notification channels and update New Relic alert policies using REST API calls. See the New Relic documentation for more information about REST API calls for alerts.
Use the following REST call to create a notification channel to send event data to your system:
curl -X POST 'https://api.newrelic.com/v2/alerts_channels.json' \
-H 'X-Api-Key:{admin_api_key}' -i \
-H 'Content-Type: application/json' \
-d \
'{
"base_url": "http://my.moogsoft.com",
"auth_username": "moogsoft_username",
"auth_password": "moogsoft_password",
"payload_type": "application/json",
"payload": {"account_id": 1, "account_name": "my_moogsoft_com" },
"headers": {"header1": "test", "header2": "test"}
}'
Use the following REST call to update a New Relic alert policy with one or more notification channels:
curl -X PUT 'https://api.newrelic.com/v2/alerts_policy_channels.json' \
-H 'X-Api-Key:{admin_api_key}' -i \
-H 'Content-Type: application/json' \
-G -d 'policy_id=policy_id&channel_ids=channel_id'
Create a channel using the New Relic UI
Log in to New Relic to configure a notification channel to send event data to Cisco Crosswork Situation Manager. For more help, see the New Relic Documentation.
1. Create a new notification channel in New Relic with the following properties:
| Field |
Value |
| Channel Type |
Webhook |
| Channel Name |
Send to Cisco Crosswork Situation Manager |
| Base URL |
<your New Relic integration URL> For example: https://example.Cisco.com/events/newrelic_newrelic1 |
2. Enable Basic Authentication and enter the following credentials:
| Field |
Value |
| User Name |
Username set in the Cisco Crosswork Situation Manager UI. |
| Password |
Password set in the Cisco Crosswork Situation Manager UI. |
3. Add the following custom JSON payload:
{
"account_id": "$ACCOUNT_ID",
"account_name": "$ACCOUNT_NAME",
"condition_id": "$CONDITION_ID",
"condition_name": "$CONDITION_NAME",
"current_state": "$EVENT_STATE",
"details": "$EVENT_DETAILS",
"event_type": "$EVENT TYPE",
"incident_acknowledge_url": "$INCIDENT_ACKNOWLEDGE_URL",
"incident_id": "$INCIDENT_ID",
"incident_url": "$INCIDENT_URL",
"owner": "$EVENT_OWNER",
"policy_name": "$POLICY_NAME",
"policy_url": "$POLICY_URL",
"runbook_url": "$RUNBOOK_URL",
"severity": "$SEVERITY",
"targets": "$TARGETS",
"timestamp": "$TIMESTAMP"
}
4. Optionally send a test notification to verify that Cisco Crosswork Situation Manager can receive a test event from New Relic.
5. Assign the notification channel to one or more alert policies in New Relic. You can create a new alert policy or add the notification to an existing alert policy.
When New Relic detects events matching the alert policy, it automatically notifies Cisco Crosswork Situation Manager over the webhook notification channel.
Configure the New Relic Webhook LAM
The New Relic Webhook LAM is an endpoint for webhook notifications from New Relic events. The LAM parses the JSON events from New Relic into Cisco Crosswork Situation Manager events.
You can install a basic New Relic Webhook integration in the UI. See New Relic Webhook for integration steps.
Configure the New Relic Webhook LAM f you want to configure custom properties, set up high availability or configure advanced options that are not available in the UI integration.
See the New Relic documentation for details on New Relic components.
Before You Begin
Before you configure the New Relic Webhook LAM, ensure you have met the following requirements:
· You have an active New Relic account.
· You have the permissions to configure notification channels in New Relic.
· New Relic can make requests to external endpoints over port 443. This is the default.
Configure the LAM
Edit the configuration file to control the behavior of the New Relic Webhook LAM. You can find the file at $MOOGSOFT_HOME/config/newrelic_lam.conf.
The New Relic Webhook LAM is a REST-based LAM as it provides an HTTP endpoint for data ingestion. Note that only the generic REST LAM properties in newrelic_lam.conf apply to integrating with New Relic; see the LAM and Integration Reference for a full description of all properties.
1. Configure the properties for the REST connection:
a. address: Address on the Cisco Crosswork Situation Manager server that listens for REST messages. Defaults to all interfaces.
b. port: Port on the Cisco Crosswork Situation Manager server that listens for New Relic messages. Defaults to 48010.
2. Configure authentication:
a. authentication_type: Type of authentication used by the LAM. Defaults to none.
b. authentication_cache: Whether to cache the username and password for the current connection when the authentication type is Basic.
c. basic_auth_static: Username and password used for Basic Auth Static authentication.
3. Configure the SSL properties if you want to encrypt communications between the LAM and the REST connection:
a. use_ssl: Whether to use SSL certification.
b. path_to_ssl_files: Path to the directory that contains the SSL certificates.
c. ssl_key_filename: The SSL server key file.
d. ssl_cert_filename: The SSL root CA file.
e. use_client_certificates: Whether to use SSL client certification.
f. client_ca_filename: The SSL client CA file.
4. Configure the LAM behavior:
a. accept_all_json: Allows the LAM to read and process all forms of JSON.
b. num_threads: Number of worker threads to use.
c. rest_response_mode: When to sends a REST response. See the REST LAM Reference for the options.
d. lists_contain_multiple_events: Whether Cisco Crosswork Situation Manager interprets a JSON list as multiple events.
e. rpc_response_timeout: Number of seconds to wait for a REST response.
f. event_ack_mode: When Moogfarmd acknowledges events from the LAM during the event processing pipeline.
5. Optionally configure the LAM identification and log file details:
a. name: Identifies events the LAM sends to the Message Bus.
b. capture_log: Name and location of the LAM's capture log file.
c. configuration_file: Name and location of the LAM's process log configuration file.
6. Optionally configure severity conversion. See /document/preview/11721#UUID8b183a1e1278a7a652d3ae86944d7379 for further information and "Conversion Rules" in /document/preview/11720#UUID5c67156b667b1a28ec648cd779393914 for details on conversions in general.Severity ReferenceData Parsing
Example
An example New Relic Webhook LAM configuration is as follows:
monitor:
{
name : "New Relic Rest Lam Monitor",
class : "CRestMonitor",
port : 48010,
address : "0.0.0.0",
accept_all_json : true,
use_ssl : false,
#path_to_ssl_files : "config",
#ssl_key_filename : "server.key",
#ssl_cert_filename : "server.pem",
#use_client_certificates : false,
#client_ca_filename : "ca.crt",
authentication_type : "none",
authentication_cache : true,
lists_contain_multiple_events : true,
num_threads : 5,
rest_response_mode : "on_receipt",
rpc_response_timeout : 20,
event_ack_mode : "queued_for_processing"
agent:
{
name : "New Relic",
capture_log : "$MOOGSOFT_HOME/log/data-capture/newrelic_lam.log"
},
log_config:
{
configuration_file : "$MOOGSOFT_HOME/config/logging/newrelic_lam.log.json"
}
Configure for High Availability
Configure the New Relic Webhook LAM for high availability if required. See /document/preview/77155#UUIDbea404d9dd1afee65fa1471105d1b3c6 for details.High Availability Overview
Configure LAMbot Processing
The New Relic Webhook LAMbot processes and filters events before sending them to the Message Bus. You can customize or bypass this processing if required. You can also load JavaScript files into the LAMbot and execute them.
See LAMbot Configuration for more information. An example New Relic Webhook LAM filter configuration is shown below.
filter:
{
presend: "NewRelicLam.js"
}
Start and Stop the LAM
Restart the Pingdom LAM to activate any changes you make to the configuration file or LAMbot.
The LAM service name is newreliclamd.
See /document/preview/11677#UUID1a2205c3aae40b26fdfe94490043f3c3 for the commands to start, stop and restart the LAM.Control Processes
You can use a GET request to check the status of the Pingdom LAM. See "Check the LAM Status" in the Configure the REST LAM for further information and examples.
Configure New Relic
After you have the New Relic Webhook LAM running and listening for incoming requests, you can configure a notification channel in New Relic. See "Configure New Relic" in New Relic Webhook.
Node.js
Node.js is a JavaScript runtime environment that executes JavaScript code outside of a browser. To integrate with a Node.js app, you can install the node-moog module and use the API to send data to the Node.js integration.
Refer to the LAM and Integration Reference to see the integration's default properties. When you use the integrations UI, you can only configure the visible properties.
If you want to implement a more complex Node.js LAM with custom settings, see Configure the Node.js LAM.
See the Node.js documentation for information on Node.js components.
Before You Begin
The Node.js integration has been validated with Node.js v1.6. Before you start to set up your integration, ensure you have met the following requirements:
· You have a working knowledge of Node.js and can write JavaScipt code.
· You have access to the Node.js source code and the ability and permissions to rebuild your Node.js app.
· Your Node.js app can make requests to external endpoints over port 443. This is the default.
Configure the Node.js Integration
To configure the Node.js integration:
1. Navigate to the Integrations tab.
2. Click Node.js in the Monitoring section.
3. Provide a unique integration name. You can use the default name or customize the name according to your needs.
4. Set a Basic Authentication username and password.
Configure Your Node.js App
The node-moog module provides an API that enables you to create events in your Node.js app and send them directly to the Node.js integration.
Use the Node.js package manager to install the module:
npm install node-moog
The module provides two objects to manage sending events:
· moogRest: Connects the Node.js integration and submits event data.
· moogEvent: An optional event template you can use to format your event data.
Create a connection using moogRest
moogRest(object) initializes a connection to the Node.js integration based upon the information contained in a JSON formatted object as follows:
| Property |
Value |
| url |
<your Node.js integration URL> For example: https://example.Cisco.com/events/nodejs_nodejs1 |
| authUser |
Username generated in the Cisco Crosswork Situation Manager UI. |
| authPass |
Password generated in the Cisco Crosswork Situation Manager UI. |
| certFile |
Path to the server certificate. |
| caFile |
Path to the client certificate. |
For example:
var moog = require('node-moog');
// Set the connection options for your Node.js integration.
var options = {'url':'https://aiops.example.com/events/nodejs_nodejs1',
'authUser':'nodejs',
'authPass':'mysecret',
'certFile' : '../ssl/server.crt',
'caFile' : '../ssl/client.crt'
};
// Initialize the the connection.
var moogRest = moog.moogREST(options);
Submit event data using moogRest
moogRest.sendEvent(moogEvent,callback) passes an event in JSON format or an array of events to the Node.js integration. There is an event emitter that provides two events: ok and error.
| Parameter |
Description |
| moogEvent |
JSON object or an array of JSON objects that represent events to report |
| callback |
Function to handle the HTTP response |
For example:
// Create a proforma event.
var moogEvent = new moog.MoogEvent();
moogEvent.description = 'A demo event';
// Send the event to the Node.js integration.
// The callback function is defined inline.
moogRest.sendEvent(moogEvent, function (res, rtn) {
if (rtn == 200) {
console.log('moogRest message sent, return code: ' + rtn);
console.log('moogRest result: ' + res.message);
//process.exit(1);
} else {
console.log('moogRest - ' + rtn);
console.log('moogRest - ' + res);
process.exit(1);
}
});
Create an event using moogEvent
moogEvent(mEvent) initializes an event object. mEvent is an optional default event template. When you create an event using the proforma, you can pass a partial moogEvent. The module provides default values for any properties without values.
| Property |
Type |
Description |
| signature |
String |
Identifies the event. Usually source:class:type. |
| source_id |
String |
Unique identifier for the source machine. |
| external_id |
String |
Unique identifier for the event source. |
| manager |
String |
General identifier of the event generator or intermediary. |
| source |
String |
Hostname or FQDN of the source machine that generated the event. |
| class |
String |
Level of classification for the event. Follows hierarchy class then type. |
| agent_location |
String |
Geographical location of the agent that created the event. |
| type |
String |
Level of classification for the event. Follows hierarchy class then type. |
| severity |
Int |
Severity level of the event from 0-5 (clear - critical). |
| description |
String |
Text description of the event. |
| first_occurred |
Epoch int |
Timestamp of the first occurrence of the event in Unix epoch time. |
| agent_time |
Epoch int |
Timestamp of the current occurrence of the event in Unix epoch time. |
For example, to create a new event and edit the value of the description:
var moog = require('node-moog');
var MoogEvent = moog.MoogEvent;
// Initialize an event.
myEvent = new MoogEvent();
//Change the value of an event property.
myEvent.description = 'My new description';
The following example demonstrates how to send a single event to the Node.js integration:
var moog = require('node-moog');
// Set the connection options for your Node.js integraion.
var options = {'url':'https://aiops.example.com/events/nodejs_nodejs1',
'authUser':'nodejs',
'authPass':'CUKeB3XhDr1MaypG',
'certFile' : './ssl/certificate.pem',
'caFile' : './ssl/certificate.key'
};
// Initialize the REST connection.
var moogRest = moog.moogREST(options);
// Create a proforma event.
var moogEvent = new moog.MoogEvent();
// Change the event description.
moogEvent.description = 'Demo event.';
console.log(moogEvent)
// Send the event to the Node.js integration.
// The callback processes the HTTP response from the integration
// and prints it to the console.
moogRest.sendEvent(moogEvent, function (res, rtn) {
if (rtn == 200) {
console.log('moogRest message sent, return code: ' + rtn);
console.log('moogRest result: ' + res.message);
//process.exit(0);
} else {
console.log('moogRest - ' + rtn);
console.log('moogRest - ' + res);
process.exit(1);
}
});
Configure the Node.js LAM
The Node.js LAM is an endpoint for HTTP notifications from a Node.js application. The LAM parses the data from the app into Cisco Crosswork Situation Manager as events.
You can install a basic Node.js integration in the UI. See Node.js for integration steps.
Configure the Node.js LAM if you want to configure custom properties, set up high availability or configure advanced options that are not available in the UI integration.
See the Node.js documentation for information on Node.js components.
Before You Begin
The Node.js integration has been validated with Node.js v1.6. Before you set up the LAM, ensure you have met the following requirements:
· You have a working knowledge of Node.js and can write JavaScipt code.
· You have access to the Node.js source code and the ability and permissions to rebuild your Node.js app.
· Your Node.js app can make requests to external endpoints over port 443. This is the default.
· If you are configuring a distributed deployment refer to /document/preview/77155#UUIDbea404d9dd1afee65fa1471105d1b3c6 first. You will need the details of the server configuration you are going to use for HA.High Availability Overview
Configure the LAM
Edit the configuration file to control the behavior of the Node.js LAM. You can find the file at $MOOGSOFT_HOME/config/nodejs_lam.conf
The Node.js LAM is a REST-based LAM as it provides an HTTP endpoint for data ingestion. Note that only the generic REST LAM properties in nodejs_lam.conf apply to integrating with Node.js; see the LAM and Integration Reference for a full description of all properties.
Some properties in the file are commented out by default. Uncomment properties to enable them.
1. Configure the properties for the REST connection:
a. address: Address on the Cisco Crosswork Situation Manager server that listens for REST messages. Defaults to all interfaces.
b. port: Port on the Cisco Crosswork Situation Manager server that listens for REST messages. Defaults to 48011.
2. Configure authentication:
a. authentication_type: Type of authentication used by the LAM. Defaults to none.
b. authentication_cache: Whether to cache the username and password for the current connection when the authentication type is Basic.
3. Configure the SSL properties if you want to encrypt communications between the LAM and the REST connection:
a. use_ssl: Whether to use SSL certification.
b. path_to_ssl_files: Path to the directory that contains the SSL certificates.
c. ssl_key_filename: The SSL server key file.
d. ssl_cert_filename: The SSL root CA file.
e. use_client_certificates: Whether to use SSL client certification.
f. client_ca_filename: The SSL client CA file.
g. auth_token or encrypted_auth_token: Authentication token in the request body.
h. header_auth_token or encrypted_header_auth_token: Authentication token in the request header.
i. ssl_protocols: Sets the allowed SSL protocols.
4. Configure the LAM behavior:
a. num_threads: Number of worker threads to use when processing events.
b. rest_response_mode: When to send a REST response. See the LAM and Integration Reference for the options.
c. rpc_response_timeout: Number of seconds to wait for a REST response.
d. event_ack_mode: When Moogfarmd acknowledges events from the REST LAM during the event processing pipeline.
e. accept_all_json: Allows the LAM to read and process all forms of JSON.
f. lists_contain_multiple_events: Whether Cisco Crosswork Situation Manager interprets a JSON list as multiple events.
5. Optionally configure the LAM identification and logging details in the agent and log_config sections of the file:
a. name: Identifies events the LAM sends to the Message Bus.
b. capture_log: Name and location of the LAM's capture log file.
c. configuration_file: Name and location of the LAM's process log configuration file.
6. Optionally configure severity conversions. See /document/preview/11721#UUID8b183a1e1278a7a652d3ae86944d7379 for further information and "Conversion Rules" in /document/preview/11720#UUID5c67156b667b1a28ec648cd779393914 for details on conversions in general.Severity ReferenceData Parsing
Example
The following example demonstrates a Node.js LAM configuration.
monitor:
{
name : "Nodejs Lam",
class : "CRestMonitor",
port : 48011,
address : "0.0.0.0",
use_ssl : false,
#path_to_ssl_files : "config",
#ssl_key_filename : "server.key",
#ssl_cert_filename : "server.pem",
#use_client_certificates : false,
#client_ca_filename : "ca.crt",
#auth_token : "my_secret",
#encrypted_auth_token : "dfJtTQMGiFHfiq7sCmxguBt6Jv+eytkoiKCquSB/7iWxpgGsG2aez3z2j7SuBtKj",
#header_auth_token : "my_secret",
#encrypted_header_auth_token : "dfJtTQMGiFHfiq7sCmxguBt6Jv+eytkoiKCquSB/7iWxpgGsG2aez3z2j7SuBtKj",
#ssl_protocols : [ "TLSv1.2" ],
authentication_type : "none",
authentication_cache : true,
accept_all_json : false,
lists_contain_multiple_events : true,
num_threads : 5,
rest_response_mode : "on_receipt",
rpc_response_timeout : 20,
event_ack_mode : "queued_for_processing"
},
agent:
{
name : "Nodejs",
capture_log : "$MOOGSOFT_HOME/log/data-capture/nodejs_lam.log"
},
log_config:
{
configuration_file : "$MOOGSOFT_HOME/config/logging/nodejs_lam_log.json"
},
Configure for High Availability
Configure the Node.js LAM for high availability if required. See /document/preview/77155#UUIDbea404d9dd1afee65fa1471105d1b3c6 for details.High Availability Overview
Configure LAMbot Processing
The Node.js LAMbot processes and filters events before sending them to the Message Bus. You can customize or bypass this processing if required. You can also load JavaScript files into the LAMbot and execute them.
See LAMbot Configuration for more information. An example Node.js LAM filter configuration is shown below.
filter:
{
presend: "nodejsLam-SolutionPak.js",
modules: [ "CommonUtils.js" ]
}
Start and Stop the LAM
Restart the Node.js LAM to activate any changes you make to the configuration file or LAMbot.
The LAM service name is nodejslamd.
See /document/preview/11677#UUID1a2205c3aae40b26fdfe94490043f3c3 for the commands to start, stop and restart the LAM.Control Processes
You can use a GET request to check the status of the Node.js LAM. See "Check the LAM Status" in Configure the REST LAM for further information and examples.
Configure Your Node.js App
After you have the Node.js LAM running and listening for incoming requests, you can configure your Node.js application. See "Configure your Node.js App" in Node.js.
Node-RED
To integrate with Node-RED, install a Node-RED connector for Cisco Crosswork Situation Manager and configure a flow to use the connector as an output. After you complete the integration, Node-RED uses the flow to forward data to the Node-RED integration.
See the Node-RED documentation for details on Node-RED components.
Before You Begin
The Node-RED integration has been validated with Node-RED v. 016 and v. 017. Before you start to set up your integration, ensure you have met the following requirements:
· You have the URL for your Node-RED system.
Configure the Node-RED Integration
Configure the Node-RED integration in Cisco Crosswork Situation Manager as follows:
1. Navigate to the Integrations tab.
2. Click Node-RED in the Monitoring section.
3. Provide a unique integration name. You can use the default name or customize the name according to your needs.
4. Set a Basic Authentication username and password.
Configure Node-RED
To configure Node-RED to send event data to Cisco Crosswork Situation Manager, you must install the Cisco Crosswork Situation Manager (moog) node for Node-RED. Then use the moog node to send data from your flow to the Node-RED integration.
1. Use the node package manager to install the Cisco Crosswork Situation Manager node from the command line:
npm install -g node-red-contrib-moog
2. Build a flow that uses the the moognode as an output. For example:
| Node |
Configuration |
||||||||||
| inject |
|
||||||||||
| json |
default |
||||||||||
| moog |
|
When you deploy the flow, the moog node shows that it has 'connected'. You can see the 'heartbeat' alert in the alerts list in Cisco Crosswork Situation Manager. For additional examples, see Configure the Node-RED LAM.
Configure the Node-RED LAM
To use the Node-RED connector for Cisco Crosswork Situation Manager you will need to install some components.
See Node-RED for UI configuration instructions.
Install Node and Node-RED
1. Install node.js: see https://nodejs.org/en/download/ for downloads and details. We recommend the LTS version.
2. Install Node-RED. See https://nodered.org/.
Install the Cisco Crosswork Situation Manager node
cd ~/.node-red
npm install node-red-contrib-moog
Install a Generic REST listener
In Cisco Crosswork Situation Manager, log in as an admin, select System Administration from the menu then select monitoring from under the Integrations heading. Install a Generic monitoring component by clicking on the +Add Monitoring Integration option and selecting the Generic tile. We will use the name Generic1 for this tutorial so if you choose a new name please make a note to change the Cisco Crosswork Situation Manager connection nodes attributes accordingly.
Build your first flow
You now have the basic framework to start building flows and sending messages to Cisco Crosswork Situation Manager. To test this we will build a basic flow using the Inject input node.
1. Start Node-RED:
node-red
2. Point your browser at the URL provided by the Node-RED start script, the default will be 'Server now running at http://localhost:1880/ '.
3. Drag the inject node on the left from the input palette onto the workspace.
4. Double click this node and configure the properties as follows:
a. Payload: {}JSON: {"description":"Node-red Heartbeat","source":"myHost","agent_location":"Node-RED","severity":"0"}
b. Topic: Heartbeat
c. Repeat: Interval, 15 Seconds and check the Inject once at start option
d. Click Done.
5. Connect this message to Cisco Crosswork Situation Manager:
a. convert the payload to a Javascript Object
b. drag the json node from the function palette
c. connect the output from the Inject node to the input of the json node
d. drag in the moog node from the output palette
e. wire the output from the json node to the input of the moog node.
6. Double click the moog node and enter the URL, User ID and Password provided in the Generic connector screen in Cisco Crosswork Situation Manager.
7. Click on the Deploy button in the top right of the Node-RED screen to save your flow to the server. If all is correct you should see the moog node is now 'connected' and a 'heartbeat' alert should be seen in your all alerts list in Cisco Crosswork Situation Manager.
Or import this sample flow, replacing yourinstance and yourpassword with the details found in the Cisco Crosswork Situation Manager connector configuration screen.
[{"id":"561eb847.e6bd48","type":"tab","label":"Flow 1"},{"id":"804d8f6a.50956","type":"moog","z":"561eb847.e6bd48","name":"","url":"https://yourinstance.moogsoft.com/events/Generic1","user":"Generic","pass":"yourpassword","x":519,"y":105,"wires":[]},{"id":"69318047.adc82","type":"inject","z":"561eb847.e6bd48","name":"Heartbeat","topic":"heartbeat","payload":"{\"description\":\"Heartbeat\",\"agent_location\":\"mylaptop\",\"agent\":\"Node-red Heartbeat\",\"severity\":0}","payloadType":"json","repeat":"300","crontab":"","once":true,"x":141,"y":105,"wires":[["543ed6ad.ac51d8"]]},{"id":"543ed6ad.ac51d8","type":"json","z":"561eb847.e6bd48","name":"","x":337,"y":105,"wires":[["804d8f6a.50956"]]}]
Build a Twitter Flow
To build the Twitter feed, you will need a Twitter account.
1. Drag the Twitter node from social, the sentiment node from analytics and a function node, optionally add a debug output node and wire them all together with the moog node.
2. Double click the Twitter node and add your credentials, clicking done when completed. Then double click the function node, give it a name and then enter this code:
var score;
msg.moog= {};
msg.moog.class = 'Twitter';
msg.moog.type = msg.topic;
if (msg.location && msg.location.place) msg.moog.location = msg.location.place;
msg.moog.description = msg.payload;
msg.moog.source = msg.tweet.user.name;
msg.moog.external_id = msg.tweet.id_str;
if (msg.sentiment && msg.sentiment.score) {
score = Math.round(Math.abs(msg.sentiment.score - 5) / 2);
if (score < 0) score = 0;
if (score > 5) score = 5;
msg.moog.severity = score;
}
return msg;
3. Click Done when completed.
4. Double click the moog node and add credentials as before, then click done.
5. Publish the flow and check the alerts in Cisco Crosswork Situation Manager, you should see tweet events in your alert list.
Congratulations you now have a Twitter feed!
Check the Node-RED LAM Status
You can use a GET request to check the status of the Node-RED LAM. See "Check the LAM Status" in Configure the REST LAM for further information and examples.
Oracle Enterprise Manager
You can install the OEM connector on your Oracle Enterprise Manager (OEM) to send alert data to Cisco Crosswork Situation Manager. This integration requires you to use the Oracle Enterprise Manager command line client and web UI to import and configure the OEM Connector. Before you attempt this integration, you should familiarize yourself with these Oracle Enterprise Manger tools.
The OEM integration does not allow authentication options and does not require password authentication.
See the Oracle Enterprise Manager documentation for details on OEM components.
Before You Begin
The OEM integration has been validated with Oracle Enterprise Manager 12c and 13c. Before you start to set up your OEM integration, ensure you have met the following requirements:
· You have the credentials for the OEM Administrator user. For example, "sysman".
· You have the URL for your OEM UI.
· You can make requests from the OEM server to external endpoints over port 443.
Configure the OEM Integration
You can configure the OEM integration in Cisco Crosswork Situation Manager as follows:
1. Navigate to the Integrations tab.
2. Click OEM to open the OEM integration.
3. Provide a unique integration name. You can use the default name or customize the name according to your needs.
4. Set a Basic Authentication username and password.
Configure Oracle Enterprise Manager
These instructions provide basic guidelines to download and configure the Cisco OEM Connector. For details on how to use OEM Components, see the Oracle Enterprise Manager documentation.
1. Download the Moogsoft OEM Connector and copy it to the OEM bin directory.
2. Log in to the Enterprise Manager client as the sysman user and import the OEM Connector. For example:
emcli login -username=sysman
emcli import_update -file=moogsoft_oem_connector-2.0.oem -omslocal
3. Restart OEM.
4. Login to the OEM UI as the sysman user.
5. Navigate to Setup > Extensibility > Self Update to access the OEM Self Update Console.
6. Select the Management Connector Type to open the Management Connector window.
7. Apply the update available for the Cisco Connector.
8. Navigate to Setup > Extensibility > Management Connectors to access the OEM Management Connectors Console.
9. Select Cisco Connector from the Create Connector drop-down and click Go to add a Cisco Connector.
10. Configure the Cisco Connector as follows:
| Field |
|
| Create Event |
The URL of your OEM integration. For example: https://example.Cisco.com/events/oem_lam_oem1 |
| Update Event |
The URL of your OEM integration. For example: https://example.Cisco Crosswork Situation Manager.com/events/oem_lam_oem1 |
| User name |
The OEM integration username. "OEM" by default. |
| Password |
The OEM integration user's password. |
| Retry |
Enabled |
| Expiration Hours |
Enter the number of hours the connector waits between attempts to establish connections. |
After you complete the installation and configuration, you can create Incident Rules for OEM with actions that forward events to the Cisco Connector.
RabbitMQ LAM
The RabbitMQ LAM allows Cisco Crosswork Situation Manager to ingest events from both direct queues and topic-based queues in RabbitMQ.
The LAM ingests JSON messages from an active RabbitMQ broker, for example:
· A broker within your infrastructure.
· A broker connected to third-party monitoring tools.
See the RabbitMQ documentation for details on RabbitMQ components.
Before You Begin
The RabbitMQ LAM has been validated with RabbitMQ 3.7.3. Before you set up the LAM, ensure you have met the following requirements:
· You have installed RabbitMQ.
· You have your RabbitMQ server name.
· You have a user with permissions to access the RabbitMQ server.
· The configured port is accessible by both parties. The default RabbitMQ port is 5672.
· You have set up the appropriate RabbitMQ exchange. The type must be 'direct' or 'topic'.
Configure the RabbitMQ LAM
To configure the RabbitMQ LAM, you can edit the rabbitmq_lam.conf configuration file. This contains the following parameters:
| Parameter |
Description |
Default |
| name |
Do not change. |
RabbitMQ Monitor |
| class |
Do not change. |
CRabbitMQMonitor |
| host |
Hostname/IP address of RabbitMQ server. |
rabbitmq-host.com |
| virtual host |
Name of the virtual host (vhost) to connect the LAM to. See the RabbitMQ documentation for information on vhosts. |
/ |
| username |
RabbitMQ username. |
username |
| password |
RabbitMQ password. |
password |
| encrypted_password |
Encrypted RabbitMQ password. |
4DZkk9W294Z+dDKMS1EMO8BCi7vyhGFNzra3T1w/Na4= |
| accept_all_json |
If enabled, the LAM accepts and processes all forms of JSON. |
true |
| lists_contain_multiple_events |
If enabled and Cisco Rest protocol is not in use, Cisco Crosswork Situation Manager interprets a list as a collection of multiple events If disabled, a list represents a single event. |
true |
| message_prefetch |
Controls how many messages the LAM takes from the RabbitMQ queue and holds in memory as a buffer for processing. This allows processes to have throttled message consumption to ease backlog and memory consumption issues. When set to '0', the message prefetch is unlimited so the LAM takes as many messages as are available. To achieve high availability of messages and ensure messages get processed, the number should be higher than zero. |
0 |
The other parameters are queue specific, so your configuration depends on the type of queue.
Direct Queue
Configure a direct queue in RabbitMQ if the client is publishing messages to a specific queue name.
The parameters in rabbitmq_lam.conf must match your queue information precisely. Pay special attention of you are using an existing queue. Alternatively, if you want to create one, configure as required.
| Parameter |
Description |
Default |
| direct_queue_name |
Name of the direct queue in RabbitMQ. |
RabbitMQ_LAM_Queue |
| direct_queue_durable |
If enabled, the queue persists if the RabbitMQ server restarts. |
false |
| direct_queue_autodelete |
If enabled, RabbitMQ deletes the queue when the LAM stops running. |
false |
| direct_queue_exclusive |
If enabled, the queue only uses this LAM's connection and is deleted when the connection closes. If the queue is exclusive, it cannot be durable. |
false |
See the RabbitMQ documentation for more information on these parameters.
Topic Queue
The topic exchange must exist in RabbitMQ before you start the LAM. Configure a topic-based queue in RabbitMQ when the client is publishing messages using topics.
| Parameter |
Description |
Default |
| topic_queue_name |
Name of the topic queue in RabbitMQ. |
RabbitMQ_LAM_Topic_Queue |
| topics |
Names of the topics for the topic queue. |
["RabbitMQ_LAM_Topic1", "RabbitMQ_LAM_Topic2"], |
| topic_exchange |
Name of the topic exchange in RabbitMQ. This must exist prior to starting the LAM if selecting a topic queue. |
RabbitMQ_LAM_Topic_Exchange |
| topic_queue_durable |
If enabled, the queue persists if the RabbitMQ server restarts. |
false |
| topic_queue_autodelete |
If enabled, RabbitMQ deletes the queue when the LAM stops running. |
false |
| topic_queue_exclusive |
If enabled, the queue only uses this LAM's connection and is deleted when the connection closes. If the queue is exclusive, it cannot be durable. |
false |
Configure SSL
You can configure SSL to secure communication between the RabbitMQ LAM and RabbitMQ.
There are three forms of SSL available:
· No SSL - SSL configuration is disabled.
· Express SSL - SSL configuration is specified but empty and specific certificates are not included.
· Custom SSL - SSL configuration is enabled and you specify certificates for the LAM to use when connecting to RabbitMQ.
The client key and certificate are optional. If neither are specified then client certification verification is not performed. However, if the RabbitMQ broker you are connecting to has SSL enabled, then you need to configure the LAM to also use SSL.
The available SSL parameters are as follows:
| Parameter |
Description |
Default |
| ssl_protocol |
SSL protocol to be used by RabbitMQ |
TLSv1.2 |
| server_cert_file |
Path to the RabbitMQ server certificate |
server/cert.pem |
| client_cert_file |
Path to the RabbitMQ client certificate |
client/cert.pem |
| client_cert_key |
Path to the RabbitMQ client key |
client/key.key |
See the RabbitMQ documentation on TLS and SSL support for more information.
Example Events
You can follow RabbitMQ tutorials to send a test event to Cisco Crosswork Situation Manager.
Use the following JSON payload as a Cisco event example:
{
"signature":"my_test_box:application:Network",
"source_id":"192.0.2.0",
"external_id":"id-1234",
"manager":"my_manager",
"source":"my_test_box",
"class":"application",
"agent_location":"my_agent_location",
"type":"Network",
"severity":3,
"description":"high network utilization in application A",
"agent_time":"1411134582"
}
REST Client LAM
The REST Client LAM is an HTTP client LAM that makes use of one or more REST API sources to request event data and ingest it into Cisco Crosswork Situation Manager. It sends HTTP requests to the REST server at configurable intervals and parses the JSON responses received from the server, and then it processes events from the responses.
The REST Client LAM ingests event data from RESTful services.
Requirements
The ingestion of event data from RESTful Services requires Cisco Crosswork Situation Manager to be running a REST Client LAM, configured to parse JSON responses from RESTful services. For endpoints that require authentication, specify credentials in the REST Client LAM configuration file rest_client_lam.conf.
The REST Client LAM processes the events received from the REST API based on the configurations done in the following two files:
| File |
Description |
| $MOOGSOFT/config/rest_client_lam.conf |
Rest Client LAM configuration file. |
| $MOOGSOFT/bots/lambots/RestClientLam.js |
LAMbot file that processes the event data received from the event source. |
You have to configure the above 2 files as per their requirements based on the event format received from the REST API.
Note:
The performance of Cisco Crosswork Situation Manager depends on the number of events received per second and the specifications of the Cisco Crosswork Situation Manager system on which the REST ClientLAM is running.
Configuration
The configuration file contains a JSON object. At the first layer of the object, LAM has a parameter called config, and the object that follows configuration has all the necessary information to control the LAM.
Monitor
The REST Client LAM takes the connection information from the Monitor section of the config file. You can configure the parameters here to establish a connection with REST Client.
General
| Field |
Type |
Description |
Example |
| name and class |
String |
Reserved fields: do not change. Default values are REST Client Monitorand CRestClientMonitor. |
|
| request_interval |
Integer |
This is the time interval (in seconds) between 2 successive HTTP requests. Default:60 seconds. |
If you have entered 30 seconds as request_interval value, and you have started the REST Client LAM, then it will wait for 30 seconds before sending the second request. |
| targets |
JSON Object |
A top-level container for which you can define one or more REST endpoint targets that you want to poll. |
See the multiple target example below |
| target |
JSON Object |
A single REST endpoint to poll. |
See the multiple target example below. You can specify all the configurations for a REST endpoint. If you don't specify a request_interval, the target uses the globally defined interval. |
| user and password |
String |
Enter the username and password for accessing the REST endpoint. |
|
| encrypted_password |
String |
If the password is encrypted, then enter the encrypted password in this field and comment out the password field. If you configure both fields, the Rest Client LAM uses encrypted_password. |
|
| proxy |
Object |
If you want to connect to the REST endpoint through a proxy server, configure the host, port, user, and password or encrypted password properties in the proxy section for the target. |
|
| disable_certificate_validation |
Boolean |
Set to false if the SSL certificate for the event server is valid. Setting it to true will disable the SSL certificate validation for the event server. By default it is set to true. |
|
| server_cert_filename |
String |
Enter the server certificate name here. Use the certificate "server.crt" here. The cert file should be present in the directory given in path_to_ssl_filesfield. |
|
| use_client_authentication |
Boolean |
If you want client authentication, set it to true, else you can set it to false. By default, it is set to false. If it is set to true, then the values will be entered in the client_key_filename and the client_cert_filename fields. |
|
| client_key_filename |
String |
Enter the name of the key file here. The key file should be present in the directory given in path_to_ssl_filesfield. |
"client.key" |
| client_cert_filename |
String |
Enter the name of the certificate file here. The cert file should be present in the directory given in path_to_ssl_filesfield. |
"client.crt" |
| requests_overlap |
Integer |
You can augment request time frame with an overlap to ensure that no events are getting missed. The LAM can identify any duplicate events without processing them by using the overlap_identity_fields configuration. This is the time (in seconds) more than the request_interval the LAM has to wait to request data. Default:10 seconds, if no value is specified, thenrequests_overlap will set to default. |
If request_interval is set to 120 seconds and request_overlap is set to 10, then the LAM will send a request in every two minutes (120 seconds). The overlap is set to 10 seconds, so each request will ask for data from the last 2 minutes and 10 seconds. |
| url |
String |
This is the request URL for the endpoint to pull events (including hostname or IP Address). If IP address along with port is entered in the field, then append a "/" in the end. |
http://localhost:8896/ |
| request_query_params |
String |
These are the request query parameters. All the members of this map will be added to the request URL as URL encoded, so the URL will look like url?key1=value1&key2=value2... |
Example 1: The following code block provides a sample request query request_query_params : The URL for the above request query will be url?get=events&myInt=12345&myString=endPoint&myVersion=3 Example 2: The following code block provides a sample request query containing a to and from parameter request_query_params : The default request_query_params block includes option 'to' and 'from' variables which are special internally calculated timestamps worked out based on the request_interval and the request_overlap compared to the current system time. These timestamps variables can be used in the request_query_params block by prefixing them with a dollar sign. The timestamp format is governed by the field params_date_format. |
| params_date_format |
String |
Enter the format of timestamps that are sent in the request URL. |
"%Y-%m-%dT%H:%M:%S" |
| enable_epoch_converter |
Boolean |
Setting it to true will convert the time stamps in the request URL to epoch time. |
|
| results_as_list |
Boolean |
If the LAM is supposed to get events in a list, then set it to true, otherwise set it to false. |
|
| results_path |
Boolean |
If the events in the response JSON are not in a list, then this will identify where to find the event JSON. |
"results.subObject.events" |
| overlap_identity_fields |
String |
Setting the requests_overlap value can give the same event twice, setting this parameter will tell the LAM how to identify the duplicate events. Duplicate events will be ignored in the second interval. |
["signature", "source_id", "agent_time", "description"] |
| num_threads |
Integer |
The number of threads the REST Client LAM will use. If no value is specified, then the number of threads to use will be the number of CPUs available, up to a maximum of 8 can be used. Defaults to 5. |
|
| retry-recovery |
Object |
Specifies the behavior of the LAM when it re-establishes a connection after a failure. - recovery_interval: Length of time to wait between recovery requests in seconds. Must be less than the request_interval set for each target. Defaults to 20. - max_lookback: The period of time for which to recover missed events in seconds. Defaults to -1 (recover all events since the last successful poll). |
|
| timeout |
Integer |
This is the timeout value in seconds, whichwill be used to timeout a connection, socket and request. If no value is specified, then the time interval will set to 120 seconds. Default:120 seconds, if no value is specified, thentimeout will set to default. |
|
Secure Sockets Layer
| Field |
Type |
Description |
| use_ssl |
Boolean |
Set to true to enable SSL Communication: path_to_ssl_files: Enter the path of the directory where all the certificates are stored. If the path begins with ‘.’ or ‘/’ then, the path will be used as specified. Otherwise, MOOGSOFT_HOME is prepended to the path. For example, if MOOGSOFT_HOME is /opt/moogsoft/ and path_to_ssl is set to config, then the location will be defined as /opt/moogsoft/config. |
Single Target Example
config :
{
monitor:
{
name : "REST Client Monitor",
class : "CRestClientMonitor",
request_interval : 60,
user : "username",
password : "password",
#encrypted_password : "ieytOFRUdLpZx53nijEw0rOh07VEr8w9lBxdCc7229o=",
enable_proxy : false,
proxy_host : "",
proxy_port : 808,
proxy_user : "",
#encrypted_proxy_password : "",
proxy_password : "",
use_ssl : false,
disable_certificate_validation : false,
path_to_ssl_files : "config",
server_cert_filename : "server.crt",
use_client_authentication : false,
client_key_filename : "client.key",
client_cert_filename : "client.crt",
requests_overlap : 10,
url : "",
request_query_params : {
get : "events",
start: "$from",
end : "$to"
},
params_date_format : "%Y-%m-%dT%H:%M:%S",
enable_epoch_converter : false,
results_as_list : false,
results_path : "results",
overlap_identity_fields : ["signature", "source_id", "agent_time", "description"]
num_threads : 5,
timeout : 120
},
Multiple Target Example
The example below shows how to configure the monitor object to request data from multiple REST endpoints. In this case the targets are named for the location of the target, "Kingston" and "San Francisco":
monitor:
{
name: "REST Client Monitor",
class: "CRestClientMonitor",
request_interval: 60,
targets:
{
kingston:
{
user: "kingstonuser",
password: "password",
disable_certificate_validation: false,
requests_overlap: 10,
url: "http://kingston-host/api/events",
overlap_identity_fields: ["id"],
timeout: 120
},
sanfrancisco:
{
request_interval: 30,
user: "sfuser",
password: "password",
disable_certificate_validation: false,
requests_overlap: 10,
url: "http://sf-host/api/events",
overlap_identity_fields: ["id"],
timeout: 120
}
}
Agent and Process Log
The Agent and Process Log sections allow you to configure the following properties:
· name: Identifies events the LAM sends to the Message Bus.
· capture_log: Name and location of the LAM's capture log file.
· configuration_file: Name and location of the LAM's process log configuration file.
Mapping
For events received in JSON format, you can directly map the event fields of REST Client LAM with Cisco Crosswork Situation Manager fields. The parameters of the received events are displayed in Cisco Crosswork Situation Manager according to the mapping done here:
mapping :
{
catchAll: "overflow",
rules:
[
{ name: "signature", rule: "$signature" },
{ name: "source_id", rule: "$source_id" },
{ name: "external_id", rule: "$external_id" },
{ name: "manager", rule: "$manager" },
{ name: "source", rule: "$source" },
{ name: "class", rule: "$class" },
{ name: "agent", rule: "$agent" },
{ name: "agent_location", rule: "$host" },
{ name: "type", rule: "$eventType" },
{ name: "description", rule: "$description" },
{ name: "severity", rule: "$severity" },
{ name: "agent_time", rule: "$time", conversion: "timeConverter" }
]
},
filter:
{
presend: "RestClientLam.js"
}
The above example specifies the mapping of the REST Server event fields with the Moogsoft AIOps fields.
Note:
The signature field is used by the LAM to identify correlated events.
State File
The REST Client LAM will save the last poll time of the request sent to the REST Server. This last poll time will be saved in a state file. The REST Client LAM will read/write the last poll time from/to this state file. The LAM will read/write from the state file by using the RestClientLam.js file. To read and write the state file you have to modify the RestClientLam.js.
Note:
The state file is generated in the same folder where the config file is present e.g. $MOOGSOFT_HOME/config. The LAM generates the name of the state file as <proc_name>.state. Here the default proc_name (process name) is rest_client_lam, therefore, the state file name is rest_client_lam.state. proc_name is defined in the rest_client_lam.sh file located at $MOOGSOFT_HOME/bin.
LAMBot Configuration
The LAMbot processes the event data received from RESTful Services. The LamBot RestClientLam.js script can be configured for GET and POST requests. The following example shows a LAMbot configuration for GET request. This configuration primarily reads/writes the last poll time data from/to the state file.
var logger=LamBot.loadModule("Logger");
var constants=LamBot.loadModule("Constants");
/*This variable is used to determine if the LAM is running for the first time, and accordingly we need to update the state file
or read data from the state file
*/
var firstTime = true;
function onLoad()
{
/* constants.load() loads the data form the state file. The state file usually has the last poll time saved in it.
Last poll time can be appended in the url for polling from the lass poll time;
*/
constants.load();
return;
}
function preClientSend(outboundEvent)
{
/* outBoundEvent contains below field which can be manipulated as per requirement
1. method - by default method is set to GET request
2. body - contains all the values of request_query_param from the config file
3. header - can contain additional headers
*/
return true;
}
function modifyResponse(inBoundEventData)
/* If you want to modify response data before injecting it into LAM for tokenizing, then the event data can be modified here
The inBoundEventData contains the following field which can be manipulated as per the requirement
1. responseData - the event data received from the rest server
*/
{
return true;
}
function presend(event)
{
return( true );
}
LamBot.filterFunction("presend");
LamBot.preClientSendFunction("preClientSend");
LamBot.modifyResponseFunction("modifyResponse");
The following example shows the LAMbot configuration for a POST request with a JSON payload in which the last poll time is being written and read from the state file.
var logger=LamBot.loadModule("Logger");
var constants=LamBot.loadModule("Constants");
/*This variable is used to determine if the LAM is running for the first time, and accordingly we need to update the state file
or read data from the state file
*/
var firstTime= true;
function onLoad()
{
/* constants.load() loads the data form the state file. The state file usually has the last poll time saved in it.
Last poll time can be appended in the url for polling from the lass poll time;
*/
constants.load();
return;
}
function preClientSend(outBoundEvent)
{
/*outBoundEvent contains below field which can be manipulated as per requirement
1. method - by default method is set to GET request
2. body - contains all the values of request_query_param from the config file
3. header - can contain additional headers
*/
var body = outBoundEvent.value('body'); // reads body from outBoundEvent
if(firstTime)
{
if(constants.contains("start") == true)
{
var start = constants.get("start"); // reads the last poll time value from the state file
body['start'] = start; // replaces value of the start in body with a new value
outBoundEvent.set('body',body); // resets value of body with modified body
constants.save();
firstTime = false;
}
else
{
constants.put("start",body['start']);
constants.save();
firstTime = false;
}
}
else
{
constants.put("start",body['start']);
constants.save();
}
// methods that can be used here are'Post','Put',and 'Delete';
outBoundEvent.set("method","Post");
var properties = outBoundEvent.value("header");
// Header is used if the method used is Put or Delete or Post. Content type should always be defined otherwise it will give an error
properties["Content-Type"] = "application/json";
outBoundEvent.set("header",properties);
//If LAM is not able to convert the request_query_parm in an accepted JSON format, then the user can force the LAM to use the assigned inputs given below as a string, and use it in body of the request.
//outboundEvent.set("body",
//'{"action":"EventsRouter","method":"query","data":[{"params":{"severity":[5,4,3,2,1,0],"eventState":[0,1,2,3,4,5]},"limit":9}],"type":"rpc","tid":1}');
return true;
}
function modifyResponse(inBoundEventData)
/* If you want to modify response data before injecting it into LAM for tokenizing, then the event data can be modified here
The inBoundEventData contains the following field which can be manipulated as per the requirement
1. responseData - the event data received from the rest server
*/
{
return true;
}
function presend(event)
{
// returning true, makes this an event on the MooMs bus, false will cause the LAM to discard the event.
return( true );
}
LamBot.filterFunction("presend");
LamBot.preClientSendFunction("preClientSend");
LamBot.modifyResponseFunction("modifyResponse");
The following example shows the LAMbot configuration for a POST request with an XML payload in which the last poll time is being written and read from the state file.
var logger=LamBot.loadModule("Logger");
var constants=LamBot.loadModule("Constants");
/*This variable is used to determine if the LAM is running for the first time, and accordingly we need to update the state file
or read data from the state file
*/
var firstTime= true;
function onLoad()
{
/* constants.load() loads the data form the state file. The state file usually has the last poll time saved in it.
Last poll time can be appended in the url for polling from the lass poll time;
*/
constants.load();
return;
}
function preClientSend(outBoundEvent)
{
/*outBoundEvent contains below field which can be manipulated as per requirement
1. method - by default method is set to GET request
2. body - contains all the values of request_query_param from the config file
3. header - can contain additional headers
*/
var body = outBoundEvent.value('body'); // reads body from outBoundEvent
if(firstTime)
{
if(constants.contains("start") == true)
{
var start = constants.get("start"); // reads the last poll time value from the state file
body['start'] = start; // replaces value of the start in body with a new value
outBoundEvent.set('body',body); // resets value of body with modified body
constants.save();
firstTime = false;
}
else
{
constants.put("start",body['start']);
constants.save();
firstTime = false;
}
}
else
{
constants.put("start",body['start']);
constants.save();
}
// methods that can be used here are'Post','Put',and 'Delete';
outBoundEvent.set("method","Post");
var properties = outBoundEvent.value("header");
// Header is used if the method used is Put or Delete or Post. Content type should always be defined otherwise it will give an error
// The LAM cannot by default send an XML payload. To send an XML payload then set content type as text/xml and set the xml payload in the body
properties["Content-Type"] = "text/xml";
outBoundEvent.set("header",properties);
//If LAM is not able to convert the request_query_parm in an accepted xml format, then the user can force the LAM to use the assigned inputs given below as a string, and use it in body of the request.
/*
outboundEvent.set("body",'<env:Envelope xmlns:env=\"http://schemas.xmlsoap.org/soap/envelope/\"><env:Header/><env:Body><createRequest xmlns=\"http://moogsoft.com\" xmlns:emcf=\"http://xmlns.oracle.com/sysman/connector\"> <Summary xmlns=\"http://moogsoft.com\">CPU Utilization for 3 is 6.787%, crossed warning (5) or critical (10) threshold.</Summary><Description xmlns=\"http://moogsoft.com\">Event created in Enterprise Manager: \n Target information: \n Target Type: host Target Name: WIN-8U1RA5NAA6I Target URL: http://win-8u1ra5naa6i:7788/em//em/redirect?pageType=TARGET_HOMEPAGE&targetName=WIN-8U1RA5NAA6I&targetType=host</Description></createRequest></env:Body></env:Envelope>');
*/
return true;
}
function modifyResponse(inBoundEventData)
/* If you want to modify response data before injecting it into LAM for tokenizing, then the event data can be modified here
The inBoundEventData contains the following field which can be manipulated as per the requirement
1. responseData - the event data received from the rest server
*/
{
return true;
}
function presend(event)
{
// returning true, makes this an event on the MooMs bus, false will cause the LAM to discard the event.
return( true );
}
LamBot.filterFunction("presend");
LamBot.preClientSendFunction("preClientSend");
LamBot.modifyResponseFunction("modifyResponse");
The above examples have the following functions:
· function onLoad(): This function is used to load data from state file. The state file has details of last poll time of the LAM. The state file is saved at the same location where the REST Client LAM config file is present. The statement constants.load() in this function loads the contents of the state file in the constant variable. This provides you some more alternatives for playing with data of the state file. As of now, only the last poll time will be saved, but if you want to save some other data which is to be used after restarting the LAM, then you can save this data in the state file. The name of the state file will be same as the config file name. For example, if the name of the config file is rest_client_lam.config, then the corresponding state file name will be rest_client_lam.state.
· function preClientSend(): This function extracts the information about the URL from the parameters given in the field request_query_param of the config file, combines all the information and creates the URL. This function also appends the last poll time read from the state file to the URL. The created URL is then sent to the LAM which hits the REST Server for events and alarm data. The constants.save() saves the poll time to the state file which is then used in the next poll.
· function modifyResponse(): This function makes changes to any response received from the REST Server. This function is used when the response data received from the REST Server needs any changes. If no changes are required, then do not edit this function. If any modification is done, then after modification the event data is sent to the LAM for extraction, tokenization, and mapping. For Example, if you are receiving the event data in XML, then you have to convert it into JSON format for the LAM to process it further. This conversion can be carried out in the modifyResponse() function.
· function presend(): This function makes any changes to the event data before sending it to MooMS.
Note:
The LAMbot configuration is done to handle things that cannot be handled by the config file. You can make changes to the file according to their requirements.
Service Operation Reference
| Process Name |
Service Name |
| rest_client_lam |
restclientlamd |
Start the LAM Service:
service restclientlamd start
Stop the LAM Service:
service restclientlamd stop
Check the LAM Service status:
service restclientlamd status
If the LAM fails to connect to one or more REST API sources, Cisco Crosswork Situation Manager creates an alert and writes the details to the process log. Refer to the logging details for LAMs and integrations for more information.
Command Line Reference
To see the available optional attributes of the rest_client_lam, run the following command:
rest_client_lam --help
The rest_client_lam is a command line executable, and has the following optional attributes:
| Option |
Description |
| --config |
Points to a pathname to find the configuration file for the LAM. This is where the entire configuration for the LAM is specified. |
| --help |
Displays all the command line options. |
| --version |
Displays the component’s version number. |
| --loglevel |
Specifies the level of debugging. By default, user gets everything. In common with all executables in Cisco Crosswork Situation Manager, having it set at that level can result in a lot of output (many messages per event message processed). In all production implementations, it is recommended that log level is set to WARN. This ensures only warning, error and fatal messages are recorded. |
REST LAM
The REST LAM is a link access module that allows Cisco Crosswork Situation Manager to receive data from REST-compliant web services.
See Representational State Transfer for further information on REST.
There is no UI integration for REST LAM. See Configure the REST LAM for configuration instructions.
Configure the REST LAM
The REST LAM allows Cisco Crosswork Situation Manager to receive data from REST-compliant web services. REST LAM accepts HTTP and HTTPS requests in all varieties of JSON, XML and YAML formats and parses them into Cisco Crosswork Situation Manager events.
You can use cURL commands to test whether you have correctly configured the REST LAM to accept REST messages. See the examples provided for more information.
The REST LAM responds to the data sender with standard HTTP response codes and JSON messages. See REST LAM JSON Responses for details.
Before You Begin
Before you configure the REST LAM, ensure you have met the following requirements:
· You have network access to the host address and port.
· The port is open through the server firewall.
· You understand the message data format you will send to the REST LAM.
If you are configuring a distributed deployment refer to /document/preview/77155#UUIDbea404d9dd1afee65fa1471105d1b3c6 first. You will need the details of the server configuration you are going to use for HA.High Availability Overview
Configure the LAM
Edit the configuration file to control the behavior of the REST LAM. You can find the file at $MOOGSOFT_HOME/config/rest_lam.conf
See the LAM and Integration Reference for a full description of all properties. Some properties in the file are commented out by default. Uncomment properties to enable them.
1. Configure the properties for the REST connection:
a. port: Port on the Cisco Crosswork Situation Manager server that listens for REST messages. Defaults to 8888.
b. address: Address on the Cisco Crosswork Situation Manager server that listens for REST messages. Default to all interfaces.
c. expose_request_headers: Allows you to include request HTTP headers in Cisco Crosswork Situation Manager events.
2. Configure authentication:
a. authentication_type: Type of authentication used by the LAM. Defaults to none.
b. basic_auth_static: Username and password used for Basic Auth Static authentication.
c. jwt: The claims used for JSON Web Token, if the authentication type is set to JWT.
d. authentication_cache: Whether to cache the username and password for the current connection when the authentication type is Basic.
3. Configure the LAM behavior:
a. num_threads: Number of worker threads to use when processing events.
b. rest_response_mode: When to send a REST response. See the LAM and Integration Reference for the options.
c. rpc_response_timeout: Number of seconds to wait for a REST response.
d. event_ack_mode: When Moogfarmd acknowledges events from the REST LAM during the event processing pipeline.
e. accept_all_json: Allows the LAM to read and process all forms of JSON.
f. lists_contain_multiple_events: Whether Cisco Crosswork Situation Manager interprets a JSON list as multiple events.
4. Configure the SSL properties if you want to encrypt communications between the LAM and the REST connection:
a. use_ssl: Whether to use SSL certification.
b. path_to_ssl_files: Path to the directory that contains the SSL certificates.
c. ssl_key_filename: The SSL server key file.
d. ssl_cert_filename: The SSL root CA file.
e. use_client_certificates: Whether to use SSL client certification.
f. client_ca_filename: The SSL client CA file.
g. auth_token or encrypted_auth_token: Authentication token in the request body.
h. header_auth_token or encrypted_header_auth_token: Authentication token in the request header.
i. ssl_protocols: Sets the allowed SSL protocols.
5. Optionally configure the LAM identification and logging details in the agent and log_config sections of the file:
a. name: Identifies events the REST LAM sends to the Message Bus.
b. capture_log: Name and location of the LAM's capture log file.
c. configuration_file: Name and location of the LAM's process log configuration file.
6. Optionally configure severity conversion. See /document/preview/11721#UUID8b183a1e1278a7a652d3ae86944d7379 for further information and "Conversion Rules" in /document/preview/11720#UUID5c67156b667b1a28ec648cd779393914 for details on conversions in general.Severity ReferenceData Parsing
7. If you are using a data format with multiple nested fields, see REST LAM Examples for a nested fields example and information on how to handle it.
8. Refer to the REST LAM JSON Responses to review the structure of REST LAM response messages and response codes.
Example
The following example demonstrates a basic REST LAM configuration that receives messages without authentication or SSL encryption. See REST LAM Examples for some more complex configuration examples.
monitor:
{
name : "REST Lam Monitor",
class : "CRestMonitor",
port : 8888,
address : "0.0.0.0",
use_ssl : false,
#path_to_ssl_files : "config",
#ssl_key_filename : "server.key",
#ssl_cert_filename : "server.pem",
#use_client_certificates : false,
#client_ca_filename : "ca.crt",
#auth_token : "my_secret",
#encrypted_auth_token : "dfJtTQMGiFHfiq7sCmxguBt6Jv+eytkoiKCquSB/7iWxpgGsG2aez3z2j7SuBtKj",
#header_auth_token : "my_secret",
#encrypted_header_auth_token : "dfJtTQMGiFHfiq7sCmxguBt6Jv+eytkoiKCquSB/7iWxpgGsG2aez3z2j7SuBtKj",
#ssl_protocols : "TLSv1.2",
authentication_type : "none",
#basic_auth_static:
#{
#username : "user",
#password : "pass",
#encrypted_password : "dfJtTQMGiFHfiq7sCmxguBt6Jv+eytkoiKCquSB/7iWxpgGsG2aez3z2j7SuBtKj"
#},
#jwt:
#{
#secretKey : "secret",
#sub : "moogsoft",
#iss : "moogsoft",
#aud : "moogsoft",
#jti : ""
#},
authentication_cache : true,
accept_all_json : true,
lists_contain_multiple_events : true,
num_threads : 5,
rest_response_mode : "on_receipt",
rpc_response_timeout : 20,
event_ack_mode : "queued_for_processing",
},
agent:
{
name : "DATA_SOURCE",
#capture_log : "$MOOGSOFT_HOME/log/data-capture/rest_lam.log"
},
log_config:
{
configuration_file : "$MOOGSOFT_HOME/config/logging/rest_lam_log.json"
},
Configure for High Availability
Configure the REST LAM for high availability if required. See /document/preview/77155#UUIDbea404d9dd1afee65fa1471105d1b3c6 for details.High Availability Overview
Configure LAMbot Processing
The REST LAMbot processes and filters events before sending them to the Message Bus. You can customize or bypass this processing if required. You can also load JavaScript files into the LAMbot and execute them.
See LAMbot Configuration for more information. An example REST LAM filter configuration is shown below.
filter:
{
presend: "RestLam.js"
}
Map LAM Properties
REST messages are mapped to Cisco Crosswork Situation Manager event fields according to the mapping rules in the REST LAM configuration file.
You can choose to map request headers when the expose_request_headers property is set to true. For example:
{ name: "source", rule: "$moog_request_headers.Origin" }
See the LAM and Integration Reference for more details.
Check the LAM Status
You can use a GET request to check the status of the REST LAM. The request uses the authentication type and header authentication token defined in the REST LAM configuration file. See the authentication_type and header_auth_token properties in the LAM and Integration Reference for more information.
The following examples show the only two possible responses: active and passive.
curl http://localhost:8888 -X GET
Response from an active REST LAM:
{
"success" : true,
"message" : "Instance is active",
"statusCode" : 0
}
Response from an inactive REST LAM:
{
"success" : false,
"message" : "Instance is passive",
"statusCode" : 5004
}
Start and Stop the LAM
Restart the REST LAM to activate any changes you make to the configuration file or LAMbot.
The LAM service name is restlamd.
See /document/preview/11677#UUID1a2205c3aae40b26fdfe94490043f3c3 for further details.Control Processes
REST LAM Examples
The following examples demonstrate REST LAM configuration options, message formats, cURL commands and sample JSON responses. You can use these example to assist you when configuring REST LAM. See Configure the REST LAM for configuration instructions and LAM and Integration Reference for a full description of all properties.
REST LAM Authentication
The following examples demonstrate the various authentication options in the REST LAM.
REST LAM configuration without authentication:
monitor:
{
name : "Rest Lam Monitor",
class : "CRestMonitor",
port : 8888,
address : "localhost",
use_ssl : false,
authentication_type : "none",
accept_all_json : false,
num_threads : 5,
rest_response_mode : "on_receipt",
rpc_response_timeout : 20
}
REST LAM configuration with basic authentication:
monitor:
{
name : "Rest Lam Monitor",
class : "CRestMonitor",
port : 8888,
address : "localhost",
use_ssl : true,
path_to_ssl_files : "/root/temp",
ssl_key_filename : "server.key",
ssl_cert_filename : "server.pem",
auth_token : "my_secret",
authentication_type : "basic",
authentication_cache : true,
accept_all_json : false,
num_threads : 5,
rest_response_mode : "on_receipt",
rpc_response_timeout : 20
}
REST LAM configuration with JWT authentication (non-SSL):
monitor:
{
name : "Rest Lam Monitor",
class : "CRestMonitor",
port : 8888,
address : "localhost",
use_ssl : false,
authentication_type : "jwt",
jwt:
{
secretKey : "secret",
sub : "moogsoft",
iss : "moogsoft",
aud : "moogsoft",
jti : " "
}
accept_all_json : false,
num_threads : 5,
rest_response_mode : "on_receipt",
rpc_response_timeout : 20
}
REST LAM configuration with static basic auth authentication:
monitor:
{
name : "Rest Lam Monitor",
class : "CRestMonitor",
port : 8888,
address : "localhost",
use_ssl : false,
authentication_type : "basic_auth_static",
basic_auth_static:
{
username : "username",
#password : "password",
encrypted_password : "dfJtTQMGiFHfiq7sCmxguBt6Jv+eytkoiKCquSB/7iWxpgGsG2aez3z2j7SuBtKj"
},
accept_all_json : false,
num_threads : 5,
rest_response_mode : "on_receipt",
rpc_response_timeout : 20
}
Cisco Crosswork Situation Manager Message Format
The Cisco Crosswork Situation Manager message format and an example message are shown below. You must use this format for incoming messages when accept_all_json is set to false in the REST LAM configuration file. See the REST LAM Reference for more details.
Cisco Crosswork Situation Manager message format:
{
auth_token: <string>,
events: [
{event1},
.
.
.
{eventn}
]
}
Message in Cisco Crosswork Situation Manager format containing two events:
{
"auth_token" : "my_secret",
"events" : [
{
"name1" : "1",
"name2" : "false",
"name3" : "MINOR",
"signature" : "sig",
"source_id" : "98",
"external_id" : "ext",
"manager" : "man",
"source" : "db",
"class" : "a class"
},
{
"name1" : "2",
"name2" : "false",
"name3" : "MINOR",
} ]
}
Configuration with cURL Command
The following example demonstrates a REST LAM configuration and the corresponding cURL command to generate events.
REST LAM configuration with no authentication or SSL:
monitor:
{
name : "Rest Lam Monitor",
class : "CRestMonitor",
port : 9876,
use_ssl : false,
accept_all_json : false,
#path_to_ssl_files : "/tmp",
#ssl_key_filename : "server.key",
#ssl_cert_filename : "server.pem",
#auth_token : "abcd1234",
num_threads : 5
},
agent:
{
name : "DATA_SOURCE"
#log : "/tmp/rest_lam.log"
},
constants:
{
},
conversions:
{
stringToInt:
{
input : "STRING",
output : "INTEGER"
}
},
mapping:
{
catchAll: "overflow",
rules: [
{ name: "signature", rule: "$signature" },
{ name: "source_id", rule: "$source_id" },
{ name: "external_id", rule: "$external_id" },
{ name: "manager", rule: "$manager" },
{ name: "source", rule: "$source" },
{ name: "class", rule: "$class" },
{ name: "agent", rule: "$agent" },
{ name: "agent_location", rule: "$agent_location" },
{ name: "type", rule: "$type" },
{ name: "severity", rule: "$severity", conversion: "stringToInt" },
{ name: "description", rule: "$description" },
{ name: "first_occurred", rule: "$first_occurred", conversion: "stringToInt" },
{ name: "agent_time", rule: "$agent_time", conversion: "stringToInt" }
]
},
filter:
{
presend: "RestLam.js"
}
The cURL command for the above configuration:
curl http://moogbox2:9876 -H "Content-Type: application/json" --insecure -X POST -v --data '
{
"signature":"SIGNATURE1",
"source_id":"my_source_id",
"external_id":"my_external_id",
"manager":"TestMgr1",
"source":"TestHost1",
"class":"my_class",
"agent":"TestAgent1",
"agent_location":"my_agent_location",
"type":"TestType1",
"severity":3,
"description":"TestDesc1",
"first_occurred":1411134582,
"agent_time":1411134582
}'
The cURL command will generate the following event from the REST LAM:
{
"_MOOTADATA_":{
"creation_time":1452090420708
},
"agent":"TestAgent1",
"agent_location":"my_agent_location",
"agent_time":1411134582,
"class":"my_class",
"description":"TestDesc1",
"external_id":"my_external_id",
"manager":"TestMgr1",
"overflow":{
"LamInstanceName":"DATA_SOURCE",
"first_occurred":1411134582
},
"severity":3,
"signature":"SIGNATURE1",
"source":"TestHost1",
"source_id":"my_source_id",
"type":"TestType1"
}
Expose Request Headers
The following example demonstrates a REST LAM configuration that exposes request headers and contains a mapping to set source as the Origin HTTP header.
REST LAM configuration:
monitor:
{
name : "Rest Lam Monitor",
class : "CRestMonitor",
port : 8888,
expose_request_headers : true,
use_ssl : false,
accept_all_json : false,
lists_contain_multiple_events : true,
num_threads : 5
},
agent:
{
name : "DATA_SOURCE"
},
constants:
{
},
conversions:
{
stringToInt:
{
input : "STRING",
output : "INTEGER"
}
},
mapping:
{
catchAll: "overflow",
rules:
[
{ name: "signature", rule: "$signature" },
{ name: "source_id", rule: "$source_id" },
{ name: "external_id", rule: "$external_id" },
{ name: "manager", rule: "$manager" },
{ name: "source", rule: "$moog_request_headers.Origin" },
{ name: "class", rule: "$class" },
{ name: "agent", rule: "$LamInstanceName" },
{ name: "agent_location", rule: "$agent_location" },
{ name: "type", rule: "$type" },
{ name: "severity", rule: "$severity", conversion: "stringToInt" },
{ name: "description", rule: "$description" },
{ name: "first_occurred", rule: "$first_occurred", conversion: "stringToInt" },
{ name: "agent_time", rule: "$agent_time", conversion: "stringToInt" }
]
},
filter:
{
presend: "RestLam.js"
}
The cURL command for the above configuration:
curl http://localhost:8888 -H "Content-Type: application/json" --insecure -X POST --header "Origin: http://test.com" -v --data '
{
"signature":"SIGNATURE4",
"source_id":"my_source_id",
"external_id":"my_external_id",
"manager":"TestMgr4",
"class":"my_class",
"agent":"TestAgent4",
"agent_location":"my_agent_location",
"type":"TestType4",
"severity":3,
"description":"TestDesc4",
"first_occurred":1411134582,
"agent_time":1411134582
}'
The cURL command will generate the following event from the REST LAM:
{
"_MOOTADATA_": {
"creation_time": 1534951021452
},
"agent": "DATA_SOURCE",
"agent_location": "my_agent_location",
"agent_time": 1411134582,
"class": "my_class",
"description": "TestDesc4",
"external_id": "my_external_id",
"manager": "TestMgr4",
"overflow": {
"moog_request_headers": {
"Accept": "*/*",
"User-Agent": "curl/7.54.0",
"Host": "localhost:8888",
"Content-Length": "449",
"Content-Type": "application/json"
},
"agent": "TestAgent4",
"first_occurred": 1411134582
},
"severity": 3,
"signature": "SIGNATURE4",
"source": "http://test.com",
"source_id": "my_source_id",
"type": "TestType4"
}
Multiple Nested Fields
In the following example the received event has multiple nested fields. The field summary is nested in <env:Envelope> - <env:Body> - <createRequest> - <Summary>. The env: in the field name can produce a mapping error so it is advisable to remove it from the received data in the LAMbot's modifyReponse function.
An event received by REST LAM in XML format:
<env:Envelope xmlns:env="http://schemas.xmlsoap.org/soap/envelope/">
<env:Header/>
<env:Body>
<createRequest xmlns="http://moogsoft.com"
xmlns:emcf="http://xmlns.oracle.com/sysman/connector">
<Summary xmlns="http://moogsoft.com">CPUUtilization for 3 is 6.787%, crossed warning (5) or critical (10)threshold.</Summary>
<Description xmlns="http://moogsoft.com">
Event created in Enterprise Manager:
Target information:
Target Type: host
Target Name: WIN-8U1RA5NAA6I
Target URL: http://win-8u1ra5naa6i:7788/em//em/redirect?pageType=TARGET_HOMEPAGE&targetName=WIN-8U1RA5NAA6I&targetType=host
</Description>
<Severity xmlns="http://moogsoft.com">2</Severity>
<Priority xmlns="http://moogsoft.com">Medium</Priority>
</createRequest>
</env:Body>
</env:Envelope>
The corresponding LAMbot configuration to remove env: from the received event fields and send them to REST LAM for tokenizing and mapping:
function modifyResponse(inBoundEventData)
{
// if you want to modify response data before injecting the same in LAM for tokenizing
/*inBoundEventData contain below field which can be manipulated as per requirement
1. responseData - the event data received from the rest server
*/
var inputString = inBoundEventData.value('responseData');
var obj = JSON.parse(inputString);
var modifiedinput = obj.(env:Envelope).(env:Body).createRequest;
logger.info(JSON.stringify(modifiedinput));
inBoundEventData.set('responseData', JSON.stringify(modifiedinput));
return true;
}
The corresponding mapping in the REST LAM configuration file is shown below. The mapping for class is performed by $Description.content. If the LAMbot is not configured as shown above, the mapping is processed as$env:envelope.env:Body.createRequest.Summarywhich produces an error.
mapping:
{
{ name: "signature", rule: "$signature" },
{ name: "source_id", rule: "$source_id" },
{ name: "external_id", rule: "$external_id" },
{ name: "manager", rule: "$manager" },
{ name: "source", rule: "$source" },
{ name: "class", rule: "$class" },
{ name: "agent", rule: "$LamInstanceName" },
{ name: "agent_location", rule: "$agent_location" },
{ name: "type", rule: "$type" },
{ name: "severity", rule: "$severity", conversion: "stringToInt" },
{ name: "description", rule: "$description" },
{ name: "agent_time", rule: "$agent_time", conversion: "stringToInt" }
}
JSON Responses
The following examples show successful and failed JSON responses.
Successful response without caching:
{
"message":"Processed 1 event(s)",
"response":{
"cached":0,
"processed":1,
"received":1
},
"success":true
}
Failed response without caching:
{
"message":"General error. Processed 0 event(s)",
"response":{
"cached":0,
"processed":0,
"received":1
},
"statusCode":1000,
"success":false
}
Failed response with caching:
{
"message":"Content accepted but cached, processing not guaranteed. Processed 0 event(s)",
"response":{
"cached":1,
"processed":0,
"received":1
},
"statusCode":5003,
"success":false
}
REST LAM JSON Responses
REST LAM sends response messages in the form of a JSON object. The response indicates how many events in the message were cached, processed and received.
The REST LAM uses the following standard HTTP return codes to indicate the status of a message. The JSON response object contains the status code and message.
200 Ok
REST LAM received and accepted the message. This is not an indication that LAM or LAMbot has property processed the event. Standard LAM log file response messages are issued for error conditions.
202 Accepted
The content was accepted but processing is not guaranteed.
400 Bad Request
REST LAM rejected the request due to an invalid request body.
401 Unauthorized
The REST LAM configuration file contains an authorization token but there is no matching authorization token in the message header.
405 Method Not Allowed
The request used an unsupported method. Supported methods are POST, PUT and GET.
415 Unsupported Media Type
The request used an unsupported media type. JSON, XML and YAML are supported in the Content-Type header.
500 Internal Server Error
An unknown error occurred during processing.
503 Service Unavailable
REST LAM is passive and not accepting requests. In the event of an error, REST LAM provides the following REST response codes indicating the status of the request:
1000 General Error
The request could not proceed and failed in a way that was unexpected.
3001 Security Authentication Error
There was a failure in basic authorization or the body authorization token check failed.
3004 JWT Authentication Error
The received JSON Web Token did not match the configuration.
4000 General Method Error
There was an error with the method.
4001 Method Not Supported
The HTTP method is not supported.
5001 Content Not Supported
The content type is not supported.
5002 Content Decoding Error
The content could not be decoded.
5003 Content Cached
The content was accepted and cached. Processing is not guaranteed.
5004 Passive Instance
REST LAM is passive and not accepting requests.
Configure Reverse Proxy for REST LAMs
You can configure Nginx to act as a reverse reverse proxy to accept requests to webhook and REST-based LAMs over SSL.
The benefits of using a reverse proxy for your REST-based LAMs include:
· Nginx handles SSL with better performance than REST-based LAMs.
· The reverse proxy provides a single access point for logging and auditing.
See the Nginx documentation for more information about setting up an Nginx reverse proxy.
Before You Begin
Before you set up your Nginx reverse proxy, ensure you have met the following requirements:
· You have chosen a unique path that external clients can send requests to.
· The Nginx proxy server is able to accept requests over port 443.
Add an Nginx Reverse Proxy
You can add reverse proxy to your LAM using the proxy pass directive:
1. Edit the Nginx proxies configuration file: $MOOGSOFT_HOME/etc/cots/nginx/moog-proxies.conf:
location /<integration_name>
{
proxy_pass http://<localhost>:<port_number>;
}
2. For example, if you wanted to add a reverse proxy for the VMware vROps LAM, the proxy pass looks like this:
location /vrops
{
proxy_pass http://<localhost>:48015;
}
3. After saving the changes, test the configuration:
nginx -t
4. Restart Nginx and start the LAM.
After completing these steps, the Nginx reverse proxy redirects requests sent by the LAM.
ServiceNow
You can enable bidirectional communication between Cisco Crosswork Situation Manager Situation Rooms and your ServiceNow incident management system. After you complete the integration, the two systems keep information synchronized so that users can view data as follows:
· You can right-click a Situation and select Open ServiceNow Ticket to create a ServiceNow incident linked to the Cisco Crosswork Situation Manager Situation.
· When you post a work note on an incident in ServiceNow, the comment appears in the linked Situation. Conversely, when you post on a Situation Room thread, the integration updates the linked ServiceNow incident with the comment.
· In Situation views, the Incident column contains a direct link to the incident in ServiceNow.
See the ServiceNow documentation for details on ServiceNow components.
Before You Begin
The ServiceNow integration has been validated with ServiceNow New York, Madrid, London and Kingston. Before you set up your ServiceNow integration:
· Note the URL of your ServiceNow incident management instance.
· Verify that ServiceNow and Cisco Crosswork Situation Manager can communicate over port 443.
Configure the ServiceNow Integration
To configure the ServiceNow integration:
1. Navigate to the Integrations tab.
2. Click ServiceNow in the Ticketing section.
3. Provide a unique integration name. You can use the default name or customize the name according to your needs.
4. Provide connection details for your ServiceNow system.
Note:
If your Cisco Crosswork Situation Manager is installed on-prem and does not have a direct connection to ServiceNow, configure the proxy settings for the ServiceNow Moobot in the REST.V2 module.
The ServiceNow Moobot is located at $MOOGSOFT_HOME/bots/moobots/ServiceNow-2.0-Geneva.js.
See the ServiceNow proxy example in /document/preview/11822#UUIDfa98e34fe3aa2a239dd4c23084dc9bff for more details.REST.V2
Configure a ServiceNow MID Server
See Configure a ServiceNow MID Server for instructions.
Configure ServiceNow
Configure the integrations user and XML update set for ServiceNow:
1. Download the XML update set file.
2. In the ServiceNow UI, import the update set and open it. Refer to the ServiceNow documentation for detailed instructions.
3. Preview the update set. The preview attempts to load and fails with an error similar to "Preview problems for Cisco Crosswork Situation Manager. To commit this update set you must address all problems". Close the message to view the list of preview problems.
4. Select all preview problems and then accept the remote update.
5. Commit the update set. Ignore the dictionary error that appears and proceed with the commit.
6. To verify that the update is successful, type 'moogsoft' into the filter navigator and confirm that the Cisco Crosswork Situation Manager Integration update set is displayed.
7. Create an integration user in ServiceNow named moogint and assign it the following roles:
a. mid_server: Allows the MID server to access protected tables.
b. x_moogs_incident_m.import: Allows Cisco Crosswork Situation Manager to synchronize work notes and resolutions.
c. x_moogs_incident_m_properties_user: Allows the ServiceNow user to edit Cisco Crosswork Situation Manager event properties.
d. incident_manager: Allows the auto-assign feature to assign new incidents to the logged in user.
8. Locate 'Cisco Crosswork Situation Manager Properties' using the filter navigator in ServiceNow and edit the properties as follows:
| Property Name |
Value |
| ServiceNow User |
moogint |
| MID Server |
Select your MID server. |
| Thread Name |
Support |
| Outbound REST Retry Count |
The number of times to attempt a Cisco Crosswork Situation Manager Graze API call. Default is 3. |
| Cisco Crosswork Situation Manager Instance Name |
Host name or IP address of the machine where Cisco Crosswork Situation Manager is installed. |
| Close Situation in Cisco Crosswork Situation Manager |
Enable to automatically close a Situation when you close the associated ticket in ServiceNow. Disabled by default. |
| Cisco Crosswork Situation Manager User Name |
Username of Graze user. |
| Cisco Crosswork Situation Manager User Password |
Password of Graze user. |
| Session Token |
Authentication token received from Graze API. Do not change. |
After you complete the ServiceNow configuration, you can select Open ServiceNow Ticket from the right-click menu for an open Situation in Cisco Crosswork Situation Manager to raise an associated ServiceNow ticket.
Configure a ServiceNow MID Server
If you are running a cloud installation of Cisco Crosswork Situation Manager you do not need to configure a MID Server.
On-premise installations require ServiceNow's MID server to be set up on your Cisco Crosswork Situation Manager machine or on a Linux machine that is accessible from Cisco Crosswork Situation Manager. Installing the MID server achieves a bidirectional integration wherein the MID server receives updates from ServiceNow and forwards them to Cisco Crosswork Situation Manager using the Graze API.
Note that in order to set up a MID Server you require a ServiceNow account with MID-server role permissions. For more help, see the ServiceNow documentation.
Follow these steps to configure a ServiceNow MID server for Cisco Crosswork Situation Manager:
1. Inside ServiceNow, locate the URL for the 64-bit MID server package for Linux.
2. Download the 64-bit MID server Linux package to your Cisco Crosswork Situation Manager machine or to a machine accessible from Cisco Crosswork Situation Manager.
3. Create the following directory for the MID server:
mkdir -p /usr/local/servicenow/moog_mid_server
4. Unzip the MID server package to the MID server directory. For example:
sudo unzip <mid server package>.zip -d /usr/local/servicenow/moog_mid_server
5. Install the latest version of Java 8. See the ServiceNow MID server system requirements for more information. The MID server requires Java 8 (update 152 or later) and will not work with Java 9, 10 or 11.
6. Configure the wrapper.java.command property to point to the Java 8 binary in the following file: /usr/local/servicenow/moog_mid_server/agent/conf/wrapper-override.conf. For example:
wrapper.java.command=/usr/java/jre1.8.0_171-amd64/bin/java
7. Modify the configuration of the ServiceNow MID server, located at:
/usr/local/servicenow/moog_mid_server/agent/conf/.xml
8. Replace or add the following files:
<parameter name="url" value="Missing Value"/>
<parameter name="mid.instance.username" value="Missing Value"/>
<parameter name="mid.instance.password" value="Missing Value"/>
<parameter name="name" value="Missing Value"/>chown -R moogtoolrunner:moogsoft /usr/local/servicenow/moog_mid_server
9. Start the ServiceNow MID server. This can be done by running the following command:
/usr/local/servicenow/moog_mid_server/agent/bin/mid.sh start
10. Optionally, install the MID server as a daemon and add auto-start scripts to the init.d directory. This can be done by running the following command as root:
/usr/local/servicenow/moog_mid_server/agent/bin/mid.sh install
After you have set up the ServiceNow integration in Cisco Crosswork Situation Manager and configured the MID server, to begin using the integration you will need to start the MID server. For more information, refer to the ServiceNow documentation.
Sensu
The Sensu integration allows you to retrieve events from Sensu Core and send them to Cisco Crosswork Situation Manager as events.
Refer to the LAM and Integration Reference to see the integration's default properties. When you use the integrations UI, you can only configure the visible properties.
If you want to implement a more complex Sensu integration with custom settings, see Configure the Sensu LAM.
See the Sensu documentation for details on Sensu components.
The Sensu integration has been validated with Sensu Core v1.8. Before you start to set up your integration, ensure you have met the following requirements:
· You have installed and configured a Sensu Core system.
Configure the Sensu Integration
To configure the Sensu integration:
1. Navigate to the Integrations tab.
2. Click Sensu in the Monitoring section.
3. Provide a unique integration name. You can use the default name or customize the name according to your needs.
4. Set a Basic Authentication username and password.
Configure Sensu
1. Create a Ruby file named send-events-to-moogosft.rb in your Sensu Server's plugins folder (by default /etc/sensu/plugins/) and paste the following into it:
#!/usr/bin/ruby
require 'json'
require 'socket'
require 'net/http'
require 'uri'
require 'openssl'
# To enable logging, put an absolute file location in the LOG_FILE attribute and set the DEBUG attribute to true
LOG_FILE = ""
DEBUG = false
MOOG_LAM_URL = "<moog-inline-element data-ref="url"></moog-inline-element>"
AUTH = "<moog-inline-element data-ref="auth"></moog-inline-element>"
# HTTP configuration method
def initHttp()
uri = URI.parse(MOOG_LAM_URL)
http = Net::HTTP.new(uri.host, uri.port)
if (uri.scheme == "https")
http.use_ssl = true
# Uncomment if you're using self-signed certificates
# The absolute path of your certificate
#cert_file = '/etc/sensu/ssl/moogsoft.cert'
#http.ca_file = cert_file
#http.cert = getCert(cert_file)
# Uncomment to disable certificate validation
#http.verify_mode = OpenSSL::SSL::VERIFY_NONE
end
return http
end
# Do not change anything below this line
def log(string)
unless (LOG_FILE.strip.empty?)
File.open(LOG_FILE, "a+") { |file| file.puts string }
end
end
def debug(s)
if (DEBUG)
log("[DEBUG] - " + s)
end
end
def info(info)
log("[INFO] - " + info.to_s)
end
def warn(warning)
log("[WARNING] - " + warning.to_s)
end
def err(error)
log("[ERROR] - " + error.to_s)
end
def getCert(filePath)
raw = File.read(filePath)
return OpenSSL::X509::Certificate.new(raw)
end
def sendPayloadToMoogsoft(payload)
http = initHttp()
request = Net::HTTP::Post.new(MOOG_LAM_URL, initheader = {'Content-Type' => 'application/json'})
request["Authorization"] = AUTH
request.body = payload.to_json
response = http.request(request)
return response
end
def getStdin()
return ARGF.read
end
def parsePayload(stdin)
toReturn = nil
begin
toReturn = JSON.parse(stdin)
rescue JSON::ParserError => e
err("Failed to parse standard input::" + e.to_s)
end
return toReturn
end
def buildMoogEvent(payload)
moog_event = {
"knowledgeId"=>payload["check"]["knowledgeId"] || 0,
"description"=>payload["check"]["notification"] || payload["check"]["output"],
"payload"=>payload,
"ip"=>Socket.ip_address_list[1].ip_address
}
return moog_event
end
def exe()
begin
debug("Event timestamp: " + (Time.now.to_f).to_s)
stdin = getStdin()
debug("Catched event: " + stdin.to_json)
payload = parsePayload(stdin)
moog_event = buildMoogEvent(payload)
debug("Sending moogsoft event: " + moog_event.to_json)
response = sendPayloadToMoogsoft(moog_event)
if (response.code == "200")
info("Response from moogsoft: " + response.code + " " + response.body)
else
warn("Unsuccessful response from moogsoft::" + response.code + "::" + response.body)
end
rescue StandardError => e
err("Unexpected error during integration::" + e.to_s)
end
end
# Run integration
exe()
2. To enable logging, set LOG_FILE to a Sensu-accessible file path.
3. Inside your conf.d folder (by default /etc/sensu/conf.d), create a JSON file named handler_moogsoft.json and paste the following into it:
{
"handlers": {
"moogsoft": {
"type": "pipe",
"command": "ruby /etc/sensu/plugins/send-events-to-moogsoft.rb"
}
}
}
4. Set the command field to the file you created in step 1. If you have changed the location of your plugins folder, amend the path accordingly.
5. Ensure that you have configured a check to be handled by the custom handler. For more help, see the Sensu documentation.
After you complete the integration, Sensu sends new events to Cisco Crosswork Situation Manager.
Configure the Sensu LAM
The Sensu LAM receives and processes Sensu events forwarded to Cisco Crosswork Situation Manager. The LAM parses the data into Cisco Crosswork Situation Manager as events.
You can install a basic Sensu integration in the UI. See Sensu for integration steps.
Configure the Sensu LAM if you want to configure custom properties, set up high availability or configure advanced options that are not available in the UI integration.
Before you Begin
The Sensu LAM has been validated with Sensu Core v1.8. Before you configure the LAM, ensure you have met the following requirements:
· You have installed and configured a Sensu Core system.
If you are configuring a distributed deployment refer to /document/preview/77155#UUIDbea404d9dd1afee65fa1471105d1b3c6. You will need the details of the server configuration you are going to use for HA.High Availability Overview
Configure the LAM
Edit the configuration file to control the behavior of the LAM. You can find the file at $MOOGSOFT_HOME/config/sensu_lam.conf.
The Sensu LAM is a REST-based LAM as it provides an HTTP endpoint for data ingestions. Note that only the generic REST LAM properties in sensu_lam.conf apply to integrating with Sensu; see the LAM and Integration Reference for a full description of all properties.
Some properties in the file are commented out by default; remove the '#' character to enable them.
1. Configure the connection properties for the REST connection:
a. address: Address on the Cisco Crosswork Situation Manager server that listens for REST messages. Defaults to all interfaces.
b. port: Port on the Cisco Crosswork Situation Manager server that listens for REST messages. Defaults to 8888.
2. Configure authentication:
a. authentication_type: Type of authentication used by the LAM. Defaults to basic_auth_static.
b. basic_auth_static: Username and password used for Basic Auth Static authentication.
c. authentication_cache: Whether to cache the username and password for the current connection when the authentication type is Basic.
3. Configure the LAM behavior:
a. accept_all_json: Allows the LAM to read and process all forms of JSON.
b. lists_contain_multiple_threads: Whether Cisco Crosswork Situation Manager interprets a JSON list as multiple events.
c. num_threads: Number of worker threads to use for processing events.
d. rest_response_mode: When to send a REST response. See the LAM and Integration Reference for the options.
e. rpc_response_timeout: Number of seconds to wait for a REST response.
f. event_ack_mode: When Moogfarmd acknowledges events from the Sensu LAM during the event processing pipeline.
4. Configure the SSL properties if you want to encrypt communications between the LAM and the REST connection:
a. use_ssl: Whether to use SSL certification.
b. path_to_ssl_files: Path to the directory that contains the SSL certificates.
c. ssl_key_filename: The SSL server key file.
d. ssl_cert_filename: The SSL root CA file.
e. use_client_certificates: Whether to use SSL client certification.
f. client_ca_filename: The SSL client CA file.
g. auth_token or encrypted_auth_token: Authentication token in the request body.
h. ssl_protocols: Sets the allowed SSL protocols.
5. Optionally configure the LAM identification and logging details in the agent and log_config sections of the file:
a. name: Identifies events the LAM sends to the Message bus.
b. capture_log: Name and locations of the LAM's capture log file.
c. configuration_file: Name and location of the LAM's process log configuration file.
6. Optionally configure severity conversion. See /document/preview/11721#UUID8b183a1e1278a7a652d3ae86944d7379 for further information and "Conversion Rules" in /document/preview/95030#UUIDc06d3f9c8b3d99f90b7227c2e2d8afae for details on conversions in general.Severity ReferenceData Parsing
Example
An example Sensu LAM configuration is as follows:
monitor:
{
name : "Sensu LAM",
class : "CRestMonitor",
port : 8888,
address : "0.0.0.0",
use_ssl : false,
#path_to_ssl_files : "config",
#ssl_key_filename : "server.key",
#ssl_cert_filename : "server.pem",
#use_client_certificates : false,
#client_ca_filename : "ca.crt",
#auth_token : "my_secret",
#encrypted_auth_token : "dfJtTQMGiFHfiq7sCmxguBt6Jv+eytkoiKCquSB/7iWxpgGsG2aez3z2j7SuBtKj",
#ssl_protocols : [ "TLSv1.2" ],
authentication_type : "basic_auth_static",
basic_auth_static:
{
username: "user",
password: "pass"
#,encrypted_password : "dfJtTQMGiFHfiq7sCmxguBt6Jv+eytkoiKCquSB/7iWxpgGsG2aez3z2j7SuBtKj"
},
authentication_cache : true,
accept_all_json : true,
lists_contain_multiple_events : true,
num_threads : 5,
rest_response_mode : "on_receipt",
rpc_response_timeout : 20,
event_ack_mode : "queued_for_processing"
},
agent:
{
name : "Sensu",
capture_log : "$MOOGSOFT_HOME/log/data-capture/sensu_lam.log"
},
log_config:
{
configuration_file : "$MOOGSOFT_HOME/config/logging/sensu_log.json"
{,
Configure for High Availability
Configure the Sensu LAM for high availability if required. See /document/preview/77155#UUIDbea404d9dd1afee65fa1471105d1b3c6 for details.High Availability Overview
Configure LAMbot processing
The Sensu LAMbot processes and filters events before sending them to Message Bus. You can customize or bypass this processing if required. You can also load JavaScript files in the LAMbot and execute them.
See LAMbot Configuration for more information. An example Sensu LAM filter configuration is shown below.
filter:
{
presend: "SensuLAM.js",
modules: [ "CommonUtils.js" ]
}
Start and Stop the LAM
Restart the Sensu LAM to activate any changes you make to the configuration file or LAMbot.
The LAM service name is sensulamd.
See /document/preview/11677#UUID1a2205c3aae40b26fdfe94490043f3c3 for the commands to start, stop and restart the LAM.Control Processes
You can use a GET request to check the status of the Sensu LAM. See "Check the LAM status" in Configure the REST LAM for further information and examples.
Configure Sensu
After you have the Sensu LAM running and listening for incoming requests, you can configure Sensu. See "Configure Sensu" in Sensu.
SevOne
You can install the SevOne polling integration to enable Cisco Crosswork Situation Manager to collect alert data from one or more SevOne systems.
Refer to the LAM and Integration Reference to see the integration's default properties. When you use the integrations UI, you can only configure the visible properties.
If you want to implement a more complex SevOne LAM with custom settings, see Configure the SevOne LAM.
See the SevOne Documentation for details on SevOne components.
Before You Begin
The SevOne integration has been validated with SevOne v5.4. Before you start to set up your integration, ensure you have met the following requirements for each SevOne system:
· You have the API URL of your SevOne server.
· The SevOne API URL is accessible from Cisco Crosswork Situation Manager.
· Your SevOne system is able to accept HTTPS requests.
Configure the SevOne Integration
Configure the SevOne integration in Cisco Crosswork Situation Manager as follows:
1. Navigate to the Integrations tab.
2. Click SevOne in the Monitoring section.
3. Provide a unique integration name. You can use the default name or customize the name according to your needs.
4. Provide connection details for your SevOne system.
Configure SevOne
You do not need to perform any integration-specific steps on your SevOne systems. After you configure the integration, it polls your SevOne systems at regular intervals to collect event data (every 60 seconds by default).
If the integration fails to connect to one or more sources, Cisco Crosswork Situation Manager creates an alert and writes the details to the process log. Refer to the logging details for LAMs and integrations for more information.Configure Logging
Configure the SevOne LAM
The SevOne LAM allows you to collect alerts from one or more SevOne systems.
You can install a basic SevOne integration in the UI. See SevOne for integration steps.
Configure the SevOne LAM if you want to configure custom properties, set up high availability or configure advanced options that are not available in the UI integration.
Before You Begin
The SevOne LAM has been validated with SevOne v5.4. Before you configure the LAM, ensure you have met the following requirements for each SevOne server:
· You have the API URL of your SevOne server.
· The SevOne API URL is accessible from Cisco Crosswork Situation Manager.
· Your SevOne system is able to accept HTTPS requests.
If you are configuring a distributed deployment refer to /document/preview/77155#UUIDbea404d9dd1afee65fa1471105d1b3c6 first. You will need the details of the server configuration you are going to use for HA.High Availability Overview
Configure the LAM
Edit the configuration file to control the behavior of the SevOne LAM. You can find the file at $MOOGSOFT_HOME/config/sevone_lam.conf.
See the SevOne Reference for a full description of all properties. Some properties in the file are commented out by default. Uncomment properties to enable them.
1. Configure the connection properties for each target SevOne source:
a. url: The SevOne API URL.
b. username: Username of the account used to connect to the SevOne API.
c. password or encrypted password: Password or encrypted password of the account used to connect to the SevOne API.
2. Determine how to select and process SevOne events for each target:
a. page_size: Number of paginated results the SevOne API sends.
b. nms_login: Whether the SevOne API username and password are also valid for SevOne Network Management System (NMS)
c. alert_filter: A filter to limit the SevOne alerts to retrieve.
d. device_query: A query to retrieve device information for SevOne alerts.
e. object_query: A query to retrieve object information for SevOne alerts.
f. user_query: A query to retrieve user information for SevOne alerts.
g. requests_overlap: Period of time to delay processing duplicates.
h. overlap_identity_fields: List of payload tokens the LAM uses to identify duplicate events when SevOne returns all open events and not just updated events.
3. Configure the LAM behavior for each target:
a. num_threads: Number of worker threads to use when processing events.
b. request_interval: Length of time to wait between requests, in seconds.
c. max_retries: Number of times the LAM attempts to reconnect after connection failure.
d. retry_interval: Length of time to wait between reconnection attempts, in seconds.
e. recovery_interval: Length of time to wait between requests, in seconds, when the LAM re-establishes a connection after a failure.
f. max_lookback: Period of time for which to recover missed events, in seconds, when the LAM re-establishes a connection after a failure.
g. timeout: Length of time to wait before halting a connection or read attempt, in seconds.
4. Configure the SSL properties for each target if you want to encrypt communications between SevOne and Cisco Crosswork Situation Manager:
a. disable_certification_validation: Whether to disable SSL certificate validation.
b. path_to_ssl_files: Path to the directory that contains the SSL certificates.
c. server_cert_filename: Name of the SSL root CA file.
d. client_key_filename: Name of the SSL client key file.
e. client_cert_filename: Name of the SSL client certificate.
5. If you want to connect to SevOne through a proxy server, configure the host, port, user, and password or encrypted password properties in the proxy section for the target.
6. Optionally configure the LAM identification and logging details in the agent and log_config sections of the file:
a. name: Identifies events the LAM sends to the Message Bus.
b. capture_log: Name and location of the LAM's capture log file.
c. configuration_file: Name and location of the LAM's process log configuration file.
7. Optionally configure severity conversions. See /document/preview/11721#UUID8b183a1e1278a7a652d3ae86944d7379 for further information and "Conversion Rules" in /document/preview/11720#UUID5c67156b667b1a28ec648cd779393914 for details on conversions in general.Severity ReferenceData Parsing
Example
You can configure the SevOne LAM to retrieve events from one or more sources. The following example demonstrates a configuration that targets one SevOne source (target1). If you have more than one source, add a target section for each one and uncomment properties to enable them.
monitor:
{
name : "SevOne LAM",
class : "CSevOneMonitor",
request_interval : 60,
max_retries : -1,
retry_interval : 60,
targets:
{
target1:
{
url: : "http://localhost:8080/api/v2/",
request_interval : 60,
max_retries : -1,
retry_interval : 60,
username : "SevOne_user",
#password : "password",
encrypted_password : "qJAFVXpNDTk6ANq65pEfVGNCu2vFdcoj70AF5BIebEc=",
#proxy:
#{
#host : "localhost",
#port : 8181,
#user : user,
#password : "password",
#encrypted_password : "tLSJCWlKSHl7SKw98lCgHWTQv5kLaksm42BP6XLgbWa&",
#}
disable_certificate_validation : true,
#path_to_ssl_files : "config",
#server_cert_filename : "server.crt",
#client_key_filename : "client.key",
#client_cert_filename : "client.crt",
requests_overlap : 10,
overlap_identity_fields : [ "id", "severity", "closed", "number" ],
timeout : 120,
page_size : 100,
nms_login : false,
retry_recovery:
{
recovery_interval : 20,
max_lookback : -1
},
alert_filter:
{
"deviceId" : [ 0,1,2,3,4 ]
},
device_query:
{
include_objects: false,
include_indicators: false,
local_only: true,
fields: [ "id", "name", "alternateName", "description", "ipAddress", "pollFrequency", "lastDiscovery", "timezone", "numElements", "pluginInfo" ]
},
object_query:
{
include_indicators: false,
include_extended_info: true,
fields: [ "id", "deviceId", "pluginId", "name", "description", "isEnabled", "isDeleted", "extendedInfo" ]
},
user_query:
{
fields: [ "id", "username", "firstName", "lastName", "email", "isActive" ]
},
}
}
},
agent:
{
name : "SevOneLam",
capture_log : "$MOOGSOFT_HOME/log/data-capture/sevone_lam.log"
},
log_config:
{
configuration_file : "$MOOGSOFT_HOME/config/logging/sevone_lam_log.json"
},
Configure for High Availability
Configure the SevOne LAM for high availability if required. See /document/preview/77155#UUIDbea404d9dd1afee65fa1471105d1b3c6 for details.High Availability Overview
Configure LAMbot Processing
The SevOne LAMbot processes and filters events before sending them to the Message Bus. You can customize or bypass this processing if required. You can also load JavaScript files into the LAMbot and execute them.
See LAMbot Configuration for more information. An example SevOne LAM filter configuration is shown below.
filter:
{
presend: "SevOneLam.js",
modules: [ "CommonUtils.js" ]
}
Map LAM Properties
SevOne event properties are mapped by default to the following Cisco Crosswork Situation Manager SevOne LAM properties. You can configure custom mappings in the SevOne LAMbot.
| SevOne Event Property |
SevOne LAM Event Property |
| Agent |
$LamInstanceName |
| Agent Location |
$LamInstanceName |
| Agent Time |
$endTime |
| Class |
$origin |
| Descripton |
$message |
| External ID |
$id |
| Manager |
SevOne |
| Severity |
$severity |
| Signature |
$origin::$deviceId::$objectId |
| Source |
$device.ipAddress |
| Source ID |
$deviceId |
| Type |
$origin |
The overflow properties are mapped to "custom info" and appear under custom_info in Cisco Crosswork Situation Manager alerts.
| SevOne Event Property |
SevOne LAM Overflow Property |
| Acknowledge By |
$acknowledgeBy |
| Assigned User |
$assignedUser |
| Clear Message |
$clearMessage |
| Comments |
$comments |
| Device |
$device |
| Last Processed |
$lastProcessed |
| Number |
$number |
| Object |
$object |
| Plugin Name |
$pluginName |
Start and Stop the LAM
Restart the SevOne LAM to activate any changes you make to the configuration file or LAMbot.
The LAM service name is sevonelamd.
See /document/preview/11677#UUID1a2205c3aae40b26fdfe94490043f3c3 for further details.Control Processes
If the LAM fails to connect to one or more SevOne sources, Cisco Crosswork Situation Manager creates an alert and writes the details to the process log. Refer to the logging details for LAMs and integrations for more information.Configure Logging
SevOne Reference
This is a reference for the SevOne LAM. and UI integration The SevOne LAM configuration file is located at $MOOGSOFT_HOME/config/sevone_lam.conf.
The following properties are unique to the SevOne LAM and UI integration.
See the LAM and Integration Reference for a full description of all common properties used to configure LAMs and UI integrations.
See the SevOne Documentation for details on SevOne components.
url
The SevOne API URL.
Type: String
Required: Yes
Default: N/A
username
Username of the account used to connect to the SevOne API.
Type: String
Required: Yes
Default: N/A
password
Password of the account used to connect to the SevOne API.
Type: String
Required: If you are not using encrypted_password.
Default: N/A
encrypted_password
If you are using an encrypted password, enter it into this field and comment the password field. The encrypted_password property overrides password.
Type: String
Required: If you are not using password
Default: N/A
page_size
Number of paginated results the SevOne API sends.
Type: Integer
Required: No
Default: 100
nms_login
Indicates whether the SevOne API username and password are also valid for SevOne Network Management System (NMS). For an example see the following link. Replace example.sevone.com with your SevOne URL: http://example.sevone.com/api/docs/#!/Authentication/signIn_1
Type: Boolean
Required: No
Default: False
alert_filter
A filter to limit the SevOne alerts to retrieve. Do not use the field timespanBetween as it is overwritten by the LAM. For an example see the following link. Replace example.sevone.com with your SevOne URL: http://example.sevone.com/api/docs/#!/Alerts/filterAlerts_1
Type: String
Required: No
Default: N/A
Example: The example below retrieves alerts related to device IDs 0-4.
alert_filter:
{
"deviceId": [ 0,1,2,3,4 ]
}
device_query
A query to retrieve device information for SevOne alerts. Specify the content to return in "fields". All available fields are returned by default. If this property is commented out, SevOne will not query for devices. For an example see the following link. Replace example.sevone.com with your SevOne URL: http://example.sevone.com/api/docs/#!/Devices/filterDevice
Type: String
Required: No
Default: N/A
Example:
device_query:
{
include_objects: false,
include_indicators: false,
include_extended_info: false,
local_only: true,
fields: [ "id", "name", "alternateName", "description", "ipAddress", "pollFrequency", "lastDiscovery", "timezone", "numElements", "pluginInfo" ]
}
object_query
A query to retrieve object information for SevOne alerts. Specify the content to return in "fields". All available fields are returned by default. If this property is commented out, SevOne will not query for objects. For an example see the following link. Replace example.sevone.com with your SevOne URL: http://example.sevone.com/api/docs/#!/Objects/filterObjects
Type: String
Required: No
Default: N/A
Example:
object_query:
{
include_indicators: false,
include_extended_info: true,
fields: [ "id", "deviceId", "pluginId", "name", "description", "isEnabled", "isDeleted", "extendedInfo" ]
}
user_query
A query to retrieve information about users assigned to SevOne alerts. Specify the content to return in "fields". All available fields are returned by default. If this property is commented out, SevOne will not query for user data. For an example see the following link. Replace example.sevone.com with your SevOne URL: http://example.sevone.com/api/docs/#!/Users/filterUsers
Type: String
Required: No
Default: N/A
Example:
user_query:
{
fields: [ "id", "username", "firstName", "lastName", "email", "isActive" ]
{
Site24x7
The Site24x7 integration allows you to retrieve events from Site24x7 and send them to Cisco Crosswork Situation Manager.
Refer to the LAM and Integration Reference to see the integration's default properties. When you use the integrations UI, you can only configure the visible properties.
If you want to implement a more complex Site24x7 integration with custom settings, see Configure the Site24x7 LAM.
See the Site24x7 documentation for details on Site24x7 webhook integrations.
Before You Begin
The Site24x7 integration has been validated with Site24x7 v. June-2019. Before you start to set up your integration, ensure you have met the following requirements:
· You have an active Site24x7 account.
· You have the necessary permissions to create a webhook in Site24x7.
· Site24x7 can make requests to external endpoints over port 443.
Configure the Site24x7 Integration
To configure the Site24x7 integration:
1. Navigate to the Integrations tab.
2. Click Site24x7 in the Monitoring section.
3. Provide a unique integration name. You can use the default name or customize the name according to your needs.
4. Set a Basic Authentication username and password.
Configure Site24x7
Log in to Site24x7 and create a webhook to send event data to Cisco Crosswork Situation Manager. For more help, see the Site24x7 documentation.
1. Create a new webhook using the following details:
| Field |
Value |
| Integration Name |
Cisco Crosswork Situation Manager |
| Hook URL |
<your Site24x7 integration URL> For example: https://example.Cisco.com/events/site24x7_site24x71 |
| HTTP Method |
POST |
| Post as JSON |
Select the checkbox to allow the webhook to post event data in JSON format. |
| Send Incident Parameters |
Deselect the checkbox; the integration does not support the receipt of incident parameters. |
| Send Custom Parameters |
Select the checkbox and apply the template below. |
2. Apply the following payload to the Send Custom Parameters field:
{
"source_id": "$MONITOR_ID",
"external_id": "$MONITOR_ID",
"manager": "Site24x7",
"source": "$MONITORURL",
"class_name": "$MONITOR_GROUPNAME",
"agent_location": "$MONITORURL",
"type": "$MONITORTYPE",
"severity": "$STATUS",
"description": "$INCIDENT_REASON",
"agent_time": "$OUTAGE_TIME_UNIX_FORMAT"
}
3. Add the following API request header fields to HTTP Request Headers (you do not need to configure the User Agent or Authentication method fields):
| Field |
Value |
| Content-Type |
application/JSON |
| Authorization |
<your Basic Authorization key> |
4. Add the webhook to any monitors that will send notifications to Cisco Crosswork Situation Manager.
After you complete the integration, Site24x7 sends new events to Cisco Crosswork Situation Manager.
Configure the Site24x7 LAM
The Site24x7 LAM receives and processes Site24x7 events forwarded to Cisco Crosswork Situation Manager. The LAM parses the data into Cisco Crosswork Situation Manager events.
You can install a basic Site24x7 integration in the UI. See Site24x7 for integration steps.
Configure the Site24x7 LAM if you want to configure custom properties, set up high availability or configure advanced options that are not available in the UI integration.
Before You Begin
The Site24x7 integration has been validated with Site24x7 v. June-2019. Before you configure the Site24x7 LAM, ensure you have met the following requirements:
· You have an active Site24x7 account.
· You have the necessary permissions to create a webhook in Site24x7.
· Site24x7 can make requests to external endpoints over port 443.
If you are configuring a distributed deployment refer to /document/preview/77155#UUIDbea404d9dd1afee65fa1471105d1b3c6 first. You will need the details of the server configuration you are going to use for HA.High Availability Overview
Configure the LAM
Edit the configuration file to control the behavior of the Site24x7 LAM. You can find the file at $MOOGSOFT_HOME/config/site24x7_lam.conf.
The Site24x7 LAM is a REST-based LAM as it provides an HTTP endpoint for data ingestion. Note that only the generic REST LAM properties in site24x7_lam.conf apply to integrating with Site24x7; see the LAM and Integration Reference for a full description of all properties.
Some properties in the file are commented out by default; remove the '#' character to enable them..
1. Configure the connection properties for the REST connection:
a. address: Address on the Cisco Crosswork Situation Manager server that listens for REST messages. Defaults to all interfaces.
b. port: Port on the Cisco Crosswork Situation Manager server that listens for REST messages. Defaults to 8888.
2. Configure authentication:
a. authentication_type: Type of authentication used by the LAM. Defaults to basic_auth_static.
b. basic_auth_static: Username and password used for Basic Auth Static authentication.
c. authentication_cache: Whether to cache the username and password for the current connection when the authentication type is Basic.
3. Configure the LAM behavior:
a. accept_all_json: Allows the LAM to read and process all forms of JSON.
b. lists_contain_multiple_events: Whether Cisco Crosswork Situation Manager interprets a JSON list as multiple events.
c. num_threads:Number of worker threads to use for processing events.
d. rest_response_mode: When to send a REST response. See the LAM and Integration Reference for the options.
e. rpc_response_timeout: Number of seconds to wait for a REST response.
f. event_ack_mode: When Moogfarmd acknowledges events from the Site24x7 LAM during the event processing pipeline.
4. Configure the SSL properties if you want to encrypt communications between the LAM and the REST connection:
a. use_ssl: Whether to use SSL certification.
b. path_to_ssl_files: Path to the directory that contains the SSL certificates.
c. ssl_key_filename: The SSL server key file.
d. ssl_cert_filename: The SSL root CA file.
e. use_client_certificates: Whether to use SSL client certification.
f. client_ca_filename: The SSL client CA file.
g. auth_token or encrypted_auth_token: Authentication token in the request body.
h. ssl_protocols: Sets the allowed SSL protocols.
5. Optionally configure the LAM identification and logging details in the agent and log_config sections of the file:
a. name: Identifies events the LAM sends to the Message Bus.
b. capture_log: Name and location of the LAM's capture log file.
c. configuration_file: Name and location of the LAM's process log configuration file.
6. Optionally configure severity conversion. See /document/preview/11721#UUID8b183a1e1278a7a652d3ae86944d7379 for further information and "Conversion Rules" in /document/preview/95030#UUIDc06d3f9c8b3d99f90b7227c2e2d8afae for details on conversions in general.Severity ReferenceData Parsing
Example
An example Site24x7 LAM configuration is as follows:
monitor:
{
name : "Site24x7 LAM",
class : "CRestMonitor",
port : 8888,
address : "0.0.0.0",
use_ssl : false,
#path_to_ssl_files : "config",
#ssl_key_filename : "server.key",
#ssl_cert_filename : "server.pem",
#use_client_certificates : false,
#client_ca_filename : "ca.crt",
#auth_token : "my_secret",
#encrypted_auth_token : "dfJtTQMGiFHfiq7sCmxguBt6Jv+eytkoiKCquSB/7iWxpgGsG2aez3z2j7SuBtKj",
#ssl_protocols : [ "TLSv1.2" ],
authentication_type : "basic_auth_static",
basic_auth_static:
{
username: "user",
password: "pass"
#,encrypted_password : "dfJtTQMGiFHfiq7sCmxguBt6Jv+eytkoiKCquSB/7iWxpgGsG2aez3z2j7SuBtKj"
},
authentication_cache : true,
accept_all_json : true,
lists_contain_multiple_events : true,
num_threads : 5,
rest_response_mode : "on_receipt",
rpc_response_timeout : 20,
event_ack_mode : "queued_for_processing"
},
agent:
{
name : "Site24x7",
capture_log : "$MOOGSOFT_HOME/log/data-capture/site24x7_lam.log"
},
log_config:
{
configuration_file : "$MOOGSOFT_HOME/config/logging/site24x7_log.json"
{,
Configure for High Availability
Configure the Site24x7 LAM for high availability if required. See /document/preview/77155#UUIDbea404d9dd1afee65fa1471105d1b3c6 for details.High Availability Overview
Confgure LAMbot processing
The Site24x7 LAMbot processes and filters events before sending them to the Message Bus. You can customize or bypass this processing if required. You can also load JavaScript files into the LAMbot and execute them.
See LAMbot Configuration for more information. An example Site24x7 LAM filter configuration is shown below.
filter:
{
presend: "Site24x7Lam.js",
modules: [ "CommonUtils.js" ]
}
Start and Stop the LAM
Restart the Site24x7 LAM to activate any changes you make to the configuration file or LAMbot.
The LAM service name is site24x7lamd.
See /document/preview/11677#UUID1a2205c3aae40b26fdfe94490043f3c3 for the commands to start, stop and restart the LAM.Control Processes
You can use a GET request to check the status of the Site24x7 LAM. See "Check the LAM Status" in Configure the REST LAM for further information and examples.
Configure Site24x7
After you have the Site24x7 LAM running and listening for incoming requests, you can configure Site24x7. See "Configure Site24x7" in Site24x7.
Slack
You can install a Slack integration to send messages from Cisco Crosswork Situation Manager to a specified Slack channel.
The integration sends HTTP posts with a JSON payload including the message text to a Slack incoming webhook. By default the integration sends notifications for new Situations, comments and invitations. You can also manually send a message about an alert or Situation.
See the Slack documentation for details on Slack components.
Before You Begin
Before you start to set up your Slack integration, ensure you have met the following requirements:
· You have a Slack account with administrator privileges for the Slack workspace.
· You have created a Slack channel for incoming messages from Cisco Crosswork Situation Manager.
Configure the Slack Webhook
These instructions offer the basic information you need to configure the Slack webhook. For more help on incoming webhooks, see the Slack documentation.
1. Launch Slack Administration and go to the App Directory.
2. Add an incoming webhook and select the Slack channel to receive messages from Cisco Crosswork Situation Manager.
3. You can use the default webhook name, icon and descriptive label or edit the settings to meet your requirements.
4. Copy the Slack webhook URL.
Configure the Slack Integration
To configure the Slack integration:
1. Navigate to the Integrations tab.
2. Click Slack in the Collaboration section.
3. Provide a unique integration name. You can use the default name or customize the name according to your needs.
4. Provide connection details for your Slack system.
After you complete the configuration, Cisco Crosswork Situation Manager sends notifications to Slack about new Situations, comments and invitations.
SNMP LAM
You can configure the SNMP LAM to enable Cisco Crosswork Situation Manager to receive and process SNMP traps from different devices.
For information on the key concepts and SNMP trap components, see Ingest SNMP Traps.
There is no UI integration for SNMP traps. See Configure the SNMP Trapd LAM for configuration instructions.
Ingest SNMP Traps
You can use the Trapd LAM integration in Cisco Crosswork Situation Manager to ingest and process SNMP traps as events. See SNMP LAM for details.
The Trapd LAM is useful if you are monitoring a large network with hundreds or thousands of devices that are sending traps from multiple objects and you want Cisco Crosswork Situation Manager to reduce some of this noise.
Trap Processing Overview
In the standard workflow, the setup steps for Cisco Crosswork Situation Manager to ingest traps are:
1. Run the Mibparser utility to check your MIBs for any issues and generate your parsed MIBs. See Parse MIBs for Trap Integration.
2. Configure the Trapd LAM to load the parsed MIBs See step three of Configure the SNMP Trapd LAM.
3. Run the Mib2Lam utility to generate Trap modules from the parsed MIBs. See Create LAMbots from MIBs.
4. Deploy the Trap modules into the Trapd LAM and the Trap LAMbot. See Create LAMbots from MIBs.
Once these steps have been completed, the Trapd LAM can ingests traps and pass them through to the LAMbot. The Trap LAMbot processes each trap payload, determines the processing path and passes the trap along the event stream.
In the example diagram, Trapd LAM ingests a coldStart Trap from a LAN switch. It translates the trap using a MIB file then passes it to the LAMbot and Trap Module for processing.

Trap Processing Components
The following components comprise the trap processing system in Cisco Crosswork Situation Manager:
SNMP
Cisco Crosswork Situation Manager supports three versions of SNMP:
· SNMPv1 - the original version of the protocol that supports 32-bit counters, trap messages and uses a simple authentication scheme with little security.
· SNMPv2 - the second, improved version of SNMP is nearly identical to v1 but includes support for 64-bit counters and the addition of Inform messages.
· SNMPv3 - the latest version of SNMP has enhanced security features with the additions of both authentication and encryption. See SNMPv3 for information on configuration.
Trapd LAM
The Trapd LAM is Cisco Crosswork Situation Manager' standard integration for receiving and processing SNMP traps sent from your SNMP applications. You can configure it using $MOOGSOFT_HOME/config/trapd_lam.conf. See SNMP LAM for more information.
MIBs
The Management Information Base (MIB) files are virtual databases of variables describing the conditions at each SNMP device. Trapd LAM uses the MIBs to interpret the trap messages it receives. Each MIB is organized in a hierarchical tree of uniquely identify managed objects and each object has an object identifier (OID). See MIBs for more details.
Mibparser
The Mibparser utility parses MIB (management information base) files used by SNMP Trap integrations. The utility helps identify issues and conflicts between your MIBs. For more information on the checks see Parse MIBs for Trap Integration.
Mib2lam
The Mib2lam utility creates trap modules and LAMbots from the SNMP trap definitions in raw MIB files. See Create LAMbots from MIBs for more information.
Trap LAMbot
The Trap LAMbot is the entry point for all trap processing. The LAMbot normalises the data, determines the processing path and forwards along the event processing chain to a Moolet such as the AlertBuilder. You can load the MIBdb LAMbot module into the Trap LAMbot to translate OIDs (object identifiers) into their defined names. See MIB Db for more information.
Trap Module
The Trap modules are individual modules the Trapd LAM routes the traps to for processing. These modules contain specific trap processing on a trap-by-trap basis. You can create these manually or you can use boilerplate LAMbot modules that the Mib2lam generates.
SNMPv3
You can enable Cisco Crosswork Situation Manager to receive SNMP Traps by configuring a Trap LAM to monitor SNMP-enabled devices.
Cisco Crosswork Situation Manager uses a MIB (management information base) file to process SNMP Traps sent from your SNMP application. The latest version of SNMP is SNMPv3.
Before You Begin
Before you enable SNMPv3, ensure you have met the following requirements:
· You have generated the engine ID of your SNMP application in hexadecimal format.
· Ensure port 162, the default SNMP Trap/UDP port, is available and open to any firewalls.
· You have parsed any MIB files into JSON format using themibparserutility from $MOOGSOFT_HOME/bins/utils. Each MIB file defines what data can be retrieved from each SNMP device.
Enable SNMPv3 in the Trap LAM Configuration
Enable SNMPv3 and its associated security features as follows:
1. Edit $MOOGSOFT_HOME/config/trapd_lam.conf.
2. Configure the parameters to meet your requirements:
| Parameter |
Value |
Description |
| usm_file |
String |
Path to your User-based Security Model (USM) file, the mechanism that allows you to authenticate and encrypt messages. Uncomment and enter the path if you want to use SNMPv3. The default location is$MOOGSOFT_HOME/config/trapd_usm.conf |
| mib_db_file |
String |
Path to your MIB database file. Uncomment and enter the path of your parsed MIB file. This is optional. If not provided, the Trap LAM parses the MIBs in $MOOGSOFT_HOME/etc/mibs/ at startup. |
| local_engine_id |
Hexadecimal String |
Engine ID of the SNMP monitor that sends Inform messages to your Trap LAM . This is optional. If not provided, the Trap LAM uses the default 6D6F6F67736F6674. |
3. Save the changes andclosethe file.
4. See the example of a trapd_lam.conf file with SNMPv3 enabled:
{
config :
{
monitor:
{
name : "Trap Monitor",
class : "CTrapMonitor",
trap_port : 162,
concurrency : 5,
name_resolution : true,
event_ack_mode : "queued_for_processing",
mib_db_file : "$MOOGSOFT_HOME/etc/precompiledMibs.json",
usm_file: "$MOOGSOFT_HOME/config/trapd_usm.conf",
local_engine_id: "56e8663492"
},
6. You can configure the authentication and privacy combination, as well as the security protocols of your users, as follows:
7. Edit $MOOGSOFT_HOME/config/trapd_usm.conf.
8. Create your users. Use the noAuthNoPriv-user, authNoPriv-user,authPriv-user and inform-user examples as a template. See user security options.
9. Enter values for the available security parameters:
| Parameter |
Value |
Description |
| engine-id |
Integer |
Unique identifier for the SNMP application. This is optional. If no value is entered it uses the local_engine_id from the Trap LAM configuration file. |
| auth-protocol |
String |
Identifier of the authentication protocol. Available options are MD5 or SHA-1. See MD5 and SHA-1 for information. |
| auth-passphrase |
String |
Password for the authentication protocol. |
| priv-protocol |
String |
Identifier of the privacy protocol. Available options are DES, 3DES, AES-128, AES-192 and AES-256. See DES, 3DES and AES for information. |
| priv-passphrase |
String |
Password for the privacy protocol. |
10. Save the changes and close the file.
The Trap LAM monitors the configured USM file and picks up any changes automatically. You do not need to restart the LAM to add or remove users.
SNMPv3 User Security Options
SNMPv3 supports three authentication and privacy combinations:
· noAuthNoPriv - You not need to authenticate or encrypt SNMP messages.
· authNoPriv - You must authenticate but not encrypt SNMP messages.
· authPriv - You must authenticate and encrypt SNMP messages.
Configure the SNMP Trapd LAM
The SNMP Trapd LAM allows Cisco Crosswork Situation Manager to receive and process trap messages as events.
You can configure the SNMP Trapd LAM to process SNMPv1 traps, SNMPv2 informs and, SNMPv3 traps and informs.
For an overview of trap processing and the different versions of SNMP see Ingest SNMP Traps.
Before You Begin
Before you set up your Trapd LAM, ensure you have met the following requirements:
· Ensure port 162, the default port for receiving SNMP traps over UDP, is available and open on Cisco Crosswork Situation Manager. Alternatively configure another port to receive the traps.
· You have parsed any MIB files into JSON format using the mibparser utility. See Parse MIBs for Trap Integration.
· If using SNMPv3, you have generated the engine ID of your SNMP application in hexadecimal format.
If you are configuring a distributed deployment refer to /document/preview/77155#UUIDbea404d9dd1afee65fa1471105d1b3c6 first. You will need the details of the server configuration you are going to use for HA.High Availability Overview
Configure the LAM
Edit the configuration file to control the behavior of the Trapd LAM. You can find the file at $MOOGSOFT_HOME/config/trapd_lam.conf.
See the SNMP Trapd LAM Reference and LAM and Integration Reference for a full description of all properties. Some properties are commented out by default. Uncomment properties to enable them.
1. Configure the connection properties:
a. trap_port: Port the Trapd LAM uses to receive traps. SNMP agents typically send traps to port 162 via UDP.
b. concurrency: Maximum number of threads the Trapd LAM can use for receiving and processing traps.
c. name_resolution: The hostname of the IP address the trap came from.
2. Configure the Trapd LAM behavior:
a. event_ack_mode: Determines when Cisco Crosswork Situation Manager acknowledges an event from the Trapd LAM during processing.
b. mib_db_file: Defines the location where the Mibparser utility exports and parses its MIBs. See Parse MIBs for Trap Integration for more details.
3. Optionally configure the USM file and engine ID properties if you want to use SNMPv3:
a. usm_file: Path to your User-based Security Model (USM) file that allows you to authenticate and encrypt messages for SNMPv3.
b. local_engine_id: Engine ID of the SNMP monitor that sends Inform messages to your Trap LAM.
4. Optionally configure the LAM identification and logging details in the agent and log_config sections of the file:
a. name: Name of the SNMP agent that is the source of the trap messages.
b. capture_log: Location of the LAM's capture log file.
c. configuration_file: Name and location of the LAM's process log configuration file.
5. Optionally configure severity conversions. See /document/preview/11721#UUID8b183a1e1278a7a652d3ae86944d7379 for further information and "Conversion Rules" in /document/preview/11720#UUID5c67156b667b1a28ec648cd779393914 for details on conversions in general.Severity ReferenceData Parsing
Example
The following example shows a Trapd LAM that is able to process SNMPv3 traps and informs:
monitor:
{
name : "Trap Monitor",
class : "CTrapMonitor",
trap_port : 162,
concurrency : 5,
name_resolution : false,
event_ack_mode : "queued_for_processing",
mib_db_file : "etc/myParsedMibs.json",
usm_file : "$MOOGSOFT_HOME/config/trapd_usm.conf",
local_engine_id : "03c4b11e3e"
},
agent:
{
name : "DATA_SOURCE",
#capture_log : "$MOOGSOFT_HOME/log/data-capture/trapd_lam.log"
},
log_config:
{
configuration_file : "$MOOGSOFT_HOME/config/logging/trapd_lam_log.json"
},
Configure for High Availability
Configure the Trapd LAM for high availability if required. See /document/preview/77155#UUIDbea404d9dd1afee65fa1471105d1b3c6 for details.High Availability Overview
Configure LAMbot Processing
The Trapd LAMbot processes and filters events before sending them to the Message Bus. You can customize or bypass this processing if required. You can also load JavaScript files into the LAMbot and execute them.
See LAMbot Configuration for more information. An example Trapd LAM filter configuration is shown below.
filter:
{
presend: "TrapdLam.js"
}
Start and Stop the LAM
Restart the Trapd LAM to activate any changes you make to the configuration file or LAMbot.
The LAM service name is trapdlamd.
See /document/preview/11677#UUID1a2205c3aae40b26fdfe94490043f3c3 for further details.Control Processes
SNMP Trapd LAM Reference
This is a reference for the SNMP Trapd LAM. The SNMP Trapd LAM configuration file is located here: $MOOGSOFT_HOME/config/trapd_lam.conf.
It contains the following sections and properties:
Monitor
name: Name of the LAM.
Type: String
Required: Yes
Default: "Trap Monitor". Do not change.
class: Class of the LAM.
Type: String
Required: Yes
Default: "CTrapMonitor". Do not change.
trap_port: Port the Trapd LAM uses to receive traps. SNMP agents typically send traps to port 162 via User Datagram Protocol (UDP).
Type: Integer
Required: Yes
Default: 162
concurrency: Maximum number of threads the Trapd LAM can use for receiving and processing traps.
Type: Integer
Required: Yes
Default: 5
name_resolution: Provides hostname of IP address the trap came from.
Type: Boolean
Required: Yes
Default: "true,"
event_ack_mode: Determines when Cisco Crosswork Situation Manager acknowledges an event from the Trapd LAM during processing. Acknowledge events when Cisco Crosswork Situation Manager adds them to the Moolet queue. This is the with queued_for processing. Acknowledge events when a Moolet processes them with event_processed.
Type: String
Required: Yes
One of: queued_for_processing, event_processed
Default: "queued_for_processing,"
mib_db_file: Defines the location where the Mibparser utility exports and parses its MIBs. If you do not provide a file, the Trapd LAM parses the MIBs in $MOOGSOFT_HOME/etc/mibs/ at startup.
You can use absolute or relative pathing. If you do not use either then Cisco Crosswork Situation Manager prepends $MOOGSOFT_HOME to the path you provide. For example "etc/precompiledMibs.json" becomes "$MOOGSOFT_HOME/etc/precompiledMibs.json".
Type: String
Required: No
Default: "etc/precompiledMibs.json"
usm_file: Path to your User-based Security Model (USM) file, the mechanism that allows you to authenticate and encrypt messages for SNMPv3.
Type: String
Required: No
Default: "$MOOGSOFT_HOME/config/trapd_usm.conf"
local_engine_id: Engine ID of the SNMP monitor that sends Inform messages to your Trap LAM. This must be in hexadecimal string format.
Type: String (Hexadecimal)
Required: No
Default: "6D6F6F67736F6674"
Agent
name: Name of the SNMP agent that is the source of the trap messages.
Type: String
Required: Yes
Default: "DATA_SOURCE". Do not change.
capture_log: Location of the Trapd LAM's capture log file. The capture log contains the raw data the LAM receives. See Configure Logging for more information.Configure Logging
Type: String
Required: No
Default: N/A
Log Config
configuration_file: File that specifies the configuration of the TrapD LAM's process log. The process log records the activities of the LAM as it ingests raw data. See Configure Logging for more information.Configure Logging
Type: String
Required: No
Default: "$MOOGSOFT_HOME/config/logging/integrations.log.json"
MIBs
Management Information Base (MIB) files are virtual databases of variables describing the conditions at each SNMP device. MIBs provide a hierarchical structure of uniquely identify managed objects and their individual object identifiers (OIDs) that can be read and used by the Trapd LAM.
The Trapd LAM is shipped with a base set of MIBs in the $MOOGSOFT_HOME/etc/mibs directory. These contain all of the basic imports that complex MIBs require. If custom MIBs are required these must be parsed using the Mibparser utility. See Parse MIBs for Trap Integration for more information.
MIB Best Practice
Cisco cannot provide enterprise-specific MIBs as part of the distribution. Customers are responsible for supplying their own vendor- or enterprise-specific MIBs that are current to the devices sending the traps. Traps are processed incorrectly if these MIBs are out-of-date or missing.
If there is no MIB for a trap, you can write a basic MIB to cover the required translation and OID-to-name conversion. If you do not have any specific MIBs you have to create trap processing modules manually.
MIB Loading Sanity Checks
The Trapd LAM is strict with OID definitions in MIBs and performs a number of sanity checks on the them. Some of the scenarios and logging warnings you can expect in these checks include:
MIB name already in use
If there are two or more MIBs with the same name, the Trapd LAM uses the last read MIB and ignores any previous versions. It is important to ensure that there are no discrepancies like this as you could have undesired behavior in trap resolution.
Imported MIB not found
If a MIB imports and references another MIB that cannot be found in $MOOGSOFT_HOME/etc/mibs, any definitions using that reference are not resolvable. In this scenario, the Trapd LAM logs the following Warning: message :
WARN: Import [SNMPv2-SMI] not found for Mib [NET-SNMP-MIB]
Conflicting names in MIB
If the same name is used to identify two or more different OIDs, only the first entry is accepted. For example, if internet is defined twice in two different OIDs, the Trapd LAM only considers the first to be part of the MIB:
internet OBJECT IDENTIFIER ::= { dod 1 }
internet OBJECT IDENTIFIER ::= { dod 2 }
directory OBJECT IDENTIFIER ::= { internet 1 }
In this example, directory is considered to be {dod 1 internet 1}.
Conflicting OIDs in MIB:
If a MIB maps the same OID to two or more different names, only the first definition is accepted. The Trapd LAM logs subsequent definitions with a Warning: message such as:
netSnmpModuleIDs OBJECT IDENTIFIER ::= { netSnmpEnumerations 1 }
snmpDomainsConflict OBJECT IDENTIFIER ::= { netSnmpEnumerations 1 }
In this example, { netSnmpEnumerations 1 } is defined twice under two different names so only the latest occurrence of { netSnmpEnumerations } is considered part of the MIB. Here is an example of an OID conflict Warning: log message:
WARN : OID Conflict: Full OID [1.3.6.1.4.1.8072.3.1] has conflicting names, Mib [NET-SNMP-MIB -> snmpDomainsConflict] & Mib [NET-SNMP-MIB -> netSnmpModuleIDs]
Conflicting names between two or more MIBs
If the same OID is mapped to multiple names between two or more MIBs, the Trapd LAM only accepts the first definition. The Trapd LAM logs any subsequent definitions with a Warning: message:
WARN: OID Conflict: Full OID [1.3.6.1.4.1.42.1.1] has conflicting names, Mib [MIB-1 -> deviceTemperature] & Mib [MIB-2 -> deviceTemp]
Object extends unknown parent
If an object definition references a parent which is not defined or imported in the MIB, then that object is not resolvable. The Trapd LAM logs a Warning: message such as:
snmpDomainsConflict OBJECT IDENTIFIER ::= { snmpv3 1 }
In this example, snmpv3 has not been defined or imported, so snmpDomainsConflict cannot be resolved and Trapd LAM displays a log Warning: message:
WARN: Mib [NET-SNMP-MIB]:Unable to resolve and find SINGLE parent for Mib Object [snmpDomainsConflict ::= { snmpv3 1 }]
Hex String Output values
MIBs are used to define SNMP OIDs (Object Identifiers) and their attributes, so the agent know how to interpret a trap message. When you define an object in the MIBs, you can give it optional attributes such as:
· DISPLAY-HINT: Used to indicate to the agent how to display a value of this object.
· DEFVAL: Tells the agent the default value for the object and the input type (string, hex, integer).
The Trapd LAM uses these definitions in MIBs to determine when a value should be outputted as a hexadecimal string (hex). If they are not used, the Trapd LAM attempts to output the value in human-readable ASCII format, which may not be as intended. For example, if a hex format is not specified, an object with the value 4D4F4F47 is outputted as the ASCII string MOOG when the intended output is 4D4F4F47.
DISPLAY-HINT Guidelines
The DISPLAY-HINT clause instructs Trapd LAM how to display the hex string using the format: [digits]x[delimiter].
· [digits] represent the number of bytes to group before delimiting
· [delimiter] is a single character which is used as the delimiter.
For example, an object with DISPLAY-HINT "1x_" for value of 9e3f4242 outputs as follows: 9E_3F_42_42
An object with DISPLAY-HINT "2x-" clause for the same value outputs as a string: 9E3F-4242.
A varbind with DISPLAY-HINT "1x:" and a value of 5cf9388e7dd4 outputs 5C:F9:38:8E:7D:D4.This is the expected output for a MAC address.
DEFVAL Guidelines
The DEFVAL definitions specify a hex type and also result in Trapd LAM outputting values as hex strings. The default format is 1x.
A DEFVAL definition specifies a hex type in the following format, normally followed by an upper or lower case 'h':
DEFVAL { '0000-ffff'h }
DEFVAL { ''H }
If both DISPLAY-HINT and DEFVAL define recognisable hex formats, the DISPLAY-HINT format is used. If neither DISPLAY-HINT or DEFVAL definition is correctly specified, the octet string values use the following logic:
· If the value contains only printable ASCII characters (a range of 0x20 to 0x7E, and \t \n \v \f \r) then the value is output as a human readable ASCII String.
· If the value does not contain the above specified printable characters then the value is outputted as a Hex String in the default format of 1x.
If a Hex DISPLAY-HINT or a Hex type DEFVAL is supplied for a MIB object then the Trapd LAM outputs these values as hex strings, regardless of any syntax definitions. The Trapd LAM does not resolve or associate syntax definitions.
Base Set of MIBs:
The base set of MIBs that is shipped in the $MOOGSOFT_HOME/etc/mibs directory contains the following:
| AGENTX-MIB.txt |
|
IPV6-UDP-MIB.txt |
|
SNMP-MPD-MIB.txt |
| BRIDGE-MIB.txt |
|
LM-SENSORS-MIB.txt |
|
SNMP-NOTIFICATION-MIB.txt |
| DISMAN-EVENT-MIB.txt |
|
MTA-MIB.txt |
|
SNMP-PROXY-MIB.txt |
| DISMAN-SCHEDULE-MIB.txt |
|
MoogTraps.txt |
|
SNMP-TARGET-MIB.txt |
| DISMAN-SCRIPT-MIB.txt |
|
NET-SNMP-AGENT-MIB.txt |
|
SNMP-USER-BASED-SM-MIB.txt |
| EtherLike-MIB.txt |
|
NET-SNMP-EXAMPLES-MIB.txt |
|
SNMP-USM-AES-MIB.txt |
| HCNUM-TC.txt |
|
NET-SNMP-EXTEND-MIB.txt |
|
SNMP-USM-DH-OBJECTS-MIB.txt |
| HOST-RESOURCES-MIB.txt |
|
NET-SNMP-MIB.txt |
|
SNMP-VIEW-BASED-ACM-MIB.txt |
| HOST-RESOURCES-TYPES.txt |
|
NET-SNMP-PASS-MIB.txt |
|
SNMPv2-CONF.txt |
| IANA-ADDRESS-FAMILY-NUMBERS-MIB.txt |
|
NET-SNMP-TC.txt |
|
SNMPv2-MIB.txt |
| IANA-LANGUAGE-MIB.txt |
|
NET-SNMP-VACM-MIB.txt |
|
SNMPv2-SMI.txt |
| IANA-RTPROTO-MIB.txt |
|
NETWORK-SERVICES-MIB.txt |
|
SNMPv2-TC.txt |
| IANAifType-MIB.txt |
|
NOTIFICATION-LOG-MIB.txt |
|
SNMPv2-TM.txt |
| IF-INVERTED-STACK-MIB.txt |
|
RFC-1212.txt |
|
TCP-MIB.txt |
| IF-MIB.txt |
|
RFC-1215.txt |
|
TRANSPORT-ADDRESS-MIB.txt |
| INET-ADDRESS-MIB.txt |
|
RFC1155-SMI.txt |
|
UCD-DEMO-MIB.txt |
| IP-FORWARD-MIB.txt |
|
RFC1213-MIB.txt |
|
UCD-DISKIO-MIB.txt |
| IP-MIB.txt |
|
RMON-MIB.txt |
|
UCD-DLMOD-MIB.txt |
| IPV6-ICMP-MIB.txt |
|
SCTP-MIB.txt |
|
UCD-IPFWACC-MIB.txt |
| IPV6-MIB.txt |
|
SMUX-MIB.txt |
|
UCD-SNMP-MIB.txt |
| IPV6-TC.txt |
|
SNMP-COMMUNITY-MIB.txt |
|
UDP-MIB.txt |
| IPV6-TCP-MIB.txt |
|
SNMP-FRAMEWORK-MIB.txt |
|
|
MIB Db
The MibDb LAMbot module can be used by the Trapd LAM to translate OIDs (object identifiers) into their defined names, provided the OIDs have been defined in the MIBs (Management Information Bases).
The MibDb module allows the Cisco Crosswork Situation Manager Trapd LAMbot to look up the defined name of the provided OID String.
For example, when a trap is passed to the Trapd LAMbot, the varbind keys can be OID Strings, which can be very long and not easy to read. These can be translated to human readable names by using the MibDb module and calling the function translateOID. The result may be used for debug logging or inserted into an Event for future use.
The translateOID method performs an ordered look up on two internal databases, returning the first possible match. The first is a V2 Notification and general MIB Objects database, and the second is the V1 Trap database. This ordering can cause issues if you have a V1 Trap and a V2 MIB Object with the same OID and a different name
If looking up a V1 Trap, the method translateV1TrapOID should be used instead (see below)
The MibDb module is only available to load into the Trapd LAMbot.
To use, at the top of the TrapdLam.js file, define a new global object mibDb to the MibDb module:
var mibDb = LamBot.loadModule("MibDb");
Methods
Reference Guide
The oidAsString argument used in the MibDb module is a single string.
Multiple arguments are possible using concatenation. See examples below.
mibDb.translateOID(oidAsString)
Translate an OID String into a human readable String by looking up the OID in the resolved MIBs used by the Trapd LAM.
Request Argument
| Name |
Type |
Description |
| oidAsString |
String |
A single string of valid JavaScript variables or objects, used to form a valid absolute OID. |
Return Parameter
| Name |
Type |
Description |
| resolvedName |
String |
The fully or partially resolved name, if found. Otherwise null is returned. |
Examples
The following examples are based on default base MIBs that are shipped with Cisco Crosswork Situation Manager.
Example 1
var resolvedName = mibDb.translateOID("1.3.6.1.4.1.8072");
The output of resolvedName is:
netSnmp
Example 2
The oidAsString parameter can be created using concatenations. In this example, a variable is used to provide a base OID:
var parent = "1.3.6.1.4.1.8072"
var partiallyResolvedName = mibDb.translateOID(parent + ".11");
The output of partiallyResolvedName is:
netSnmp.11
Example 3
The oidAsString parameter can be provided with a preceding dot but must be a full OID:
var oid1 = mibDb.translateOID(".1.3.6.1.4.1.8074");
The output of oid1 is:
enterprises.8074
mibDb.translateV1TrapOID(oidAsString, (optional) allowPartialMatch)
Translate an OID String into a human readable String by looking up the OID in the resolved V1 Trap database used by the Trapd LAM.
Request Arguments
| Name |
Type |
Description |
| oidAsString |
String |
A single string of valid JavaScript variables or objects, used to form a valid absolute OID |
| allowPartialMatch |
Boolean |
Optional. true = returns partial matches if a full match cannot be found false = returns null if a full match cannot be found The default is true if not specified |
Return Parameter
| Name |
Type |
Description |
| resolvedName |
String |
The fully resolved name, partial match or null depending on the allowPartialMatch flag (see above) |
Examples
The following examples are based on default base MIBs that are shipped with Cisco Crosswork Situation Manager.
Example 1
This example asks for a v1 Trap OID to be resolved without allowing partial results:
var trap1 = mibDb.translateV1TrapOID("1.3.6.1.2.1.11.9999.0", false);
This translates correctly to:
coldStart
Example 2
This example asks for a v1 Trap OID to be resolved, without allowing partial results:
var trap2 = mibDb.translateV1TrapOID("1.3.6.1.2.1.11.9999.0.1", false);
This translates to:
null
because 1.3.6.1.2.1.11.9999.0.1 has not been defined explicitly.
Example 3
This example asks for a v1 Trap OID to be resolved allowing partial results:
var trap3 = mibDb.translateV1TrapOID("1.3.6.1.2.1.11.9999.0.1", true);
This translates to:
coldStart.1
because 1.3.6.1.2.1.11.9999.0.1 is not explicitly defined, but 1.3.6.1.2.1.11.9999.0 translates to coldStart. Therefore the partial translation is coldStart.1.
Example 4
The oidAsString parameter can be created using concatenations. In this example, a variable is used to provide a base OID:
var parentTrap = "1.3.6.1.2.1.11"
var trap4 = mibDb.translateV1TrapOID(parentTrap + ".9999.1", true);
This translates to:
warmStart
Example 5
If the allowPartialMatching flag is not provided, true is used by default:
var trap5 = mibDb.translateV1TrapOID(".1.3.6.1.2.1.11.9999.1.1");
In this example .1.3.6.1.2.1.11.9999.1 translates to warmStart, and the result is the partial translation:
warmStart.1
Parse MIBs for Trap Integration
You can use the Mibparser command-line utility in Cisco Crosswork Situation Manager to parse MIB (management information base) files for the Trapd LAM integration. This utility can help identify issues and conflicts between your provided set of MIBs. For more information on the checks see MIBs.
You can also export the parsed MIBs specified in the Trapd LAM to a JSON file. Parsing to the JSON file lets you inspect the output for sanity checks and warnings. It also speeds startup because the Trapd LAM doesn't need to parse when it launches.
How the Trap Integration identifies MIBs
If the Trap LAM integration doesn't find any pre-compiled MIBs, it automatically parses any MIBs in $MOOGSOFT_HOME/etc/mibs upon launch.
If you have pre-parsed MIBs using Mibparser, you can configure the Trap LAM to find the file by specifying it in$MOOGSOFT_HOME/config/trapd_lam.conf.
Configure Trap Integration to use Parsed MIBS
Configure the Trap Integration to use parsed MIBs following these steps:
1. Launch the Mibparser utility from $MOOGSOFT/bin/utils and use -i argument to define the location it parses the MIBs from. Define the output of the Mibparser using -o. See Mibparser Command Reference for more information.
./mibparser -i <MIB_directory_filepath> -o $MOOGSOFT_HOME/etc/precompiledMibs.json
2. Configure the Trap LAM to find the file under mib_db_file in $MOOGSOFT_HOME/config/trapd_lam.conf.
If you specify a file, the Trap integration does not parse any MIBs in $MOOGSOFT_HOME/etc/mibs. Instead it loads in the MIBs and the objects defined in the file.
Parsed MIBs Reference
There might be naming conflicts and other issues when you import parsed MIBs.
For more information on MIB sanity checks, error messages, and the base set of MIBs see MIBs.
Mibparser Command Reference
This is a reference for parsing MIBs. The mibparser command-line utility accepts the following arguments:
| Argument |
Input |
Description |
| -c, --mib2lam <arg> |
String <path> |
Print a JSON file of the trap tree. This file can be used by the Mib2lam utility. |
| -h,--help |
- |
Display the mibparser utility syntax and option descriptions. |
| -i, --inputDir <arg> |
String <path> |
Full path of the directory containing the unparsed MIB files. Defaults to $MOOGSOFT_HOME/etc/mibs. |
| -l,--loglevel <arg> |
WARN | INFO | DEBUG | TRACE |
Log level controlling the amount of information that mibparser logs. Defaults to INFO. |
| -m,--merge <arg> |
String <path> |
Path of an existing JSON file you want to import and parse. |
| -o,--output <arg> |
String <path> |
Path for mibparser to export any successfully parsed JSON files. |
| -p,--print <arg> |
String <path> |
File path for mibparser to export a finalized and resolved Object Identifier (OID) tree. |
| -s,--singleThreaded |
- |
Determines whether mibparser parses MIB files using a single thread. |
| -v,--version |
- |
Display the version information for mibparser. |
Create LAMbots from MIBs
You can use the Mib2lam conversion utility to create trap modules and LAMbots from the SNMP trap definitions in raw MIB files.
The utility takes MIB files and produces trap modules containing all of the traps found in the provided MIB tree. You can deploy these modules into the Trapd LAM and the Trap LAMbot.
See Ingest SNMP Traps for information about SNMP traps, MIBs and trap processing.
Before You Begin
Before you can run the Mib2lam utility, ensure you have met the following requirements:
· You have downloaded and installed Node.js. See https://nodejs.org/en/download for download options.
· You have downloaded the Mib2lam .zip utility file. Contact your support representative for the latest version.
· If you want to replay traps captured using tcpdump, you have installed net-snmp npm.
Install Mib2lam
To install Mib2lam and accompanying trap modules, you need to run the moog_init_lams.sh script in $MOOGSOFT_HOME/bin/utils.
Run either of the following commands to download and extract the latest version of Mib2lam to $MOOGSOFT_HOME:
moog_init_lams.sh -s
or
moog_init_lams.sh --mib2lam
Note that in order to begin using Mib2lam you will need to configure your Trapd LAM to use the moog_trapd_lam.conf file you have just downloaded. You can find the file in $MOOGSOFT_HOME/config/moog_trapd_lam.conf.
Generate a LAMbot with Mib2lam
To generate a trap module and LAMbot using Mib2lam, follow these steps:
1. Add any required MIBs to the existing base set in the MIBs directory.
2. Run the Mibparser utility to create a JSON file of parsed MIBs, for example:
./mibparser -c unparsed_mibs.json -i <MIBS_directory_filepath>
3. Run the Mib2lam utility, defining the path of the parsed MIBS and your filename with configuration options. For example:
./mib2lam --config /filepath/mib2lam.conf --mibfile
<MIBS_directory_filepath>/parsed_mibs.json --oid <oid_starting_point> --module <module> --class <class>
4. Specify the configuration file using the -c or --config argument and define the JSON file that Mibparser creates using –mibfile. See Mib2lam Command Reference for all available arguments.
5. If there are any conflicts such as duplicate MIBs, OIDs or duplicate names, remove or rename the duplicates before parsing the MIBs again and running the Mib2lam utility once more. If there are no issues, a new module is created.
6. Create a directory under $MOOGSOFT_HOME/bots/lambots/trapModules and move the module into it. If necessary, merge the module into any existing generic modules, transferring over any enumerations and trap-specific functions.
7. Add the module to the MoogTrapdLam.js LAMbot file contained in the Mib2lam .zip file and add lines the following to the global section:
LamBot.loadModule("trapModules/generic/test.include");
var generic = new test(botUtil);
8. Alternatively, add the following line to the 'modules' section of moog_trapd_lam.confcontained in Mib2lam:
"trapModules/generic/test.include"
9. Also, add the following line to the top of the Trap LAMbot file:
var generic = new test(botUtil);
10. Add routing to allow generic traps to be sent to this module. By default, non-enterprise traps are defined and routed as follows:
var genericTraps=new GenericTraps(botUtil);
...
case "generictrap" : genericTraps.processTrap(moogEvent,trapData,trapInfo); break;
Mib2lam Example
To create a module called 'f5', run the Mib2lam utility with the following command:
./mib2lam --config /mib2lam_1vi/config/mib2lam.conf --mibfile /tmp/mibs/controlmib.json --oid f5 --module f5 --class network
When the utility runs successfully, you can expect a response similar to the one shown:
Module Name : f5
OID Start point : .1.3.6.1.4.1.3375.2.4.0.14
Use generics : true
Infer Severity : true
Related trap similarity : 35%
Varbind definitions :
- Include definitions : true
- In descriptions : true
- In custom_info : true
Global class : network
Check for v1 forwarded as v2c : false
Create test traps : true
Mib JSON input file : ../tmp/mibs/controlmib.json
Module Output file : /usr/share/moogsoft/custom/mib2lam/bin/../tmp/f5.include
Mib2lam Command Reference
This is a reference forMib2lam utility that converts MIBS into LAMbots. The mib2lam command-line utility accepts the following arguments:
| Argument |
Input |
Description |
| -c, --config <arg> |
String <filename> |
Filename containing configuration options. Defaults to ../config/mib2lam.conf |
| --civarbinds[=false] |
Boolean |
Include all variable bindings in custom_info.eventDetails. Defaults to true. |
| --descrvb |
Boolean |
Include all varbinds in the description. Defaults to true. |
| --forward |
Boolean |
Checks for SNMP v1 traps to be forwarded as SNMP v2c traps. Defaults to true if SNMP v1 traps are detected. |
| --generics |
Boolean |
Creates a generic function that each trap calls rather than a function per trap. Defaults to false. |
| -h, --help |
- |
Display the Mib2lam utility syntax and option descriptions. |
| -l, --loglevel <arg> |
DEBUG | INFO | WARN | FATAL |
Log level controlling the amount of information that Mib2lam logs. Defaults to WARN. |
| --mibfile <arg> |
String <filepath> |
Filename and path for the Mibparser's Mib2lam output. If you do not supply a file path, it uses a /tmp/ location. |
| --module <arg> |
String <name> |
Module name. If not entered, the utility prompts for a name to be entered when it runs. |
| --oid <arg> |
Abstract Syntax Notation One (ASN.1) or text |
Start point in the Object Identifier (OID) tree. This is mandatory. |
| --related |
Integer <related value> |
Returns the related alerts with a certain degree of similarity. The default is 35%. |
| --severity |
Integer <severity value> |
Calculates the severity of the trap. To do this, Mib2lam finds and uses a suitable severity bearing variable binding. |
| --showconfig |
- |
Displays the configuration and any defaults. |
| --similarity |
Integer <similarity value> |
Sets the similarity value between 0 and 100 between two traps for them to be considered related. The default is 35%. |
| --traps |
Boolean |
Enable to generate a file of test traps for each trap. Defaults to false. |
For the Boolean arguments, use=falseto disable any that are enabled by default. For example, if you did not want to Mib2lam to generate a file of test traps:
./mib2lam --traps=false
Socket LAM
You can configure the Socket LAM to enable Cisco Crosswork Situation Manager to collect event data from TCP/UDP sockets.
After you configure the Socket LAM, the sockets send events to Cisco Crosswork Situation Manager.
Before You Begin
Before you start to set up your Socket LAM, ensure you have met the following requirements:
· You know the mode for Socket connection. It can be either Server or Client.
· You have identified the IP Address and port for your socket connection.
· The port for your sockets is open and accessible from this host.
· You know the type of protocol you are using: UDP or TCP.
Configure the Socket LAM
You cannot configure a Socket LAM via the Cisco Crosswork Situation Manager UI.
To set up a Socket LAM, see Configure the Socket LAM.
Configure Your Sockets
You do not need to perform any LAM-specific steps on your Socket network.
After you configure the Socket LAM, the TCP/UDP sockets will send the events to Cisco Crosswork Situation Manager.
Configure the Socket LAM
The Socket LAM:
· Monitors data being written to a network socket.
· Parses this data according to the LAM’s configuration file.
· Constructs events that are passed to the Message Bus.
You can configure how the Socket LAM processes data. Cisco Crosswork Situation Manager expects the data to be written to the socket as a series of tokens that are delimited in a predictable, repeatable and regular way.
The Socket LAM takes its input from a UNIX TCP socket. The details of how the network connection is established is defined in the Socket LAM configuration, socket_lam.conf, in the monitor section, where you can configure three parameters to control how the connection is established.
Note:
Socket LAM conforms to the Java platform standard on Time Conversion.
Command line attributes
The executable is a command line executable that can be run as a service daemon, and takes four attributes, which can be viewed by typing:
% socket_lam --help
| Option |
Description |
| --config |
Points to a pathname to find the configuration file for the LAM. This is where the entire configuration for the LAM is specified |
| --help |
Displays all the command line options |
| --version |
Displays the component’s version number |
| --loglevel |
Specifies the level of debug. By default, you get everything. In common with all executables in Cisco Crosswork Situation Manager, having it set at that level can result in a lot of output (many messages per event message processed). In all production implementations it is recommended that log level be set to WARN, which only informs you of matters of importance |
socket_lam.conf
The configuration that controls the behavior of the Socket LAM is socket_lam.conf. Remember you must specify -config on the command line, otherwise, the system will look for socket_lam.conf, in the $MOOGSOFT_HOME/config directory.
socket_lam.conf contains all the various controls for how events are processed. There is also a LAMbot, SocketLam.js. All LAMs can take a LAMbot.
The config file contains a JSON object. All configuration in the Cisco Crosswork Situation Manager system is presented as a JSON object. At the first layer of the object, you have a parameter called config, and the object that follows config has all the necessary information to control the LAM.
Quoting
In some instances the attribute strings are quoted. Our JSON parser is forgiving, but the standard requires quoting for all strings, so Cisco recommends that you quote all strings.
Hash
You can comment out lines by prepending them with a hash.
socket_lam.conf walk through
Monitor object
monitor defines the object to be monitored:
monitor:
{
name : "Socket Monitor",
class : "CSockMonitor",
mode : "SERVER",
address : "0.0.0.0"
port : 8411
}
The above example specifies:
· name and class, which are reserved for future use and should be left as the defaults, Socket Monitor and CSockMonitor
· mode, can either be CLIENT or SERVER, following that you have an IP address, or hostname, and a TCP socket. In the case of CLIENT mode, the Socket LAM will attempt to connect to the defined address and port. If the Socket LAM cannot make a successful TCP connection to the socket, it will continue to retry within a built in time period. So, you can start up the Socket LAM in the absence of the source being ready, and it will continue to try and connect until it gets a connection. In SERVER mode, the Socket LAM opens the address and port number as a listening socket that can accept inbound connections. It will sit and wait until the source of the data makes a successful attempt to do a TCP connect to the address and port, spawning a standard TCP socket on which to except input
There is a current limitation with the Socket LAM, in that it can only handle one socket connection. Although it can operate in SERVER mode, you cannot have four or five connections, because you will suffer from interleaving with the data and unpredictable results.
Agent and Process Log configuration objects
Agent and Process Log allows you to define the following properties:
agent:
{
name : "Socket",
#capture_log : "$MOOGSOFT_HOME/log/data-capture/socket_lam.log",
}
log_config:
{
configuration_file : "$MOOGSOFT_HOME/config/logging/custom.log.json"
}
The above example specifies:
· name: Identifies events the LAM sends to the Message Bus.
· capture_log: Name and location of the LAM's capture log file.
· configuration_file: Name and location of the LAM's process log configuration file.
Data parsing
Any received data needs to be broken up into tokens. Once you have the tokens, you can start assembling an event. There are a number of parameters that allow you to control how this will work. The first two are a start and end character. The square brackets [] are the JSON notation for a list. You can have multiple start and end characters. The system considers an event as all of the tokens between any start and end character.
start: [],
end: ["\n"],
The above example specifies:
· There is nothing defined in start; however, a carriage return (new line) is defined as the end character
· In the example above, the LAM is expecting a whole line to be written followed by a return, and it will process the whole line as one event.
· Carefully set up, you can accept multi-line events.
Note:
For correct parsing of incoming events, the start tokens should not be a subset of any end token and vice versa. For example: start : [ "|event|" ], end : [ "|event|\n"] may result in some unpredictable parsing because the start token "|event|" is a subset of the end token. So if the start token is encountered before the intended end token is met the parser will think that it is the start of a new event and stop the current stream at this point and create an undesirable event. If a configuration like this is in place, and the source cannot be changed, then the recommendation is to use the regular expression parser instead of the start_and_end parser. This does not have the same token subset restriction
Delimiters
Delimiters define how a line is split into tokens – “tokenising”. For example, if you have a line of text data, it needs to be split up into a sequence of sub strings that are referenced by position from the start. So if you were processing a comma-separated file, where a comma separates each value, it would make sense to have the delimiter defined as a comma. Then the system would take all the text between start and end and break it up into tokens between the commas. The tokens could then be referenced by position number in the string starting from one, not zero.
For example if the input string was “the,cat,sat,on,the,mat” and comma was used as a separator, token 1 would be “the”, token 2 “cat” and so on.
Be aware, there are complications when you come to tokenisation and parsing. For example, if you say comma is the delimiter, and the token contains a comma, you will end up with that token containing a comma to be split into two tokens. To avoid this it is recommended that you quote strings. You must then allow the system to know whether it should strip or ignore quotes, hence the stripQuotes and ignoreQuotes parameters.
ignoreQuotes: true,
stripQuotes: false,
ignores: "",
delimiter: [",","\r"]
The above example specifies:
· If you have strings that are quoted between delimiters, ignoreQuotes set to true will look for delimiters inside the quote. For example, <delimiter>”hello “inside quote” goodbye”<delimiter> gives a token [hello inside quote goodbye]
· Setting stripQuotes to true removes start and end quotes from tokens. For example, “hello world” gives a token [hello world]
· ignores is a list of characters to ignore. Ignored characters are never included in tokens
· Delimiter is the list of valid delimiters used to split strings into tokens
Variables
For each event in the file, there is a positioned collection of tokens. Cisco Crosswork Situation Managerenables you to name these positions so if you have a large number of tokens in a line, of which you are interested in only five or six, instead of remembering it is token number 32, you can call token 32 something meaningful.
variables:
[
{ name: "Identifier", position: 1 },
{ name: "Node", position: 4 },
{ name: "Serial", position: 3 },
{ name: "Manager", position: 6 },
{ name: "AlertGroup", position: 7 },
{ name: "Class", position: 8 },
{ name: "Agent", position: 9 },
{ name: "Severity", position: 5 },
{ name: "Summary", position: 10 },
{ name: "LastOccurrence",position: 1 }
],
The above example specifies:
· position 1 is assigned to Identifier; position 4 is assigned to node and so on
· Positions start at 1, and go up rather than array index style counting from 0
This is important because at the bottom of the file, socket_lam.conf there is a mapping object that configures how Cisco Crosswork Situation Manager assigns to the attributes of the event that is sent to MooMs, values from the tokens that are parsed. For example, in mapping there is a value called rules, which is a list of assignments.
rules:
[
{ name: "signature",rule: "$Node:$Serial" },
{ name: "source_id",rule: "$Node" },
{ name: "external_id",rule: "$Serial" },
{ name: "manager",rule: "$Manager" },
{ name: "source",rule: "$Node" },
{ name: "class",rule: "$Class" },
{ name: "agent",rule: "$LamInstanceName" },
{ name: "agent_location",rule: "$Node" },
{ name: "type",rule: "$AlertGroup" },
{ name: "severity",rule: "$Severity", conversion: "sevConverter" },
{ name: "description",rule: "$Summary" },
{ name: "first_occurred",rule: "$LastOccurrence" ,conversion: "stringToInt"},
{ name: "agent_time",rule: "$LastOccurrence",conversion: "stringToInt"}
]
In the example above, the first assignment name: "signature",rule:"$Node:$Serial" ( "$Node:$Serial is a string with $ syntax) means for signature take the tokens called Node and Serial and form a string with the value of Node followed by a colon followed by the value of Serial and call that signature in the event that is sent up to the system.
You define a number of these rules covering the base attributes of an event. For reference, the system expects a minimum set of attributes in an event that are shown in this particular section.
Constants and conversions
There are a number of these rules, such as severity where there is a conversion defined. The following example looks up the value of severity and returns the mapped integer on the other side.
sevConverter:
{
lookup: "severity",
input: "STRING",
output: "INTEGER"
},
severity:
{
"CLEAR" : 0,
"INDETERMINATE" : 1,
"WARNING" : 2,
"MINOR" : 3,
"MAJOR" : 4,
"CRITICAL" : 5,
moog_lookup_default: 3
}
The above example specifies:
· sevConverter, which references a conversion definition in the conversions object
· The sevConverter uses a look up table lookup: "severity" to reference a table named severity defined in the constants section
In this example the conversion takes as its input a string with a textual value of severity. From this it looks in the severity conversion table for a matching value and then returns the mapped value converted to an integer
moog_lookup_default can be used to specify a default value when an event is received which does not map to one of the values listed.
If moog_lookup_default setting is not used and an event is received which does not map to one of the other specifically listed values, the event will NOT be processed.
stringToInt is used in a time conversion, which forces the system to turn a string token into an integer value.
stringToInt:
{
input: "STRING",
output: "INTEGER"
}
The filter defines whether Cisco Crosswork Situation Manager uses a LAMbot. If you comment out the presend value, no filter is applied to the events produced and all events are sent unchanged to the Message Bus. If a LAMbot is defined, for every event the system assembles using this configuration, the event is passed to the LAMbot (via the presend function defined in the LAMbot).
filter:
{
presend: "SocketLam.js"
}
Therefore you must define a presend function in your JavaScript file.
The return value of the presend function will determine whether the event is sent on to the MooMs bus. The presend function can also define sub-streams that events are sent out on, so events can be sent to different farmd’s.
You can provide an additional parameter to presend called modules that takes a JSON list. The JSON list is a list of optional JavaScript files that are loaded into the context of the LAMBot and executed; thus, you can share modules between LAMs. For example, you can write a generic Syslog processing module that is used in both the Socket LAM and the log file LAM. You therefore do not need to needlessly replicate code in the Moobot for each of the LAM’s.
JSON events
The other capability of all LAMs is the native ability to consume JSON events. You must have a start and end carriage return as it is expecting a whole JSON object following the carriage return.
Under parsing you have:
end: ["\n"],
For the delimiter you have:
delimiter: ["\r"]
JSON is a sequence of attribute/value, and the attribute is used as a name. Under mapping, you must define the following attribute builtInMapper: "CJsonDecoder". It automatically populates, prior to the rules being run, all of the values contained in the JSON object.
For example if the JSON object to be parsed was:
{"Node" : "acmeSvr01","Severity":"Major"...}\n
The attributes available to the rules in the mapping section would be xNode=”acmeSvr01”, $Severity=”Major” and so on.
catchAll
If you have an attribute that is never referenced in a rule, for example “enterprise trap number” which is never mapped into the attribute of an event, they are collected and placed as a JSON object in a variable called defined here and passed as part of the event.
SolarWinds
You can integrate Cisco Crosswork Situation Manager with the following Microsoft products:
· Pingdom: Install the Pingdom integration to collect event data from Pingdom.
· SolarWinds: Install the SolarWinds integration to poll one or more SolarWinds Orion systems for alerts and send them to Cisco Crosswork Situation Manager as events.
Pingdom
The Pingdom integration provides an endpoint destination for webhook notifications from alerts on your Pingdom resource.
Pingdom webhooks do not allow for authentication. The Cisco Crosswork Situation Manager integration listens without requiring password information.
When you use the integrations UI, you can only configure the visible properties. If you want to implement a more complex Pingdom LAM with custom settings, see Configure the Pingdom LAM.
See the Pingdom documentation for details on Pingdom webhooks.
Before You Begin
Before you start to set up your Pingdom integration, ensure you have met the following requirements:
· You have an active Pingdom account with administrator privileges.
· You have the necessary permissions to create webhooks in Pingdom.
· Pingdom can make requests to external endpoints over port 443. This is the default.
Configure the Pingdom Integration
Configure the Pingdom integration in Cisco Crosswork Situation Manager as follows:
1. Navigate to the Integrations tab.
2. Click Pingdom in the Monitoring section.
3. Provide a unique integration name. You can use the default name or customize the name according to your needs.
Configure Pingdom
Log in to Pingdom to create a webhook to send event data to your system. For more help, see the Pingdom documentation.
1. Create a webhook in Pingdom.
2. Select a type, add a name and enter the URL for this system:
| Field |
Value |
| Type |
Webhook |
| Name |
Cisco Crosswork Situation Manager |
| URL |
<your Pingdom integration URL> For example: https://example.Cisco.com/events/pingdom_pingdom1 |
3. Activate the webhook and enable it in the check settings.
After you complete the configuration, Pingdom sends new events to Cisco Crosswork Situation Manager.
Configure the Pingdom LAM
The Pingdom LAM is an endpoint for webhook notifications from Pingdom events. The LAM parses the JSON events from Pingdom into Cisco Crosswork Situation Manager events.
You can install a basic Pingdom integration in the UI. See Pingdom for integration steps.
Configure the Pingdom LAM if you want to configure custom properties, set up high availability or configure advanced options that are not available in the UI integration.
Before You Begin
Before you configure the Pingdom LAM, ensure you have met the following requirements:
· You have an active Pingdom account with administrator privileges.
· You have the necessary permissions to create webhooks in Pingdom.
· Pingdom can make requests to external endpoints over port 443. This is the default.
If you are configuring a distributed deployment refer to /document/preview/77155#UUIDbea404d9dd1afee65fa1471105d1b3c6 first. You will need the details of the server configuration you are going to use for HA.High Availability Overview
Configure the LAM
Edit the configuration file to control the behavior of the Pingdom LAM. You can find the file at $MOOGSOFT_HOME/config/pingdom_lam.conf
The Pingdom LAM is a REST-based LAM as it provides an HTTP endpoint for data ingestion. Note that only the generic REST LAM properties in pingdom_lam.conf apply to integrating with Pingdom; see the LAM and Integration Reference for a full description of all properties.
Some properties in the file are commented out by default. Uncomment properties to enable them.
1. Configure the connection properties for the REST connection:
a. address: Address on the Cisco Crosswork Situation Manager server that listens for REST messages. Defaults to all interfaces.
b. port: Port on the Cisco Crosswork Situation Manager server that listens for REST messages. Defaults to 48013.
2. Configure the SSL properties if you want to encrypt communications between the LAM and the REST connection:
a. use_ssl: Whether to use SSL certification.
b. path_to_ssl_files: Path to the directory that contains the SSL certificates.
c. ssl_key_filename: The SSL server key file.
d. ssl_cert_filename: The SSL root CA file.
e. ssl_protocols: Sets the allowed SSL protocols.
3. Configure the LAM behavior:
a. num_threads: Number of worker threads to use when processing events.
b. rest_response_mode: When to send a REST response. See the LAM and Integration Reference for the options.
c. rpc_response_timeout: Number of seconds to wait for a REST response.
d. event_ack_mode: When Moogfarmd acknowledges events from the Pingdom LAM during the event processing pipeline.
e. accept_all_json: Allows the LAM to read and process all forms of JSON.
f. lists_contain_multiple_events: Whether Cisco Crosswork Situation Manager interprets a JSON list as multiple events.
4. Optionally configure the LAM identification and log file details:
a. name: Identifies events the LAM sends to the Message Bus.
b. capture_log: Name and location of the LAM's capture log file.
c. configuration_file: Name and location of the LAM's process log configuration file.
5. Optionally configure severity conversion. See /document/preview/11721#UUID8b183a1e1278a7a652d3ae86944d7379 for further information and "Conversion Rules" in /document/preview/11720#UUID5c67156b667b1a28ec648cd779393914 for details on conversions in general.Severity ReferenceData Parsing
Unsupported Properties
Pingdom alerts do not support client authentication. Do not uncomment or change the following properties:
· use_client_certificates
· client_ca_filename
· auth_token or encrypted_auth_token
· header_auth_token or encrypted_header_auth_token
· authentication_type
· authentication_cache
Example
An example Pingdom LAM configuration is as follows.
monitor:
{
name : "Pingdom Lam Monitor",
class : "CRestMonitor",
port : 48013,
address : "0.0.0.0",
use_ssl : false,
#path_to_ssl_files : "config",
#ssl_key_filename : "server.key",
#ssl_cert_filename : "server.pem",
#use_client_certificates : false,
#client_ca_filename : "ca.crt",
#auth_token : "my_secret",
#encrypted_auth_token : "dfJtTQMGiFHfiq7sCmxguBt6Jv+eytkoiKCquSB/7iWxpgGsG2aez3z2j7SuBtKj",
#header_auth_token : "my_secret",
#encrypted_header_auth_token : "dfJtTQMGiFHfiq7sCmxguBt6Jv+eytkoiKCquSB/7iWxpgGsG2aez3z2j7SuBtKj",
#ssl_protocols : [ "TLSv1.2" ],
authentication_type : "none",
authentication_cache : true,
accept_all_json : true,
lists_contain_multiple_events : true,
num_threads : 5,
rest_response_mode : "on_receipt",
rpc_response_timeout : 20,
event_ack_mode : "queued_for_processing"
},
agent:
{
name : "Pingdom",
capture_log : "$MOOGSOFT_HOME/log/data-capture/pingdom_lam.log"
},
capture_log:
{
configuration_file : "$MOOGSOFT_HOME/config/logging/pingdom_lam_log.json"
},
Configure for High Availability
Configure the Pingdom LAM for high availability if required. See /document/preview/77155#UUIDbea404d9dd1afee65fa1471105d1b3c6 for details.High Availability Overview
Configure LAMbot Processing
The Pingdom LAMbot processes and filters events before sending them to the Message Bus. You can customize or bypass this processing if required. You can also load JavaScript files into the LAMbot and execute them.
See LAMbot Configuration for more information. An example Pingdom LAM filter configuration is shown below.
filter:
{
presend: "PingdomLam-SolutionPak.js",
modules: [ "CommonUtils.js ]
}
Start and Stop the LAM
Restart the Pingdom LAM to activate any changes you make to the configuration file or LAMbot.
The LAM service name is pingdomlamd.
See /document/preview/11677#UUID1a2205c3aae40b26fdfe94490043f3c3 for the commands to start, stop and restart the LAM.Control Processes
You can use a GET request to check the status of the Pingdom LAM. See "Check the LAM Status" in Configure the REST LAM for further information and examples.
Configure Pingdom
After you have the Pingdom LAM running and listening for incoming requests, you can configure a webhook in Pingdom. See "Configure Pingdom" in Pingdom.
SolarWinds
The SolarWinds integration periodically polls one or more SolarWinds Orion systems for alerts and sends them to Cisco Crosswork Situation Manager as events.
Refer to the SolarWinds Reference to see the integration's default properties. When you use the integrations UI, you can only configure the visible properties.
If you want to implement a more complex SolarWinds LAM with custom settings, see Configure the SolarWinds LAM.
See the SolarWinds Orion documentation for details on SolarWinds components.
Before You Begin
The SolarWinds integration has been validated with SolarWinds v11.5 and 12.2. Before you start to set up your integration, ensure you have met the following requirements for each SolarWinds system:
· You have a local SolarWinds Orion user account with Administrator access.
· You have downloaded and installed Orion SDK on your SolarWinds installation.
· You have the connection details for your SolarWinds Orion platform (hostname or IP address, username and password)
· You have opened a port for SolarWinds to receive connections from Cisco Crosswork Situation Manager. You use this port to configure the Connector URL. The default is 17778.
Additionally, you can provide optional configuration details. See the SolarWinds Reference and LAM and Integration Reference for a description of all properties.
Configure the SolarWinds Integration
To configure the SolarWinds integration:
1. Navigate to the Integrations tab.
2. Click SolarWinds in the Monitoring section.
3. Provide a unique integration name. You can use the default name or customize the name according to your needs.
4. Provide connection details for your SolarWinds system.
Configure SolarWinds
You do not need to perform any integration-specific steps on your SolarWinds system.
After you configure the SolarWinds integration, it polls SolarWinds at regular intervals to collect event data (every 60 seconds by default).
Configure the SolarWinds LAM
The SolarWinds LAM allows you to retrieve alerts from SolarWinds Orion. The SolarWinds LAM is an HTTP client that polls your SolarWinds Orion server at configurable intervals. It parses the JSON responses it receives into Cisco Crosswork Situation Manager events.
You can install a basic SolarWinds integration in the UI. See SolarWinds for integration steps.
Configure the SolarWinds LAM if you want to configure custom properties, set up high availability or configure advanced options that are not available in the UI integration.
Before You Begin
Before you configure the SolarWinds LAM, ensure you have met the following requirements:
· You have a local SolarWinds Orion user account with Administrator access.
· You have downloaded and installed Orion SDK on your SolarWinds installation.
· You have the connection details for each SolarWinds Orion target for which you want to retrieve alerts:
— Hostname or IP address
— Username
— Password
· You have opened a port for SolarWinds to receive connections from Cisco Crosswork Situation Manager. The default is 17778.
If you are configuring a distributed deployment refer to /document/preview/77155#UUIDbea404d9dd1afee65fa1471105d1b3c6 first. You will need the details of the server configuration you are going to use for HA.High Availability Overview
Configure the LAM
Edit the configuration file to control the behavior of the SolarWinds LAM. You can find the file at $MOOGSOFT_HOME/config/solarwinds_logic_lam.conf.
See the SolarWinds Reference and LAM and Integration Reference for a full description of all properties. Some properties in the file are commented out by default. Uncomment properties to enable them.
1. Configure the connection properties for each SolarWinds target:
a. url: SolarWinds request URL including host and port.
b. user: SolarWinds account user.
c. password or encrypted password: SolarWinds account password or encrypted password.
d. Determine how to select and process SolarWinds events for each target:
e. enable_epoch_converter: You can use an epoch timestamp instead of a machine timestamp.
f. params_date_format: Date format to include in SolarWinds query.
g. request_query_params: SQL query to select SolarWinds events. See the SolarWinds LAM Reference for an example.
h. overlap_identity_fields: List of payload tokens the LAM uses to identify duplicate events when SolarWinds returns all open events and not just updated events.
i. requests_overlap: Period of time to delay processing duplicates.
j. results_path: Location of the JSON results objects in the data structure. Default to results.
2. Configure the LAM behavior for each target:
a. request_interval: Length of time to wait between requests, in seconds.
b. timeout: Length of time to wait before halting a connection or read attempt, in seconds.
c. num_threads: Number of worker threads to use when processing events.
3. Configure the SSL properties if you want to encrypt communications between the LAM and SolarWinds:
a. disable_certification_validation: Whether to disable SSL certificate validation.
b. path_to_ssl_files: Path to the directory that contains the SSL certificates.
c. server_cert_filename: Name of the SSL root CA file.
d. client_key_filename: Name of the SSL client key file.
e. client_cert_filename: Name of the SSL client certificate.
f. ssl_protocols: Sets the allowed SSL protocols.
g. If you want to connect to SolarWinds through a proxy server, configure the host, port, user, and password or encrypted password properties in the proxy section for the target.
4. Optionally configure the LAM identification and logging details in the agent and log_config sections of the file:
a. name: Identifies events the LAM sends to the Message Bus.
b. capture_log: Name and location of the LAM's capture log file.
c. configuration_file: Name and location of the LAM's process log configuration file.
5. Optionally configure severity conversions. See /document/preview/11721#UUID8b183a1e1278a7a652d3ae86944d7379 for further information and "Conversion Rules" in /document/preview/11720#UUID5c67156b667b1a28ec648cd779393914 for details on conversions in general.Severity ReferenceData Parsing
Example
You can configure the SolarWinds LAM to retrieve events from one or more targets. The following example demonstrates a configuration that targets two SolarWinds sources. For a single source comment out the target2 section. If you have more than two sources, add a target section for each one and uncomment properties to enable them.
Target1 in the example extracts SolarWinds events created between 1pm on 16th January 2018 and 5pm on 31st January 2018. It identifies duplicate events by comparing the payload tokens NodeID and EventID.
monitor:
{
name : "SolarWinds Monitor",
class : "CSolarWindsMonitor",
request_interval : 60,
targets:
{
target1:
{
url: "https://example.solarwinds.com:17778/SolarWinds/InformationService/v3/Json/Query",
user : "solarwinds1_user",
password : "password",
#encrypted_password : "ieytOFRUdLpZx53nijEw0rOh07VEr8w9lBxdCc7229o=",
request_interval : 60,
timeout : 120,
disable_certificate_validation : false,
path_to_ssl_files : "config",
server_cert_filename : "server.crt",
requests_overlap : 10,
enable_epoch_converter : false,
results_path : "results",
params_date_format : "yyyy-MM-dd'T'HH:mm:ss",
overlap_identity_fields : [ "NodeID", "EventID", "EventTypeName", "Message" ],
request_query_params:
{
query : "SELECT NodeName,NodeID,MachineType, Vendor,NodeDescription,IPAddress,Location,Severity,EventID,ToLocal(EventTime)
AS EventTime,NetworkNode,NetObjectID,EventTypes.Name as EventTypeName,EventTypes.Notify as EventNotify,Message,
Acknowledged,NetObjectType FROM Orion.Events
INNER JOIN Orion.Nodes ON NodeID=NetworkNode
INNER JOIN Orion.EventTypes ON Events.EventType=EventTypes.EventType
WHERE Events.EventTime>=ToLocal(\'2018-01-16T13:00:00\') AND Events.EventTime<ToLocal(\'2018-01-31T17:00:00\')
ORDER BY Events.EventTime"
}
},
target2:
{
url: "https://example2.solarwinds.com:17778/SolarWinds/InformationService/v3/Json/Query",
user : "solarwinds2_user",
password : "password",
#encrypted_password : "kduw9FLSlPvBc66plrAw9j9n89CBw7x87CdsDd2345y=!,
request_interval : 60,
timeout : 120,
disable_certificate_validation : false,
path_to_ssl_files : "config",
server_cert_filename : "server2.crt",
requests_overlap : 10,
enable_epoch_converter : false,
results_path : "results2",
params_date_format : "yyyy-MM-dd'T'HH:mm:ss",
overlap_identity_fields : [ "NodeID", "EventID", "EventTypeName", "Message" ],
request_query_params:
{
query : "SELECT NodeName,NodeID,MachineType, Vendor,NodeDescription,IPAddress,Location,Severity,EventID,ToLocal(EventTime)
AS EventTime,NetworkNode,NetObjectID,EventTypes.Name as EventTypeName,EventTypes.Notify as EventNotify,Message,
Acknowledged,NetObjectType FROM Orion.Events
INNER JOIN Orion.Nodes ON NodeID=NetworkNode
INNER JOIN Orion.EventTypes ON Events.EventType=EventTypes.EventType
WHERE Events.EventTime>=ToLocal(\'$from\') AND Events.EventTime<ToLocal(\'$to\')
ORDER BY Events.EventTime"
}
}
}
},
agent:
{
name : "SolarWinds",
#capture_log : "$MOOGSOFT_HOME/log/data-capture/solarwinds_lam.log"
},
log_config:
{
configuration_file : "$MOOGSOFT_HOME/config/logging/custom.log.json"
},
Configure for High Availability
Configure the SolarWinds LAM for high availability if required. See /document/preview/77155#UUIDbea404d9dd1afee65fa1471105d1b3c6 for details.High Availability Overview
Configure LAMbot Processing
The SolarWinds LAMbot processes and filters events before sending them to the Message Bus. You can customize or bypass this processing if required. You can also load JavaScript files into the LAMbot and execute them.
An example SolarWinds LAM filter configuration is shown below.
filter:
{
presend: "SolarWindsLam.js",
modules: [ "CommonUtils.js" ]
}
See LAMbot Configuration for more information on filtering and SolarWinds Reference for information on configurable properties in the SolarWinds LAMbot.
Map LAM Properties
SolarWinds event properties are mapped by default to the following Cisco Crosswork Situation Manager SolarWinds LAM properties. The overflow properties are mapped to "custom info" and appear under Overflow in Cisco Crosswork Situation Manager alerts. You can configure custom mappings in the SolarWinds LAMbot.
| SolarWinds Event Property |
SolarWInds LAM Event Property |
| <epoch-time-at-reception> |
$agent_time |
| Orion.Events.EventID |
$external_id |
| Orion.Events.Message |
$severity and $description |
| Orion.Events.NetObjectID |
$netObjectID* |
| Orion.Events.NetObjectType |
$class |
| Orion.Events.NetworkNode |
$networkNode* |
| Orion.EventTypes.Name |
$severity and $type |
| Orion.Nodes.IPAddress |
$agent_location |
| Orion.Nodes.Location |
$agent |
| Orion.Nodes.NodeID |
$source_id |
| Orion.Nodes.NodeName |
$source |
| SolarWinds |
$manager |
| SolarWinds Event Property |
SolarWInds LAM Overflow Property |
| Orion.Events.Acknowledged |
$acknowledged |
| Orion.Events.EventTime |
$eventTime |
| Orion.EventTypes.Notify |
$notify |
| Orion.Nodes.MachineType |
$nodeMachineType |
| Orion.Nodes.NodeDescription |
$nodeDescription |
| Orion.Nodes.Severity |
$nodeSeverity |
| Orion.Nodes.Vendor |
$nodeVendor |
Start and Stop the LAM
Restart the SolarWinds LAM to activate any changes you make to the configuration file or LAMbot.
The LAM service name is solarwindslamd.
See /document/preview/11677#UUID1a2205c3aae40b26fdfe94490043f3c3 for the commands to start, stop and restart the LAM.Control Processes
SolarWinds Reference
This is a reference for the SolarWinds LAM. and UI integration The SolarWinds LAM configuration file is located at $MOOGSOFT_HOME/config/solarwinds_lam.conf.
The following properties are unique to the SolarWinds LAM and UI integration.
See the LAM and Integration Reference for a full description of all common properties used to configure LAMs and UI intergrations.
See the SolarWinds Orion documentation for details on SolarWinds components.
url
The SolarWinds request URL including host and port.
Type: String
Required: Yes
Default: N/A
Example:
url: "https://solarwinds.example.com:17778/SolarWinds/InformationService/v3/Json/Query
user
Username of the account used to connect to SolarWinds.
Type: String
Required: Yes
Default: N/A
password
Password of the account used to connect to SolarWinds.
Type: String
Required: If you are not using password.
Default: N/A
encrypted_password
If you are using an encrypted password, enter it into this field and comment the password field. The password property overrides encrypted_password.
Type: String
Required: If you are not using encrypted_password.
Default: N/A
request_query_params
The query used to select SolarWinds data. The $from and $to properties define the time period. Specify strings in the format defined in the params_date_format property.
Type: String
Required: Yes
Default: N/A
Example:
request_query_params :
{
query :
"SELECT NodeName, NodeID, MachineType, Vendor, NodeDescription, IPAddress, Location, Severity, EventID,
ToLocal(EventTime) AS EventTime, NetworkNode, NetObjectID, EventTypes.Name AS EventTypeName,
EventTypes.Notify AS EventNotify, Message, Acknowledged, NetObjectType
FROM Orion.Events
INNER JOIN Orion.Nodes ON NodeID=NetworkNode
INNER JOIN Orion.EventTypes ON Events.EventType=EventTypes.EventType
WHERE Events.EventTime>=ToLocal(\'$from\')
AND Events.EventTime<ToLocal(\'$to\')
ORDER BY Events.EventTime"
}
params_date_format
Date format to use in the $from and $to properties in request_query_params.
Type: String
Required: Yes
Default: "yyyy-MM-dd'T'HH:mm:ss"
enable_epoch_converter
Defines whether to use an epoch timestamp instead of a machine timestamp.
Type: Boolean
Required: Yes
Default: False
results_path
Location of the JSON results objects in the data structure.
Type: String
Required: Yes
Default: "results"
Splunk
You can integrate Cisco Crosswork Situation Manager with Splunk via two products. Choose from the following:
· Splunk: Install the Splunk integration to post data to Cisco Crosswork Situation Manager when an alert occurs.
· Splunk Streaming Add-On: Once you have installed the Splunk integration, you can install the Splunk Streaming Add-On if you want to send results from the Splunk search pipeline as alerts to Cisco Crosswork Situation Manager.
Splunk
You can install the Splunk integration to post data to Cisco Crosswork Situation Manager when an alert occurs.
The Splunk integration does not support authentication options and security certificate bypass is not supported when the app is in the default SSL mode.
See the Splunk documentationfor more information.
Before You Begin
The Splunk integration has been validated with Splunk v6.5, 6.6, 7.1, 7.2 and 7.3. Before you start to set up your integration, ensure you have met the following requirements:
· You have an active Splunk account.
· Splunk can make requests to external endpoints over port 443.
Configure the Splunk Integration
To configure the Splunk integration:
— Navigate to the Integrations tab.
— Click Splunk in the Monitoring section.
— Provide a unique integration name. You can use the default name or customize the name according to your needs.
Configure the Splunk Add-On
Log in to Splunk and install the Add-on for Cisco Crosswork Situation Manager in order to send alerts from Splunk to Cisco Crosswork Situation Manager.
1. Install the add-on from Apps in the console or from Splunkbase, the Splunk marketplace.
2. If using on-premises versions of Splunk and Cisco Crosswork Situation Manager, copy the server.key and the server.pem files to <splunk_home>/etc/apps/TA-Splunk-Moogsoft/bin.
3. Configure the triggers for Splunk alerts to be forwarded to the integration as follows:
| Field |
Value |
| URL |
<url of the integration> For example: https://<localhost>/events/splunk_lam_splunk1 |
| Alert Severity |
Enter a severity. Clear, Indeterminate, Minor, Major, Critical. |
| Cisco Crosswork Situation Manager Certificate |
Enter your certificate location if using an on-premises version of Cisco Crosswork Situation Manager and Splunk. Otherwise leave empty. |
4. Save the changes.
After you complete the configuration, Splunk sends new alerts to Cisco Crosswork Situation Manager.
Configure the Splunk LAM
Splunk is used for application management, security, and compliance, as well as business and web analytics.
It captures, indexes and correlates real-time data in a searchable repository from which it can generate graphs, reports, alerts, dashboards, and visualizations.
See Splunk for UI configuration instructions.
Before You Begin
The Splunk integration has been validated with Splunk v6.5, 6.6, 7.1, 7.2 and 7.3. Before you start to set up your integration, ensure you have met the following requirements:
· You have an active Splunk account.
· Splunk can make requests to external endpoints over port 443.
Configure the LAM
Edit the configuration file to control the behavior of the Splunk LAM. You can find the file at $MOOGSOFT_HOME/config/splunk_lam.conf.
The Splunk LAM is a REST-based LAM as it provides an HTTP endpoint for data ingestion. Note that only the generic REST LAM properties in splunk_lam.conf apply to integrating with Splunk; see the LAM and Integration Reference for a full description of all properties.
Some properties in the file are commented out by default. Uncomment properties to enable them.
1. Configure the connection properties for the REST connection:
a. address: Address on the Cisco Crosswork Situation Manager server that listens for REST messages. Defaults to all interfaces.
b. port: Port on the Cisco Crosswork Situation Manager server that listens for REST messages. Defaults to 48007.
2. Configure authentication:
a. authentication_type: Type of authentication used by the LAM. Defaults to none.
b. authentication_cache: Whether to cache the username and password for the current connection when the authentication type is Basic.
c. Configure the LAM behavior:
d. accept_all_json: Allows the LAM to read and process all forms of JSON.
e. lists_contain_multiple_events: Whether Cisco Crosswork Situation Manager interprets a JSON list as multiple events.
f. num_threads:Number of worker threads to use.
g. rest_response_mode: When to send a REST response. See the LAM and Integration Reference for the options.
h. rpc_response_timeout: Number of seconds to wait for a REST response.
i. event_ack_mode: When Moogfarmd acknowledges events from the Splunk Webhook LAM during the event processing pipeline.
3. Configure the SSL properties if you want to encrypt communications between the LAM and the REST connection:
a. use_ssl: Whether to use SSL certification.
b. path_to_ssl_files: Path to the directory that contains the SSL certificates.
c. ssl_key_filename: The SSL server key file.
d. ssl_cert_filename: The SSL root CA file.
e. use_client_certificates: Whether to use SSL client certification.
f. client_ca_filename: The SSL client CA file.
g. auth_token or encrypted_auth_token: Authentication token in the request body.
h. header_auth_token or encrypted_header_auth_token: Authentication token in the request header.
i. ssl_protocols:Sets the allowed SSL protocols.
4. Optionally configure the LAM identification and logging details in the agent and log_config sections of the file:
a. name:Identifies events the LAM sends to the Message Bus.
b. capture_log: Name and location of the LAM's capture log file.
c. configuration_file: Name and location of the LAM's process log configuration file.
5. Optionally configure severity conversion. See /document/preview/11721#UUID8b183a1e1278a7a652d3ae86944d7379 for further information and "Conversion Rules" in /document/preview/11720#UUID5c67156b667b1a28ec648cd779393914 for details on conversions in general.Severity ReferenceData Parsing
Example
An example Splunk LAM configuration is as follows:
Configure for High Availability
Configure the Splunk LAM for high availability if required. See /document/preview/77155#UUIDbea404d9dd1afee65fa1471105d1b3c6 for details.High Availability Overview
Confgure LAMbot processing
The Splunk LAMbot processes and filters events before sending them to the Message Bus. You can customize or bypass this processing if required. You can also load JavaScript files into the LAMbot and execute them.
See LAMbot Configuration for more information. An example Splunk LAM filter configuration is shown below.
filter:
{
presend: "Splunk.js",
modules: [ "CommonUtils.js" ]
}
Start and Stop the LAM
Restart the Splunk LAM to activate any changes you make to the configuration file or LAMbot.
The LAM service name is splunklamd.
See /document/preview/11677#UUID1a2205c3aae40b26fdfe94490043f3c3 for the commands to start, stop and restart the LAM.Control Processes
You can use a GET request to check the status of the Splunk LAM. See "Check the LAM Status" in Configure the REST LAM for further information and examples.
Configure the Splunk Add-On
Log in to Splunk and install the Add-on for Cisco Crosswork Situation Manager in order to send alerts from Splunk to Cisco Crosswork Situation Manager.
1. Install the add-on from Apps in the console or from Splunkbase, the Splunk marketplace.
2. If using on-premises versions of Splunk and Cisco Crosswork Situation Manager, copy the server.key and the server.pem files to <splunk_home>/etc/apps/TA-Splunk-Moogsoft/bin.
3. Configure the triggers for Splunk alerts to be forwarded to the integration as follows:
| Field |
Value |
| URL |
<url of the integration> For example: https://<localhost>/events/splunk_lam_splunk1 |
| Alert Severity |
Enter a severity. Clear, Indeterminate, Minor, Major, Critical. |
| Cisco Crosswork Situation Manager Certificate |
Enter your certificate location if using an on-premises version of Cisco Crosswork Situation Manager and Splunk. Otherwise leave empty. |
4. Save the changes.
5. After you complete the configuration, Splunk sends new alerts to Cisco Crosswork Situation Manager.
Splunk Streaming Add-On
If you have installed the Splunk integration, you can configure the Streaming Add-On, which enables you to use the streammoog command to send results from the Splunk search pipeline as alerts to Cisco Crosswork Situation Manager.
See the Splunk documentationfor more information.
Before You Begin
The Streaming Add-On has been validated with Splunk v7.2 and 7.3. Before you start to set up your integration, ensure you have met the following requirements:
· You have an active Splunk account.
· You have installed the Splunk integration in Cisco Crosswork Situation Manager.
· You have the permissions required to run the streammoog command in Splunk.
· Splunk can make requests to external endpoints over port 443.
Configure the Splunk Streaming Add-On Integration
To configure the Streaming Add-On integration:
1. Navigate to the Integrations tab.
2. Click Splunk Streaming Add-On in the Monitoring section.
3. Provide a unique integration name. You can use the default name or customize the name according to your needs.
Configure the Splunk Streaming Add-On
Log in to Splunk and install the Streaming Add-On in order to allow search results to be streamed from Splunk to Cisco Crosswork Situation Manager.
1. Install the Streaming Add-On from Apps in the console or from Splunkbase, the Splunk marketplace.
Note:If using on-premises versions of Splunk and Cisco Crosswork Situation Manager, copy the server.key and the server.pem files to <splunk_home>/etc/apps/ta-moogsoft-streaming/bin/apps/TA-Splunk-Moogsoft/bin.
2. Configure the Streaming Add-On to enable search results to be streamed as follows:
| Field |
Value |
| Moogsoft Integration URL |
<url of the integration> For example: https://<localhost>/events/splunk_lam_splunk1 |
| Default Alert Severity |
Select a default severity to assign. Clear, Info, Minor, Major, Critical. |
| Moogsoft Certificate Path |
Enter your certificate location if using an on-premises version of Cisco Crosswork Situation Manager and Splunk. Otherwise leave empty. |
| Max Batch Size (KB) |
Enter the maximum batch size of result sets to send to Cisco Crosswork Situation Manager . The batch size cannot be smaller than 1024 kilobytes; there is no upper limit. |
3. Save the changes.
4. After you complete the configuration, you can use the streammoog command in the Splunk search pipeline to send search results as alerts to Cisco Crosswork Situation Manager. For more information on using the streammoog command, see the Splunk documentation.
Sumo Logic
The Sumo Logic integration allows you to retrieve alerts from Sumo Logic and send them to Cisco Crosswork Situation Manager as events.
Refer to the Sumo Logic Reference to see the integration's default properties. When you use the integrations UI, you can only configure the visible properties.
If you want to implement a more complex Sumo Logic LAM with custom settings, see Configure the Sumo Logic LAM.
See the Sumo Logic documentation for details on Sumo Logic components.
Before You Begin
The Sumo Logic integration has been validated with Sumo Logic v2018. Before you start to set up your Sumo Logic integration, ensure you have met the following requirements:
· You have an active Sumo Logic account.
· You have the necessary permissions to configure a webhook connection and metric monitor in Sumo Logic.
· Sumo Logic can make requests to external endpoints over port 443.
Configure the Sumo Logic Integration
To configure the Sumo Logic integration:
1. Navigate to the Integrations tab.
2. Click Sumo Logic in the Monitoring section.
3. Provide a unique integration name. You can use the default name or customize the name according to your needs.
4. Set a Basic Authentication username and password.
Configure Sumo Logic
Log in to Sumo Logic to configure a webhook connection to send alert data to your system. For more help, see the Sumo Logic documentation.
1. Create a new webhook connection in Sumo Logic:
| Field |
Value |
| Name |
Cisco Crosswork Situation Manager |
| Username |
Username generated in the Cisco Crosswork Situation Manager UI |
| Password |
Password generated in the Cisco Crosswork Situation Manager UI |
2. Add the following custom JSON payload:
{
"signature":"$SearchName::$AlertSource",
"agent_location":"service.us2.sumologic.com",
"source":"parse _sourceHost from AlertSource",
"class":"sumo_metric",
"description":"$SearchDescription - $AlertThreshold",
"type":"$SearchName",
"source_id":"$SearchQueryUrl",
"SearchQuery": "$SearchQuery",
"TimeRange":"$TimeRange",
"FireTime":"$FireTime",
"AlertSource": "$AlertSource",
"external_id":"$AlertID",
"severity":"$AlertStatus"
}
3. Optionally send a test notification to verify your system can receive a test alert from Sumo Logic.
4. Assign the webhook connection to one or more metric monitors in Sumo Logic. You can create a new metric monitor or add the webhook to an existing monitor.
When Sumo Logic detects alerts matching the metric monitor, it automatically notifies Cisco Crosswork Situation Manager over the webhook notification channel.
Configure the Sumo Logic LAM
The Sumo Logic LAM posts Sumo Logic alerts to Cisco Crosswork Situation Manager as events.
You can install a basic Sumo Logic integration in the UI. See Sumo Logic for integration steps.
Configure the Sumo Logic LAM if you want to configure custom properties, set up high availability or configure advanced options that are not available in the UI integration.
Before You Begin
Before you configure the Sumo Logic LAM, ensure you have met the following requirements:
· You have an active Sumo Logic account.
· You have the necessary permissions to configure a webhook connection and metric monitor in Sumo Logic.
· Sumo Logic can make requests to external endpoints over port 443.
If you are configuring a distributed deployment refer to /document/preview/77155#UUIDbea404d9dd1afee65fa1471105d1b3c6 first. You will need the details of the server configuration you are going to use for HA.High Availability Overview
Configure the LAM
Edit the configuration file to control the behavior of the Sumo Logic LAM. You can find the file at $MOOGSOFT_HOME/config/sumo_logic_lam.conf
See the Sumo Logic Reference and LAM and Integration Reference for a full description of all properties. Some properties in the file are commented out by default. Uncomment properties to enable them.
1. Configure the connection properties for Sumo Logic:
a. address: Host name or IP address of Cisco Crosswork Situation Manager.
b. port: Port on which Cisco Crosswork Situation Manager receives data from Sumo Logic.
c. Configure authentication:
d. authentication_type: Type of authentication HTTP used by the LAM. Defaults to Basic.
e. authentication_cache: Whether to cache the username and password for the current connection when the authentication type is Basic.
2. Configure the LAM behavior:
a. num_threads: Number of worker threads to use when processing events.
b. rest_response_mode: When to send a REST response. See the LAM and Integration Reference for the options.
c. rpc_response_timeout: Number of seconds to wait for a REST response.
d. event_ack_mode: When Moogfarmd acknowledges events from the Sumo Logic LAM during the event processing pipeline.
e. accept_all_json: Allows the LAM to read and process all forms of JSON.
f. lists_contain_multiple_events: Whether Cisco Crosswork Situation Manager interprets a JSON list as multiple events.
3. Configure the SSL properties if you want to encrypt communications between the LAM and Sumo Logic:
a. use_ssl: Whether to use SSL certification.
b. path_to_ssl_files: Path to the directory that contains the SSL certificates.
c. ssl_key_filename: The SSL server key file.
d. ssl_cert_filename: The SSL root CA file.
e. use_client_certificates: Whether to use SSL client certification.
f. client_ca_filename: The SSL client CA file.
g. auth_token or encrypted_auth_token: Authentication token in the request body.
h. header_auth_token or encrypted_header_auth_token: Authentication token in the request header.
i. ssl_protocols: Sets the allowed SSL protocols.
4. Optionally configure the LAM identification and logging details in the agent and log_config sections of the file:
a. name: Identifies events the LAM sends to the Message Bus. Defaults to SumoLogic.
b. capture_log: Name and location of the LAM's capture log file.
c. configuration_file: Name and location of the LAM's process log configuration file.
5. Review the severity conversion rules. Sumo Logic has only three severity levels and does not have an equivalent for the 'Clear' severity. The default severity mapping in the Sumo Logic LAM configuration file is:
"severity":
{
"MissingData" : 2,
"Warning": 3,
"Critical": 5,
moog_lookup_default: 1
}
You can modify these mappings if required. See /document/preview/11721#UUID8b183a1e1278a7a652d3ae86944d7379 for further information and "Conversion Rules" in /document/preview/11720#UUID5c67156b667b1a28ec648cd779393914 for details on conversions in general.Severity ReferenceData Parsing
Example
The following example demonstrates a Sumo Logic configuration.
monitor:
{
name : "SumoLogic Lam",
class : "CRestMonitor",
port : 48019,
address : "0.0.0.0",
use_ssl : false,
#path_to_ssl_files : "config",
#ssl_key_filename : "server.key",
#ssl_cert_filename : "server.pem",
#use_client_certificates : false,
#client_ca_filename : "ca.crt",
#auth_token : "my_secret",
#encrypted_auth_token : "dfJtTQMGiFHfiq7sCmxguBt6Jv+eytkoiKCquSB/7iWxpgGsG2aez3z2j7SuBtKj",
#header_auth_token : "my_secret",
#encrypted_header_auth_token : "dfJtTQMGiFHfiq7sCmxguBt6Jv+eytkoiKCquSB/7iWxpgGsG2aez3z2j7SuBtKj",
#ssl_protocols : [ "TLSv1.2" ],
authentication_type : "basic",
authentication_cache : true,
accept_all_json : true,
lists_contain_multiple_events : false,
num_threads : 5,
rest_response_mode : "on_receipt",
rpc_response_timeout : 20,
event_ack_mode : "queued_for_processing"
},
agent:
{
name : "SumoLogic",
capture_log : "$MOOGSOFT_HOME/log/data-capture/sumo_logic_lam.log"
},
log_config:
{
configuration_file : "$MOOGSOFT_HOME/config/logging/sumo_logic_lam_log.json"
},
Configure for High Availability
Configure the Sumo Logic LAM for high availability if required. See /document/preview/77155#UUIDbea404d9dd1afee65fa1471105d1b3c6 for details.High Availability Overview
Configure LAMbot Processing
The Sumo Logic LAMbot processes and filters events before sending them to the Message Bus. You can customize or bypass this processing if required. You can also load JavaScript files into the LAMbot and execute them.
See LAMbot Configuration for more information. An example Sumo Logic LAM filter configuration is shown below.
filter:
{
presend: "SumoLogicLam.js"
}
Start and Stop the LAM
Restart the Sumo Logic LAM to activate any changes you make to the configuration file or LAMbot.
The LAM service name is sumologiclamd.
See /document/preview/11677#UUID1a2205c3aae40b26fdfe94490043f3c3 for the commands to start, stop and restart the LAM.Control Processes
You can use a GET request to check the status of the Sumo Logic LAM. See "Check the LAM Status" in Configure the REST LAM for further information and examples.
Configure Sumo Logic
After you have the Sumo Logic LAM running and listening for incoming requests, you can configure a webhook in Sumo Logic. See "Configure Sumo Logic" in Sumo Logic.
Sumo Logic Reference
This is a reference for the Sumo Logic LAM and UI integration The Sumo Logic LAM configuration file is located at $MOOGSOFT_HOME/config/sumo_logic_lam.conf.
The following properties are unique to the Sumo Logic LAM and UI integration.
See the LAM and Integration Reference for a full description of all common properties used to configure LAMs and UI integrations.
See the Sumo Logic documentation for details on Sumo Logic components.
address
Host name or IP address of Cisco Crosswork Situation Manager.
Type: String
Required: Yes
Default: N/A
port
Port on which Cisco Crosswork Situation Manager receives data from Sumo Logic.
Type: Integer
Required: Yes
Default: 48019
Syslog LAM
Syslog provides a way for network devices to send event messages to a logging server – usually known as a Syslog server. The Syslog protocol is supported by a wide range of devices and can be used to log different types of events. For example, a router might send messages about users logging on to console sessions, while a web-server might log access-denied events. This document describes the configuration required to establish a connection between the Syslog server and the Syslog LAM.
The workflow of gathering alarms from a Syslog server and publishing it to Cisco Crosswork Situation Manager is outlined below:
1. Syslog LAM reads configuration from the syslog_lam.conf file.
2. In Socket connection, the Syslog LAM connects to the host/IP and listens on the port, given in the syslog_lam.conf file, and receives events from the server.
3. For getting events from a log file, the Syslog LAM reads data on the file located on the same system where the LAM is installed.
4. The received/read event data is in a text format.
5. The events are parsed and converted into normalized Cisco Crosswork Situation Manager events.
6. The normalized events are then published to the Message Bus.
Syslog LAM Configuration
The events received from a Syslog server are processed according to the configurations in thesyslog_lam.conf file. The processed alarms are published to Cisco Crosswork Situation Manager.
The configuration file contains a JSON object. At the first layer of the object, LAM has a parameter called config, and the object that follows config has all the necessary information to control the LAM.
Monitor
The Syslog LAM fetches the events from the Syslog Server. You can configure parameters here to establish a connection with Syslog:
General
| Field |
Type |
Description |
Example |
| name and class |
String |
Reserved fields: do not change. Default values are Syslog Monitor and CSyslogMonitor. |
|
| monitoring_type |
String |
This is the monitoring type. It can be either SOCKET or FILE. The SOCKET is used for establishing a TCP or UDP connection, while FILE is used for directly monitoring a log file. |
|
| protocol_type |
String |
Enter the protocol type here. This field has to be entered if you have selected monitoring_type as SOCKET. |
|
| address |
String |
Enter the IP address of the server here. This field has to be entered here if you have selected monitoring_type as SOCKET, and comment out this field if you have selected monitoring_type as FILE. |
|
| port |
Integer |
Enter the port of the server here. This field has to be entered here if you have selected monitoring_type as SOCKET , and comment out this field if you have selected monitoring_type as FILE. |
|
| target |
String |
Enter the log file from which you want to recieve alerts. This field has to be entered here if you have selected monitoring_type as FILE, and comment out this field if you have selected monitoring_type as SOCKET. |
|
| load_at_start |
Boolean |
If this flag is set to true, then the LAM will process the entire contents of the target file and wait for any additional data to be written to the file. This is useful if you are loading bulk-data into the system for analysis. |
|
| exit_after_initial_load |
Boolean |
If set to true, the LAM will read the content of the target and when it has processed all the data, the LAM will exit. |
|
| event_ack_mode |
String |
The event_ack_mode determines when an event received by the Syslog LAM should be acknowledged. The following options are available: queued_for_processing: Event is acknowledged after it is added to the Moolet queue. event_processed: Event is acknowledged after it is processed in a Moolet queue. Note: If you have not specified the mode in the event_ack_mode field, then by default, queued_for_processing mode will be used. |
|
Note:
For monitoring_type set to FILE, it is mandatory to set load_at_start and exit_after_initial_load fields as true.
Example
Config File
monitor:
{
name : "Syslog Monitor",
class : "CSyslogMonitor",
monitoring_type : "SOCKET",
protocol_type : "UDP",
address : "localhost",
port : 514,
target : "bow.syslog.log",
load_at_start : true,
exit_after_initial_load : false,
event_ack_mode : "queued_for_processing"
},
Agent and Process Log
The Agent and Process Log sections allow you to configure the following properties:
· name: Identifies events the LAM sends to the Message Bus.
· capture_log: Name and location of the LAM's capture log file.
· configuration_file: Name and location of the LAM's process log configuration file.
Data Parsing
Any received data needs to be broken up into tokens. When you have the tokens, you can start assembling an event. The data received from a Syslog server or a Log file can be called as message. A typical BSD Syslog message has the following groups:

· Pri: Pri is a combination of severity and facility.
· Header: Header contains a combination of Timestamp and Host.
· Message: The message contains the combination of Tag and content
Although BSD messages should contain these components, few rarely do. The PRI (severity and facility combination) is rarely used, with most messages starting with an RFC compliant timestamp. The LAM has to be configured in a way that it accommodates both BSD and near-BSD compliant messages (with and without the PRI). The implementation specific changes can be made in the regular expression used to determine a valid or invalid message.
Like BSD messages, the Syslog LAM can receive any type of Syslog message, e.g. kiwi, cisco, etc. For configuring the Syslog LAM, you should know the type of message received by the LAM and its regular expression. Some regular expressions for different types of Syslog messages are given in the parsing section of the configuration file. A new regular expression can be added to the parsing section, for this you must know the format of received message and its regular expression.
Syslog LAM supports multiple types of Syslog messages. After receiving the message, it is parsed one by one using all the regular expression present in the parsing section. If there is a match, then the parsed message is sent to the variable section. If the message does not match with any of the given regular expression, then it is parsed using the regular expression pattern_name: "default" in the parsing section. This captures the complete message and assigns it to a variable message in the variable section.
Note:
For every regular expression of a Syslog message type in parsing, there should be a corresponding section in variables.
In the Parsing section, the tokenising of the received message is done using either a regex subgroup or delimiters. The tokenised messages can then be assigned in the variables section and forwarded to the lambot SyslogLam.js. The SyslogLam.js breaks the tokenised message and then assigns it to the respective Cisco Crosswork Situation Manager fields and publishes the event to MooMS.
parsing:
[
{
pattern_name : "pattern1",
pattern : "(?mU)^((?:Jan|Feb|Mar|Apr|May|Jun|Jul|Aug|Sep|Oct|Nov|Dec)\\s+\\d{1,2}\\s(?:(?:\\d{2}:){2}\\d{2}))\\s((?:(?:[a-z0-9]+ (?:\\.|:|-|_)*){1,}))\\s(.*)$",
tokeniser_type: "delimiters",
action : "accept",
capture_group : 0,
delimiters :
{
ignoreQuotes: true,
stripQuotes : true,
ignores : "",
delimiter : ["||","\r"]
}
},
{
pattern_name : "pattern2",
pattern : "(?mU)^((?:<\\d{1,3}>)?)\\s*((?:Jan|Feb|Mar|Apr|May|Jun|Jul|Aug|Sep|Oct|Nov|Dec)\\s+\\d{1,2}\\s(?:(?:\\d{2}:){2}\\d{2}))\\s((?:(?:[a-z0-9]+(?:\\.|:|-|_)*){1,}))\\s(.*)$",
tokeniser_type: "regexp_subgroups",
action : "accept"
},
{
pattern_name : "pattern3",
pattern : "(?mU)^(?:\\[((?:Mon|Tue|Wed|Thu|Fri|Sat|Sun)\\s+(?:Jan|Feb|Mar|Apr|May|Jun|Jul|Aug|Sep|Oct|Nov|Dec)\\s+(?:\\d{1,2})\\s+(?:(?:[0-1]\\d|2[0-3]):(?:[0-5]\\d):(?:[0-5]\\d).(?:\\d{1,3}))\\s+(?:\\d{4}))\\])\\s*((?:[a-zA-Z0-9]+(?:\\.|-|_|\\[|\\]|\\(|\\))*){1,})\\:\\s+(.*)$",
tokeniser_type : "regexp_subgroups",
action : "reject"
}
],
The fields which are configured in the parsing section are as follows:
• pattern name: Enter the type of syslog message that is received by the LAM, e.g. Dell syslog.
– pattern: The regular expression which will be matched with messages received from the server. The string which matches the regular expression is extracted from the message.
Regular expressions and their explanation is as follows:
/^((?:<\d{1,3}>)?)\s*((?:Jan|Feb|Mar|Apr|May|Jun|Jul|Aug|Sep|Oct|Nov|Dec)\s+\d{1,2}\s(?:(?:\d{2}:){2}\d{2}))\s((?:(?:[a-z0-9-]+(?:\.|:)*){1,}))\s(.*)$/
| Expression |
Description |
| ^ |
The beginning of a line |
| ((?:<\d{1,3}>)?) |
Optionally followed by a “<” followed by between 1 and 3 digits followed by a “>” |
| \s* |
Followed by 0 or more spaces |
| ((?:Jan|Feb|Mar|Apr|May|Jun|Jul|Aug|Sep|Oct|Nov|Dec) |
Followed by one of Jan, Feb, Mar etc. |
| \s+ |
Followed by at least one space |
| \d{1,2} |
Followed by one or two digits |
| \s |
Followed by a single space |
| (?:(?:\d{2}:){2}\d{2})) |
Followed by 2 digits followed by a “:” followed by 2 digits followed by a “:” followed by 2 digits (hh:mm:ss) Followed by a single space |
| \s |
Followed by a single space |
| ((?:(?:[a-‐z0-‐9-‐]+(?:\.|:)*){1,})) |
Followed by something like an IP address (v4 or 6) or a host name (10.0.0.1, a:b:c:d, a.b.c.d) |
| \s |
Followed by a space |
| (.*)$ |
Followed by anything up to the end of line |
• tokeniser_type: The 2 types of tokeniser used for tokenising are as follows:
– regexp_subgroups: To tokenise based on regular expression subgroups, enter regex_subgroups in the tokeniser_type field. This tokenising method tokenises the extracted string based on groups in a message. An expression in the parenthesis in the regular expression denotes a group. For example, the expression ((?:?:Jan|Feb|Mar|Apr|May|Jun|Jul|Aug|Sep|Oct|Nov|Dec)\\s+\\d{1,2}) is a group which contains the date and time.
– tokeniser: To tokenise based on delimiters, enter delimiters in the tokeniser_type field. The extracted string is tokenised based on the delimiters present in it.
• action: This field is used for including or rejecting the matched regex text in the received event. If set to "accept", then the matched regex text in event will be sent for further processing. If set to "reject", then the matched regex text will be rejected.
• capture_group: This is the group in the message that has to be extracted and further used in the variables section. For example, if "1" is given in this field, then group 1 of the message is only picked for tokenising. This field will be used when delimiters are entered in the field tokeniser_type, and it can be commented for regexp_subgroups. You can use capture_group when only a particular group in the extracted string has to be tokenised.
Note:
If "0" is entered, then all the groups of the message will be picked for tokenising.
Note:
In the Syslog LAM, parsing is done using the regular expression. For tokenising, you can use either regexp_subgroups or delimiters.
Example of the tokenisation using regexp_subgroups
The parser searches for strings as per the expression defined in the pattern field. The extracted string is then tokenised based on the configuration done in the variable section. The regular expressions for some of the syslog formats are defined above. If you have to define regular expressions of a different format, then you can define the regular expression in the parsing section. As an example you can see below a section for the regular expression parsing of events received from a Dell server:
{
pattern_name : "pattern4",
pattern : "(?m)^\\s*((?:<\\d{1,3}>)?)\\s*((?:(?:Jan|Feb|Mar|Apr|May|Jun|Jul|Aug|Sep|Oct|Nov|Dec)\\s+\\d{1,2})\\s+(?:(?:[0-1]\\d|2[0-3]): (?:[0-5]\\d):(?:[0-5]\\d)))\\s+((?:[a-zA-Z0-9]+(?:\\.|-|_|\\[|\\]|\\(|\\))*){1,})\\s+(.*)$",
tokeniser_type : "regexp_subgroups",
action : "accept"
}
• pattern_name: This is the name of the pattern.
• pattern: This is the regular expression which will be matched with messages received from the server, e.g. "(?m)^\\s*((?:<\\d{1,3}>)?)\\s*((?:(?:Jan|Feb|Mar|Apr|May|Jun|Jul|Aug|Sep|Oct|Nov|Dec)\\s+\\d{1,2})\\s+(?:(?:[0-1]\\d|2[0-3]):(?:[0-5]\\d):(?:[0-5]\\d)))\\s+((?:[a-zA-Z0-9]+(?:\\.|-|_|\\[|\\]|\\(|\\))*){1,})\\s+(.*)$".
• tokeniser_type: The regexp_subgroupscaptures and then tokenises the message based on the regular expression given in the field pattern.
Example of the tokenisation using delimiters
Delimiters define how a line is split into tokens, also known as “tokenising”. For example, if you have a line of text data, it needs to be split up into a sequence of sub strings that are referenced by position from the start. So if you were processing a comma-separated file, where a comma separates each value, it would make sense to have the delimiter defined as a comma. Then the system would take all the text and break it up into tokens between the commas. The tokens could then be referenced by position number in the string starting from one, not zero.
For example, if the input string was “the,cat,sat,on,the,mat” and comma was used as a separator, then token 1 will be “the”, token 2 will be “cat” and so on.
There are complications when it comes to tokenisation and parsing. For example, if you say comma is the delimiter, and the token contains a comma, you will end up with that token containing a comma to be split into 2 tokens. To avoid this, it is recommended that you quote strings. You must allow the system to know whether it should strip or ignore quotes, and therefore, the stripQuotes and ignoreQuotes parameters will be used. Below is an example of parsing using delimiters for syslog messages received from a CISCO device:
{
pattern_name : "pattern2",
tokeniser_type : "delimiters",
capture_group : 1,
delimiters :
{
ignoreQuotes: true,
stripQuotes : true,
ignores : "",
delimiter : ["||","\r"]
}
}
The above example specifies:
• pattern_name: This is the name of the pattern.
• tokeniser_type: To use delimiters for parsing, enter delimiters in this field.
• capture_group: This is the group in the message that has to be extracted and further used in the variables section. For example, if "1" is given in this field, then group 1 of the Syslog message will only be picked for tokenising.
Note:
If "0" is entered in the capture_group field, then all the groups of the message will be picked for tokenising.
• ignoreQuotes:For strings that are quoted between delimiters, set ignoreQuotes to true, the LAM will look for delimiters inside the quote. For example, <delimiter>”hello “inside quote” goodbye”<delimiter> gives a token [hello inside quote goodbye].
• stripQuotes: If set to true, it will remove start and end quotes from tokens. For example, “hello world” gives a token [hello world].
• ignores:This field contains a list of characters to ignore. Ignored characters will never be included in tokens.
delimiter: This field contains the list of valid delimiters used to split strings into tokens. Here || and the end line character are the defined delimiters.
Note:
If an empty string is mentioned in the delimiter field, then no LAM tokenisation will be done, instead the entire message will be taken into a single token.
Note:
If the message does not match any regular expression given in the parsing section, then the LAM automatically sends the received message as a single line text to SyslogLam.js. The message is tokenised and sent to Cisco Crosswork Situation Manager by the SyslogLam.js.
Also if you don't know a regular expression that can be used for tokenisation, then you can leave the parsing and variables section blank. The received message by the LAM will be then sent to SyslogLam.js as a single line text.
Variables
An event in a message is a positioned collection of tokens, and Cisco Crosswork Situation Manager allows you to name these positions. Naming of the positions helps to identify the tokens. In the below given example, token at position number 3 is host name, so the token at position 3 will be assigned to "host".
variables:
{
"pattern1":
[
{ name: "pri", position: 1 },
{ name: "date", position: 2 },
{ name: "host", position: 3 },
{ name: "content", position: 4 }
],
"pattern2":
[
{ name: "date", position: 2 },
{ name: "host", position: 3 },
{ name: "content", position: 1 },
{ name: "message", position: 4 }
],
"pattern3":
[
{ name: "date", position: 1 },
{ name: "host", position: 2 },
{ name: "content", position: 3 },
{ name: "message", position: 4 }
]
},
For pattern1, position 1 is assigned to content, position 2 is assigned to date and so on. Positions start at 1, and go up.
Note:
In the variable section, the groups pri, host, content and message are required from a syslog message or the complete message, as received in the case of default parsing.
After assigning the tokenised message to variables, the message will be sent to SyslogLam.js lambot for further processing.
Mapping
The rules assignation for Syslog in the mapping section is used only for temporary values. The standard values are defined in the rules section to ensure that as complete an event object is passed to SyslogLam.js as possible. Setting temporary values has little or no impact, but helps prevent downstream errors as the event is turned into an alert.
mapping :
{
catchAll: "overflow",
rules:
[
{ name: "signature",rule: "Signature" },
{ name: "source_id",rule: "SourceId" },
{ name: "external_id",rule: "ExternalId" },
{ name: "manager",rule: "Syslog" },
{ name: "source",rule: "$host" },
{ name: "class",rule: "Syslog" },
{ name: "agent",rule: "$LamInstanceName" },
{ name: "agent_location",rule: "Location" },
{ name: "type",rule: "$application" },
{ name: "severity",rule: "0",conversion: "stringToInt" },
{ name: "description",rule: "$message" },
{ name: "agent_time",rule: "$moog_now" }
]
},
filter:
{
modules: [
"RegExpUtil.js",
"SyslogUtil.js",
"SyslogEvents.js",
"LamUtility.js"
],
presend: "SyslogLam.js"
}
}
In this section, only 2 variables are defined, the current time ($moog_now), which sets the time of the events in the Cisco Crosswork Situation Manager UI with the time of processing of the event by Moog and the agent name ($LamInstanceName) which displays the name given in the name field of the Agent section on Cisco Crosswork Situation Manager UI.
Data not mapped to Cisco Crosswork Situation Manager Fields goes into "Custom Info".
Constants and Conversions
| Field |
Description |
Example |
| Severity and sevConverter |
has a conversion defined as sevConverter in the Conversions section, this looks up the value of severity defined in the severity section of constants and returns back the mapped integer corresponding to the severity |
severity: sevConverter: { |
| stringToInt |
used in a conversion, which forces the system to turn a string token into an integer value |
stringToInt: |
| timeConverter |
used in conversion which forces the system to convert time. If epoch time is to be used, then timeFormat mentioned in timeConverter should be commented. Otherwise, the user should provide the timeFormat |
timeConverter: |
Example
Example Constants and Conversions
constants:
{
severity:
{
"CLEAR" : 0,
"INDETERMINATE" : 1,
"WARNING" : 2,
"MINOR" : 3,
"MAJOR" : 4,
"CRITICAL" : 5
}
},
conversions:
{
sevConverter:
{
lookup: "severity",
input: "STRING",
output: "INTEGER"
},
stringToInt:
{
input: "STRING",
output: "INTEGER"
},
timeConverter:
{
timeFormat: "yyyy-MM-dd'T'HH:mm:ss",
input: "STRING",
output: "INTEGER"
}
},
SyslogLam.js
The filter defines whether Cisco Crosswork Situation Manager uses a LamBot. If the presend value is commented, then no filter is applied to the events produced and all events will be sent unchanged to the MooMS bus. If a LamBot is defined, then the event is passed to the LamBot. The Syslog LAM uses the lambot syslogLam.js.
filter:
{
modules: [
"RegExpUtil.js",
"SyslogUtil.js",
"SyslogEvents.js",
"LamUtility.js"
],
presend: "SyslogLam.js"
}
In the above example, the presend is set to "SyslogLam.js" which is the Syslog lambot that extracts the values from the tokenised message and after assembling the values, publishes the events to MooMS.
The modules defined in the modules section are used by SyslogLam.js to extract values. In the above example, the following modules are defined:
· RegExpUtil.js: A module holding common regular expressions and regular expression related functions (search and replace).
· SyslogUtil.js: A syslog specific module, defining a “message” object and instance methods, and other methods used in the lambot.
· SyslogEvents.js: A library of actions to take for specific events, based on an EventId. Message actions are defined by functions – so a single function can cover many message types.
· LamUtility.js: Contains functions that are repeatedly used in a lambot (date, debug etc.).
Note:
You can edit the SyslogLam.js to process specific Syslog messages. The lambot and the modules can be found in the $MOOG_HOME/bots/lambots directory.
The workflow of syslog lambot is as follows:

· Determine Severity: Associate one of the standard Cisco severities with the event.
· Determine Context: Determines the entities about this event, such as host, interfaces, ports etc.
· Determine Eventid: Determines the event id of the event.
· Determine Signature: Create a valid Cisco Crosswork Situation Manager signature that will allow effective de-duplication for the events.
· Execute a policy: This will execute a message having an optional specific behavior associated with it (e.g. message transformation).
· Final Processing: Allow any last stage processing before the event is dispatched (filtering etc.).
Severity Reference
Cisco Crosswork Situation Manager Severity Levels
severity:
{
"CLEAR" : 0,
"INDETERMINATE" : 1,
"WARNING" : 2,
"MINOR" : 3,
"MAJOR" : 4,
"CRITICAL" : 5,
}
| Level |
Description |
| 0 |
Clear |
| 1 |
Indeterminate |
| 2 |
Warning |
| 3 |
Minor |
| 4 |
Major |
| 5 |
Critical |
Service Operation Reference
| Process Name |
Service Name |
| syslog_lam |
sysloglamd |
Start the LAM Service:
service sysloglamd start
Stop the LAM Service:
service sysloglamd stop
Check the LAM Service status:
service sysloglamd status
Command Line Reference
To see the available optional attributes of the syslog_lam, run the following command:
syslog_lam --help
The syslog_lam is a command line executable, and has the following optional attributes:
| Option |
Description |
| --config |
Points to a pathname to find the configuration file for the LAM. This is where the entire configuration for the LAM is specified. |
| --help |
Displays all the command line options. |
| --version |
Displays the component’s version number. |
| --loglevel |
Specifies the level of debugging. By default, user gets everything. In common with all executables in Cisco Crosswork Situation Manager, having it set at that level can result in a lot of output (many messages per event message processed).In all production implementations, it is recommended that log level is set to WARN. This ensures only warning, error and fatal messages are recorded. |
Test LAM
Test LAM is a specially designed LAM that produces dummy data for profiling, prototyping, building scripts, and, integration testing, all undertaken in a controllable way. The general principle behind test_lam.conf is that you can configure a number of event templates and source templates. The Test LAM will fire off, in a semi random way, an event onto the events bus according to the event template, one for each of the source definitions referenced in the event template. The semi-random aspect means that you can configure an interval between events including the degree of variance in that interval. The events will be sent off and the average period between events will form a distribution as defined in the configuration.
You can also configure event templates to be chained. For example, you can test link up/link down style functionality where you would never want the link up to arrive before the corresponding link down; therefore, you would chain a link up template to follow a link down.
Test LAM Configuration
In common with all other LAM’s, there is a configuration file, test_lam.conf with the associated Lambot, test_lam.js.
The config file contains a JSON object. All config in the Cisco Crosswork Situation Manager system is presented as a JSON object. At the first layer of the object, you have a parameter called config, and the object that follows config has all the necessary information to control the LAM.
Quoting
In some instances the attribute strings are quoted. Our JSON parser is forgiving, but the standard requires quoting for all strings, so Cisco recommends that you quote all strings.
Hash
You can comment out lines by prepending them with a hash.
Monitor object
In the monitor section, all the templates and the control for the generation of the events are defined. The first two entries are documentation values for the code:
monitor:
{
name : "Test File Monitor",
class : "CTestMonitor",
}
data_rate
data_rate is where you instruct the test LAM to generate a given quantity of output in a minute. The output is defined as the number of events per minute, and, the test LAM compresses time to adjust the period you define for each of the templates to achieve on average the rate you supply.
data_rate : 500,
The above example specifies:
• A data rate of 500 events per minute
For example, if you have one template with one source host defined, that sends an event every 20 seconds, you would have an actual rate of three a minute. If you wanted to have 30 a minute, the system would compress the period from 20 to two seconds to achieve 30 events a minute.
You can have an arbitrarily high number, but the system minimum time between one event is a millisecond, a 1000th of a second. You would not want to try and send out that many events in a single LAM (for just one template and source this would equate to 60,000 events per minute), as you would overload the relevant systems.
total_events
The default for total_events total_events is -1, but anything above 0 will cause the LAM to produce that many events and then exit. Less than 0, or, not set will cause the LAM to continue indefinitely.
total_events : -1,
The above example specifies:
• -1 tells the LAM to continue forever
For example if total_events is set to 100, the LAM will generate 100 events and then complete.
resolution
resolution controls the execution of the templates and is an internal field. resolution controls the number of the slices that a minute is split into. The test LAM attempts to distribute the generation of events evenly across a minute and uses these subdivisions of a minute to fill with individual template/source combinations. The internal execution of the LAM causes all event templates in a given time slice to be evaluated for execution.
resolution : 1,
The above example specifies:
• In all normal implementations resolution is set to 1, which causes no slicing of time and every template is checked every second
resolution is effectively the granularity of time to use in the LAM. For example, if you have 20 seconds as a period, resolution controls whether it is 20 seconds exactly (set to 1), or, plus or minus five seconds (set to 12). For example, if you divide time slices into a second, you can have periods that are resolved up to a second. If you divide time slices into 5, if you then have a period of 18, it would either execute on 15 seconds or 20 seconds.
The reason you configure this is that the wider the resolution, the less compute the LAM uses to generate events with the trade-off that the greater the error in the randomness.
resolution is significant because if you define a template for every 20 seconds and you have 10,000 hosts, what you must avoid is on the 0 second sending 10,000 events, and then, sending nothing until the next 20 seconds before sending 10,000 more. The system spreads out in time the load, so, you end up with a consistent event rate, which averages to the value set in data_rate; thus, avoiding over loading the system and returning an unrealistic event rate exhibiting high kurtosis. Therefore, resolution is used to determine how closely packed you can put exemplar’s for an event template.
sources
sources defines the imaginary sources or hosts that the events will come from. You can define these in one of two ways: you can give a simple list of source names as shown below:
sources:
{
"switches" : [ "switchA","switchB","switchC","switchD" ],
}
For every event template that uses the “switches” sources, it will generate an event for Switch A, an event for Switch B, an event for Switch C and so on. This is a time consuming way to generate a number of events from different sources.
The second way is to use an autohost, which allows for the autogeneration of a long list of similar hosts, where you define the template hostname; in the following example it is xldn%dpap . You must also define a range with a start and a count as shown below:
"autohost":
{
"template" : "xldn%dpap",
"range":
{
"start" : 12,
"count" : 10
}
}
It substitutes for the %d a number that starts at 12 and then produces 10 instances. So you would have 12, 13, 14, 15, 16 all the way up to 21 in this instance. This is a good way to generate many events from many different sources. For example, you can have a start of 1 and have a count of 10,000, which results in 10,000 events from 10,000 different sources.
sources is an object that contains entries that take a list, or, in the case of an autohost, take an object that takes a template and a range, which is an object.
events is a list of event templates, which are JSON objects. Each event template starts with a name, where you should give the name of the event template:
events:[
{
"name" : "DBRestart
}]
• This is important because the signature for the event that is generated is by default composed of “$name:$source”
So you de-duplicate alerts from a given event template by template name and source. To do this you specify which of the source definitions to combine with the template to generate the events. So sources must match a definition of sources:
#"sources" : "hosts",
"sources" : "autohost",
timing
You can either send the events with a fixed period, or, if you specify a time period, for example every 20 seconds, you can randomise the period between events.
"timing":
{
"randomised" : true,
}
With randomised set to true the exact period between events is randomised, and if the core period you specify is 20 seconds, that will be the average period over time but you will get individual events spaced with a random period i.e., 18 seconds, 21 seconds… The way it averages up to the 20 is defined in distribution. distribution defines a tuned probabilistic distribution for the periods
You can also specify the distribution of periods by specifying a distribution class, which controls the sequence of intervals between events from a given template according to a class which implements a given probability density function. In this case CUniformDist randomly selects periods up to max_period in increments of increment, but ensures that over sample_norm, chunks of max_period that each period (in this case 0 (we actually use 1 second rather than 0),10,20,30,40,50,60) occur equally likely, and the period will average to 30.143 (a period of 0 seconds is not allowable, which is why the answer is not exactly 30!).
"distribution":
{
class : "CUniformDist",
max_period : 60,
increment : 10,
sample_norm : 2
}
The above example specifies:
• class is an internal class used to achieve the distribution. A uniform distribution is a type of probability distribution where each of the possible outcomes has equal probability. In the example above you would want the average to be 30, but you want the probability of having 40 seconds versus 20 seconds to be identical. This is sometimes referred to as a flat distribution. Using this you will end up with an equal number of 10 seconds, an equal number of 20 seconds, an equal number of 30 seconds and so on over a very long period of time, which will present an average period of 30 seconds
Cisco Crosswork Situation Manager currently only supports uniform distribution, which splits max_period into increment chunks and then randomly chooses from amongst that event set with equal probability. The sample_norm is the time over which the engine guarantees that the mean is max_period/2.
In future releases Cisco will support normal distribution, and be able to define the kurtosis, the standard deviation and variance.
fields
fields defines all the various components of events that are sent on the events bus. For example in your test environment you can specify: the class, a description, an external identifier etc., as shown below:
"fields":
{
"agent_location" : "localhost",
"class" : "AppMon",
"description" : "Database instance has restarted",
"external_id" : "12345",
"manager" : "PATROL",
"severity" : 2,
"type" : "DBFail",
"entropy" : 0.8
}
Cisco Crosswork Situation Manager will fill in the first occurred, the last occurred, the agent time etc. The whole of the file is a sequence of these templates. There are different examples of timing parameters and distribution.
LinkDown
For example in the LinkDown, in timing you have an interval of 60, randomised set to true, and a variance of 20.
"name" : "LinkDown",
"sources" : "switches",
"timing" : {
"interval" : 60,
"randomised" : true,
"variance" : 20
},
The above example specifies:
• On average the period is going to be 60 seconds but the variance specifies that it can range from 40 to 80 seconds, and take a random value between these two values, which averages to 60
LinkUp
The LinkUp template has the precedent field, which references the LinkDown template, which means you can only get a Link Up once there has been a Link Down for the given defined source (switches).
"name" : "LinkUp",
"sources" : "switches",
"precedent" : "LinkDown",
"timing" : {
"interval" : 60,
"randomised" : true,
"variance" : 20
},
The above example specifies:
• On average the period is going to be 60 seconds after the Link Down, with a variant ranging from 40 to 80 seconds.
Web Server Down Trap
In the Web Server Trap Down, you only have two fields: randomised and variance.
"name" : "Web Server Down Trap",
"sources" : "hosts",
"timing" : {
"randomised" : true,
"variance" : 180
},
• With randomised set to true and variance set to 180 you will get a period between occurrences that is a random number between one and 180 seconds. On average you will get an event every 90 seconds
Agent and Process Log
The Agent and Process Log sections of the Test LAM configuration file enable you to define the following properties:
· name: Identifies events the LAM sends to the Message Bus.
· capture_log: Name and location of the LAM's capture log file.
· configuration_file: Name and location of the LAM's process log configuration file.
Filter
The filter defines whether Moog uses a LamBot. If you comment out the presend value, no filter is applied to the events produced and all events are sent unchanged to the MooMs bus. If a LamBot is defined, for every event the system assembles using this configuration, the event is passed to the LamBot (via the presend function defined in the LamBot).
filter:
{
presend: "TestLam.js"
}
Therefore you must define a presend function in your JavaScript file.
The return value of the presend function will determine whether the event is sent on to the MooMs bus. The presend function can also define sub-streams that events are sent out on, so events can be sent to different farmd’s.
You can provide an additional parameter to presend called modules that takes a JSON list. The JSON list is a list of optional JavaScript files that are loaded into the context of the LamBot and executed; thus, you can share modules between LAMs. For example, you can write a generic Syslog processing module that is used in both the Socket LAM and the log file LAM. You therefore do not need to needlessly replicate code in the Moobot for each of the LAMs.
VMware
You can use the Integrations UI to integrate Cisco Crosswork Situation Manager with VMware products using the following integrations. Choose your integration according to your Cisco Crosswork Situation Manager and VMware environments:
· VMware vCenter: Use this integration to enable Cisco Crosswork Situation Manager to collect event data from VMware vCenter.
· VMware vRealize Log Insight: Use this integration to enable Cisco Crosswork Situation Manager to collect event data from VMware vRealize Log Insight.
· VMware vROps: Use this integration to send events from VMware vRealize Operations Manager to Cisco Crosswork Situation Manager.
· VMware vSphere: Use this integration to enable Cisco Crosswork Situation Manager to collect event data from VMware vSphere.
VMware vCenter
You can install the VMware vCenter integration to enable Cisco Crosswork Situation Manager to collect event data from one or more vCenter systems.
See the vCenter documentation for details on vCenter components.
Before You Begin
The VMware vCenter integration has been validated with vCenter v6.0 and 6.5. Before you start to set up your integration, ensure you have met the following requirements for each vCenter system:
· You have the hostname or the IP address of the vCenter instance.
· You have credentials to connect to vCenter.
Configure the vCenter Integration
To configure the vCenter integration:
1. Navigate to the Integrations tab.
2. Click VMware vCenter in the Monitoring section.
3. Provide a unique integration name. You can use the default name or customize the name according to your needs.
4. Provide connection details for your vCenter system.
Configure vCenter
You do not need to perform any integration-specific steps on your vCenter systems. After you configure the integration, it polls vCenter at regular intervals to collect event data (every 60 seconds by default).
If the integration fails to connect to one or more sources, Cisco Crosswork Situation Manager creates an alert and writes the details to the process log. Refer to the logging details for LAMs and integrations for more information.Configure Logging
VMware vRealize Log Insight
You can install the vRealize Log Insight integration to enable Cisco Crosswork Situation Manager to collect event data from one or more VMware vRealize Log Insight systems.
See the vRealize Log Insight documentation for details on vRealize Log Insight components.
Before You Begin
The vRealize Log Insight integration has been validated with vRealize Log Insight v4.3. Before you start to set up your integration, ensure you have met the following requirements for each vRealise Log Insight system:
· You have the hostname or the IP address of the vRealize Log Insight server.
· You have credentials to connect to the vRealize Log Insight server.
· The port for your vRealize Log Insight server is open and accessible from Cisco Crosswork Situation Manager.
Configure the vRealize Integration
To configure the vRealize integration:
1. Navigate to the Integrations tab.
2. Click vRealize Log Insight in the Monitoring section.
3. Provide a unique integration name. You can use the default name or customize the name according to your needs.
4. Provide connection details for your vRealize Log Insight system.
Configure vRealize Log Insight
You do not need to perform any integration-specific steps on your vRealize Log Insight systems. After you configure the integration, it polls vRealize Log Insight at regular intervals to collect event data (every 60 seconds by default).
If the integration fails to connect to one or more sources, Cisco Crosswork Situation Manager creates an alert and writes the details to the process log. Refer to the logging details for LAMs and integrations for more information.Configure Logging
Configure the vRealize Log Insight LAM
vRealize Log lnsight delivers heterogeneous and highly scalable log management. It provides deep operational visibility and faster troubleshooting across physical, virtual and cloud environments. The vRealize Log Insight LAM connects with the vRealize Log Insight server and fetches events from it. The LAM after fetching the events, forwards it to Cisco Crosswork Situation Manager.
See VMware vRealize Log Insight for UI configuration instructions.

1. LAM reads the configuration from the vrealize_loginsight_lam.conf file.
2. LAM will connect with the vRealize Log Insight Server using the given host name or IP Address.
3. The response is received with event data in JSON format.
4. The events are parsed and converted into normalized Cisco Crosswork Situation Manager events.
5. The normalized events are then published to MooMS bus.
vRealize Log Insight LAM Configuration
The events received from vRealize Log Insight are processed according to the configurations in thevrealize_loginsight_lam.conffile. The processed alarms are published to Cisco Crosswork Situation Manager.
The configuration file contains a JSON object. At the first layer of the object, LAM has a parameter called config, and the object that follows config has all the necessary information to control the LAM.
Monitor
The vRealize Log Insight LAM takes the connection information from the Monitor section of the config file. You can configure the parameters here to establish a connection with vRealize Log Insight Client.
General
| Field |
Type |
Description |
| name and class |
String |
Reserved fields: do not change. Default values are LogInsight Lam Monitorand CVrealizeLogInsightMonitor. |
| target |
JSON Object |
A top-level container for which you can define one or more target vRealize sources. You can specify the configuration for each target. If you don't specify a request_interval the target uses the globally defined interval. |
| host_name |
Integer |
The host name or IP address of the vRealize Log Insight server. Default address is localhost. |
| user_name and password |
String |
Enter the username and password for vRealize Log Insight console login. |
| encrypted_password |
String |
If the password is encrypted, then enter the encrypted password in this field and comment out the password field. At a time, either password or the encrypted_password field is used. If both the fields are not commented, then the field encrypted_password will be used by the vRealize Log Insight LAM. |
| server_cert_filename |
String |
Enter the server certificate name here. Use the certificate "server.crt" here. The cert file should be present in the directory given in path_to_ssl_filesfield. |
| use_client_authentication |
Boolean |
If you want client authentication, set it to true, else you can set it to false. By default, it is set to false. If it is set to true, then the values will be entered in the client_key_filename and the client_cert_filename fields. |
| client_key_filename |
String |
Enter the name of the key file here. The key file should be present in the directory given in path_to_ssl_filesfield. For example: "client.key" |
| client_cert_filename |
String |
Enter the name of the certificate file here. The cert file should be present in the directory given in path_to_ssl_filesfield. For example: "client.crt" |
| polling_interval |
Integer |
The polling time interval, in seconds, between the requests after which the event data is fetched from vRealize Log Insight LAM. Default = 10 seconds. If 0 is entered, the time interval will set to 10 seconds. |
| max_retries |
Integer |
The maximum number of retry attempts to reconnect with vRealize Log Insight Server in case of a connection failure. Default = -1, if no value is specified, then there will be infinite retry attempts. If the specified value is greater than 0, then the LAM will try that many times to reconnect; in case of 0 or any other value less than 0, max retries will set to default. |
| retry_interval |
Integer |
The time interval between two successive retry attempts. Default = 60 seconds, if 0 is entered, the time interval will set to default. |
| request_interval |
Integer |
Length of time to wait between requests, in seconds. Can be overridden by request_interval in individual targets. Defaults to 60. |
| retry_recovery |
Object |
Specifies the behavior of the LAM when it re-establishes a connection after a failure. - recovery_interval: Length of time to wait between recovery requests in seconds. Must be less than the request_interval set for each target. Defaults to 20. - max_lookback: The period of time for which to recover missed events in seconds. Defaults to -1 (recover all events since the last successful poll). |
| timeout |
Integer |
This is the timeout value in seconds, which will be used to timeout a connection, socket and request. If no value is specified, then the time interval will set to to 120 seconds. Default: 120 seconds, if no value is specified, then timeout will set to default. |
Filter
| Field |
Type |
Description |
|||||||||||||||||||||
| filter |
Object |
The following filters can be used to fetch events form the vRealize Log Insight LAM: hostnames: Enter the hostname of the machine, this filter criteria will fetch events containing the listed hostnames e.g.: hostnames : ["localhost","dellserver","moogsoftserver"] Sources: Enter the source of the machine, this filter criteria will fetch events containing the listed sources e.g.: Note sources : ["10.24.56.78", "10.54.87.35"] Note If you are using all the filter, then events having all the values listed in all the filters will be fetched. Note The hostname and sources are joined using the "AND" condition while the fields within the filters are joined using the "OR" condition. If you have mentioned the following filter, hostnames : ["localhost","dellserver","moogsoftserver"], then all the events having the hostname "localhost" or "dellserver" or "moogsoftserver will be fetched. Same is the case with filter sources, if you have applied the filter sources : ["10.24.56.78", "10.54.87.35"], then all the events having the source "10.24.56.78" or "10.54.87.35" will be fetched. In case where you have applied both the filters i.e. hostnames and sources, then those events which have both the hostname and the source as given in the filters will be fetched. For example, if you have applied the filters hostnames : ["localhost","dellserver","moogsoftserver"] AND sources : ["10.24.56.78", "10.54.87.35"], then the events which have both the hostname and source from any of the entered filtered values will be fetched. The event coming from the dellserver source 10.24.56.78 will be fetched, but from any other source say 10.24.58.96 will not be fetched. The following table provides the hostname and their respective sources information, and the whether the events will be fetched or not for the filter hostnames : ["localhost","dellserver","moogsoftserver"] andsources : ["10.24.56.78", "10.54.87.35"] :
|
Secure Sockets Layer
| Field |
Type |
Description |
| use_ssl |
Boolean |
Set to true, to enable SSL Communication: path_to_ssl_files: Enter the path of the directory where all the certificates are stored. If the path begins with ‘.’ or ‘/’ then, the path will be used as specified. Otherwise, MOOGSOFT_HOME is prepended to the path. For example, if MOOGSOFT_HOME is /opt/moogsoft/ and path_to_ssl is set to config, then the location will be defined as /opt/moogsoft/config. ssl_protocols: Only applicable if use_ssl = true. This configuration dictates which SSL protocols are enforced by the vRealize Log Insight LAM; the following protocols are allowed to be specified: SSLv3 TLSv1 TLSv1.1 TLSv1.2 If SSL is in use and no value is specified for this configuration then only TLSv1.2 is allowed by default. |
Example
You can configure the vRealize LAM to retrieve events from one or more sources. The following example demonstrates a configuration that targets two vRealize sources. For a single source comment out the target2 section. If you have more than two sources, add a target section for each one and uncomment properties to enable them.
monitor:
{
name : "LogInsight Lam Monitor",
class : "CVrealizeLogInsightMonitor",
request_interval : 60,
max_retries : -1,
retry_interval : 60,
targets:
{
target1:
{
url : "https://examplevrealize1",
user_name : "vrealize_user1",
#password : "password",
encrypted_password : "qJAFVXpNDTk6ANq65pEfVGNCu2vFdcoj70AF5BIebEc=",
disable_certificate_validation : false,
path_to_ssl_files : "config",
server_cert_filename : "server1.crt",
client_key_filename : "client1.key",
client_cert_filename : "client1.crt",
request_interval : 60,
timeout : 120,
max_retries : -1,
retry_interval : 60,
filter :
{
hostnames: [],
sources: [],
}
target2:
{
url : "https://examplevrealize2",
user_name : "vrealize_user2",
#password : "password",
encrypted_password : "bDGFSClSHBn8DSw43nGwSPLSv2dGwdsj50WD4BHdfVa&",
disable_certificate_validation : false,
path_to_ssl_files : "config",
server_cert_filename : "server2.crt",
client_key_filename : "client2.key",
client_cert_filename : "client2.crt",
request_interval : 60,
timeout : 120,
max_retries : -1,
retry_interval : 60,
filter :
{
hostnames: [],
sources: [],
}
}
}
}
Agent and Process Log
Agent and Process Log allow you to define the following properties:
· name: Identifies events the LAM sends to the Message Bus.
· capture_log: Name and location of the LAM's capture log file.
· configuration_file: Name and location of the LAM's process log configuration file.
Mapping
For events received in JSON format, you can directly map the event fields of vRealize Log Insight LAM with Cisco fields. The parameters of the received events are displayed in Cisco Crosswork Situation Manager according to the mapping done here:
mapping :
{
catchAll: "overflow",
rules:
[
{ name: "signature", rule: "$hostname::$event_type" },
{ name: "source_id", rule: "$source" },
{ name: "external_id", rule: "$appname" },
{ name: "manager", rule: "vRealize Log Insight" },
{ name: "source", rule: "$hostname" },
{ name: "class", rule: "$event_type" },
{ name: "agent", rule: "$LamInstanceName" },
{ name: "agent_location", rule: "$LamInstanceName" },
{ name: "type", rule: "$event_type" },
{ name: "severity", rule: "0",conversion: "stringToInt" },
{ name: "description", rule: "$description" },
{ name: "agent_time", rule: "$time_changed"}
]
},
filter:
{
modules: [
"SeverityUtil.js",
"LamUtility.js"
],
presend:"VrealizeLogInsightLam.js"
}
The above example specifies the mapping of the vRealize Log Insight event fields with the Cisco Crosswork Situation Manager fields. Data not mapped to Cisco Crosswork Situation Manager Fields goes into "Custom Info".
Note:
The signature field is used by the LAM to identify correlated events.
Constants and Conversions
Constants and Conversions allows you to convert format of the received data.
| Field |
Description |
Example |
| Severity and sevConverter |
has a conversion defined as sevConverter in the Conversions section, this looks up the value of severity defined in the severity section of constants and returns back the mapped integer corresponding to the severity. |
severity: "Clear" : 0, "Info" : 1, "Warning" : 2, "Minor" : 3, "Major" : 4 "Critical" : 5 }, sevConverter: { lookup: "severity", input : "STRING", output: "INTEGER" }, |
| stringToInt |
used in a conversion, which forces the system to turn a string token into an integer value |
stringToInt: |
| timeConverter |
Used in conversion which forces the system to convert time. If epoc time is to be used, then timeFormat mentioned in timeConverter should be commented. Otherwise, the user should provide the timeFormat. |
timeConverter: |
Example
Example Constants and Conversions
constants:
{
severity:
{
"clear" : 0,
"info" : 1,
"warning" : 2,
"minor" : 3,
"major" : 4,
"critical" : 5
}
},
conversions:
{
sevConverter:
{
lookup: "severity",
input: "STRING",
output: "INTEGER"
},
stringToInt:
{
input: "STRING",
output: "INTEGER"
},
timeConverter:
{
timeFormat: "yyyy-MM-dd'T'HH:mm:ss.SSS",
input: "STRING",
output: "INTEGER"
}
},
Severity Reference
Cisco Crosswork Situation Manager Severity Levels
severity:
{
"clear" : 0,
"info" : 1,
"warning" : 2,
"minor" : 3,
"major" : 4,
"critical" : 5
}
| Level |
Description |
| 0 |
Clear |
| 1 |
Info |
| 2 |
Warning |
| 3 |
Minor |
| 4 |
Major |
| 5 |
Critical |
Service Operation Reference
| Process Name |
Service Name |
| vrealizeloginsight_lam |
vrealizeloginsightlamd |
Start the LAM Service:
service vrealizeloginsightlamd start
Stop the LAM Service:
service vrealizeloginsightlamd stop
Check the LAM Service status:
service vrealizeloginsightlamd status
If the LAM fails to connect to one or more vRealize Log Insight sources, Cisco Crosswork Situation Manager creates an alert and writes the details to the process log. Refer to the logging details for LAMs and integrations for more information.
Command Line Reference
To see the available optional attributes of the vrealizeloginsight_lam, run the following command:
vrealizeloginsight_lam --help
The vrealizeloginsight_lam is a command line executable, and has the following optional attributes:
| Option |
Description |
| --config |
Points to a pathname to find the configuration file for the LAM. This is where the entire configuration for the LAM is specified. |
| --help |
Displays all the command line options. |
| --version |
Displays the component’s version number. |
| --loglevel |
Specifies the level of debugging. By default, user gets everything. In common with all executables in Cisco Crosswork Situation Manager, having it set at that level can result in a lot of output (many messages per event message processed).In all production implementations, it is recommended that log level is set to WARN. This ensures only warning, error and fatal messages are recorded. |
VMware vROps
You can install a VMware vRealize Operations Manager (vROps) integration to send events from vROps to Cisco Crosswork Situation Manager. The integration allows you to send JSON payloads using POST and PUT requests over HTTPS.
See the vROps documentation for details on vROps components.
Before You Begin
The vROps integration has been validated with vROps v6.6. Before you start to set up your integration, ensure you have met the following requirements:
· Your vROps instance can make requests to external endpoints over port 443.
· You have administrator access to vROps.
· You have generated a certificate thumbprint for your Cisco Crosswork Situation Manager instance.
Configure the vROps Integration
To configure the vROps integration:
1. Navigate to the Integrations tab.
2. Click VMware vROps in the Monitoring section.
3. Provide a unique integration name. You can use the default name or customize the name according to your needs.
4. Set a Basic Authentication username and password.
Configure vROps
Log in to vROps to create a Cisco Crosswork Situation Manager to vROps webhook endpoint. For more help, see the vROps documentation.
1. Go to Outbound Settings in vROps administration and add a new outbound instance.
2. Create a REST notification plugin for Cisco Crosswork Situation Manager as follows:
| Field |
Value |
| Plugin Type |
Rest Notification Plugin. |
| Instance Name |
The name of your Cisco Crosswork Situation Manager instance. |
| URL |
<your VMware vROps integration URL> For example: https://<hostname>/vrops |
| User Name |
Username generated in the Cisco Crosswork Situation Manager UI. |
| Password |
Password generated in the Cisco Crosswork Situation Manager UI. |
| Content type |
application/json |
| Certificate thumbprint |
The certificate thumbprint for your Cisco Crosswork Situation Manager instance. |
| Connection count |
20 |
If you click 'Test' to test the connection, ignore the unsuccessful connection warning. The configuration is correct.
3. Go to Notification Settings under Alerts and add a rule for your integration alerts as follows:
| Field |
Value |
| Name |
Name of your rule. |
| Method: Plugin-Type |
Rest Notification Plugin. |
| Method: Instance |
Name of your Cisco Crosswork Situation Manager instance. |
| Criticality |
Select the severities you want to include in the integration. We recommend that you select all severities. |
You can add other filtering criteria if desired. After you complete the configuration Cisco Crosswork Situation Manager receives alerts from vROps that meet the filtering criteria.
VMware vSphere
You can install the VMware vSphere integration to enable Cisco Crosswork Situation Manager to collect event data from one or more vSphere systems.
See the vSphere documentation for details on vSphere components.
Before You Begin
The VMware vSphere integration has been validated with vSphere v6.0 and 6.5. Before you start to set up your integration, ensure you have met the following requirements for each vSphere system:
· You have the hostname or the IP address of the VMware vSphere instance.
· You have credentials to connect to the VMware vSphere account.
· The port for your VMware vSphere server is open and accessible from Cisco Crosswork Situation Manager.
Configure the vSphere Integration
To configure the vSphere integration:
1. Navigate to the Integrations tab.
2. Click VMware vSphere in the Monitoring section.
3. Provide a unique integration name. You can use the default name or customize the name according to your needs.
4. Provide connection details for your vSphere system.
Configure vSphere
You do not need to perform any integration-specific steps on your vSphere servers. After you configure the integration, it polls vSphere at regular intervals for event data (every 60 seconds by default).
If the integration fails to connect to one or more sources, Cisco Crosswork Situation Manager creates an alert and writes the details to the process log. Refer to the logging details for LAMs and integrations for more information.Configure Logging
Configure the vSphere LAM
VMware vSphere is a VMware's cloud computing virtualization platform. It is a package containing many components. The 2 main components are:
· VMware vCenter Server: It is the central control point for data center services such as access control, performance monitoring and alarm management
· VMware vSphere Client: It allows users to remotely connect to ESXi or vCenter Server
The LAM connects with the vCenter server and fetches events from it. The events generated in it are the actions performed on virtual machines present in it, or their status updates. The LAM after fetching the events, forwards it to Cisco Crosswork Situation Manager.
See VMware vSphere for UI configuration instructions.
Process Overview

1. LAM reads the configuration from the vsphere_lam.conf file.
2. LAM will connect with the vSphere Server using the given host name or IP Address.
3. The response is received with event data in json format.
4. The events are parsed and converted into normalized Cisco Crosswork Situation Manager events.
5. The normalized events are then published to MooMS bus.
vSphere LAM Configuration
The alarms received from vSphere are processed according to the configurations in the vsphere_lam.conf file. The processed alarms are published to Cisco Crosswork Situation Manager.
The configuration file contains a JSON object. At the first layer of the object, the LAM has a parameter called config, and the object that follows config has all the necessary information to control the LAM.
The following sections are available for configuration in the vSphere LAM configuration file.
Monitor
You can configure the vSphere LAM to retrieve events from one or more sources. The following example demonstrates a configuration that targets two vSphere sources. For a single source comment out the target2 section. If you have more than two sources, add a target section for each one and uncomment properties to enable them.
monitor:
{
name : "VSphere Lam Monitor",
class : "CVSphereMonitor",
request_interval : 60,
max_retries : -1,
retry_interval : 60,
targets:
{
target1:
{
host_name : "http://examplevsphere1",
user_name : "vsphere_user1",
#password : "password",
encrypted_password : "qJAFVXpNDTk6ANq65pEfVGNCu2vFdcoj70AF5BIebEc=",
disable_certificate_validation : false,
path_to_ssl_files : "config",
server_cert_filename : "server1.crt",
client_key_filename : "client1.key",
client_cert_filename : "client1.crt",
request_interval : 60,
max_retries : -1,
retry_interval : 60,
}
target2:
{
host_name : "http://examplevsphere2",
user_name : "vsphere_user2",
#password : "password",
encrypted_password : "bDGFSClSHBn8DSw43nGwSPLSv2dGwdsj50WD4BHdfVa&",
disable_certificate_validation : false,
path_to_ssl_files : "config",
server_cert_filename : "server2.crt",
client_key_filename : "client2.key",
client_cert_filename : "client2.crt",
request_interval : 60,
max_retries : -1,
retry_interval : 60,
}
}
• name and class: These fields are reserved and should not be changed. The default values are VSphere Lam Monitor and CVsphereMonitor respectively
• target: A top-level JSON container for which you can define one or more target vSphere sources. You can specify the configuration for each target. If you don't specify a request_interval the target uses the globally defined interval.
• host_name: Enter the hostname or the IP address of the vCenter server. E.g. localhost
• user_name and Password: Enter the username and password of the vCenter console
• encrypted_password: If the encrypted password is to be used then enter the encrypted password in this field and comment the password field. At a time either password or the encrypted_password field is used. If both the fields are not commented then the field encrypted_password will be used by the vSphere LAM
• vm_names: Enter the name of the Virtual Machine that you want to monitor in double quotes. You can enter multiple virtual machine names in double quotes separated by a comma. E.g ["vmname1", "vmname2"]. If nothing is mentioned here, then the LAM fetches the events from all the virtual machines
• use_ssl: Enter true here, to enable SSL Communication. By default, it is set to false
• path_to_ssl_files: Enter the path of the directory where all the certificates are stored, e.g. "/usr/local/vsphere_ssl"
• server_cert_filename: Enter the server certificate name here. Use the certificate "rui.crt" here. The crt file should be present in the directory given in path_to_ssl_files field
• use_client_authentication: Enter true here if you want client authentication, otherwise set it to false. By default, it is set to false. If it is set to true, then the values are to be entered in the client_key_filename and the client_cert_filename fields.
• client_key_filename: Enter the name of the key file here, e.g. "rui.key". The key file should be present in the directory given in path_to_ssl_files field.
• client_cert_filename: Enter the name of the certificate file here, e.g. "rui.crt". The cert file should be present in the directory given in path_to_ssl_files field.
• proxy: If you want to connect to vSphere through a proxy server, configure the host, port, user, and password or encrypted password properties in the proxy section for the target.
• request_interval: Length of time to wait between requests, in seconds. Can be overridden by request_interval in individual targets. Defaults to 60.
• recovery_interval: Length of time to wait between requests, in seconds, when the LAM re-establishes a connection after a failure.
• max_lookback: Period of time for which to recover missed events, in seconds, when the LAM re-establishes a connection after a failure.
• polling_interval: The polling time interval between the requests after which the event data is fetched from vSphere. The polling interval is entered in seconds
Note:
The default value is set to 10 seconds, if 0 is entered in this field then the time interval is by default set to 10 seconds
• max_retries: The maximum number of retry attempts to reconnect with the vSphere server in case of a connection failure
Note:
The default value is set to 10, if 0 is entered in this field then the LAM by default takes the value 10 and will try at least 10 times to reconnect
Note:
If all the number of retries are exhausted, then an alarm is sent to Cisco Crosswork Situation Manager about the connection failure. For re-establishing the connection the LAM has to be restarted
• retry_interval: The time interval between two successive retry attempts
Note:
The default value is set to 60 seconds, if 0 is entered in this field then the time interval is by default set to 60 seconds
Note:
The entry in the fields polling_interval, max_retries, retry_interval and max_events should be an integer, therefore enter the values in these fields without quotation marks
Note:
The LAM starts fetching the events from the current time. After that it saves the last poll time (in epoch format) in a state file. The state file is generated in the same folder where the config file is present e.g. $MOOGSOFT_HOME/config. The LAM generates the name of the state file as <proc_name>.state. Here the default proc_name (process name) is vsphere_lam, therefore, the state file name is vsphere_lam.state. proc_name is defined in the vsphere_lam.sh file located at $MOOGSOFT_HOME/bin.
It is recommended not to make any changes to the state file as this may lead to loss of events.
Agent and Process Log
Agent and Process Log allow you to define the following properties:
· name: Identifies events the LAM sends to the Message Bus.
· capture_log: Name and location of the LAM's capture log file.
· configuration_file: Name and location of the LAM's process log configuration file.
Mapping
For events received in JSON format, a user can directly map the alarm/event fields of vSphere with Cisco Crosswork Situation Manager fields. In the case of an event received in text format, the event is first tokenised in the Variable section, and the tokenised event is then mapped here in the mapping section. The parameters of the received alarm/event are displayed in Cisco Crosswork Situation Manager according to the mapping done here.
mapping :
{
catchAll: "overflow",
rules:
[
{ name: "signature", rule: "$ipAddress::$vm::$host::$eventType" },
{ name: "source_id", rule: "$ipAddress" },
{ name: "external_id", rule: "$chainId" },
{ name: "manager", rule: "VMWare vSphere" },
{ name: "source", rule: "$host" },
{ name: "class", rule: "$eventType" },
{ name: "agent", rule: "$LamInstanceName" },
{ name: "agent_location", rule: "$LamInstanceName" },
{ name: "type", rule: "$eventType" },
{ name: "severity", rule: "$severity",conversion:"sevConverter"},
{ name: "description", rule: "$fullFormattedMessage" },
{ name: "agent_time", rule: "$createdTime"}
]
},
filter:
{
presend:"VSphereLam.js"
}
The above example specifies the mapping of the vSphere alarm fields with the Cisco Crosswork Situation Manager fields. Data not mapped to Cisco Crosswork Situation Manager Fields goes into "Custom Info".
Note:
The signature field is used by the LAM to identify correlated alarms
The following table provides the alarm fields code and their respective names which can be used in the mapping section shown above:
An example of vSphere events:
Constants and Conversions
Constants and Conversions allow the user to convert formats of the received data defined users.
constants:
{
severity:
{
"info" : 1,
"Information" : 1,
"warning" : 2,
"Warning" : 2,
"error" : 5
}
},
conversions:
{
sevConverter:
{
lookup: "severity",
input: "STRING",
output: "INTEGER"
},
stringToInt:
{
input: "STRING",
output: "INTEGER"
},
timeConverter:
{
timeFormat: "yyyy-MM-dd'T'HH:mm:ss.SSS'Z'",
input: "STRING",
output: "INTEGER"
}
},
The above example specifies:
· Severity and sevConverter: The severity field has a conversion defined as sevConverter in the Conversions section, this looks up the value of severity defined in the severity section of constants and returns back the mapped integer corresponding to the severity
· stringToInt: It is used in a conversion, which forces the system to turn a string token into an integer value
· timeConverter: It is used in conversion which forces the system to convert time. If epoc time is to be used, then timeFormat mentioned in timeConverter should be commented. Otherwise, the user should provide the timeFormat
catchALL
The attribute that is never referenced in a rule is collected and placed as a JSON object in a variable called overflow defined here and passed as part of the event.
mapping :
{
catchAll: "overflow",
rules:
[
{ name: "signature", rule: "$ipAddress::$vm::$host::$eventType" },
{ name: "source_id", rule: "$ipAddress" },
{ name: "external_id", rule: "$chainId" },
{ name: "manager", rule: "VMWare vSphere" },
{ name: "source", rule: "$host" },
{ name: "class", rule: "$eventType" },
{ name: "agent", rule: "$LamInstanceName" },
{ name: "agent_location", rule: "$LamInstanceName" },
{ name: "type", rule: "$eventType" },
{ name: "severity", rule: "$severity",conversion:"sevConverter"},
{ name: "description", rule: "$fullFormattedMessage" },
{ name: "agent_time", rule: "$createdTime"}
]
},
The vSphere event field callCount is sent to vSphere LAM. Since itis not mapped to a field in the vsphere_lam.conf file it is placed in the overflow JSON object. The fields that are placed in the overflow variable can be viewed in the vSphere LAM log file or the custom info field of the event in Cisco Crosswork Situation Manager GUI.
An example of an overflow JSON object created in the vSphere LAM log file:
"custom_info":"{\"overflow\":{\"callCount\":0,\"userAgent\":\"JAX-WS RI 2.2.9-b130926.1035 svn-revision#5f6196f2b90e9460065a4c2f4e30e065b245e51e\",\"sessionId\":\"5245abf2-1114-bfba-5087-3d326c8ab249\",\"loginTime\":1495695078882}}"
Quotes
Quotes
In some instances, the attribute strings are quoted. Our JSON parser ignores it, but the standard requires quoting for all strings, so Cisco recommends that user quote all strings.
Comments
A user can comment out lines by appending them with a hash.
Starting the vSphere LAM
To start the vSphere LAM enter the following command:
service vspherelamd start
To stop the vSphere LAM enter the following command:
service vspherelamd stop
To view the status of vSphere LAM, enter the following command:
service vspherelamd status
If the LAM fails to connect to one or more vSphere sources, Cisco Crosswork Situation Manager creates an alert and writes the details to the process log. Refer to the logging details for LAMs and integrations for more information.
Command line attributes
The vsphere_lam is a command line executable that can be run as a service daemon, and takes four attributes, which can be viewed by typing:
vsphere_lam --help
| Option |
Description |
| --config |
Points to a pathname to find the configuration file for the LAM. This is where the entire configuration for the LAM is specified |
| --help |
Displays all the command line options |
| --version |
Displays the component’s version number |
| --log level |
Specifies the level of debugging. By default, User gets everything. In common with all executables in Cisco Crosswork Situation Manager, having it set at that level can result in a lot of output (many messages per event message processed). In all production implementations, it is recommended that log level is set to WARN, which only informs user of matters of importance |
Configure SSL
To configue SSL in vSphere:
1. Navigate to the directory /etc/vmware/ssl on the VMware vCenter server.
2. Copy the rui.crt and rui.key to the machine where the vSphere LAM is running.
3. Enter the path of the certificates and its name in the config file.
SSL is now configured for vSphere.
Webhook
You can install a webhook integration to send events from a webhook client to Cisco Crosswork Situation Manager.
The integration allows you to POST JSON payloads to your instance via HTTP/HTTPS.
Before You Begin
Before you start to set up your webhook integration, ensure you have met the following requirements:
· If you are using an on-prem version of Cisco Crosswork Situation Manager, you have configured it with a valid SSL certificate.
· Your webhook client can make requests to external endpoints over port 443.
· The integration client is able to submit a JSON payload and supports basic auth.
Configure the Integration
Configure the Webhook integration in Cisco Crosswork Situation Manager as follows:
1. Navigate to the Integrations tab.
2. Click Webhook in the Monitoring section.
3. Provide a unique integration name. You can use the default name or customize the name according to your needs.
4. Set a Basic Authentication username and password.
Configure the Webhook
These instructions offer the basic information you need to configure a webhook integration. Different webhook clients may have different implementation options. Refer to the documentation of your webhook client for more information.
1. Enter the URL for this instance of Cisco Crosswork Situation Manager:
| Field |
Value |
| URL |
<your webhook integration URL> For example: https://example.moogsoftaiops.com/events/webhook_webhook1 |
2. Your basic authentication User ID and Password are:
| Field |
Value |
| User ID |
Username generated in the Cisco Crosswork Situation Manager UI |
| Password |
Password generated in the Cisco Crosswork Situation Manager UI |
Depending on the webhook client, you can either use these user credentials directly or use a base64 encoder to encode them in 'username:password' format.
3. Enter JSON as the body of the webhook event in the following format and edit the field values as appropriate:
{
"signature": "<signature>",
"source": "<source>",
"source_id": "<source_id>",
"external_id": "<external_id>",
"agent_location": "<agent_location>",
"severity": "<severity>",
"type": "<type>",
"manager": "<manager>",
"class": "<class>",
"description": "<description>",
"agent_time": "<agent_time>"
}
| Field |
Input |
Description |
| signature |
String |
Used to identify the event. Usually source:class:type. |
| source |
String |
Hostname or FQDN of the source machine that generated the event. |
| source_id |
String |
Unique identifier for the source machine. |
| external_id |
String |
Unique identifier for the event source. |
| agent_location |
String |
Geographical location of the agent that created the event. |
| severity |
Integer |
Severity level of the event from 0-5 (clear - critical). |
| type |
String |
Level of classification for the event. Follows hierarchy class then type. |
| manager |
String |
General identifier of the event generator or intermediary. |
| class |
String |
Level of classification for the event. Follows hierarchy class then type. |
| description |
String |
Text description of the event. |
| agent_time |
String |
Timestamp of when the event occurred in Unix epoch time. |
4. Add a header field with the content type. For the authorization type, enter 'Basic' followed by you basic auth User ID and Password in 'userid:password' format.
{
"Content-Type": "application/json",
"Authorization": "Basic <base64 encoded credentials>"
}
Use a base64 encoder to encode 'userid:password' if required by your webhook client. For example, for 'myuser:mypassword' the encoded result would be: 'dXNlcmlkOnBhc3N3b3JkDQo='.
5. Connect the webhook as required in the client and turn it on.
Test the Webhook
You can run the following cURL command to send sample data to Cisco Crosswork Situation Manager.
Make sure to replace <userid>:<password> and <url> with the values entered previously.
curl -u <userid>:<password> <url> -H "Content-Type: application/json" -X POST -v --data '
{
"signature":"my_test_box:application:Network",
"source_id":"198.51.100",
"external_id":"id-1234",
"manager":"my_manager",
"source":"my_test_box",
"class":"application",
"agent_location":"my_agent_location",
"type":"Network",
"severity":3,
"description":"high network utilization in application A",
"agent_time":"1411134582"
}'
If successful, you should receive the following response:
{
"response": {
"processed": 1,
"cached": 0,
"received": 1
},
"success": true,
"message": "Processed 1 event(s)"
}
See Configure the REST LAM for more information on webhook and its response codes.
xMatters
You can install an xMatters integration to enable bidirectional communication between Cisco Crosswork Situation Manager and xMatters. The integration allows you to send notifications to users and groups in xMatters about alerts, invitations and Situations. You can close Situations to close associated events in xMatters. See xMatters Workflow for more details.
You can also comment on xMatters events for them to appear on associated Situation Room comment threads in Cisco Crosswork Situation Manager. See the xMatters documentation for more information.
Before You Begin
The xMatters integration has been validated with xMatters v5.5. Before you set up your integration complete the following tasks:
1. Create an xMatters user with administrator privileges.
2. Create an xMatters API user with the REST Web Service User role.
3. Create users in xMatters with the same names as your users in Cisco Crosswork Situation Manager.
4. Set up groups in xMatters with the same names as your teams in Cisco Crosswork Situation Manager.
5. Download the Moogsoft AIOps-xMatters Communication Plan.
6. In xMatters, import the Cisco Crosswork Situation Manager xMatters Communication Plan zip file. After you import the plan, it is enabled. Configure the communications plan as follows:
a. Edit the Inbound Integrations and enable Engage Group, Engage Group (alert based) and Engage User.
b. Set the authentication method for each to 'Basic Authentication'.
c. Note down the URL under 'How to trigger the integration' for Engage Group, Engage Group (alert based) and Engage User.
Configure the Integration
To configure the xMatters integration:
1. Navigate to the Integrations tab.
2. Click xMatters in the Collaboration section.
3. Provide a unique integration name. You can use the default name or customize the name according to your needs.
4. Provide connection details for your xMatters system.
If you enable Automatically Engage Team, a Situation posted to the team sends a notification to the xMatters group with the same name. The Cisco Crosswork Situation Manager team name must match the xMatters group name in order for this to work.
Configure xMatters
To configure xMatters, perform the following tasks in the xMatters interface:
1. Go to Communication Plans and edit the access permissions. Add your xMatters API user.
2. Edit the forms and for each entry go to Web Service - Sender Permissions and add your xMatters API user.
3. Configure the Integration Builder for the Communication Plan. Assign the xMatters endpoint to the xMatters API user and configure it as follows:
| Field |
Value |
| Name |
MoogsoftAIOps |
| Trust self-signed certificates |
Set as appropriate |
| Base URL |
<your xMatters integration URL> For example: https://example.moogsoftaoiops.com/graze/v1/integrations/xmatters |
| Authentication |
Basic |
| Username |
Username of Graze user. Default is 'Graze API User'. |
| Password |
Password of Graze user |
| Preemptive |
True |
After you complete the xMatters configuration, Cisco Crosswork Situation Manager receives notifications from xMatters about invitations, alerts and associated Situations.
xMatters Workflow
The bidirectional xMatters integration keeps critical information synchronized between Cisco Crosswork Situation Manager and xMatters.
You can perform the following actions with this integration:
· Notify an xMatters group about an alert.
· Notify an xMatters group about a Situation.
· Close a Situation in Cisco Crosswork Situation Manager to close the associated event in xMatters.
· Invite a user from Cisco Crosswork Situation Manager to a Situation Room to send an invite to a user with the same name in xMatters.
· Comment on an xMatters event for it to appear in an associated Situation Room comment thread in Cisco Crosswork Situation Manager.
· Automatically notify an xMatters group if a Situation is assigned to the corresponding team in Cisco Crosswork Situation Manager.
For information on configuring the integration see xMatters.
Notify an xMatters Group about an Alert
You can notify an xMatters Group about an alert by following these steps:
1. Open an alert view.
2. Right-click on an alert.
3. Select Tools > Engage xMatters Group (Alert).
The xMatters group receives a notification about the alert from Cisco Crosswork Situation Manager.
Notify an xMatters Group about a Situation
You can notify an xMatters Group about an alert by following these steps:
1. Open a Situation view.
2. Right-click on a Situation.
3. Select Tools > Engage xMatters Group.
The xMatters group receives a notification about the Situation from Cisco Crosswork Situation Manager.
Comment on a Situation Room from xMatters
You can add comments to the comment thread of a Situation Room in Cisco Crosswork Situation Manager from xMatters.
To do this, open the associated event in xMatters and add a comment. This appears in Cisco Crosswork Situation Manager as follows:
"xMatters user <your_username> Commented: <posted_comment>".
Zabbix
You can integrate Cisco Crosswork Situation Manager with Zabbix via two products. Choose your integration process below according to your Zabbix and Cisco Crosswork Situation Manager environments:
· Zabbix Polling: The polling method is useful when Zabbix cannot push events to Cisco Crosswork Situation Manager due to firewall or security issues. You may therefore want to use this method if you are using Cisco Crosswork Situation Manager on-premises and Zabbix in the cloud.
· Zabbix Webhook: For all other Zabbix and Cisco Crosswork Situation Manager deployments, use this integration to set up a webhook notification action in Zabbix.
Zabbix Polling
The Zabbix Polling integration enables Cisco Crosswork Situation Manager to collect event data from one or more Zabbix systems.
Refer to the LAM and Integration Reference to see the integration's default properties. When you use the integrations UI, you can only configure the visible properties.
If you want to implement a more complex Zabbix Polling LAM with custom settings, see Configure the Zabbix Polling LAM.
See the Zabbix documentation for details on Zabbix components.
Before You Begin
The Zabbix Polling integration has been validated with Zabbix v3.2. Before you start to set up the integration, ensure you have met the following requirements for each Zabbix server:
· You have the API URL of the Zabbix server.
· You have credentials to connect to the Zabbix server.
· The port for your Zabbix server is open and accessible from Cisco Crosswork Situation Manager.
Optionally you can provide the following:
· A minimum severity for events you want to fetch from the Zabbix server.
· The types of event you want to fetch and names of the host groups, hosts, applications and triggers.
· A request interval and retry interval time in seconds. Defaults to 60 seconds.
· An overlap time in seconds to ensure Cisco Crosswork Situation Manager does not miss any valid events. Defaults to 10 seconds.
· The length of time to wait for a request to complete before timing out. Defaults to 120 seconds.
Configure the Zabbix Polling Integration
To configure the Zabbix Polling integration:
1. Navigate to the Integrations tab.
2. Click Zabbix (Polling) in the Monitoring section.
3. Provide a unique integration name. You can use the default name or customize the name according to your needs.
4. Provide connection details for your Zabbix system.
Configure Zabbix
You do not need to perform any integration-specific steps on your Zabbix systems. After you configure the integration, it polls Zabbix at regular intervals to collect event data (every 60 seconds by default).
If the integration fails to connect to one or more sources, Cisco Crosswork Situation Manager creates an alert and writes the details to the process log. Refer to the logging details for LAMs and integrations for more information.Configure Logging
Configure the Zabbix Polling LAM
Zabbix provides comprehensive application monitoring and performance lifecycle management. Cisco Zabbix Integration (LAM) connects with Zabbix Server to fetch events from it. It then forwards them to the Cisco Crosswork Situation Manager.
See Zabbix Polling for UI configuration instructions.

1. LAM reads the configuration from the zabbix_lam.conf file.
2. LAM connects with Zabbix REST API with the provided host name.
3. Here http and https (SSL) requests are supported with basic user authentication.
4. The response is received with event data in json format.
5. Zabbix_lam has the option to filter event data based on the filter variable. The final event carries data of events based on the values in the filter fields of the config file.
6. The events are parsed and converted into normalized Cisco Crosswork Situation Manager events.
7. The normalized events are then published to MooMS bus.
Configuration
The events received from Zabbix are processed according to the configuration in the zabbix_lam.conffile. The processed events are published to Cisco Crosswork Situation Manager.
The configuration file contains a JSON object. At the first layer of the object, the LAM has a parameter called config, and the object that follows config has all the necessary information to control the LAM.
Monitor
The Zabbix LAM takes the events from the Zabbix. You can configure parameters here to establish a connection with Zabbix:
General
| Field |
Type |
Description |
| name and class |
String |
Reserved fields: do not change. Default values are Zabbix Lam Monitor and CZabbixMonitor. |
| target |
JSON Object |
A top-level container for which you can define one or more target Zabbix sources. You can specify the configuration for each target. If you don't specify a request_interval the target uses the globally defined interval. |
| url |
String |
Enter the the url with http/https of Zabbix server. |
| user_name and Password |
String |
Enter the username and password for accessing Zabbix server. |
| encrypted_password |
String |
If the password is encrypted, then enter the encrypted password in this field and comment out the password field. At a time, either password or the encrypted_password field is used. If both the fields are not commented, then the field encrypted_password will be used by the Zabbix LAM. |
| polling_interval |
Integer |
The polling time interval, in seconds, between the requests after which the event data is fetched from Zabbix LAM. Default = 10 seconds. If 0 is entered, the time interval is set to 10 seconds. |
| max_retries |
Integer |
The maximum number of retry attempts to reconnect with Zabbix Rest Server in case of a connection failure. Default = -1, if no value is specified, then there will be infinite retry attempts. If the specified value is greater than 0, then the LAM will try that many times to reconnect; in case of 0 or any other value less than 0, max retries will set to default. |
| retry_interval |
Integer |
The time interval between two successive retry attempts. Default = 60 seconds, if 0 is entered, the time interval will set to default. |
| timeout |
Integer |
This is the timeout value in seconds, which will be used to timeout a connection, socket and request. If no value is specified, then the time interval will set to to 120 seconds. |
| event_type |
Integer |
Enter the type of event that you want to fetch from the Zabbix Server. You can fetch the following event types: Trigger: Enter 0 here to fetch events raised on triggers. Discovery_rule: Enter 1 here to get events from a set discovery rules. Active_agent: Enter 2 here to get events from active agents. Internal_events: Enter 3 here to get internal Zabbix events. |
| request_interval |
Integer |
Length of time to wait between requests, in seconds. Can be overridden by request_interval in individual targets. Defaults to 60. |
| requests_overlap |
Integer |
If events meet the overlap_identity_fields matching criteria during this interval (in seconds), they are not treated as duplicates. Used to ensure that Cisco Crosswork Situation Manager does not miss valid events. |
| overlap_identity_fields |
String |
A list of payload tokens the LAM uses to identify duplicate events when Zabbix returns all open events and not just updated events. After the requests_overlap period the LAM treats events with the same overlap_identity_fields as duplicate events. The LAM identifies duplicates for each payload event in the previous request only. Identification is based on the token names of the returned payload, not the mapped names. For example, including $signature refers to this value in the payload, not event.value("signature"). Required if requests_overlap is enabled. Example: overlap_identity_fields: ["eventid"] |
| retry_recovery |
Object |
Specifies the behavior of the LAM when it re-establishes a connection after a failure. - recovery_interval: Length of time to wait between recovery requests in seconds. Must be less than the request_interval set for each target. Defaults to 20. - max_lookback: The period of time for which to recover missed events in seconds. Defaults to -1 (recover all events since the last successful poll). |
| proxy |
Object |
If you want to connect to Zabbix through a proxy server, configure the host, port, user, and password or encrypted password properties in the proxy section for the target. |
Filter
| Field |
Type |
Description |
| filter |
Object |
Enter true here to enable filters. The following filters are used in combination to filter out the received events: host_group_names: Enter the host group names from where you have to fetch events. host_names: Enter the host names present in the host group names, you can fetch the events only from the host names entered here. application_name: Enter the application name of the host from where you are fetching events. For example, if the application of the host is CPU, then only the events raised by the defined CPU triggers will be sent to the Cisco Crosswork Situation Manager. trigger_names: Enter the trigger names to fetch only specific events from a trigger in the above-defined application. |
| minimum_trigger_severities |
Integer |
Enter the minimum level of severity to fetch events of severities higher than the defined severity level. The severities which can be entered here are as follows: Not Classified: Enter 0 here to receive all the events with all the severities including the cleared events. Information: Enter 1 here to receive all the events with the severity Information or above. Warning: Enter 2 here to receive all the events with the severity Warning or above. Average: Enter 3 here to receive all the events with the severity Average or above. High: Enter 4 here to receive all the events with the severity High or above. Disaster: Enter 5 here to receive all the events with the severity Disaster. |
Secure Sockets Layer
| Field |
Type |
Description |
| disable_certificate_validation |
Boolean |
This is for Zabbix server SSL Certificate validation. If disable_certificate is false, then it will validate SSL Connection. If disable_certificate_validation is set to true, then it will bypass the ssl connection. By default it set to false. When disable_certificate_validationis false, you have to provide the following: ssl_keystore_file_path: Enter the path of the keystore file. This is the path where the generated keystore file is copied in Cisco Crosswork Situation Manager, e.g. "/usr/local/zabbix_ssl/keystore.jks". ssl_keystore_password: Enter the password of keystore. It is the same password that was entered when the keystore was generated. |
Example
You can configure the Zabbix LAM to retrieve events from one or more sources. The following example demonstrates a configuration that targets two Zabbix sources. For a single source comment out the target2 section. If you have more than two sources, add a target section for each one and uncomment properties to enable them.
monitor:
{
name : "Zabbix Lam Monitor",
class : "CZabbixMonitor",
request_interval : 60,
max_retries : -1,
retry_interval : 60,
timeout : 120,
targets:
{
target1:
{
url : "http://examplezabbix1/zabbix/api_jsonrpc.php",
user_name : "zabbix_user1",
#password : "password",
encrypted_password : "qJAFVXpNDTk6ANq65pEfVGNCu2vFdcoj70AF5BIebEc=",
disable_certificate_validation : false,
path_to_ssl_files : "config",
server_cert_filename : "server1.crt",
request_interval : 60,
max_retries : -1,
retry_interval : 60,
timeout : 120,
requests_overlap : 10,
overlap_identity_fields : [ "eventid" ],
event_types : [ 0 ],
filter : false,
host_group_names : [ "" ],
host_names : [ "" ],
application_names : [ "" ],
minimum_trigger_severity : 0
}
target2:
{
url : "http://examplezabbix2/zabbix/api_jsonrpc.php",
user_name : "zabbix_user2",
#password : "password",
encrypted_password : "bDGFSClSHBn8DSw43nGwSPLSv2dGwdsj50WD4BHdfVa&",
disable_certificate_validation : false,
path_to_ssl_files : "config",
server_cert_filename : "server2.crt",
request_interval : 60,
max_retries : -1,
retry_interval : 60,
timeout : 120,
requests_overlap : 10,
overlap_identity_fields : [ "eventid" ],
event_types : [ 0 ],
filter : false,
host_group_names : [ "" ],
host_names : [ "" ],
application_names : [ "" ],
minimum_trigger_severity : 0
}
}
Agent and Process Log
Agent and Process Log allow you to define the following properties:
· name: Identifies events the LAM sends to the Message Bus.
· capture_log: Name and location of the LAM's capture log file.
· configuration_file: Name and location of the LAM's process log configuration file.
Mapping
Variables section is not required in the Zabbix LAM, you can directly map the event's field of Zabbix with Cisco Crosswork Situation Manager fields. The parameters of the received events are displayed in the Cisco Crosswork Situation Manager according to the mapping done here:
mapping :
{
catchAll: "overflow",
rules:
[
{ name: "signature", rule: "$signature" },
{ name: "source_id", rule: "$source" },
{ name: "external_id", rule: "$eventID" },
{ name: "manager", rule: "Zabbix" },
{ name: "source", rule: "$source" },
{ name: "class", rule: "$type" },
{ name: "agent", rule: "$LamInstanceName" },
{ name: "agent_location", rule: "$LamInstanceName" },
{ name: "type", rule: "$type" },
{ name: "severity", rule: "$severity", conversion: "stringToInt" },
{ name: "description", rule: "$description" },
{ name: "agent_time", rule: "$agent_time", conversion: "stringToInt" }
]
},
filter:
{
presend: "ZabbixLam.js"
}
The above example specifies the mapping of the Zabbix event fields with the Cisco Crosswork Situation Manager fields. The stringToInt is used to convert the data received in the string format into an integer format. Data not mapped to Cisco Crosswork Situation Manager Fields goes into "Custom Info".
Note:
The signature field is used by the LAM to identify correlated events.
Constants and Conversions
| Field |
Description |
Example |
| Severity and sevConverter |
has a conversion defined as sevConverter in the Conversions section, this looks up the value of severity defined in the severity section of constants and returns back the mapped integer corresponding to the severity |
severity: sevConverter:
|
| stringToInt |
used in a conversion, which forces the system to turn a string token into an integer value |
stringToInt: |
| timeConverter |
used in conversion which forces the system to convert time. If epoch time is to be used, then timeFormat mentioned in timeConverter should be commented. Otherwise, the user should provide the timeFormat |
timeConverter: |
Example
Example Constants and Conversions
constants:
{
severity:
{
"CLEAR" : 0,
"INDETERMINATE" : 1,
"WARNING" : 2,
"MINOR" : 3,
"MAJOR" : 4,
"CRITICAL" : 5
}
},
conversions:
{
sevConverter:
{
lookup: "severity",
input: "STRING",
output: "INTEGER"
},
stringToInt:
{
input: "STRING",
output: "INTEGER"
},
timeConverter:
{
timeFormat: "yyyy-MM-dd'T'HH:mm:ss",
input: "STRING",
output: "INTEGER"
}
},
Severity Reference
Cisco Crosswork Situation Manager Severity Levels
severity:
{
"CLEAR" : 0,
"INDETERMINATE" : 1,
"WARNING" : 2,
"MINOR" : 3,
"MAJOR" : 4,
"CRITICAL" : 5,
}
| Level |
Description |
| 0 |
Clear |
| 1 |
Indeterminate |
| 2 |
Warning |
| 3 |
Minor |
| 4 |
Major |
| 5 |
Critical |
Service Operation Reference
| Process Name |
Service Name |
| zabbix_lam |
zabbixlamd |
Start the LAM Service:
service zabbixlamd start
Stop the LAM Service:
service zabbixlamd stop
Check the LAM Service status:
service zabbixlamd status
If the LAM fails to connect to one or more Zabbix sources, Cisco Crosswork Situation Manager creates an alert and writes the details to the process log. Refer to the logging details for LAMs and integrations for more information.
Command Line Reference
To see the available optional attributes of the zabbix_lam, run the following command:
zabbix_lam --help
The zabbix_lam is a command line executable, and has the following optional attributes:
| Option |
Description |
| --config |
Points to a pathname to find the configuration file for the LAM. This is where the entire configuration for the LAM is specified. |
| --help |
Displays all the command line options. |
| --version |
Displays the component’s version number. |
| --loglevel |
Specifies the level of debugging. By default, user gets everything. In common with all executables in Cisco Crosswork Situation Manager, having it set at that level can result in a lot of output (many messages per event message processed). In all production implementations, it is recommended that log level is set to WARN. This ensures only warning, error and fatal messages are recorded. |
Zabbix Webhook
You can configure a Zabbix webhook to post data to Cisco Crosswork Situation Manager when an action occurs in Zabbix.
The Zabbix webhook integration does not include authentication. The Cisco Crosswork Situation Manager integration listens without requiring password information.
When you use the integrations UI, you can only configure the visible properties. If you want to implement a more complex Zabbix webhook LAM with custom settings, see Configure the Zabbix Webhook LAM.
The integration supports Zabbix deployed in Unix environments only. See the Zabbix documentation for details on Zabbix components.
Before You Begin
The Zabbix integration has been validated with Zabbix v3.4. Before you start to set up your integration, ensure you have met the following requirements:
· You have an active Zabbix account with the permissions to:
— Add custom alert scripts to the Zabbix server.
— Create new users, media types and actions.
· Zabbix can make requests to external endpoints over port 443. This is the default.
Configure the Zabbix Integration
To configure the Zabbix integration:
1. Navigate to the Integrations tab.
2. Click Zabbix in the Monitoring section.
3. Provide a unique integration name. You can use the default name or customize the name according to your needs.
Configure Zabbix
Create a Zabbix media type and action to send event data to Cisco Crosswork Situation Manager. For more help, see the Zabbix documentation on sending and receiving notifications.
1. Download the Moogsoft Zabbix Webhook script to your Zabbix server. Refer to the Zabbix documentation to identify the location of the script.
2. Grant the user running the Zabbix server read access to the script.
3. Log into the Zabbix UI and add a new media type with the following details. Set the other options as appropriate for your environment.
| Field |
Value |
| Name |
Moogsoft AIOps |
| Type |
Script |
| Script name |
moogsoftZabbixWebhook-1.0.sh |
| Script parameters |
Add two parameters in the following order: {ALERT.SENDTO} {ALERT.MESSAGE} |
| Concurrent sessions |
Set to a custom value appropriate for your environment. |
| Enable |
True |
4. Identify an existing Zabbix user to use or create a new user for this integration. The user must be an administrator or have read access to the host groups for which you will receive events.
5. Edit the user and add media as follows:
| Field |
Value |
| Type |
Select the media type you created in step 3 |
| Send to |
Link generated in the Cisco Crosswork Situation Manager UI |
| Enabled |
True |
Identify the action to use or create a new action for this integration.
Configure the operations, recovery operations and acknowledgement operations within the action as follows:
· Set the default message to:
{
"event_id": "{EVENT.ID}",
"trigger_status": "{TRIGGER.STATUS}",
"host_host": "{HOST.HOST}",
"trigger_id": "{TRIGGER.ID}",
"trigger_expression": "{TRIGGER.EXPRESSION}",
"trigger_name": "{TRIGGER.NAME}",
"trigger_nseverity": "{TRIGGER.NSEVERITY}",
"trigger_description": "{TRIGGER.DESCRIPTION}",
"event_tags": "{EVENT.TAGS}"
}
· Add an operation with the following details. Set the other options as appropriate for your environment.
| Field |
Value |
| Operation type |
Send message. |
| Send to Users or Send to User Groups |
Select the user you created in step 4 or a group that contains the user. |
| Send only to |
Select the media type you selected in step 3. |
After you complete the Zabbix configuration, Zabbix forwards events matching the action to Cisco Crosswork Situation Manager.
Configure the Zabbix Webhook LAM
The Zabbix Webhook LAM is an endpoint for webhook notifications from Zabbix actions. The LAM parses JSON events from Zabbix into Cisco Crosswork Situation Manager events.
You can install a basic Zabbix Webhook integration via the UI. See Zabbix Webhook for integration steps.
Configure the Zabbix Webhook LAM if you want to configure custom properties, set up high availability or configure advanced options that are not available in the UI integration.
Before You Begin
The Zabbix LAM has been validated with Zabbix v3.2. Before you start to set up the LAM, ensure you have met the following requirements:
· You have an active Zabbix account with the permissions to perform the following:
— Add custom alert scripts to the Zabbix server.
— Create new users, media types and actions.
· Zabbix can make requests to external endpoints over port 443. This is the default.
If you are configuring a distributed deployment refer to /document/preview/77155#UUIDbea404d9dd1afee65fa1471105d1b3c6 first. You will need the details of the server configuration you are going to use for HA.High Availability Overview
Configure the LAM
Edit the configuration file to control the behavior of the Zabbix Webhook LAM. You can find the file at $MOOGSOFT_HOME/config/zabbix_webhook_lam.conf
The Zabbix Webhook LAM is a REST-based LAM as it provides an HTTP endpoint for data ingestion. Note that only the generic REST LAM properties in zabbix_webhook_lam.conf apply to integrating with the Zabbix Webhook LAM; see the LAM and Integration Reference for a full description of all properties.
Some properties in the file are commented out by default. Uncomment properties to enable them.
· Configure the connection properties for the REST connection:
a. address: Address on the Cisco Crosswork Situation Manager server that listens for REST messages. Defaults to all interfaces.
b. port: Port on the Cisco Crosswork Situation Manager server that listens for REST messages. Defaults to 48013.
· Configure the SSL properties if you want to encrypt communications between the LAM and the REST connection:
a. use_ssl: Whether to use SSL certification.
b. path_to_ssl_files: Path to the directory that contains the SSL certificates.
c. ssl_key_filename: The SSL server key file.
d. ssl_cert_filename: The SSL root CA file.
e. ssl_protocols: Sets the allowed SSL protocols.
· Configure the LAM behavior:
a. num_threads: Number of worker threads to use when processing events.
b. rest_response_mode: When to send a REST response. See the LAM and Integration Reference for the options.
c. rpc_response_timeout: Number of seconds to wait for a REST response.
d. event_ack_mode: When Moogfarmd acknowledges events from the Zabbix Webhook LAM during the event processing pipeline.
e. accept_all_json: Allows the LAM to read and process all forms of JSON.
f. lists_contain_multiple_events: Whether Cisco Crosswork Situation Manager interprets a JSON list as multiple events.
· Optionally configure the LAM identification and log file details in the agent and log_config sections of the file:
a. name: Identifies events the LAM sends to the Message Bus.
b. capture_log: Name and location of the LAM's capture log file.
c. configuration_file: Name and location of the LAM's process log configuration file.
· Optionally configure severity conversion. See /document/preview/11721#UUID8b183a1e1278a7a652d3ae86944d7379 for further information and "Conversion Rules" in /document/preview/11720#UUID5c67156b667b1a28ec648cd779393914 for details on conversions in general.Severity ReferenceData Parsing
Unsupported Properties
The Zabbix integration does not include client authentication. Do not uncomment or change the following properties:
1. use_client_certificates
2. client_ca_filename
3. auth_token or encrypted_auth_token
4. header_auth_token or encrypted_header_auth_token
5. authentication_type
6. authentication_cache
Example
An example Zabbix Webhook LAM configuration is as follows.
monitor:
{
name : "Zabbix Webhook Lam Monitor",
class : "CRestMonitor",
port : 48023,
address : "0.0.0.0",
use_ssl : false,
#path_to_ssl_files : "config",
#ssl_key_filename : "server.key",
#ssl_cert_filename : "server.pem",
#use_client_certificates : false,
#client_ca_filename : "ca.crt",
#auth_token : "my_secret",
#encrypted_auth_token : "dfJtTQMGiFHfiq7sCmxguBt6Jv+eytkoiKCquSB/7iWxpgGsG2aez3z2j7SuBtKj",
#header_auth_token : "my_secret",
#encrypted_header_auth_token : "dfJtTQMGiFHfiq7sCmxguBt6Jv+eytkoiKCquSB/7iWxpgGsG2aez3z2j7SuBtKj",
#ssl_protocols : [ "TLSv1.2" ],
authentication_type : "none",
authentication_cache : true,
accept_all_json : true,
lists_contain_multiple_events : true,
num_threads : 5,
rest_response_mode : "on_receipt",
rpc_response_timeout : 20,
event_ack_mode : "queued_for_processing"
},
agent:
{
name : "Zabbix Webhook",
capture_log : "$MOOGSOFT_HOME/log/data-capture/zabbix_webhook_lam.log"
},
log_config:
{
configuration_file : "$MOOGSOFT_HOME/config/logging/custom.log.json"
}
Configure for High Availability
Configure the Zabbix Webhook LAM for high availability if required. See /document/preview/77155#UUIDbea404d9dd1afee65fa1471105d1b3c6 for details.High Availability Overview
Configure LAMbot Processing
The Zabbix Webhook LAMbot processes and filters events before sending them to the Message Bus. You can customize or bypass this processing if required. You can also load JavaScript files into the LAMbot and execute them.
See LAMbot Configuration for more information. An example Zabbix Webhook LAM filter configuration is shown below.
filter:
{
presend: "ZabbixWebhookLam.js",
modules: [ "CommonUtils.js" ]
}
Start and Stop the LAM
Restart the Zabbix Webhook LAM to activate any changes you make to the configuration file or LAMbot.
The LAM service name is zabbixwebhooklamd.
See /document/preview/11677#UUID1a2205c3aae40b26fdfe94490043f3c3 for the commands to start, stop and restart the LAM.Control Processes
You can use a GET request to check the status of the Zabbix Webhook LAM. See "Check the LAM Status" in Configure the REST LAM for further information and examples.
Configure Zabbix
After you have the Zabbix Webhook LAM running and listening for incoming requests, you can configure a media type and action in Zabbix. See "Configure Zabbix" in Zabbix Webhook.
Zenoss
You can install the Zenoss integration to enable Cisco Crosswork Situation Manager to collect event data from one or more Zenoss systems.
See the Zenoss documentation for details on Zenoss components.
Before You Begin
The Zenoss integration has been validated with Zenoss v4.2. Before you start to set up your integration, ensure you have met the following requirements for each Zenoss server:
a. You have the URL of the Zenoss server.
b. You have credentials to connect to the Zenoss server.
c. The port for your Zenoss server is open and accessible from Cisco Crosswork Situation Manager.
d. Your Zenoss server is able to accept HTTP/ HTTPS requests.
Additionally, you can provide optional configuration details. See the LAM and Integration Reference for a description of all properties.
Configure the Zenoss Integration
To configure the Zenoss integration:
· Navigate to the Integrations tab.
· Click Zenoss in the Monitoring section.
· Provide a unique integration name. You can use the default name or customize the name according to your needs.
· Provide connection details for your Zenoss system.
Configure Zenoss
You do not need to perform any integration-specific steps on your Zenoss systems. After you configure the integration, it polls Zenoss at regular intervals to collect messages (every 60 seconds by default).
If the integration fails to connect to one or more sources, Cisco Crosswork Situation Manager creates an alert and writes the details to the process log. Refer to the logging details for LAMs and integrations for more information.Configure Logging
Configure the Zenoss LAM
Zenoss is an Infrastructure Monitoring Application which monitors network, server, storage, power devices, etc. It is a distributed software that monitors the IT environment and generate events based on data which has been exposed with rest APIs or from third parties. This document describes the configurations required to establish a connection between the Zenoss application and the Zenoss Integration (LAM).
See Zenoss for UI configuration instructions.

1. The LAM reads configuration from the zenoss_lam.conf file.
2. The LAM connects with the host, and requests for the event console data.
3. The LAM receives the event data of all the devices in Zenoss as a response. The format of received events is JSON.
4. If uid_filter variable in monitor section is set, then the LAM will filter the events based on the uid_filter value.
5. The LAM parses the events and then publish it to the MooMS bus.
6. After parsing, the event data is filtered and the device data along with unmapped event data is sent to the overflow variable.
7. The LAM create events which are submitted to the MooMS bus.
8. The events are then published to the subject “Events”.
Configuration
The events received from the Zenoss server are processed according to the configurations in the zenoss_lam.conffile. The processed events are published to Cisco Crosswork Situation Manager.
The configuration file contains a JSON object. At the first layer of the object, LAM has a parameter called config, and the object that follows config has all the necessary information to control the LAM.
Monitor
The Zenoss LAM takes the events from the Zenoss Server. You can configure parameters here to establish a connection with Zenoss:
General
| Field |
Type |
Description |
| name and class |
String |
Reserved fields: do not change. Default values are ZENOSS Lam Monitor and CZenossMonitor. |
| target |
JSON Object |
A top-level container for which you can define one or more target Zenoss sources. You can specify the configuration for each target. If you don't specify a request_interval the target uses the globally defined interval. |
| url |
String |
Enter the IP address/hostname and port of the Zenoss server. For example: "http://localhost:8080" |
| user_name and Password |
String |
Enter the username and password of the Zenoss console login. |
| encrypted_password |
String |
If the password is encrypted, then enter the encrypted password in this field and comment out thepasswordfield. At a time, either password or the encrypted_password field is used. If both the fields are not commented, then the field encrypted_password will be used by the Zenoss LAM. |
| uid_filter |
String |
If you want to filter events based on device UID, then you can provide the uid_filter parameter. You can provide multiple UIDs, by separating the UIDs with a comma. |
| events_date_format |
String |
This is the date/time format of the event received in response . The possible value would be like "yyyy-MM-dd HH:mm:ss", "yyyy-MM-dd'T'HH:mm:ss'Z'", etc. If this value is set to blank, then event date/time will be epoch time. |
| polling_interval |
Integer |
The polling time interval, in seconds, between the requests after which the event data is fetched from Zenoss LAM. Default = 10 seconds. If 0 is entered, the time interval is set to 10 seconds. |
| max_retries |
Integer |
The maximum number of retry attempts to reconnect with Zenoss Server in case of a connection failure. Default = -1, if no value is specified, then there will be infinite retry attempts. If the specified value is greater than 0, then the LAM will try that many times to reconnect; in case of 0 or any other value less than 0, max retries will set to default. |
| max_thread |
Integer |
Number of threads that may connect simultaneously with the configured servers. Default value is 2. It must be 2 or more than that. This depends upon the load on servers and available system resources. |
| timeout |
Integer |
This is the timeout value in seconds, which will be used to timeout a connection, socket and request. If no value is specified, then the time interval will set to 120 seconds. |
| event_severity |
Integer |
Here you can filter events on the basis of severity. Zenoss send events with severity codes, and the events with a severity code that matches the severity code in this field, will only be processed by the LAM. The severity codes of Zenoss are as follows: 0 is Clear 1 is Debug 2 is Info 3 is Warning 4 is Error 5 is Critical If you do not want the events with severity Clear or Debug, then enter ["5", "4", "3", "2" ] in the event_severity field. |
| request_interval |
Integer |
Length of time to wait between requests, in seconds. Can be overridden by request_interval in individual targets. Defaults to 60. |
| proxy |
Object |
If you want to connect to Zenoss through a proxy server, configure the host, port, user, and password or encrypted password properties in the proxy section for the target. |
Secure Sockets Layer
| Field |
Type |
Description |
| ssl |
Boolean |
Enter true here, to enable SSL Communication: disable_certificate_validation: Set it to true, if SSL certificate is not to be used and https is to be bypassed. ssl_keystore_file_path: Enter the path of the keystore file. This is the path where the generated keystore file is copied in Cisco Crosswork Situation Manager, e.g. "/usr/local/zenoss_ssl/keystore.jks". ssl_keystore_password: Enter the password of keystore. It is the same password that was entered when the keystore was generated. |
Example
You can configure the Zenoss LAM to retrieve events from one or more sources. The following example demonstrates a configuration that targets two Zenoss sources. For a single source comment out the target2 section. If you have more than two sources, add a target section for each one and uncomment properties to enable them.
monitor:
{
name : "ZENOSS Lam Monitor",
class : "CZenossMonitor",
request_interval : 60,
max_retries : -1,
retry_interval : 60,
targets:
{
target1:
{
url : "http://examplezenoss1:8080",
user_name : "zenoss_user1",
#password : "password",
encrypted_password : "qJAFVXpNDTk6ANq65pEfVGNCu2vFdcoj70AF5BIebEc=",
uid_filter : "/zport/dmd/Devices/Server/Windows",
events_date_format : "",
request_interval : 60,
timeout : 120,
max_retries : -1,
retry_interval : 60,
event_severity : [ "5", "4", "3", "2", "1" ],
disable_certificate_validation : false,
path_to_ssl_files : "config",
server_cert_filename : "server1.crt",
client_key_filename : "client1.key",
client_cert_filename : "client1.crt",
ssl_protocols : [ "TLSv1.2" ]
}
target2:
{
url : "http://examplezenoss2:8080",
user_name : "zenoss_user2",
#password : "password",
encrypted_password : "bDGFSClSHBn8DSw43nGwSPLSv2dGwdsj50WD4BHdfVa&",
uid_filter : "/zport/dmd/Devices/Server/Windows",
events_date_format : "",
request_interval : 60,
timeout : 120,
max_retries : -1,
retry_interval : 60,
event_severity : [ "5", "4", "3", "2", "1" ],
disable_certificate_validation : false,
path_to_ssl_files : "config",
server_cert_filename : "server2.crt",
client_key_filename : "client2.key",
client_cert_filename : "client2.crt",
ssl_protocols : [ "TLSv1.2" ]
}
}
}
Agent and Process Log
Agent and Process Log allow you to define the following properties:
· name: Identifies events the LAM sends to the Message Bus.
· capture_log: Name and location of the LAM's capture log file.
· configuration_file: Name and location of the LAM's process log configuration file.
Mapping
Variables section is not required in the Zenoss LAM, you can directly map the event's field of Zenoss with Cisco Crosswork Situation Manager fields. In mapping there is a value called rules, which is a list of assignments. The parameters of the received events are displayed in the Cisco Crosswork Situation Manager according to the mapping done here:
mapping :
{
catchAll: "overflow",
rules:
[
{ name: "signature", rule: "$agent::$eventClass.uid" },
{ name: "source_id", rule: "$device.uid" },
{ name: "external_id", rule: "$id" },
{ name: "manager", rule: "Zenoss" },
{ name: "source", rule: "$device.uid" },
{ name: "class", rule: "$eventClass.uid"},
{ name: "agent", rule: "$LamInstanceName"},
{ name: "agent_location", rule: "$LamInstanceName" },
{ name: "type", rule: "$device.uid" },
{ name: "severity", rule: "$severity" },
{ name: "description", rule: "$summary" },
{ name: "agent_time", rule: "$moog_now"}
]
},
filter:
{
presend: "ZenossLam.js"
}
.In the above example, the signature field is used by the LAM to identify the correlated events. It is mapped with combination of agent and eventClass.uid. However, you can also change it as per the requirement.
Data not mapped to Cisco Crosswork Situation Manager Fields goes into "Custom Info".
You can define number of these rules covering the base attribute of an event.
Note:
To map the sub-field values of a field in the Zenoss event, the “. “operator is used, for e.g. "$device.uid”. Here “uid” is the subfield of the field device, so to map the subfield, the “.” operator is used.
Constants and Conversions
| Field |
Description |
Example |
| Severity and sevConverter |
has a conversion defined as sevConverter in the Conversions section, this looks up the value of severity defined in the severity section of constants and returns back the mapped integer corresponding to the severity |
severity: { sevConverter:
|
| stringToInt |
used in a conversion, which forces the system to turn a string token into an integer value |
stringToInt: |
Example
Example Constants and Conversions
constants:
{
severity:
{
"CLEAR" : 0,
"INDETERMINATE" : 1,
"WARNING" : 2,
"MINOR" : 3,
"MAJOR" : 4,
"CRITICAL" : 5
}
},
conversions:
{
sevConverter:
{
lookup: "severity",
input: "STRING",
output: "INTEGER"
},
stringToInt:
{
input: "STRING",
output: "INTEGER"
},
},
Severity Reference
Cisco Crosswork Situation Manager Severity Levels
severity:
{
"CLEAR" : 0,
"INDETERMINATE" : 1,
"WARNING" : 2,
"MINOR" : 3,
"MAJOR" : 4,
"CRITICAL" : 5,
}
| Level |
Description |
| 0 |
Clear |
| 1 |
Indeterminate |
| 2 |
Warning |
| 3 |
Minor |
| 4 |
Major |
| 5 |
Critical |
Service Operation Reference
| Process Name |
Service Name |
| zenoss_lam |
zenosslamd |
Start the LAM Service:
service Zenosslamd start
Stop the LAM Service:
service Zenosslamd stop
Check the LAM Service status:
service Zenosslamd status
If the LAM fails to connect to one or more Zenoss sources, Cisco Crosswork Situation Manager creates an alert and writes the details to the process log.
Command Line Reference
To see the available optional attributes of the Zenoss_lam, run the following command:
Zenoss_lam --help
The Zenoss_lam is a command line executable, and has the following optional attributes:
| Option |
Description |
| --config |
Points to a pathname to find the configuration file for the LAM. This is where the entire configuration for the LAM is specified. |
| --help |
Displays all the command line options. |
| --version |
Displays the component’s version number. |
| --loglevel |
Specifies the level of debugging. By default, user gets everything. In common with all executables in Cisco Crosswork Situation Manager, having it set at that level can result in a lot of output (many messages per event message processed). In all production implementations, it is recommended that log level is set to WARN. This ensures only warning, error and fatal messages are recorded. |
 Feedback
Contact Cisco
- Open a Support Case

- (Requires a Cisco Service Contract)