Process Statistics

Viewing the Statistics for Processes Using the GUI

To view the statistics for a process, on the menu bar, choose Fabric > Inventory. In the Navigation pane, perform one of the following actions:

  • For all processes, choose pod_ID > node_name > Processes.

  • For a specific process, choose pod_ID > node_name > Processes > process_name.

In the Work pane, choose the Stats tab. The following screenshot shows an example of all processes, but the view for a specific process is nearly identical:
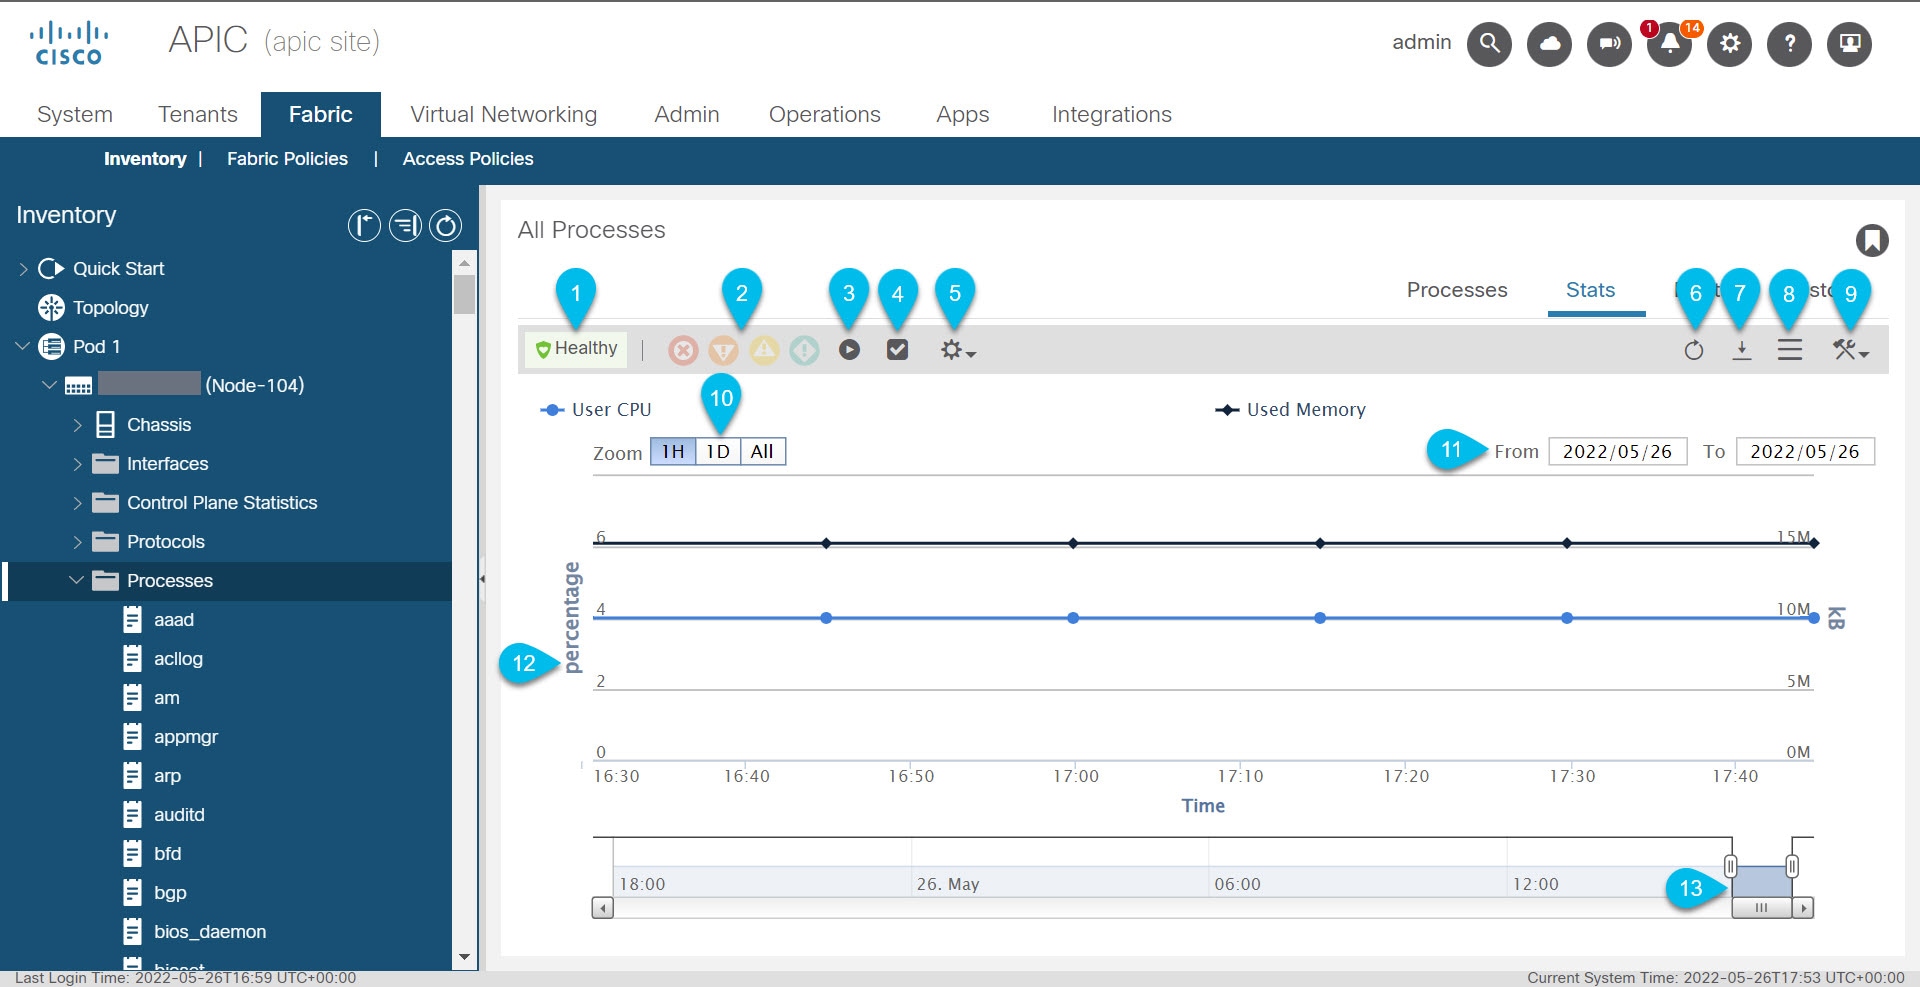
Callout

Description

1

The overall health of the process. Hover over this to see the health score.

2

The faults. Hover of this to see the number of faults for each severity. Click one of the severities to go to the Faults tab to see the faults of that severity.

3

Stops the GUI from displaying updated stats, which enables you to examine the stats as they were at the time that you clicked this button. Click the button again for the GUI to resume displaying updated stats. Even when you stop the GUI from displaying updated stats, the Cisco Application Policy Infrastructure Controller (APIC) continues to collect the latest stats.

4

Opens the Select Stats dialog, which enables you to choose the sampling interval and select the statistics to view.

5

Enables you to choose the statistics type to view.

  • Average: Shows the average resources that each statistic used during the retention period.

  • Min: Shows the minimum resources that each statistic used during the retention period.

  • Max: Shows the maximum resources that each statistic used during the retention period.

  • Trend: Shows the trend in resource usage for each statistic during the retention period.

  • Rate: Shows the rate at which resources that each statistic used during the retention period.

  • default: Currently, this type shows the same information as the Average type.

6

Refreshes the statistics data.

7

Downloads the statistics data to your local system as an XML file. The file gets downloaded to your browser's default download location.

8

Toggles between the table and topology (graph) views.

9

Click this, then choose Configure Statistics Policy to open the Create Stats Target dialog. In the dialog, you can choose one or more statistics targets and configure the collections. The collections enable you to specify the retention period for each collection granularity, and enable or disable each granularity.

For more information, see Configuring the Statistics Policy for All Processes After Configuring the Policy the First Time Using the GUI.

10

Only visible in the topology view, and only for the 15 Minute and 1 Hour sampling intervals. This sets the zoom to a preset value. The zoom specifies what time range to display in the topology.

  • 1H: Sets the zoom to the last hour.

  • 1D: Sets the zoom to the last day (the last 24 hours).

  • 1M: Sets the zoom to the last minute. This choice is visible only if you chose the 1 Hour sampling interval.

  • All: Sets the zoom to display the full range of time, which is slightly over 24 hours for the 15 Minute sampling interval, and is the same as 1M for the 1 Hour sampling interval.

11

Only visible in the topology view, and only for the 15 Minute and 1 Hour sampling intervals. The date range of the topology. You can click the dates and change the values. You cannot enter a date that is not visible in the timeline at the bottom of the topology. The From date cannot be later than the To date.

12

In the topology view, this area shows a graph of the selected statistics. Hover over any of the epochs to see the exact data for all selected statistics at that time.

In the table view, this area shows a table of the same statistics. You can sort the table by clicking any of the headers. You can filter the table by clicking the drop-down list arrow at the right side of a header, choosing Columns, then putting a check in or removing a check from any of the boxes.

13

Only visible in the topology view. This is the zoom, which specifies what time range to display in the topology. This enables you to set the zoom to an arbitrary amount. Drag the left side to specify the start of the zoom and the right sides specify the end of the zoom, which determines the length of time to display. After you set the start and end, you can use the horizontal scroll bar to change the portion of the time line that you are viewing while retaining the same length of time.

Configuring the Statistics Policy for All Processes for the First Time Using the GUI

This procedure describes how to configure the statistics policy for all processes for the first time since you brought up the Cisco Application Policy Infrastructure Controller (APIC). The GUI dialog is different if you previously configured the policy. In this case, see the Configuring the Statistics Policy for All Processes After Configuring the Policy the First Time Using the GUI.

The Cisco APIC creates and stores one stats object whenever the granularity (time interval) of a collection passes. For example, for the 15 minute collection, after 1 hour passes, the Cisco APIC creates and stores 4 stats objects. The Cisco APIC stores up to 1,000 stats objects for each collection, except for the 5 minute granularity, of which the Cisco APIC stores only 12 stats objects.

Procedure


Step 1

On the menu bar, choose Fabric > Inventory.

Step 2

In the Navigation pane, choose pod_ID > node_name > Processes.

Step 3

In the Work pane, choose Action > Configure Statistics Policy.

The Create Stats Target dialog appears.

Step 4

In the Available area, select one or more of the stats types, then click the top gray button that is between the Available and Selected areas.

The selected stats types get moved to the Selected area. Any stats type that you do not select uses the default parameters from Fabric > Fabric Policies > Policies > Monitoring > default > Stats Collection Policies > ALL.

You can select multiple stats types by holidng Ctrl and clicking the desired stats types. You can also hold Shift and click the first and last stats type to select all of the stats types.

Step 5

Click Next.

Step 6

Double-click the row of a granularity to enable or disable that granularity and to change the history retention period, then click Update.

Repeat this step for each granularity that you want to modify. These values get applied to all of the selected stats types.

Step 7

Click OK.


Configuring the Statistics Policy for All Processes After Configuring the Policy the First Time Using the GUI

This procedure describes how to configure the statistics policy for all processes after you configured the policy for the first time. The GUI dialog is different if you have not previously configured the policy. In this case, see the Configuring the Statistics Policy for All Processes for the First Time Using the GUI.

The Cisco Application Policy Infrastructure Controller (APIC) creates and stores one stats object whenever the granularity (time interval) of a collection passes. For example, for the 15 minute collection, after 1 hour passes, the Cisco APIC creates and stores 4 stats objects. The Cisco APIC stores up to 1,000 stats objects for each collection, except for the 5 minute granularity, of which the Cisco APIC stores only 12 stats objects.

Procedure


Step 1

On the menu bar, choose Fabric > Inventory.

Step 2

In the Navigation pane, choose pod_ID > node_name > Processes.

Step 3

In the Work pane, choose Action > Configure Statistics Policy.

The Edit Stats Policy default dialog appears.

Step 4

In the Collections and Thresholds tab, expand System CPU, System load, or System memory as desired.

System CPU, System load, and System memory each appear only if you configured them previously.

Step 5

To edit a collection, click the edit button (pencil icon) to the right of the desired collection interval.

The Stats Collection and Thresholds dialog appears for that collection interval. The collections specify whether the Cisco APIC collects the stats for a specific granularity and how long the Cisco APIC retains the collected stats.

  1. Under the Policy tab, set the properties as desired.

    Property

    Description

    Granularity

    The granularity of the collection that you are editing. You cannot change this value.

    Admin State

    The administrative state of the collection. The possible values are:

    • disabled: Disables this collection, meaning that the Cisco APIC will not collect the stats for this collection granularity.

    • enabled: Enables this collection, meaning that the Cisco APIC collects the stats for this collection granularity.

    • inherited: This collection inherits its administrative state from the default policy. You can view and edit the default policy by navigating to Fabric > Fabric Policies, then Policies > Monitoring > default > Stats Collection Policies.

    History Retention Period

    The length of time that the Cisco APIC retains a stats object.

  2. Under the Thresholds tab, you can edit or delete any configured thresholds.

  3. Under the History tab, you can view the events and audit log.

  4. After you finish making changes, click Submit.

Step 6

To configure a threshold, click the + button to the right of the desired collection interval and choose a property.

The Create Stats Threshold dialog appears for that collection interval. The thresholds specify that the Cisco APIC will set a fault when the value of a specific stat reaches or exceeds a specific value.

  1. Set the properties as desired.

    Property

    Description

    Normal Value

    The baseline value for the thresholds.

    Threshold Direction

    Specifies whether you can set thresholds for the stats values as they rise or fall, or both.

    • Both: You can configure thresholds for both increases and decreases in the stat's value.

    • Rising: You can configure thresholds for only increases in the stat's value.

    • Falling: You can configure thresholds for only decreases in the stat's value.

    Rising Thresholds to Config

    This is visible only if you chose Both or Rising for Threshold Direction. Put a check in the box for each of the fault severities that you want the Cisco APIC to set as the stat's value rises.

    Falling Thresholds to Config

    This is visible only if you chose Both or Falling for Threshold Direction. Put a check in the box for each of the fault severities that you want the Cisco APIC to set as the stat's value falls.

    Rising area

    This is visible only if you chose Both or Rising for Threshold Direction. In this area, you specify the stat value that sets or resets a fault of the specified severity.

    The Set and Reset values can be the same. The Reset value cannot be greater than the Set value. The values for the different severities can be the same, but the value for a lower severity cannot be greater than the value for a higher severity. For example, if Critical has a Set value of 70, Major can have a Set value of 70 or less.

    Falling area

    This is visible only if you chose Both or Falling for Threshold Direction. In this area, you specify the stat value that sets or resets a fault of the specified severity.

    The Set and Reset values can be the same. The Set value cannot be greater than the Reset value. The values for the different severities can be the same, but the value for a higher severity cannot be greater than the value for a lower severity. For example, if Minor has a Set value of 50, Major can have a Set value of 50 or less.

  2. Click Submit.

Step 7

(Optional) In the Reportables tab, you can specify for which stats type you want to configure dedicated parameters for the collections and thresholds.

Any stats type for which you do not configure dedicated parameters use the default parameters from Fabric > Fabric Policies > Policies > Monitoring > default > Stats Collection Policies > ALL.

Reportables are referred to as "monitoring objects" in other parts of the GUI.

  1. In the Add/Remove Reportables area, put a check in the box for any stats type for which you want to configure the collection and threshold parameters that are dedicated for that stats type.

    After you add the stats type from here, the stats type will appear in the Collections and Thresholds tab and you can modify the dedicated parameters from there. If the stats type must use the parameters from the default stats policy, remove the check from the box.

  2. In the Configure Collections for New Reportables table, you can set the initial collection parameters that are dedicated for the stats type.

    However, the parameters from this table will not take effect for a stats type that is already configured with a dedicated set of parameters, as in the stats type already has a check in the box in the Add/Remove Reportables area. For those stats types, go to the Collections and Thresholds tab and modify the dedicated parameters from there.

Step 8

Click Submit.