
First Published: 2024-07-23
Americas Headquarters
Cisco Systems, Inc.
170 West Tasman Drive
San Jose, CA 95134-1706
USA
http://www.cisco.com
Tel: 408 526-4000
800 553-NETS (6387)
Fax: 408 527-0883
New and Changed Information
The following table provides an overview of the significant changes up to the current release. The table does not provide an exhaustive list of all changes or the new features up to this release.
| Feature | Description | Release | Where Documented |
|---|---|---|---|
|
Terminology change |
The term "sites" is renamed to "fabrics". |
6.5.1 |
Entire document |
This document is available from your Cisco Nexus Dashboard Insights GUI as well as online at www.cisco.com. For the latest version of this document, visit Cisco Nexus Dashboard Insights Documentation.
Flows
Flows
Flows provides deep insights at a flow level giving details such as average latency and packet drop indicator. It also raises anomalies when the latency of the flows increase or when packets get dropped because of congestion or forwarding errors.
Each flow has a packet counter representing the number of packets entering the ASIC for that flow over a period of time. This period of time is called aggregation interval. There are several points where flow statistics for a given flow can be aggregated. Aggregation can happen in the ASIC, switch software, and server software.
The Flows section of Nexus Dashboard Insights displays the telemetry information collected from various devices in the fabric that were added to the fabric.
For details on Flow Telemetry support for Cisco Nexus series switches and line cards, see the Compatibility Information section in the Nexus Dashboard Insights Release Notes.
Flows Guidelines and Limitations
-
Nexus Dashboard Insights captures the maximum anomaly score for a particular flow, for the entire cycle of the user specified time range.
-
For unknown IP addresses, the traffic from spine nodes will be dropped and flow records are not generated in Flow Telemetry.
-
The packet count represents the number of packets entering the fabric for a particular flow that does not match the source and destination IP address.
-
A maximum of 63 VRF instances are supported on flow telemetry nodes.
-
Flows is not supported for Endpoint Security Groups.
-
Bridge domain subnet needs to be programmed for bridged flows to get reported from spine switch.
-
For flows, if the time range you have selected is greater than 6 hours, the data may not get displayed. Select a time range that is less than or equal to 6 hours.
-
When the scale limit for anomalies is reached, some of the unhealthy flows may not be displayed as anomalies in the Flow Record Details page. A system issue is raised when this condition happens. Navigate to Admin > System Settings > System Issues to view the system issue.
-
Multicast is not supported for Flow Telemetry.
-
When traffic flows through sub-interfaces, in the Flow Record Details page, sub-interface is displayed only in the ingress direction in the Flow Path area. In the egress direction the parent interface is displayed.
-
On the Cisco Nexus 9332D-GX2B, 9348D-GX2A, and 9364D-GX2A switches, you can enable flow on up to 31 interfaces. On all other switches other than first generation Cisco Nexus 9000 switches and the Cisco N9K-C93180YC-EX, N9K-C93108TC-EX, N9K-C93180LC-EX, and N9K-X9732C-EX line cards, you can enable flow on up to 63 interfaces. A first generation switch has a product ID that does not have a suffix and does not have the -X suffix.
Limitations for Flows on Cisco Nexus EX switches
For details on Flow Telemetry hardware support, see the Compatibility Information section in the Nexus Dashboard Insights Release Notes.
-
Output port information for outgoing traffic from N9K-C93180YC-EX, N9K-C93108TC-EX, N9K-C93180LC-EX, and N9K-X9732C-EX line cards will not be displayed.
-
The burst information for N9K-C93180YC-EX, N9K-C93108TC-EX, N9K-C93180LC-EX, and N9K-X9732C-EX line cards will not be displayed.
-
The EPG names will reflect after few minutes of flow capture and after enabling Flows. This information is fetched from the software and not from the EX ASIC.
-
For L3Out external EPGs; EPG names, Buffer drop anomaly, Forwarding drop anomaly, and QoS policing drop anomaly are not supported.
-
Cisco Nexus 9300-EX platform switches do not support VRF based filtering. They support only bridge domain or subnet filtering of flow telemetry rules. Nexus Dashboard Insights gets the flows from the subnet if the subnet is across multiple VRFs.
-
Tier-1 leaf switches do not export flow telemetry data from remote leaf switches to sub-leaf switches.
-
Interface-level flow telemetry is not supported.
Limitations for Flows on Cisco Nexus FX and GA switches
-
The spine switches do not export shared service flow records (VRFA to VRFB and vice-versa). Due to this limitation Nexus Dashboard Insights flow path summary will be incomplete.
-
Nexus Dashboard Insights supports all IP sizes, but shows it different from actual IP size. For example, for 1000 bytes of IP packet size:
-
For IPv4 inter-leaf node traffic (with spine node), Nexus Dashboard Insights shows Ingress IP size of 1050 bytes and Egress IP size of 1108 bytes. For IPv4 intra-leaf traffic Nexus Dashboard Insights shows both Ingress and Egress IP size of 1050 bytes.
-
For IPv6 inter-leaf node traffic (with spine node), Nexus Dashboard Insights shows Ingress IP size of 1070 bytes and Egress IP size of 1128 bytes. For IPv4 intra-leaf traffic Nexus Dashboard Insights shows both Ingress and Egress IP size of 1070 bytes.
-
-
Flow telemetry and flow telemetry events will not export
drop bitif there is an egress ACL drop in the switch. -
Locally switched traffic in the same node, with shared services will not have information on the destination VRF or Tenant and EPG.
-
This is valid for both EPGs and ExtEPGs.
-
Shared services also encompasses the case of EPGs in the same VRF but different tenants.
-
-
If the external EPG matches a 0.0.0.0/0 subnet, the Nexus Dashboard Insights Flow Telemetry will not recognize the external EPG name for the flow. You must expose a more specific subnet match in the external EPG for the flow telemetry to recognize the name.
Extending Flows to Cisco ACI Tier-3 Topologies in Nexus Dashboard Insights
Flows implements 3-tier topology where a second tier of leaf nodes are connected to first tier of leaf nodes. In the 3-tier topology when flow packet traverses from one host to the other using multiple tiers, before they reach the destination host, the packet becomes an iVXLAN packet when it traverses through a tier-1 leaf node.
Guidelines and Limitations
-
The Cisco APIC Release 4.2(4o) does not support a leaf node exporting flow telemetry in case of iVXLAN packet, resulting in an incomplete flow path and inadequate information to stitch together all the flows.
View Flows
The Flows page displays telemetry information collected from various devices in an online fabric. The Flows records let the user visualize the flows per fabric. For a particular fabric, you can view flows by Anomaly Score, Packet Drop Indicator, and Average Latency.
The flows engine also runs machine-learning algorithms on the behavior of the flows to raise anomalies in the behavior, such as average latency and packet drop indicator. The graph represents the anomalies in the behavior over a period of time.
Flow telemetry and analytics gives in-depth visibility of the data plane. Flows collects the flow records streamed from the nodes and converts to understandable EPG-based flow records. Top nodes by flow anomalies displays the nodes in the network with the most anomalies.

To view flow details, you must first enable flows. See Getting Started.
-
Navigate to Manage > Fabrics.
-
Select Online Fabrics from the drop-down list.
-
Click a fabric name to view the fabric details.
-
Navigate to Connectivity > Flows.
-
Select a time range.
-
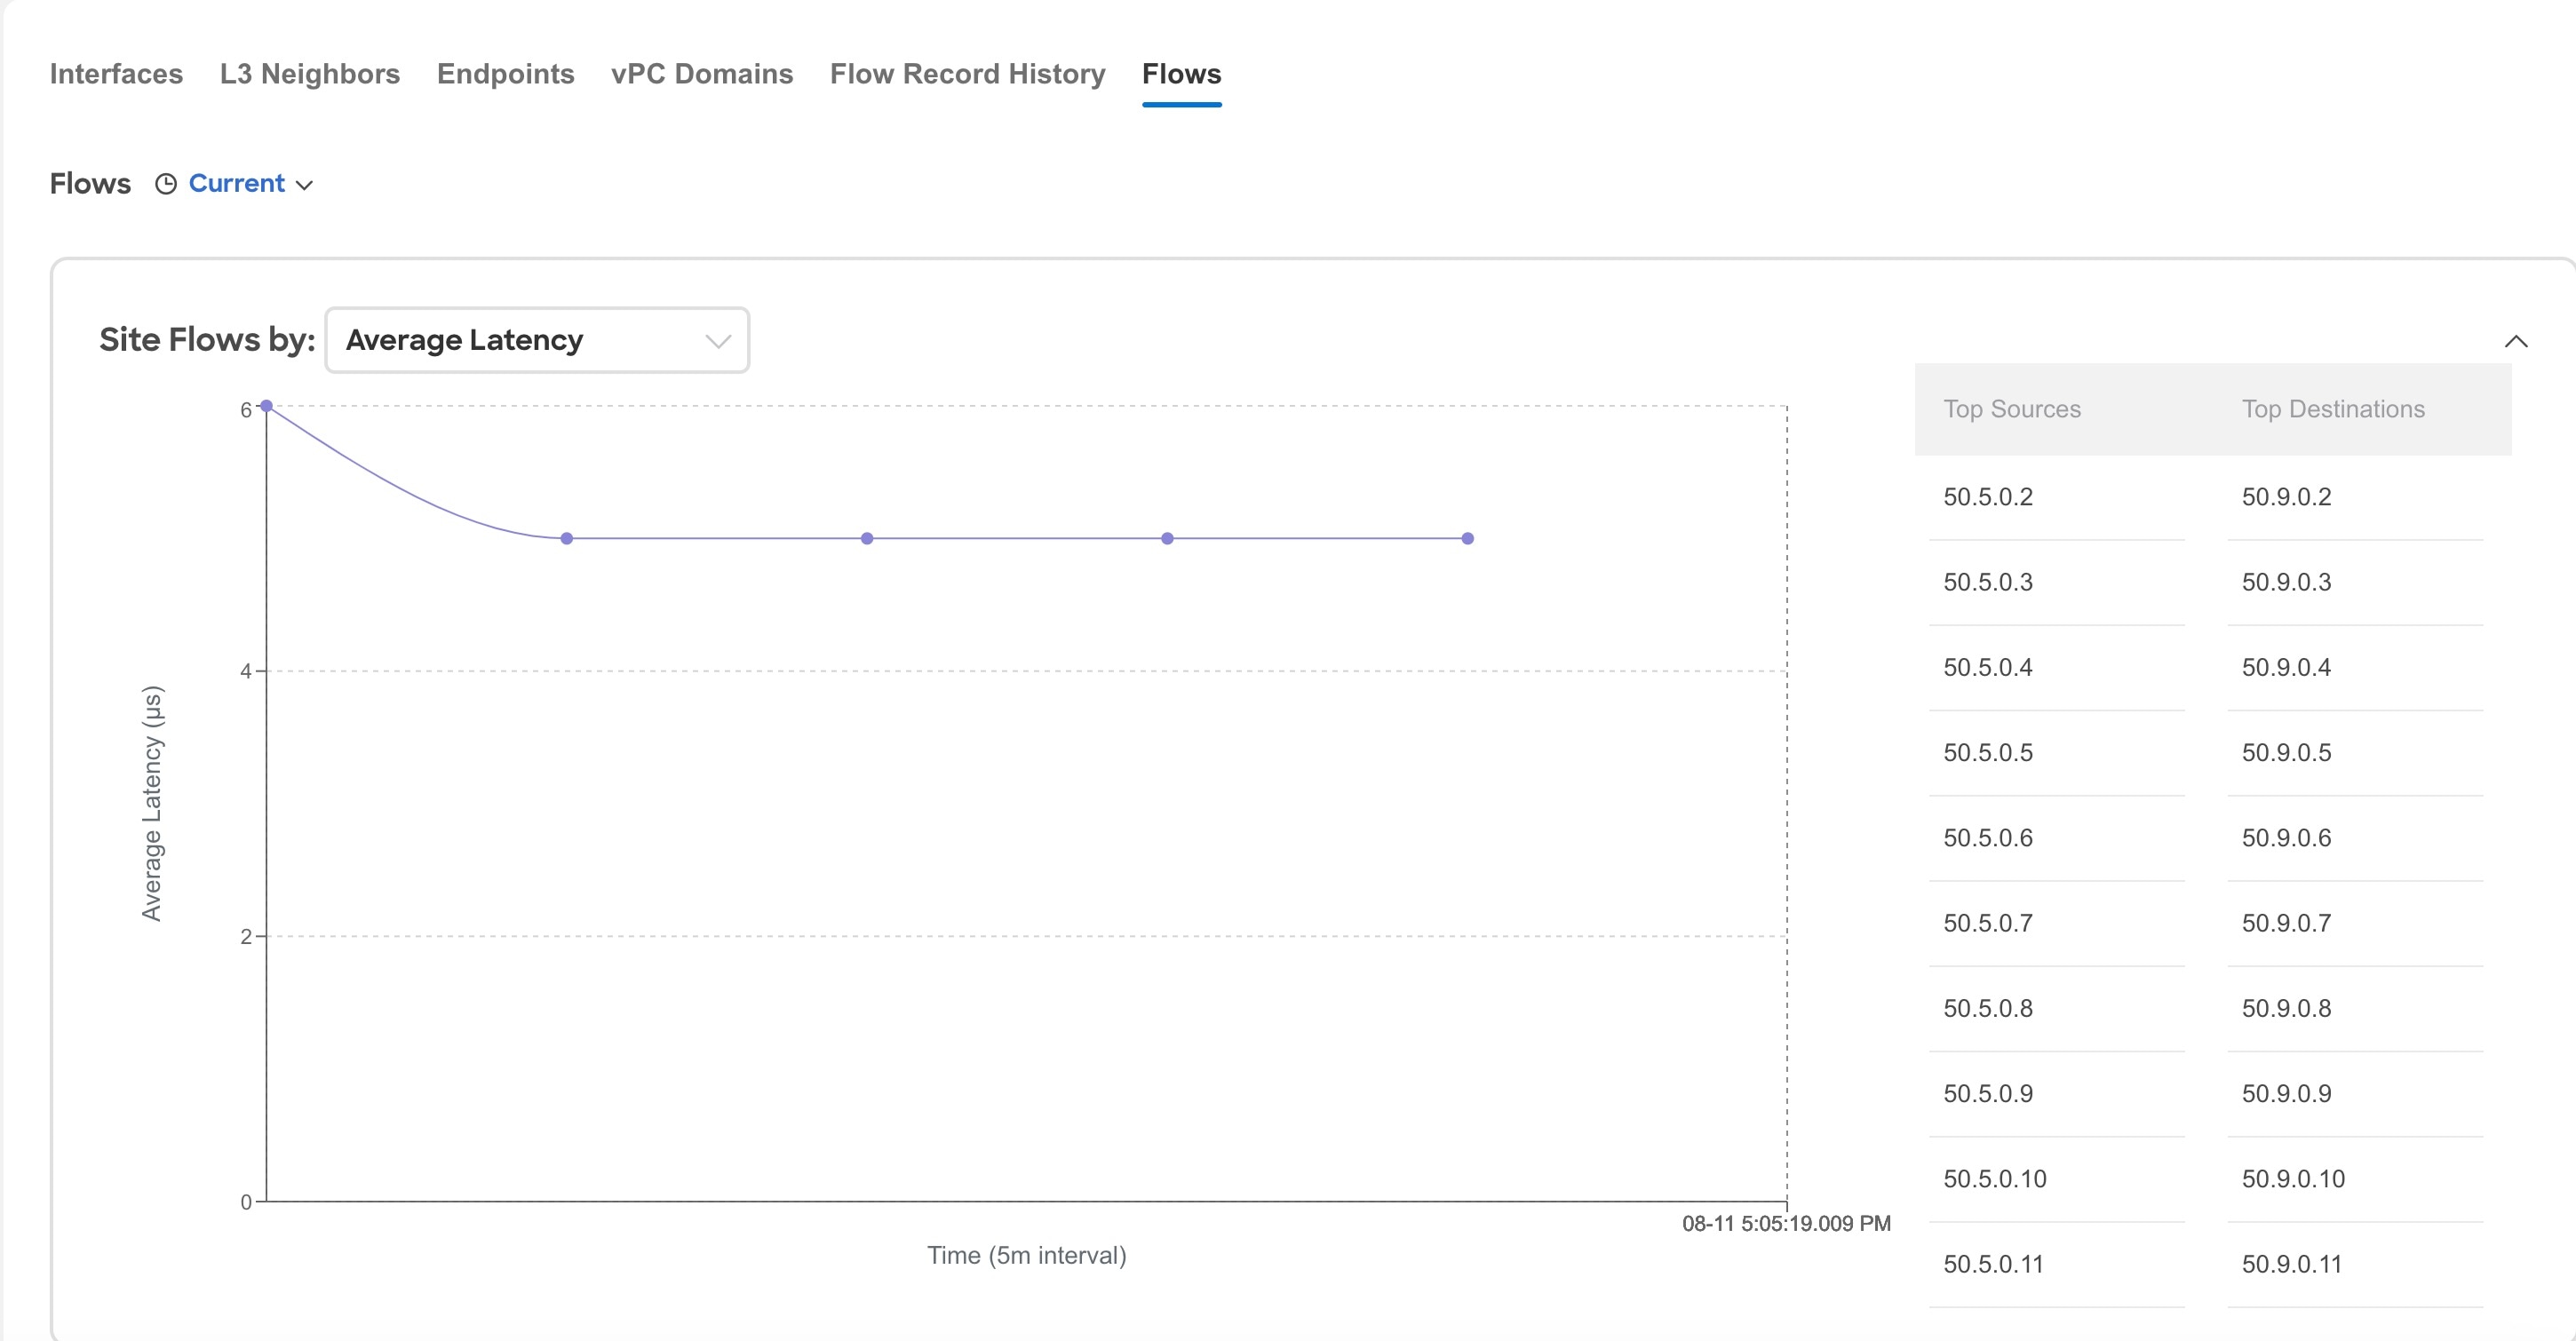
In the Fabric Flows by area select an option from the drop-down list to view flows by Anomaly Score, Packet Drop Indicator, and Average Latency. The graph displays a time series plot for flows properties recorded in the entire fabric. The flows recorded for Top Sources and Top Destinations are also displayed.
-
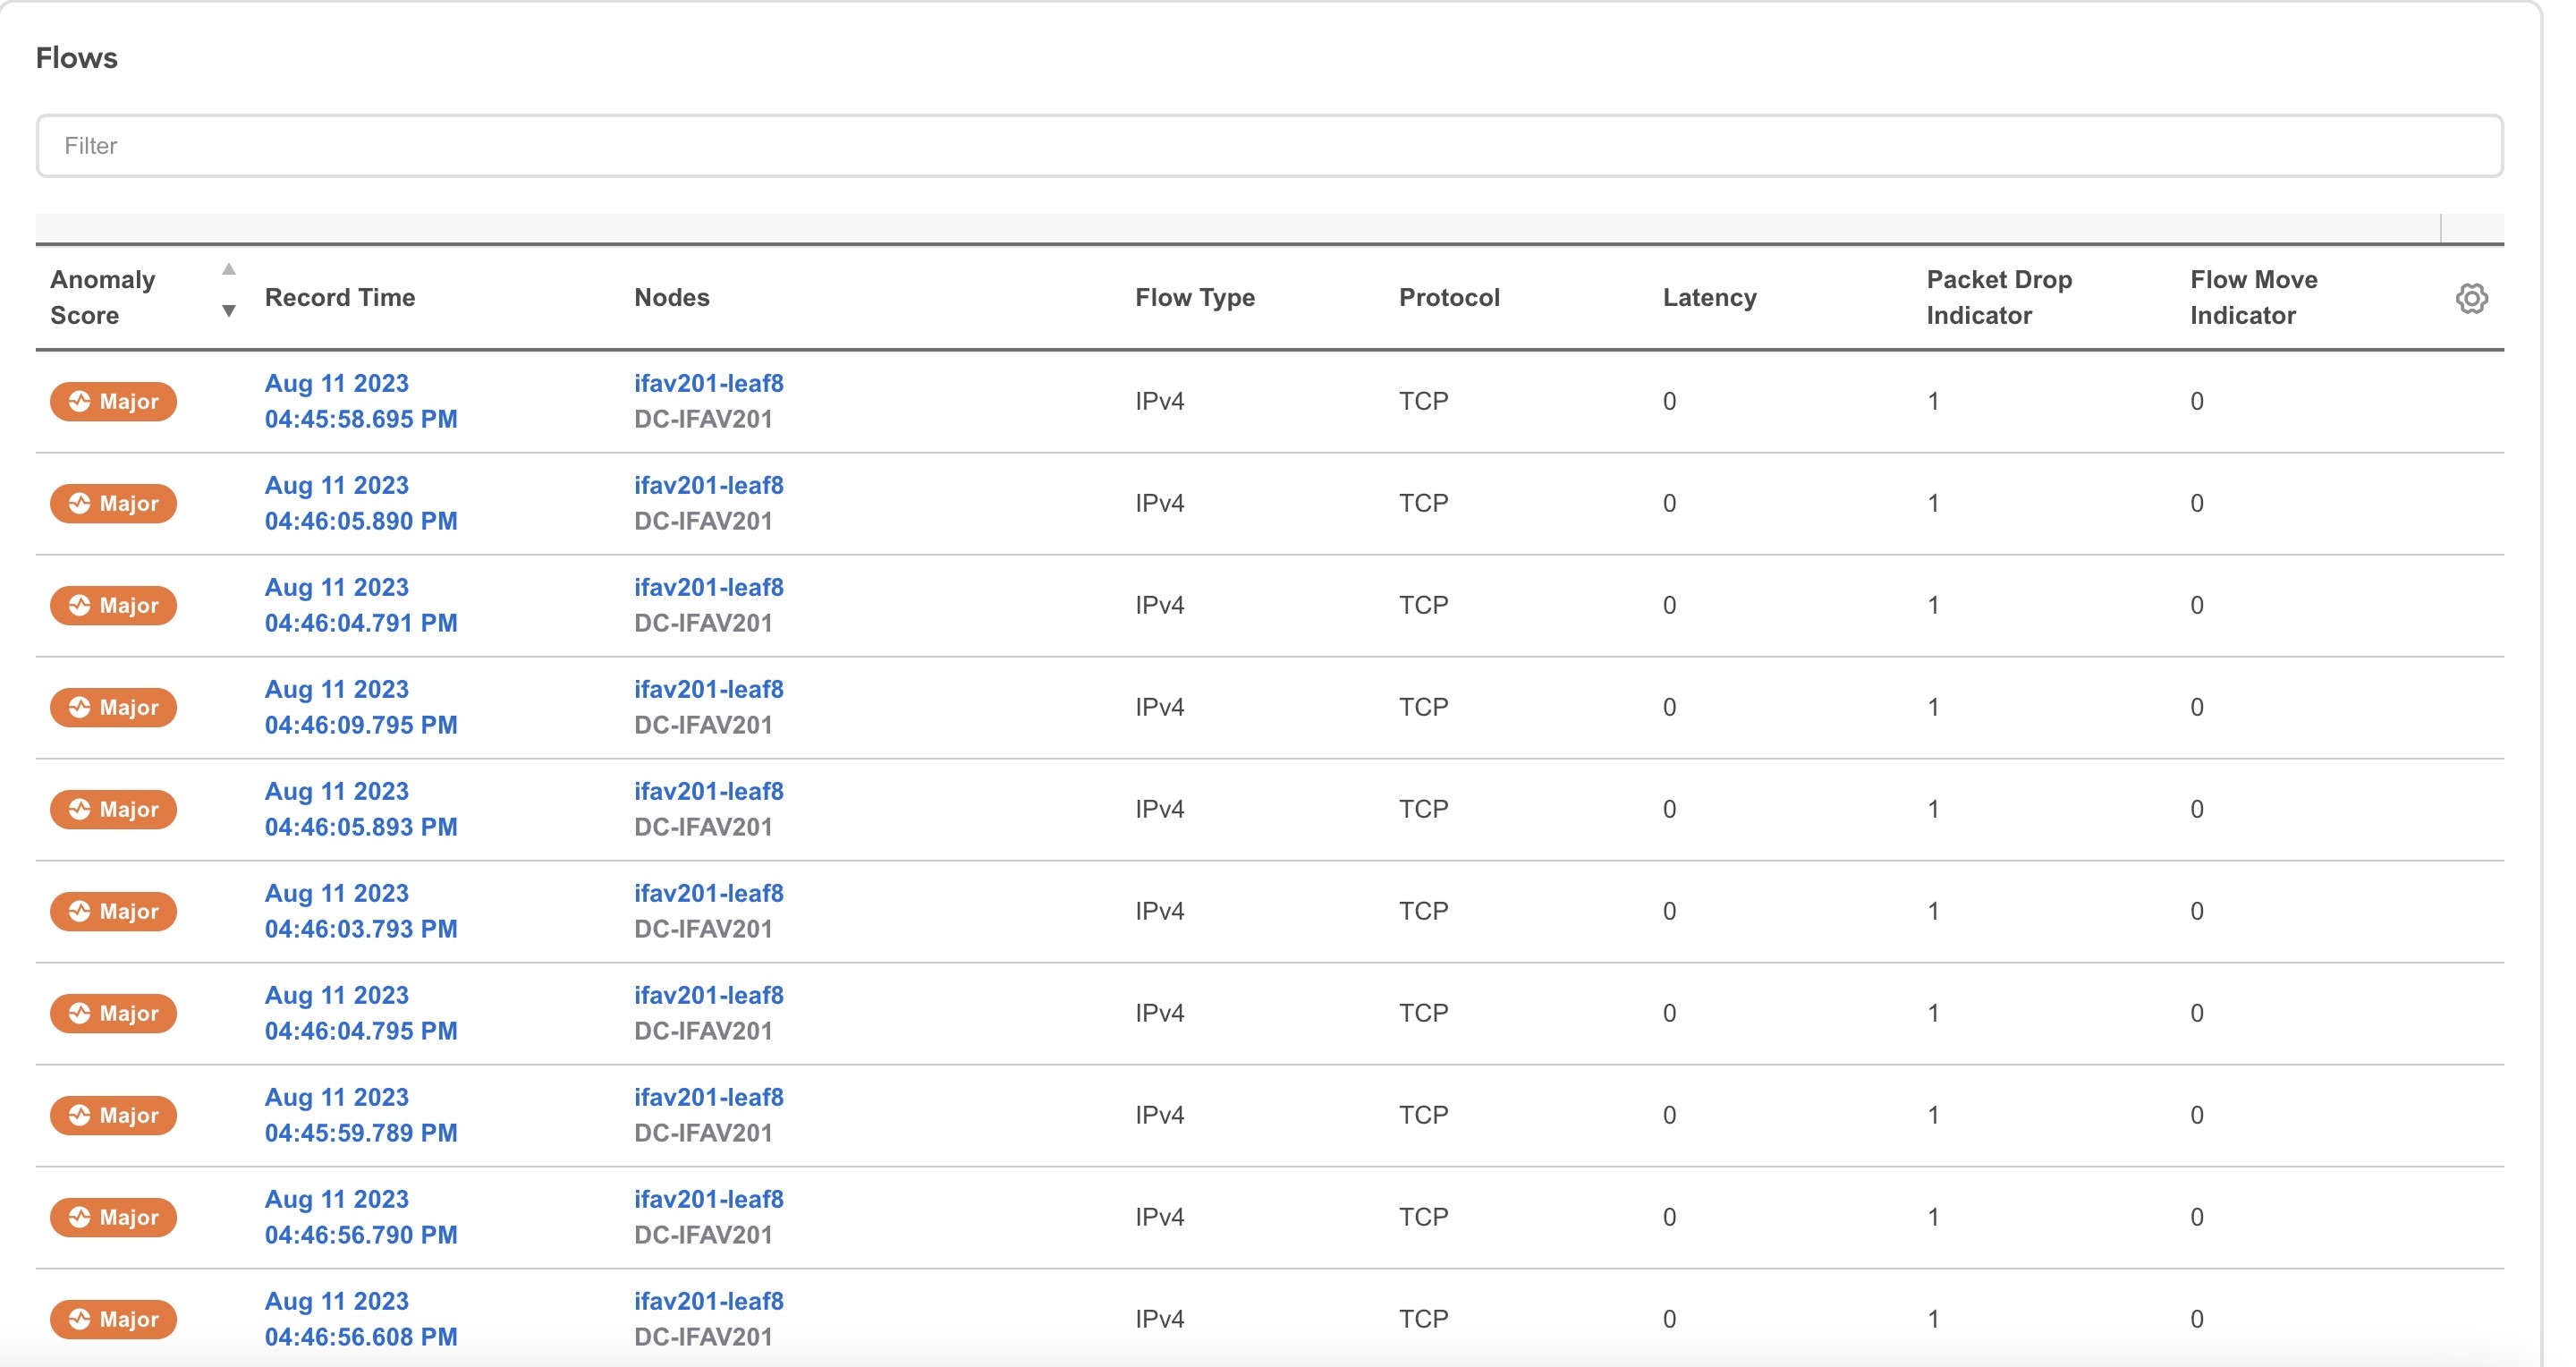
The Flows table displays information such as anomaly score, flow record time, nodes, flow type, protocol, latency, packet drop indicator.
-
Use the search bar to filter the flows. The Flows table displays the filtered flows. Click the column heading to sort the flows in the table.
-
Click Record Time to view the flow record details. The details include record time, flow type, aggregated flow information, ingress and egress information, flow path, anomalies, and trends for average latency, traffic, packet drop indicator, bursts.
L4-L7 Traffic Path Visibility
Starting with Nexus Dashboard Insights release 6.1.1, you now have expanded visibility in the Flow Path to L4-L7 external devices such as firewalls. Nexus Dashboard Insights tracks the end-to-end flow across the service chain in real-time and helps locate data plane issues across the device silos. In the current release, a non-NAT environment across all third-party vendors is supported.
For L4-L7 traffic path visibility, your flow telemetry must be enabled and the appropriate rules must be configured. See Getting Started. Based on your rules, if the flow is passing through Policy Based Redirects (for example, a firewall), it will display that information in the flow path.
To view traffic path visibility in the GUI,
-
Navigate to Manage > Fabrics.
-
Select Online Fabrics from the drop-down list.
-
Click a fabric name to view the fabric details.
-
Navigate to Connectivity > Flows.
-
Select a time range.
-
In the flows table, click Record Time to view the flow record details.
In the Path area, a graphical flow path will display the end-to-end information, from source to destination, and it will also identify the firewall in the path if a firewall is present. The graph also captures the end-to-end flow path network latency that is occurring. In the graph, if there are any anomalies, a red dot is displayed next to the symbol for the leaf switch or the spine switch.
-
Click Anomalies in the Flow Details page to view further details related to the anomaly.
In the current release firewalls are not supported for anomalies.
Guidelines and Limitations for L4-L7 Traffic Path Visibility
-
This feature is currently recommended only if Policy Based Redirect can be configured using the Service Graph for ACI.
-
In the current release, firewalls are not supported for anomalies.
-
In the current release, the latency information that is being displayed is the network latency, and it does not capture the latency that is occurring in the firewall.
-
In the current release, NAT is not supported.
-
This feature is currently supported if you use the following switches:
-
Cisco Nexus 9300-FX Platform Switches
-
Cisco Nexus 9300-FX2 Platform Switches
-
Cisco Nexus 9300-FX3 Platform Switches
-
Cisco Nexus 9300-GX Platform Switches.
-
-
Policy Based Redirect destinations on L3Out are not supported because such configurations use an internal VRF because of which only a partial flow path would be available.
-
In the ACI fabric, when the L4-L7 traffic is forwarding in Layer 2 (Bridged Mode), the flow analytics support is limited. Ingress and egress nodes detection will not be accurate, and path summary will not be available.
-
Without a service graph for L4-L7, if the client > service node is VRF_A and the service node > server is VRF_B, the paths will be recorded as separate flows as there is no common or single contract to stitch the flows.
-
Load Balancers are not supported.
Flow Telemetry Events
Flow telemetry events are enabled implicitly when flow telemetry is enabled. The flow telemetry enables triggering events when a configured rule is met, where packets are exported to the collector for analysis.
Flow telemetry events enhance and complement current flows in {PlatformFullName}. They enrich anomaly generation for flow telemetry and flow telemetry events.
It monitors security, performance, and troubleshooting. This is achieved using the periodic flow table event records exported every second.
The data export to {PlatformFullName} is done directly from the hardware without control plane needing to handle the data. Statistics are assembled as a packet with a configurable MTU size and a defined header. These packets are sent as in-band traffic from Cisco ACI fabric. Headers are configured by software, and packets streamed are UDP packets.
When flow telemetry is available for a triggered flow telemetry event, then you can navigate to flow details page for aggregated information. These events are based on the following drop events:
-
Buffer Drop—When the switch receives a frame and there are no buffer credits available for either ingress or egress interface, the frame is dropped with buffer. This typically hints at a congestion in the network. The link that is showing the fault could be full or the link containing the destination may be congested. In this case a buffer drop is reported in flow telemetry events.
-
Forward Drop—The packets that are dropped on the LookUp block (LU) of the Cisco ASIC. In a LU block a packet forwarding decision is made based on the packet header information. If the packet is dropped, forward drop is counted. There may be a variety of reasons when forward drop is counted.
-
RTO Inside—When a TCP retransmission happens for a flow due to a drop inside the fabric, an RTO inside anomaly is raised. This anomaly is aggregated across flows based on ingress node.
-
RTO Outside—When a flow experiences TCP retransmission, but there is no drop inside the fabric for that flow, then an RTO outside anomaly is raised. This anomaly is aggregated across flows based on ingress node.
Flow Telemetry Events Vs Flow Telemetry
-
The flow telemetry event packets are exported only when configured events occur, where as flow telemetry packets are streamed continuously.
-
The flow telemetry events are captured for all traffic, where as flow telemetry is captured for filtered traffic.
-
The total number of collectors between flow telemetry and flow telemetry events is 256.
Guidelines and Limitations for Flow Telemetry Events
-
The flow telemetry events do not report policing drop anomalies in {PlatformFullName}, when the egress data plane policer is configured on front-panel ports and there is traffic drop.
-
To export flow telemetry events on FX platform switches, you must configure flow telemetry filters. Starting with Cisco ACI-Mode Switch release 16.0(3), FX switches export flow telemetry events to indicate only buffer drops experienced by flows without the need to configure flow telemetry filters.
Multi-Site Traffic Path
Multi-Site Traffic Path Trace and Fault Correlation
This is a Beta feature. We recommend that you use features marked as Beta in your test environments but not in production deployments.
To monitor flows, you can stitch together flows from across two different fabrics into one single view. This enables you to have end-to-end views for the paths and end-to-end details for the particular flow and the latency information for that flow.
Use cases for Multi-Site Traffic Path Trace and Fault Correlation:
-
You can correlate flows across fabrics and display flow details with stitched paths.
-
You can monitor flows across fabrics and generate inter-fabric anomalies that are trigger based.
-
You can monitor flows across fabrics and provide the end-to-end latency.
Configure Multi-Site Traffic Path Trace and Fault Correlation
In the Explore area, you can view the flow path between two ports, their IP addresses, and their VRFs.
-
In Flows table, click Record Time to view the flow record details.
-
In the Flow Path area, in the flow path, click the Multi-Site Flow - View in Flow Explore tab to go to the Explore page.
In the Explore Flows page, the flow information filters in the Search field auto-populate, and you can see in which fabrics the flows exist. The View query area displays the information with the source IP address, source port information and the destination IP address, destination port information. Explore finds and returns all the fabrics where this flow was discovered for the specified VRF.
Next, select the appropriate source and destination fabrics to view their aggregated information, path summary, and anomalies. You must specify which fabric you want as your source and which fabric you want as your destination. Cisco Nexus Dashboard Insights will stitch the information based on your input. You can only choose one source and one destination at a time to stitch together this information. Based upon your selection of source and destination fabrics, Cisco Nexus Dashboard Insights returns the names of the fabrics that it finds.
In the Flow Path Summary area, details for the two fabrics are displayed in the Explore page as a graphical flow path that displays the end-to-end information, from source to destination. You can see the first fabric with the endpoint and a set of nodes and it is connected to the second fabric with the second set of nodes followed by the endpoint. It will also identify the firewall in the path if a firewall is present. The graph also captures the end-to-end flow path network latency.
Specific details for the source and the destination fabrics are displayed in each of the flows tables. In the Anomalies table, choose Grouped to view the grouped anomalies for your selections flows.
If you enter different flow details in the Search field in the Explore page, you can view in which fabrics those flow exists. Alternatively, in the Explore page, you can directly begin your search by entering details in the Search field for details about flows and the Flow Path across more than one fabric.
Copyright
THE SPECIFICATIONS AND INFORMATION REGARDING THE PRODUCTS IN THIS MANUAL ARE SUBJECT TO CHANGE WITHOUT NOTICE. ALL STATEMENTS, INFORMATION, AND RECOMMENDATIONS IN THIS MANUAL ARE BELIEVED TO BE ACCURATE BUT ARE PRESENTED WITHOUT WARRANTY OF ANY KIND, EXPRESS OR IMPLIED. USERS MUST TAKE FULL RESPONSIBILITY FOR THEIR APPLICATION OF ANY PRODUCTS.
THE SOFTWARE LICENSE AND LIMITED WARRANTY FOR THE ACCOMPANYING PRODUCT ARE SET FORTH IN THE INFORMATION PACKET THAT SHIPPED WITH THE PRODUCT AND ARE INCORPORATED HEREIN BY THIS REFERENCE. IF YOU ARE UNABLE TO LOCATE THE SOFTWARE LICENSE OR LIMITED WARRANTY, CONTACT YOUR CISCO REPRESENTATIVE FOR A COPY.
The Cisco implementation of TCP header compression is an adaptation of a program developed by the University of California, Berkeley (UCB) as part of UCB’s public domain version of the UNIX operating system. All rights reserved. Copyright © 1981, Regents of the University of California.
NOTWITHSTANDING ANY OTHER WARRANTY HEREIN, ALL DOCUMENT FILES AND SOFTWARE OF THESE SUPPLIERS ARE PROVIDED “AS IS" WITH ALL FAULTS. CISCO AND THE ABOVE-NAMED SUPPLIERS DISCLAIM ALL WARRANTIES, EXPRESSED OR IMPLIED, INCLUDING, WITHOUT LIMITATION, THOSE OF MERCHANTABILITY, FITNESS FOR A PARTICULAR PURPOSE AND NONINFRINGEMENT OR ARISING FROM A COURSE OF DEALING, USAGE, OR TRADE PRACTICE.
IN NO EVENT SHALL CISCO OR ITS SUPPLIERS BE LIABLE FOR ANY INDIRECT, SPECIAL, CONSEQUENTIAL, OR INCIDENTAL DAMAGES, INCLUDING, WITHOUT LIMITATION, LOST PROFITS OR LOSS OR DAMAGE TO DATA ARISING OUT OF THE USE OR INABILITY TO USE THIS MANUAL, EVEN IF CISCO OR ITS SUPPLIERS HAVE BEEN ADVISED OF THE POSSIBILITY OF SUCH DAMAGES.
Any Internet Protocol (IP) addresses and phone numbers used in this document are not intended to be actual addresses and phone numbers. Any examples, command display output, network topology diagrams, and other figures included in the document are shown for illustrative purposes only. Any use of actual IP addresses or phone numbers in illustrative content is unintentional and coincidental.
The documentation set for this product strives to use bias-free language. For the purposes of this documentation set, bias-free is defined as language that does not imply discrimination based on age, disability, gender, racial identity, ethnic identity, sexual orientation, socioeconomic status, and intersectionality. Exceptions may be present in the documentation due to language that is hardcoded in the user interfaces of the product software, language used based on RFP documentation, or language that is used by a referenced third-party product.
Cisco and the Cisco logo are trademarks or registered trademarks of Cisco and/or its affiliates in the U.S. and other countries. To view a list of Cisco trademarks, go to this URL: https://www.cisco.com/c/en/us/about/legal/trademarks.html. Third-party trademarks mentioned are the property of their respective owners. The use of the word partner does not imply a partnership relationship between Cisco and any other company. (1110R)
© 2017-2024 Cisco Systems, Inc. All rights reserved.