Adding vCenter to the ESXi Profiler
At the first login following installation of Hx Workload Profiler, you are redirected to the landing page where you can find the + Add Workload option on the top right corner of the page. You can select vCenter, then you can add multiple vCenters.
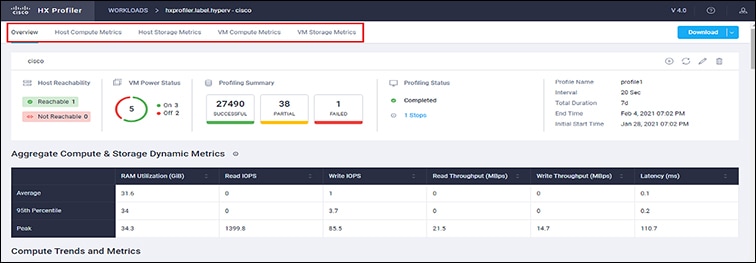
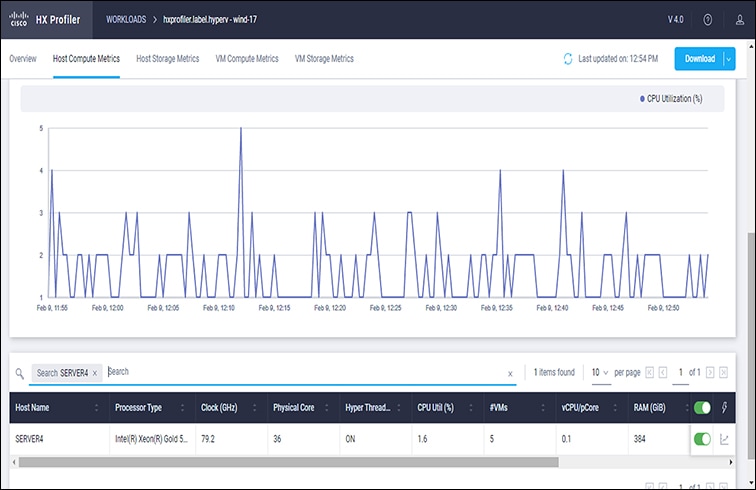
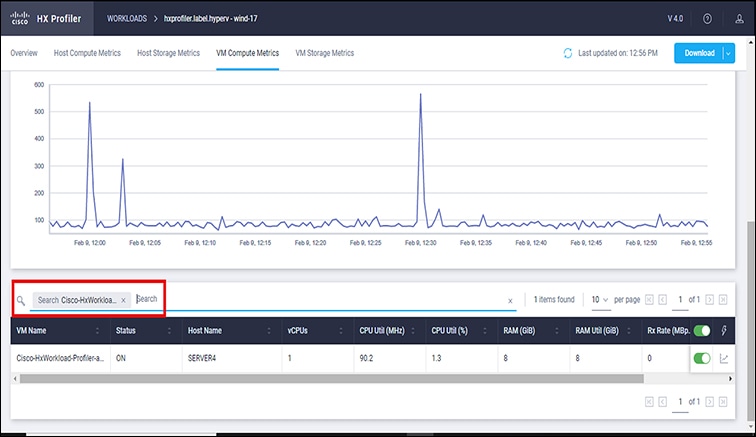
To calculate the metrics for a host, the Profiler captures the metrics for all the VMs on the Host. You then need to select the VM to be profiled. By default none of the VM’s are selected.
The workflow includes:
-
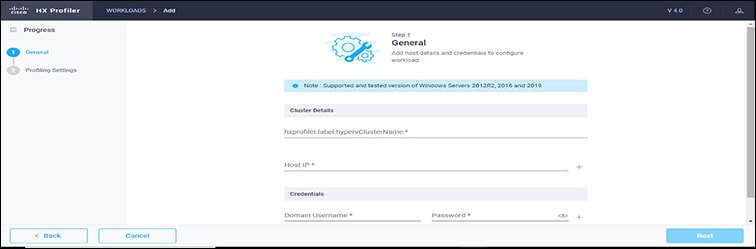
Node details tab: Records your vCenter details and then connects to the vCenter. If the connection succeeds, the Next button displays enabling you to select the hosts for profiling.
-
Select Hosts tab: Provides the vCenter details in hierarchy of vCenter, Datacenters, Clusters, and Hosts, with the option to select hosts to Profile. Default: All hosts in vCenter are selected.
-
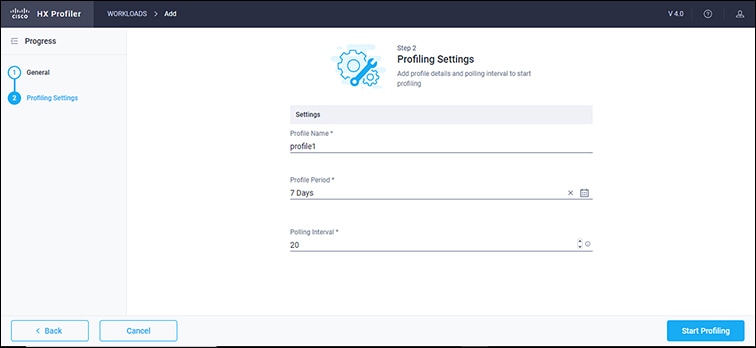
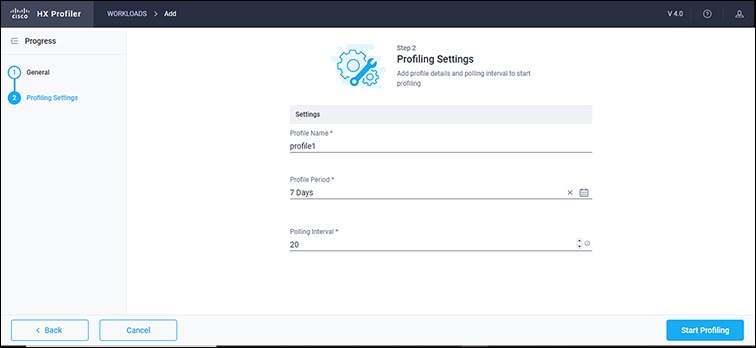
Profiling Setting tab, which provides:
-
Profile Name: for specifying the name of the profile which must be unique.
-
Profile period: for specifying the period of profiling. Default value is 7days and the minimum value is 1day.
-
Polling Interval: for specifies the frequency for which polling should occur.
-
Quick Profile: for a quick estimate
-
Detailed Profile: for detailed end-to-end profile results.
-
Procedure
| Step 1 |
Log in to the Profiler. See Logging in to the ESXi Profiler. |
||||||||||||
| Step 2 |
Follow the steps provided to enter values for the following options:
|
||||||||||||
| Step 3 |
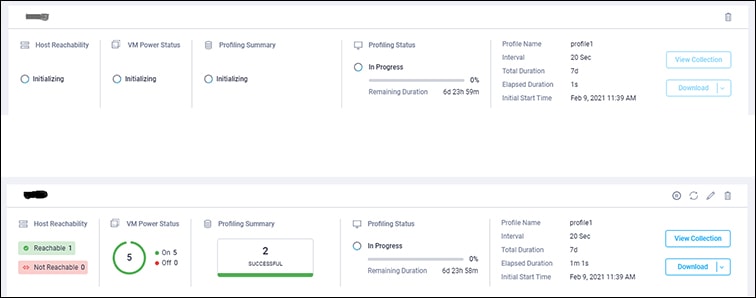
Click Start Profiling. The Profiler service starts automatically. |
||||||||||||
| Step 4 |
On the Poll filter tab, review the hierarchy values. |


 Feedback