Network Topology Overview
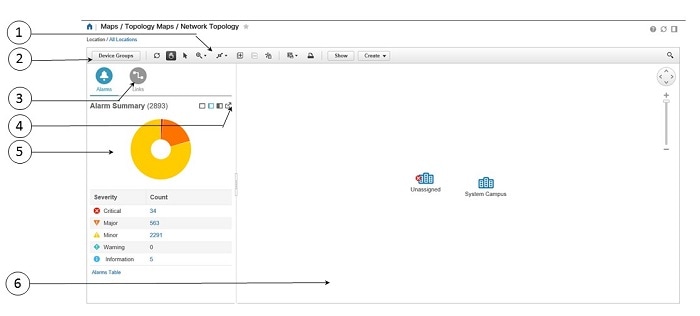
The Network Topology window presents a graphical, topological map view of devices, the links between them, and the active alarms on elements in the map. In addition, the Network Topology window provides access to map element tools and functions, and allows you to drill-down to get detailed information about map elements.
The Network Topology window is accessed from the left sidebar (). The content of the Network Topology window is determined by the device group you have selected. To select a device group, use the Device Groups panel on the left. From the Device Groups panel you can access the central device grouping functionality to create new groups, add devices to groups, and so on. See Create Groups of Devices for Easier Management and Configuration for more information.
Each Network Topology map is divided into a left pane that contains alarm and link information, and a right pane that displays the map itself. When the left pane is expanded, additional columns might be added to the tables in the tabs.
-
Alarm and Link Information (left pane)—Provides information relevant to the devices and topology shown in the map. - Alarm Summary—Shows all the current alarms for the selected group, categorized by alarm severity. In addition to a table showing the number of alarms for each alarm severity, the Alarm Summary tab provides a graphical pie chart view of the current alarms, which is color-coded based on alarm severity. This enables you to see, at a glance, the distribution of alarm severities and the number of alarms of each severity. In both the table and the pie chart you can drill down to see a table listing the actual alarms of that severity. To see all the alarms for the selected device group, click the Alarms Table link at the bottom of the Alarm Summary tab.
- Links—Lists the links relevant to the selected device group and shows the highest severity alarm on the link. Selecting a link in the table, highlights the link in the topology map. Clicking the Links Table link at the bottom of the tab launches a separate window with a table of links.
-
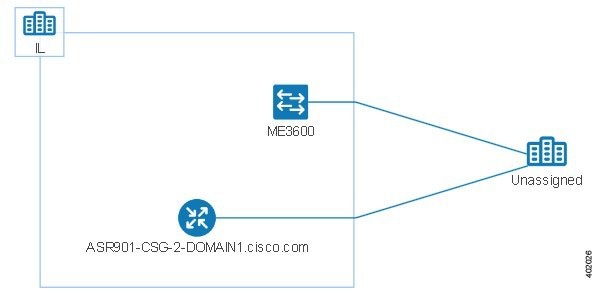
Topology map (right pane)—Displays the topology of the selected device group in graphical form. It displays the group’s devices and sub-groups (if any) and the links between them (Physical, Ethernet, and technology-specific links). It also displays the active alarms on the devices or links so that you can easily identify problems in the network. You can drill down from the topology map to detailed information about a device or link in order to troubleshoot problems. The topology map can be customized, filtered, and manipulated to show exactly the information you need.
|
1 |
Topology toolbar |
2 |
Device Groups pane |
|
3 |
Links pane |
4 |
Detach icon. Click the icon to open a detail window. |
|
5 |
Alarm Summary pane. Click Alarms Table to display the alarm detail window. |
6 |
Topology Map pane |

 Feedback