test
Available Languages

![]()


 Security Visibility for the Converged Plantwide Ethernet Architecture
Design and Implementation Guide
October 2023
 |
Document Reference Number: ENET-TD019A-EN-P

![]()


Preface
Converged Plantwide Ethernet (CPwE) is a collection of tested and validated architectures that are developed by subject matter authorities at Cisco®, Panduit®, and Rockwell Automation®. The testing and validation follow the Cisco Validated Design (CVD) and Cisco Reference Design (CRD) methodologies. The content of CPwE, which is relevant to both operational technology (OT) and informational technology (IT) disciplines, consists of documented architectures, best practices, guidance, and configuration settings to help industrial operations with the design and deployment of a scalable, reliable, secure, and future-ready plant-wide industrial network infrastructure. CPwE can also help industrial operations achieve cost reduction benefits by using proven designs that can facilitate quicker deployment while helping to minimize risk in deploying new technology.
Cybersecurity is a critical aspect of the CPwE architecture. Manufacturers face unprecedented challenges and threats and the CPwE Network Security CVD outlines a holistic approach to securing production systems. The Network Security CVD outlines four key requirements for Industrial Cybersecurity: Visibility, Segmentation, Anomaly Detection, and Mitigation and Intent Based Security. The CPwE Security Visibility Design and Implementation Guide (DIG) focuses on the Visibility requirement. This design and implementation guidance is based on testing and validation by Cisco Systems and Rockwell Automation.
This solution replaces the Visibility recommendations in the Network Security CVD which outlines security visibility achieved via a combination on Cisco Identity Services Engine (ISE) and FactoryTalk® Network Manager™ (FTNM). In that solution, FTNM collected information about connected Industrial Automation and Control System (IACS) devices and passed that into ISE, which is a limited form of visibility. This version provides visibility of the industrial assets, their communication flows and what is contained in those flows, representing a more comprehensive security visibility.
Document Organization
This document is composed of the following chapters and appendices:
| Description |
|
| Chapter 1, CPwE Security Visibility Overview |
Provides an overview of Security Visibility in CPwE including business value, key use cases, components and how it fits into the reference architecture. |
| Chapter 2, Design Considerations |
Covers the design considerations including hardware requirements, placement of sensors in various topologies, licensing considerations and performance. |
| Chapter 3, Operational considerations |
Describes how to use Security Visibility tools and information, highlighted by the major use cases.
|
| Chapter 4, Integrating Security Visibility |
Describes how to interface Security Visibility information and events with other cybersecurity functions, including security policy and orchestration. |
| Chapter 5, Deploying, Configuring, Verifying, and Troubleshooting Security Visibility |
Covers deployment and configuration guidelines. Provides troubleshooting information. |
| Appendix A, References |
Describes the Cisco Validated Design (CVD) process and the distinction between CVDs and Cisco Reference Designs (CRDs). List of references for CPwE design and implementation guides for network infrastructure services and security. |
| Appendix B, Test Profile |
Hardware and software components, topologies used and validated results from the CPwE Security Visibility testing. |
| Appendix C, Acronyms and Initialisms |
List of acronyms and initialisms that may be used in this document. |
For More Information
More information on CPwE Design and Implementation Guides can be found at the following URLs:
• Rockwell Automation site:
– https://www.rockwellautomation.com/en-us/capabilities/industrial-networks/network-architectures.html
• Cisco site:
– http://www.cisco.com/c/en/us/solutions/enterprise/design-zone-manufacturing/landing_ettf.html
• Panduit site:
Note This release of the CPwE architecture focuses on EtherNet/IP™, which uses the ODVA, Inc. Common Industrial Protocol (CIP™) and is ready for the Industrial Internet of Things (IIoT). For more information on EtherNet/IP, CIP Sync™, CIP Security™, and DLR, see odva.org at the following URL:
• http://www.odva.org/Technology-Standards/EtherNet-IP/Overview

![]()
 |
CPwE Security Visibility Overview
Converged Plantwide Ethernet (CPwE) helps to enable IACS network and security technology convergence using standard Ethernet, Internet Protocol (IP), network services, security services, and EtherNet/IP. Convergence brings in the best of IT networking and security tailored for supporting IACS applications and helps to enable the Industrial Internet of Things (IIoT), where an increasing amount of IACS devices are sharing data with evermore applications for optimization. However, in many production environments, manufacturers lack an understanding of what is connected to the network, which user, devices and applications are communicating with each other, and what they are communicating. This lack of visibility makes it more challenging to secure and protect these critical systems, especially as more applications and services will be connecting to more of the IACS assets for digitization use cases. This document is specifically focused on using the network infrastructure to gain visibility of the networked devices and communication patterns to improve the cybersecurity stance of the production environment.
After defining and securing the network perimeter, cybersecurity visibility is the second stage and a key part of the defense-in-depth security approach outlined in the CPwE Network Security CVD. As industrial networks can be quite old, widely dispersed, and involve many contractors, operators often don’t have an accurate inventory of what’s on the network. Visibility of the current network devices and IACS assets present in the production network is critical for the OT-IT security team to design and deploy a comprehensive industrial security access policy.
Existing IT network monitoring tools are unable to gain full visibility of IACS network devices and IACS assets in a plant-wide network because the IACS assets communicate with IACS protocols. There is a need for industrial cybersecurity tools that can gain full visibility of IACS assets and communication present in a plant-wide IACS network and pass this information to a security access policy design and implementation solution.
This document describes the design, deployment, and operations of Cisco Cyber Vision as a key means to operationalize Security Visibility in production systems and integrate the intelligence into the rest of the cybersecurity capabilities. Adding the
Cisco industrial cybersecurity tool, Cyber Vision, is a significant enhancement from the existing CPwE Network Security guidance that relied on Cisco Stealthwatch (now known as Cisco Secure Network Analytics) and NetFlow telemetry information from the network infrastructure.
By understanding the IACS devices and their communication protocols, Cyber Vision provides rich context of the IACS devices and their communication that NetFlow and Secure Network Analytics cannot provide. Additionally, Cyber Vision provides
industrial specific insights and risk analysis. NetFlow data and Secure Network Analytics are valuable and provide a level of security visibility but lack the IACS context. Therefore, this document represents significant enhancement to the NetFlow and Stealthwatch design and implementation guidance found in the Network Security within a Converged Plantwide Ethernet Architecture Design and Implementation Guide.
Security Visibility Business Value
Security visibility is a key component of an overall cybersecurity approach for Industrial Automation and Control. The visibility enables Manufacturers to better understand and manage risk in the production environments, helping them to:
· Develop a sense of security risk by identifying the assets and devices connected to the network and their security stance by comparing against known risks and threats.
· Develop an in-depth understanding of the industrial communication flows within the production system on which security policy can be established.
· Monitor the connected assets and communication flows for changes or anomalies that could indicate a compromise.
In addition, key advantages using Cisco Cyber Vision include:
· Builds a real-time inventory of assets in your industrial network.
· Boosts operational efficiency by seeing the up-to-date communication status of assets helping to resolve issues more quickly.
· Integrates the production environment into enterprise security processes and procedures making it easier to manage risk and enforce security policy.
· Deploys and operates at scale and with minimal expense by using the network infrastructure.
Security Visibility provides cybersecurity protection to the entire production environment. Identifying risky assets and devices allows manufacturers to prioritize updates during maintenance windows. Understanding the communication flows allows manufacturers to develop and deploy security policies that further protect the Industrial Automation systems from threats. The ability to identify changes or anomalies in the communications helps to quickly identify threats so that an appropriate response can be launched. These advantages help maintain production uptime, product and worker safety and reduce the costs of compromises when they do occur.
Security Visibility Use Cases
Use cases described in this design and implementation guide include:
· Asset Visibility
· Security Posture
· Operational Insights
· Intrusion Detection
Cisco Cyber Vision leverages a unique combination of passive and active discovery to identify all assets, their characteristics, and their communications. The Cisco Cyber Vision’s unique edge computing architecture embeds security monitoring components within select Cisco/Rockwell industrial network equipment, for example Catalyst and Stratix® switches. There is no need to source dedicated appliances and install them in the industrial networks. There is no need to build an out-of-band network to send industrial network flows to a central security platform. Cisco Cyber Vision enables the industrial network to collect the information required to provide comprehensive visibility, analytics, and threat detection.
Cisco Cyber Vision combines protocol analysis, intrusion detection, vulnerability detection and behavioral analysis to help you understand your security posture. It automatically calculates risk scores for each component, device, and any specific parts of your operations to highlight critical issues so that you can prioritize what needs to be fixed. Each score comes with guidance on how to reduce your exposure so you can be proactive and build an improvement process to address risks.
Cisco Cyber Vision automatically uncovers the smallest details of the production infrastructure: vendor references, firmware and hardware versions, serial numbers, rack slot configuration, and so on. It identifies asset relationships, communication patterns, and more. Information is shown in various types of maps, tables, and reports.
Cisco Cyber Vision gives OT engineers real-time insight into the actual communication status of industrial processes, such as I/O traffic has stopped or controller modifications have been recently performed, so that production staff can quickly troubleshoot issues and maintain uptime. Cyber experts can easily dive into all this data to investigate security events. Chief information security officers have all the necessary information to document incident reports and drive regulatory compliance.
Cisco Cyber Vision integrates the Snort Intrusion Detection System (IDS) engine in select platforms leveraging Talos subscription rules to detect known and emerging threats such as malware or malicious traffic.
Intrusion sensors are systems that detect activity that can compromise the Confidentiality, Integrity, or Availability (CIA) of information resources, processing, or systems. An Intrusion Detection System (IDS) can analyze traffic from the data link layer to the application layer to identify things such as network attacks, the presence of malware, and server misconfigurations. An Intrusion Prevention System (IPS) can identify, stop, and block attacks.
The advantage of IDS deployments over IPS is that they create no risk of taking down the IACS. This advantage may be due to “false positives,” where the IDS or
IPS detects a condition that it believes to be an anomaly or attack, when in fact it is business-critical traffic. Because IDS systems are typically not inline, they have no effect on network performance statistics such as propagation delay and jitter (variations in delay). Another risk of IPS solutions is that a catastrophic failure of the
IPS system may cause a complete lack of connectivity. This type of failure is of less concern if solutions are designed with ample redundancy and without single points of failure.
It is recommended that OT networks adopt a hybrid IDS/IPS deployment,
where IDS is deployed in the operational zone of the network for security alerting and then deploys an IPS north of the critical zone (for example at the Industrial Data Center) where a false positive would not stop plant operations.
NOTE: Due to the recent availability of this feature, it was not deployed and tested in the process of developing this CVD. Therefore, it will not be referenced in the following design or implementation guidance.
Security Visibility: IT and OT
Security Visibility has been a critical consideration for Enterprise networks ever since the wide adoption of standard networking. IT standards, tools and applications have been developed to monitor, probe, and assess network communication in Enterprise systems. CPwE has included those capabilities in the Network Security within a Converged Plantwide Ethernet Architecture Design and Implementation Guide. Those tools and capabilities are relevant to Plant systems – especially where IT servers running common- OS (for example, MS Windows) applications. They identify the devices on the network, who is talking to whom, and often identify the communication protocols used to monitor for risks and threats.
![]() For example, Cisco Secure Analytics, formerly Stealthwatch provides enterprise-wide network visibility and applies advanced security analytics to detect and respond to threats in real time. Using a combination of behavioral modeling, machine learning, and global threat intelligence, Stealthwatch can quickly, and with high confidence, detect threats such as command-and-control (C&C) attacks, ransomware, distributed-denial-of-service (DDoS) attacks, unknown malware, and insider threats. With a single, agentless solution, you get comprehensive threat monitoring, even if it is encrypted. Stealthwatch focuses on Enterprise IT networks and requires the packets to have an IP address. It is recommended for network devices on level 3 to 5 in the Purdue model.
For example, Cisco Secure Analytics, formerly Stealthwatch provides enterprise-wide network visibility and applies advanced security analytics to detect and respond to threats in real time. Using a combination of behavioral modeling, machine learning, and global threat intelligence, Stealthwatch can quickly, and with high confidence, detect threats such as command-and-control (C&C) attacks, ransomware, distributed-denial-of-service (DDoS) attacks, unknown malware, and insider threats. With a single, agentless solution, you get comprehensive threat monitoring, even if it is encrypted. Stealthwatch focuses on Enterprise IT networks and requires the packets to have an IP address. It is recommended for network devices on level 3 to 5 in the Purdue model.
Industrial Automation and Control Systems, the OT systems, contain different devices, speak protocols that are not found in IT networks, and have significantly different communication flows. Therefore, tools that understand the IACS devices and their communication are required. This design and implementation guide is focused on providing the OT security visibility using Cisco Cyber Vision.
How Security Visibility Works
Security Visibility provided by Industrial Cybersecurity tools essentially collect and analyze, in other words Deep Packet Inspection (DPI), of the Industrial Automation and Control traffic. Based on this analysis, they can determine details of what is connected to the network, which devices or applications are communicating with each other (flows), and what they are communicating. This data drives the four use cases:
asset visibility, security posture, operational insights, and intrusion detection. DPI allows you to gather device information such as the model, brand, part numbers, serial numbers, firmware and hardware versions, rack slot configurations, and more to give you information about connected assets. Based on a knowledge of known risks and threats, a security posture can be assessed.
DPI decodes all communication flows and extracts message contents and packet headers, providing the visibility communication patterns for operational insights and the background to create security policies to secure them. It allows you to understand what is being communicated over the network. For example, you can see if someone is attempting to upload new firmware into a device or trying to change the variables used to run the industrial process.
![]() To achieve complete visibility, all network traffic must be inspected. It is important to note that in an industrial network, most traffic occurs within the Cell/Area zone, because that is where the controllers, sensors, and actuators are deployed. Relatively little traffic goes up to the Site or Manufacturing level applications.
To achieve complete visibility, all network traffic must be inspected. It is important to note that in an industrial network, most traffic occurs within the Cell/Area zone, because that is where the controllers, sensors, and actuators are deployed. Relatively little traffic goes up to the Site or Manufacturing level applications.
Note: CIP Security allows for the integrity and confidentiality of industrial communications. The confidentiality is achieved through encryption. Cyber Vision and other Industrial Cybersecurity tools are not designed to decrypt and analyze this communication and would only identify the communication flow.
When collecting network packets to perform DPI, security solution providers typically configure SPAN ports on network switches and employ one of three architectures:
· Send all traffic to a central server that performs DPI.
· Deploy dedicated sensor appliances on each industrial network switch.
· Send traffic to dedicated sensor appliances deployed at various locations on the network.
While these approaches deliver network visibility, they also bring new challenges. Configuring network switches to send traffic to a central server requires duplicating network flows. A new out-of-band network will generally be needed to transport this extra traffic, which can be complex and costly. Although this can be acceptable for a small industrial site, the cost of deploying such a “telemetry” network on most sites is overwhelming and potentially more expensive than the production network itself.
Connecting sensor appliances to network switches addresses the issues associated with duplicating network traffic over existing or new “telemetry” networks. The appliance collects and analyzes network traffic locally and only sends telemetry data to a server for additional analysis and storage. Installing, managing, and maintaining dedicated hardware can quickly lead to cost and scalability issues. Because most industrial traffic is local, gaining full visibility requires deploying appliances on every switch on the network, raising cost and complexity to intolerable levels.
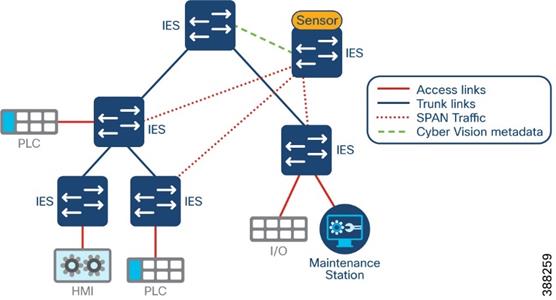
Some technology providers attempt to address this problem by leveraging remote SPAN (RSPAN). RSPAN allows you to duplicate traffic from a switch that does not have a sensor appliance to a switch that has one.
Figure 1 Using SPAN to Gain Visibility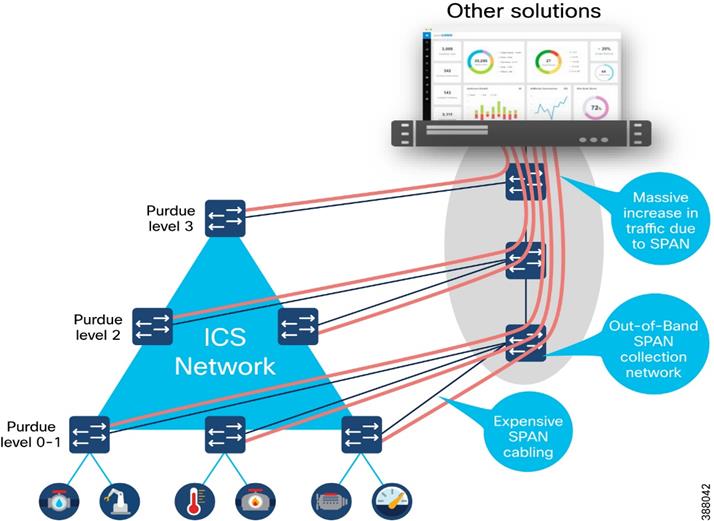
This approach reduces the number of appliances required to provide full visibility and significantly increases the amount of traffic on the industrial network. Traffic is multiplied because the duplicated traffic is sent to a remote switch with SPAN. And the more traffic on the network, the slower it becomes, resulting in congestion, increased latency and/or jitter — often an unacceptable compromise in industrial networks where processes need to run faster and machines must be timely synchronized.
An Alternative to SPAN
A better way to achieve full network visibility is to embed DPI capability (sensors) into existing network hardware. An industrial-grade switch with native DPI capability eliminates the need to duplicate network flows and deploy additional appliances.
Obtaining visibility and security functionality is simply a matter of activating a feature within the network switch, router, or gateway. Cost, traffic, and operational overhead are all minimized.
Figure 2 Using Network Sensors to Gain Visibility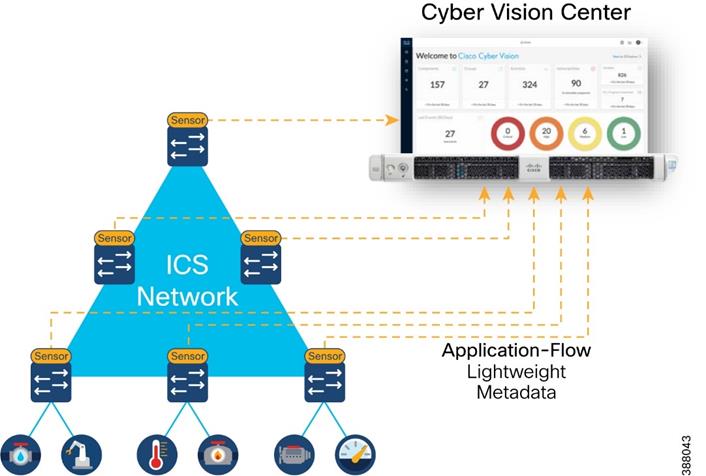
A DPI-enabled switch analyzes traffic locally to extract meaningful information. It only sends lightweight metadata to a central server, which runs the analytics and anomaly detection. That metadata represents about 3-5% of general traffic. The traffic is so lightweight, it can be transferred over the industrial network without causing congestion or requiring extra bandwidth. Embedding DPI in network equipment affords both IT and OT unique benefits. IT can leverage the existing network infrastructure to secure industrial operations without having to source, deploy, and manage additional hardware. Because these network elements see all industrial traffic, embedded sensors can provide
analytical insights into every component of the industrial control systems. As a result, OT can obtain visibility into operations that it has never had before.
A complete asset discovery is important for IACS networks to gain an understanding of all the devices on the network and their associated security risks. For passive discovery to be effective, sensor placement is important and is discussed later in the document. However, it is difficult to determine how much of the network has adequately been discovered as assets can only be “seen” as they generate traffic seen by a sensor.
Gaining a complete picture takes time and can only be determined by information that is transmitted by the asset.
Active discovery is an on-demand mechanism for gaining asset visibility. Active discovery works by sending precise and nondisruptive requests in the semantics of the specific IACS protocols, so visibility gaps can be filled. However, there are some misconceptions regarding active discovery due to the many ways in which it can be implemented.
An important misconception is that active discovery causes unexpected crashes. It is true that IT-focused asset discovery tools have caused issues through indiscriminate network scans that overload IACS devices. But most IACS vendors have developed valid protocol commands supported by the industrial assets. These commands are like what the IACS vendor products use for asset management and are non-disruptive. The reason why old IACS devices are susceptible to crash during active scanning is because they have limited processing power for network functions and get overwhelmed when repeated connection attempts are made for communication. The reason for the crashes has less to do with valid or invalid commands being used but rather a factor of how many connection attempts are being made by the active discovery solution.
From a network hygiene standpoint, it is not uncommon to see industrial networks poorly designed with all devices being addressed from a flat /16 IP subnet. Most Industrial Cyber Security (ICS) solutions available in the market today are based on a centralized architecture where traffic mirroring (SPAN) is used to feed an appliance (or a software VM) located at Level-3 of the Purdue model that does the Passive Discovery.
When the bolt-on Active Discovery capability of these solutions initiates a scan from this central location, they need to cycle through a range of IP address within the scan range. Now, one of the first things that needs to happen to establish communication for Active Discovery is to resolve ARP. These ARP requests are seen by all devices within the flat network, and it is the processing of the barrage of ARP requests that can overwhelm the networking stack on legacy ICS devices causing them to crash.
While this is not the only reason for legacy devices crashing, it is a common cause. Our design and implementation guidance is to deploy smaller VLANs
(maximum size about 250 devices) as Active Discovery on over-sized VLANs is not recommended.
In addition, in most multi-vendor IACS environments, centralized discovery solutions sitting at Level-3 of the Purdue model are not aware of the specific protocol being used at the Level 0-2 edge. This requires the scanning process to cycle through a range of IACS protocols (CIP, PROFINET, Modbus, etc.) until the device responds based on the protocol it supports. This results in unnecessary communication attempts that can also overwhelm the processing power of legacy devices causing disruption.
Centralized active discovery solutions in ICS tools cannot penetrate Network Address Translation (NAT) boundaries. Industrial networks are usually built up of Cell/Area Zones that are comprised of machines or control systems supplied by machine builders and system integrators. It is common practice for these machines, especially in discrete manufacturing, to be built in a standardized manner with IACS devices across machines configured in a cookie-cutter approach with repeating IP addresses.
Consequently, industrial networks apply Network Address Translation (NAT) to allow the operations and control systems located in the Level-3 to communicate with IACS devices sitting in the lower levels with duplicate IP addresses.
To address translation, only a small fraction of ICS devices such as Process Automation Controllers (PAC), Human Machine Interface (HMI), or Remote Terminal Unit (RTU), communicate with the site operations layer, and only those devices’ IP address are translated at the NAT boundary. The implication is that centralized Active Discovery solutions cannot communicate with many IACS devices (like IO, drives, safety devices, relays) sitting below the NAT boundary because their IP addresses are not translated. In the automotive manufacturing industry, for example, it is typical for less than 17% of devices in level 0-2 to be visible to a centralized Active Discovery solution. This results in an 83% gap in visibility!
To mitigate this gap, it is recommended that networks use a hybrid approach of active and passive discovery. The section “Cisco Cyber Vision Active Discovery” shows how Cisco Cyber Vision addresses these misconceptions to provide a unique approach to IACS device visibility.
Vulnerability Assessment and Managing Risk
Security Posture is basically an assessment of the vulnerability and risk of discovered devices on the industrial network. The vulnerabilities and risks for a wide range of industrial devices are typically imported by the ICS tool (Cyber Vision) and compared to the discovered assets. The following is a description of how the vulnerability assessment is made.
A vulnerability is a weakness in a system or its design that can be exploited by a threat. Vulnerabilities are sometimes found in the protocols themselves, as in the case of some security weaknesses in TCP/IP. Often the vulnerabilities are in IACS device firmware and applications.
A threat is any potential danger to assets. A threat is realized when someone or something identifies a specific vulnerability and exploits it, creating exposure. If the vulnerability exists theoretically, but has not yet been exploited, the threat is latent and has not been realized. The entity that takes advantage of a vulnerability is known as the threat agent or threat vector.
A countermeasure is a safeguard that mitigates a potential risk. A countermeasure mitigates risk by either eliminating or reducing a vulnerability, or by reducing the likelihood that a threat agent can successfully exploit the risk.
Risk is a function of the likelihood of a given threat source exercising a particular potential vulnerability, and the resulting impact of that adverse event on the organization.
Threat x Vulnerabilities x Impact = Risk
Risk management is the process that balances the operational and economic costs of protective measures and the achieved gains in mission capability by protecting assets and data that support their organizations’ missions. For example, many people decide to have home security systems and pay a monthly fee to a service provider to monitor the system for increased protection of their property. Presumably, the homeowners have weighed the cost of system installation and monitoring against the value of their household goods and their family’s safety priority. Risk limitation limits a company’s risk exposure by taking some form of action. It is a strategy employing a bit of risk acceptance along with a bit of risk avoidance. It is the most used risk mitigation strategy.
The objective of a vulnerability assessment is to ensure that the network and the information systems are tested for security vulnerabilities in a consistent and repeatable manner. Security vulnerabilities will continue to be discovered in technology products and services. These vulnerabilities, regardless of whether they are caused by an unintentional software bug or by design (such as a default administrative Managing Risk password), can be used by malicious persons to compromise the confidentiality, availability, or integrity of your infrastructure.
Hardware and software vendors typically provide software fixes when they announce the vulnerabilities in their products. When there is no fix available, vendors typically provide a workaround or mitigation. There is usually a period between the announcement of a security vulnerability in a particular technology and the availability of an attack method (an exploit). Within this period, system administrators should take action to protect their systems against an attack because at this point, the public knows that a flaw exists, but attackers are still trying to find a way to take advantage of that vulnerability. Unfortunately, the vulnerability-to-exploit period has been steadily decreasing.
With the large quantity of new vulnerabilities from numerous vendors, it can be overwhelming to track all the vulnerabilities. How can the security team analyze any single vulnerability and determine its relevance to the specific technology architecture? The solution is to have a good process to determine which ones are relevant to your organization.
The Common Vulnerability Scoring System (CVSS) provides a way to capture the principal characteristics of a vulnerability and provides a better understanding of the risk that is posed by each vulnerability. CVSS is a free and open industry standard for assessing the severity of computer system security vulnerabilities. CVSS attempts to assign severity scores to vulnerabilities, allowing responders to prioritize responses and resources according to threat. Scores are calculated based on a formula utilizing several metrics that approximate ease of exploit and its impact. Scores range from 0 to 10, with 10 being the most severe.
CVSS provides a standard way to assess and score security vulnerabilities. CVSS analyzes the scope of a vulnerability and identifies the privileges that an attacker needs to exploit it. CVSS allows vendors to better analyze the impact of security vulnerabilities and more clearly define the level of urgency that is required to respond to the vulnerability. While many analysts use only the CVSS base score for determining severity, temporal and environmental scores also exist, and factoring in the likelihood and the criticality to a given network environment.
Cisco Cyber Vision includes the Cybersecurity and Infrastructure Security Agency (CISA) list of known, exploited vulnerabilities catalog when creating CVSS risk scores.
Intrusion Detection / Prevention Systems
Intrusion sensors are systems that detect activity that can compromise the Confidentiality, Integrity, or Availability (CIA) of information resources, processing, or systems. An Intrusion Detection System (IDS) can analyze traffic from the data link layer to the application layer to identify things such as network attacks, the presence of malware, and server misconfigurations.
An Intrusion Prevention System (IPS) can identify, stop, and block attacks that would normally pass through a traditional firewall device. When traffic comes in through an interface on an IPS, if that traffic matches an IPS signature/rule, then that traffic can be dropped by the IPS. The essential difference between an IDS and an IPS is that an IPS can respond immediately and prevent possible malicious traffic from passing. An IDS produces alerts when suspicious traffic is seen but is not responsible for mitigating the threat.
The advantage of IDS deployments is that they create no risk of taking down the network. This advantage may be due to “false positives,” where the IDS detects a condition that it believes to be an anomaly or attack, when in fact it is business-critical traffic. Because IDS systems are not inline, they have no effect on network performance statistics such as propagation delay and jitter (variations in delay).
Another risk of IPS solutions is that a catastrophic failure of the IPS system may cause a complete lack of connectivity. This type of failure is of less concern if solutions are designed with ample redundancy and without single points of failure.
It is recommended that OT networks adopt a hybrid IDS/IPS deployment, where IDS is deployed in the operational zone of the network for security alerting and then deploy an IPS north of the critical zone (for example at the Industrial Data Center) where a false positive would not bring down plant operations.
Security Visibility Components
Cyber Vision Center
Cisco Cyber Vision Center is a central platform gathering data from all the Edge Sensors and acting as the monitoring, detection, and management platform. It can be deployed as a software or hardware appliance depending on your network requirements. Consider the number of sensors, components, and flows to decide the appropriate installation. At the time of writing this guide, a single Cisco Cyber Vision Center can support 150 sensors, 50,000 components, and 8 million flows. For the most up-to-date scale numbers see the Platform Support section in the Cyber Vision Data Sheet.
For deployments that are too large for a single instance of Cisco Cyber Vision to handle, or for organizations who wish to aggregate multiple sites into a single dashboard view, a Cisco Cyber Vision Global Center instance can aggregate up to 20 local Cisco Cyber Vision Centers. Cisco Cyber Vision Global Center is used for security monitoring across multiple sites, providing a consolidated view of components, vulnerabilities, and events. Nevertheless, sensor operation and management activities can be done only on instances of Cisco Cyber Vision Center associated with the sensor.
Cyber Vision Sensor
Cisco Cyber Vision sensors are embedded in select Cisco/Stratix networking equipment, so you don’t have to deploy dedicated appliances or build an out-of-band SPAN collection network. Cisco Cyber Vision sensors passively capture and decode network traffic using DPI of industrial control protocols. Since Cisco Cyber Vision sensors decode industrial network traffic at the edge, they only send lightweight metadata to the Cisco Cyber Vision Center, only adding 2-5% load to your industrial network.
Cisco Cyber Vision sensors also have the capability to do active discovery. These active discovery requests originate from the sensor, deep into the IACS network, so these messages are not blocked by firewalls and originate under (NAT) boundaries.
Cyber Vision Sensors can be deployed on the following infrastructure:
· Stratix® 5800 models 1783-MMS10EA, 1783-MMS10EAR, 1783-MMS10A, 1783- MMS10AR
· Cisco IE 3300, 3400 and 9300 industrial switches
· Cisco Catalyst 9300 and 9400 switches
· Cisco IR 1100 and 8300 industrial routers
· Cisco IC 3000 Industrial Compute Gateways
Cyber Vision in the CPwE Architecture
The following is a depiction of the Security Visibility components inserted into the CPwE reference architecture.
Figure 3 Cyber Vision in CPwE Architecture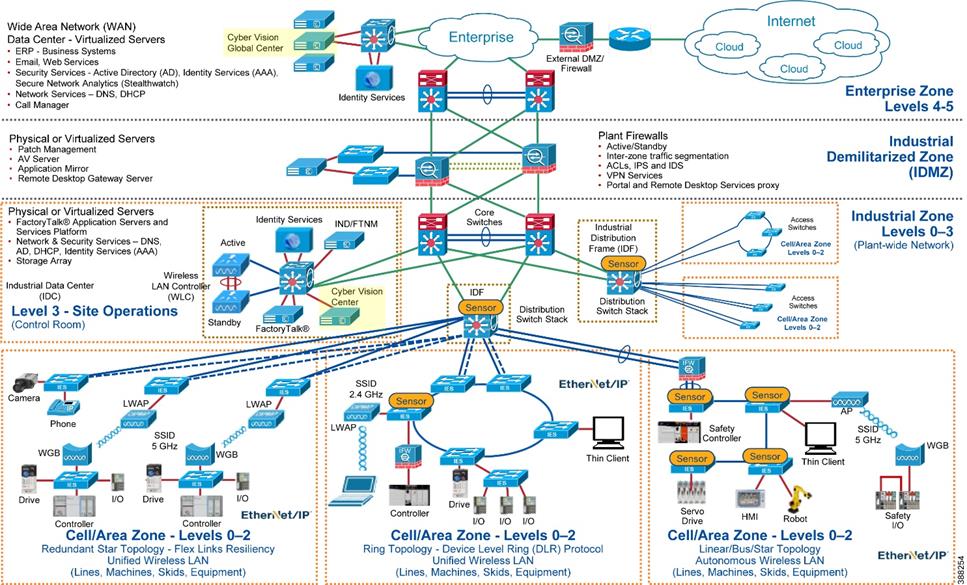
Table 1 lists all the Cisco and Rockwell Automation components in this design.
Table 1 Cisco and Rockwell Automation Components
| Role |
Model |
Software Release |
Comments |
| Layer 2 Industrial Ethernet Switch |
Allen-Bradley Stratix 5800 Cisco IE 3400 |
17.6.x |
Provides connectivity to IACS assets at Levels 0-2 |
| Distribution Switch |
Cisco Catalyst 9300 |
17.6.x |
Distribution/Aggregation switch connecting the Cell/Area Zones |
| Cisco Cyber Vision Center |
|
4.1 |
Industrial Security Visibility |
| Cisco Identity Service Engine |
|
3.0 |
Policy Access Control |
| Stealthwatch Management Console |
|
6.10.2 |
Dashboard |
| Core Switch |
Cisco Catalyst 9500 |
17.6.x |
Provides network core switching functionality network |

 |
CPwE Security Visibility – Design Considerations
This chapter describes the CPwE Security Visibility design considerations including description of the system (HW and SW) components, their placement within the CPwE architecture and topologies, licensing, and scale/performance considerations.
Cyber Vision Center
This section covers the design considerations for the deployment of the Cyber Vision Center. Cyber Vision Center is the main user interface and management application for the Security Visibility function.
Selection of Cisco Cyber Vision appliance depends on the required scale. Scale is defined by the number of sensors, components, and flows.
· Sensors refer to Cisco Cyber Vision Sensors installed on the network
· Component refers to endpoints identified by the sensors
· Flow refers to the data flow between two endpoints
For scale appliance limits and comparison refer to the Cisco Cyber Vision Datasheet.
Cisco Cyber Vision Center Placement
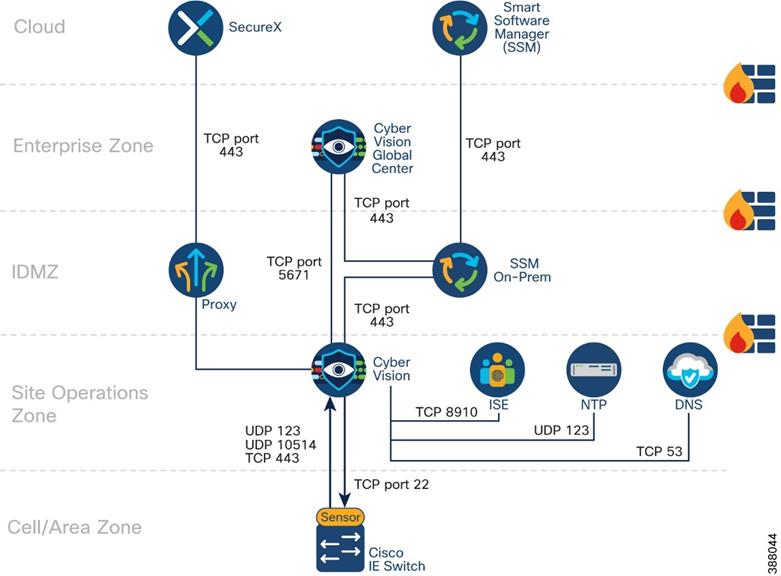
The architectural recommendation is to deploy Cisco Cyber Vision Center in the Industrial Zone. Cisco Cyber Vision connects to the sensor in the cell/area zone and applications in the industrial zone such as NTP and optionally DNS and ISE.
Figure 4 depicts communications flows from Cisco Cyber Vision center. Note that Cisco Cyber Vision Center can operate without any connectivity leaving the industrial zone. The flows in the diagram that meet this condition are optional and its purpose will be explained in
this guide.
![]() Figure 4 Cisco Cyber Vision Communication Ports
Figure 4 Cisco Cyber Vision Communication Ports
If a central view of the multiple Cyber Vision centers is required, the Cisco Cyber Vision Global Center could be installed in a zone that integrates multiple Cyber Vision Center
instances. Cyber Vision Global Center is deployed in the enterprise zone or in the cloud. The Cisco Cyber Vision Global Center is not detailed in this CVD; for more information refer to Cisco Cyber Vision Architecture Guide, Release 4.1.0.
Cisco Cyber Vision Center Deployment Considerations
In Cisco Cyber Vision, the administrator network interface gives access to the graphical user interface (GUI) and the collection network interface connects the Center to the sensors. Ethernet interfaces are allocated in the following way:
· Administration network interface (eth0) gives access to the user interface (GUI or API), to
the CLI through SSH and is used for communication with other systems (syslog collector or SIEM, pxGrid, etc.)
· Collection network interface (eth1) connects the Center to the sensors
If the admin and collection network share the same local area network (LAN), the Center must be configured to use a single interface. In this case the admin and collection interface should share a single IP address on eth0, and eth1 is reserved as a collection interface for DPI on the Center. The recommendation for CPwE network architecture is to use a single interface for administration and collection.
![]() Figure 5 Cisco Cyber Vision Center Interfaces
Figure 5 Cisco Cyber Vision Center Interfaces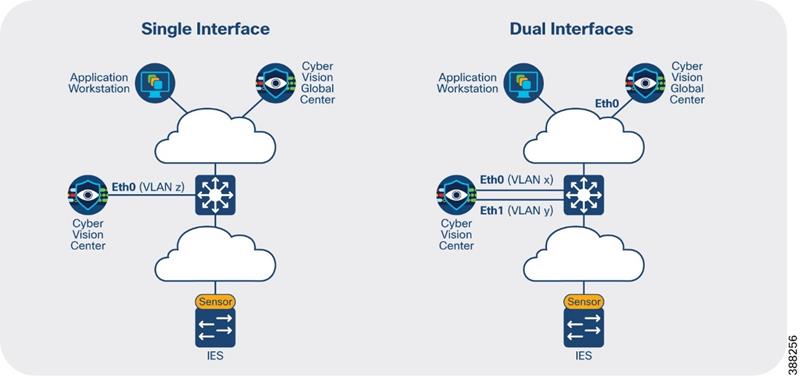
Licensing
Cisco Cyber Vision Center requires a license, which depends on the number of internal devices discovered and seen by Cisco Cyber Vision in the last 60 days.
Licensing is available in two tiers—Essentials and Advantage—that provide different levels of capabilities. This design was validated using the Advantage license. More information on license levels is available on the Cyber Vision Data Sheet.
Licenses must be available in a Cisco Smart Account to register product instances. The following options are available:
· Direct cloud access to Cisco Smart Software Manager (SSM): Cisco Cyber Vision has a direct connection to the SSM cloud.
· Cloud access via https proxy: Cisco Cyber Vision uses a web proxy such as the Umbrella
Secure Internet Gateway to send information to Cisco SSM.
· Cisco Smart Software Manager On-Prem: Usage information is sent to a local appliance. Cisco SSM On-Prem would reside in the IDMZ, and information is periodically sent to the SSM cloud.
· Offline: Licenses are reserved in SSM and applied manually.
The option validated in this design is Cisco Smart Software Manager On-Prem. Cisco Cyber Vision uses TCP port 443 to register to the licensing server.
Cyber Vision Sensor
Cisco Cyber Vision Sensor Hardware Options
The sensors are supported on the platforms listed in Table 2.
Table 2 Platform Support for Cisco Cyber Vision Sensors
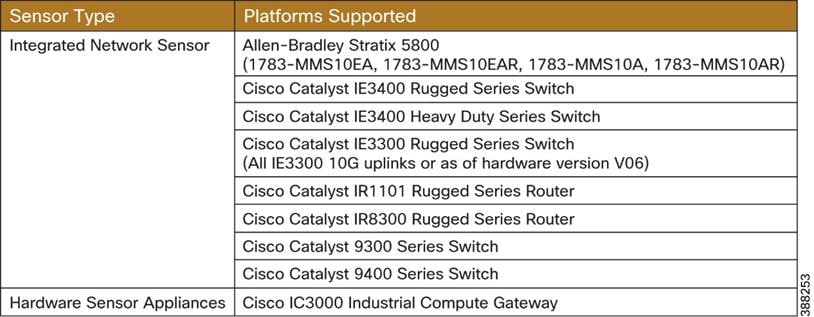
In this design guide, the Catalyst IE3400 and Allen-Bradley® Stratix® 5800 switches are deployed within Cell/Area Zones and the Catalyst 9300 is used as the distribution switch. For the most up-to-date support information visit the Cisco Cyber Vision Platform Support page.
Cisco Cyber Vision Sensor Deployment Requirements
To deploy Cyber Vision sensors on network infrastructure, the following requirements apply:
· Cisco Cyber Vision Sensors are installed as an IOx application, an application run-time environment. IOx is included with Essentials and Advanced licenses of Cisco Switches.
· IOx applications need an SD card (Industrial switches) or SSD Disk (Catalyst 9300) to be installed. These parts are optional on the switch order configuration.
· SSD requirements for sensor running on Catalyst 9300: a Cisco USB drive must be used; non-Cisco USB drives are not supported.
· SD card requirements for industrial switches: 4GB Cisco SD card must be used for Cisco
Industrial switches and a 8GB Rockwell Automation SD card must be used on Stratix switches.
· Sensors need an IP address to communicate with the Cisco Cyber Vision Center (collection
interface). For network sensors deployed in IOx, this IP address needs to be different from other IP addresses on the switch. Although it can belong to any VLAN on the switch, it is recommended that the IP address is assigned on the management network.
· The sensor also needs a capture interface to reach the monitor session in the switch. This has local significance only, so VLAN used for RSPAN to the sensor should be private to the switch.
· Cisco Cyber Vision Sensor application will receive ERSPAN traffic. On Catalyst IE3x00 and Allen-Bradley Stratix 5800 due to ERSPAN overhead it is recommended to not update the MTU of the platform above 1940 bytes. Otherwise, large packets above 1940 will not be
received by the sensor application.
· The following ports are needed for Cisco Cyber Vision Center – Cisco Cyber Vision Sensor communication.
o From Cisco Cyber Vision Sensor to Cisco Cyber Vision Center
§NTP (UDP port 123) - sensors can be configured to connect to other time sources
§TLS 1.2 (TCP port 443) for initial setup only
§Secure Syslog (TCP port 10514)
§AQMPS (TCP port 5671)
o From Cisco Cyber Vision Center to Cisco Cyber Vision Sensor
§ SSH (TCP port 22), IC3K only and for administration tasks only (not required for normal operation)
§ (Optional for installation using sensor manager extension) TCP port 443 for network sensors and TCP port 8443 for hardware sensors.
o (optional) for both: SNMP traps (UDP 162) to send traps to an SNMP server
Note: make sure that ports are allowed on the traffic path.
Effective Sensor Deployment
The effectiveness of the Cisco Cyber Vision solution depends on effectively capturing traffic, so deciding the correct location for the sensor in the network is critical.
Visibility inside a Cell/Area Zone
To gain visibility on the cell area zone, the recommended option is to deploy the network sensor on the industrial switches. A sensor is deployed at the edge to capture flows for end devices. Deploying the network/hardware sensor at a switch where a controller is attached is an ideal choice to monitor the traffic because all the IO devices respond to the poll requests initiated by the controller. Flows that do not traverse the network sensor will not be visible on Cisco Cyber Vision Center. To increase coverage, consider the following options:
· Dedicated sensor per switch: to capture all traffic in the Cell/Area Zone, a sensor can be deployed at every switch, resulting in none of the flows being missed.
· Dedicated sensor in aggregation switch: to capture intra-zone communication between two small sub segments of a Cell/Area Zone, a sensor can be deployed at the aggregation point to capture traffic that crosses the subsegments.
· Enable SPAN: traffic can be spanned from network ports to either dedicated sensor devices (for example, the ICA3000) or sensors on capable access or distribution switches.
Note: Consider the performance limitations of the target sensor device and the additional network load that the spanned traffic may create. See the section below on Sensor performance and bandwidth for more detail.
Note: avoid enabling both ACCESS and TRUNK port mirroring, as it doubles the number of packets fed to the DPI engine and the bandwidth used if the mirrored traffic is sent over RSPAN.
Visibility for flows leaving the Cell/Area zone
A sensor deployed on the distribution switch, such as the Catalyst 9300, will capture flows that leave the Cell/Area Zones. This deployment option is helpful to understand zone-to-zone/north-south communication patterns. Keep in mind that this option is not a replacement for sensors on the cell/area zone since few of the intra-zone communication traffic would be seen, resulting in missing the most important communication flows in industrial automation networks.
Note: There are no licensing implications for deploying sensors at every possible location. Cisco Cyber Vision licensing is based on the number of endpoints in which it detects and adds additional value to. A sensor can be deployed on every compatible switch in the network.
Warning: Be careful when collecting data at higher levels (distribution level), especially if Internet traffic is being monitored. Monitoring Internet flows in addition to traffic on the industrial network will significantly increase the number of devices (and components)
present in the Center database.
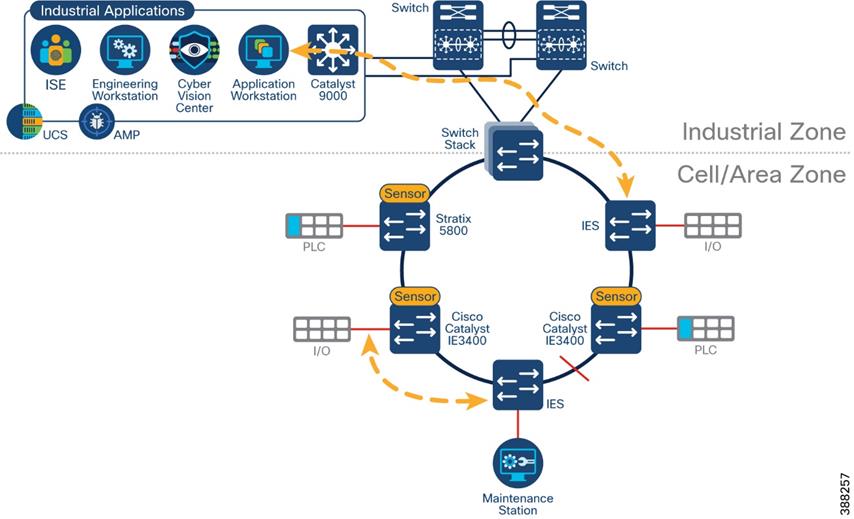
Ring Topologies considerations
Visibility of flows in a ring may change depending on observation point and actual traffic path. Figure 5 illustrates a REP ring, with current alternate port the two flows depicted will be missed with selected sensor placement. Installing a sensor on the Catalyst 9300 would provide visibility to the north-south flow. It is important to note that the maintenance station to I/O flow may not be detected if the flow does not cross the distribution switch unless more sensors are deployed.
![]() Figure 5 Sensor Deployment in Ring Example
Figure 5 Sensor Deployment in Ring Example
Cisco Cyber Vision on NAT Topologies
The way in which network devices are represented is determined by the point at which data is captured. To clearly identify meaningful process data and asset properties from your environment, such as vendor name or firmware version, Cisco Cyber Vision Sensors should be deployed as close to the system under consideration as possible. For a topology with Network Address Translation (NAT), this means deploying sensors before the translation.
![]() Consider the traffic flow depicted in Figure 6. The observed MAC address, IP address and VLAN change depending on the observation point as explained below.
Consider the traffic flow depicted in Figure 6. The observed MAC address, IP address and VLAN change depending on the observation point as explained below.
Figure 6 Sensor Deployment on NAT topologies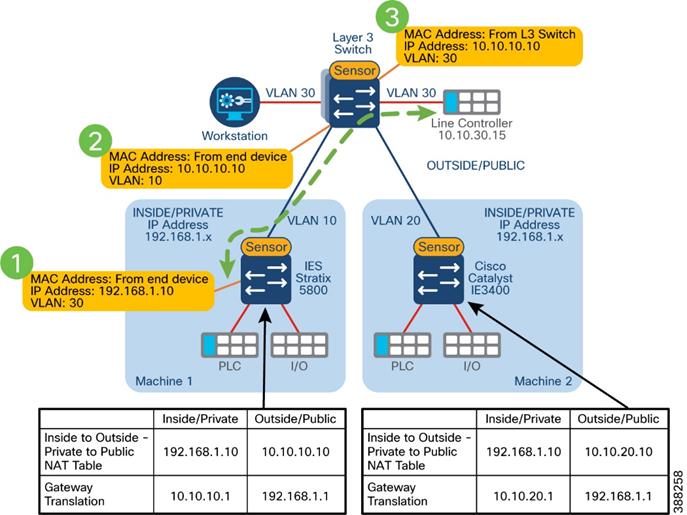
· Capturing in point 1 shows original attributes for endpoint connected on the inside (MAC, IP, VLAN) This is the recommended capturing point because it captures real endpoint attributes.
· Capturing in point 2 shows original MAC and VLAN but the IP address is already translated.
· Capturing in point 3 shows MAC address from the layer 3 switch (the packet has been routed), destination VLAN and translated IP address.
The recommendation in NAT topologies is to deploy sensors in the access switch and monitor access ports only (point 1 in the figure).
Brownfield Considerations
For a brownfield deployment without switches that is capable of running Cisco Cyber Vision Sensor, enable SPAN on switches connected to a separated switch (only for monitoring) that will aggregate traffic and send it to a sensor. This deployment requires a single sensor (hardware or network options are supported). It also requires additional cabling from every device to the SPAN aggregation point.
Note: When using this approach, consider using a Gigabit port if available on switches spanning traffic to sensor. If Gigabit ports are not available, carefully select the ports that are spanned, for example select ports connected to PACs and HMIs.
![]() Figure 7 Deploying Cisco Cyber Vision on Brownfield Networks
Figure 7 Deploying Cisco Cyber Vision on Brownfield Networks
Cisco Cyber Vision Active Discovery
With Cisco Cyber Vision, Active Discovery is initiated by the Cisco Cyber Vision Sensor embedded in the Cisco IE switches that are distributed at the edge of the industrial network. The active discovery is a closed-loop system between the passive and the Active Discovery components. It works by the passive discovery first listening to the traffic on the network and then informing the active discovery component on which protocols are present on that section of the network. The active discovery component then initiates a broadcast hello request in the semantics of specific IACS protocol at play, and the passive discovery component decodes the response from the IACS devices. When needed the active discovery component may initiate a unicast command to collect further information from the
discovered devices.
Cisco Cyber Vision Active Discovery is non-disruptive. The fact that the passive and active components are embedded on the switches at the very point where the IACS devices connect to the network enables Cisco Cyber Vision discovery to be extremely precise and non-disruptive. Cisco Cyber Vision does not scan the network, instead it sends hello packets to devices for selected industrial protocols. There is no longer a need to enter IP scan ranges nor is there a need to guess which protocol is being used on a specific machine or process at the edge of the network. The intelligence built into the closed-loop system automates the active discovery. The user simply must enable Active Discovery and has full control to
activate the capability on a per switch basis if needed.
Cisco Cyber Vision Active Discovery is not handicapped by the presence of NAT. Cisco recognizes the need for NAT in industrial networks and simplifies the process by providing
L2 NAT (mapping between inside and outside IPs bound to MAC address) capability at line rate on the IE and Stratix switches. This eliminates the need to deploy additional L3 NAT devices. But regardless of whether L2 or L3 NAT is used, by virtue of the Passive and Active components of the Cisco Cyber Vision Sensor being embedded in the IE and Stratix switches, the Active Discovery is distributed and is initiated from below the NAT layer which results in 100% visibility to the IACS devices on the industrial network.
Active Discovery Considerations
· Active discovery can be enabled and disabled in a sensor. When enabled, discovery jobs are launched every 10 minutes for selected protocols. Active discovery can be disabled completely or per protocol when not needed.
· During installation, there is an option to select active discovery. If you plan to use active discovery functionality, make sure to select it during installation. Once the sensor is installed, active discovery can be turned on and off as required.
· Active discovery supports four broadcast protocols (EtherNet/IP, Siemens S7, PROFINET, ICMPv6) and two unicast protocols (EtherNet/IP and SNMP)
· For broadcast discovery, the sensor needs to be configured with an IP address in the subnet that needs to be discovered. It may use the sensor IP address, if that corresponds to the subnet to be discovered. Otherwise additional IP addresses may be configured for the discovery. There are no needed modifications for active discovery on the switch configuration running the Cisco Cyber Vision sensor application. For Unicast discovery, the target subnet/VLAN must be either directly accessible from the sensor, or the sensor must have the required gateway or route to reach the targeted devices.
· Active discovery can be enabled on the collection interface. Additionally, a sensor can perform active discovery in different subnets. In this case, it needs an IP address in each subnet. The AppGigabitEthernet port on the switch used for communications to reach the IOx virtual application is configured as a trunk, enabling the sensor to have multiple active
discovery interfaces.
· Installing a sensor with active discovery functionality does not start the active discovery process. An Active Discovery policy containing the protocols needed and their respective parameters needs to be created first and activated in a preset with the sensor.
Sensor Performance and Bandwidth
Cyber Vision sensors running on access/distribution switches or dedicated sensor devices have limitation in the number of packets that can be processed. Maximum number of packets per second supported by Cisco Cyber Vision sensors are listed on
Cisco Cyber Vision Architecture Guide, Release 4.1.0.
To reduce the load on sensors, consider the following:
· Reduce the number of spanned ports/interfaces. Spanning from interfaces where PAC/PLCs are connected typically catch much of the Cell/Area zone traffic and other devices may bring limited additional value, particularity if a sensor is installed on the distribution switch to observe all traffic entering or leaving the Cell/Area zone. Avoid monitoring both ACCESS and TRUNK ports, as it doubles the number of packets fed to the DPI engine and the bandwidth used if the mirrored traffic is sent over RSPAN.
· Filter spanned traffic at the source. ACLs applied at the source interface can be used to limit the number of packets a sensor receives and deduces the bandwidth impact. For example, the ACL can allow only key types of traffic, like IACS traffic. NOTE: The unspanned traffic will not be analyzed and will not be represented in the Cyber Vision Center.
The following is an example of an ACL configured to filter out CIP Class 1 traffic on the industrial switch, Cisco IE3400. The ACL removes traffic sent to or from UDP port 2222 with the objective to lower the volume of messages sent to the sensor, in this loss of visbility of the produce/consume messages. In the example, the sensor will receive CIP Class 3 traffic and any other non-CIP flows.
Ip access-list extended filterClass1
10 deny udp any any eq 2222
20 permit ip any any
After creating the ACL, apply it as a filter on the monitoring session to the sensor.
Monitor session 1 filter ip access-group filterClass1
For more filtering options refer to the configuration guide: https://www.cisco.com/c/en/us/td/docs/switches/lan/cisco_ie3X00/software/17_3/b_network_mgmt_17-3_iot_switch_cg/m-span-cg.html#task_gbj_hbq_mgb
· Filter in the sensor itself. The sensor can be configured to drop/ignore traffic. Cisco Cyber Vision Center allows for four settings: ALL, OPTIMAL, INDUSTRIAL, and CUSTOM. See the Sensor Installation for more detail on each setting.
The bandwidth required to link a Sensor and its Center is largely the product of the traffic on the OT network monitored by the Sensor. Incoming bandwidth and the protocols used significantly impact the size of the DPI results. These directly affect the bandwidth required between the Sensor and Center. Bandwidth required for standard applications is less than 0.5% of the incoming traffic. Although some applications could require up to 5% of the incoming traffic.
Note: if standard quality of service is in place, telemetry traffic will be treated as best effort with a lower priority than IACS traffic.
Sensors will store data locally when the Center is unreachable. When communications recover, the Sensor will try to send all the flow tables it has stored locally as soon as possible. Without policies (e.g. quality of service settings) to prevent it, the Sensor could overwhelm the link during this transmission. The amount of time the sensor can store telemetry data when offline is highly dependent on the platform and amount of data temporarily stored. The sensor does not indicate loss of telemetry data.

 |
CpwE Security Visibility – Operational Considerations
This chapter describes operational considerations for Security Visibility. It details the main use cases and describes how to use these functions in an operational Security Visibility deployment.
Getting Ready To Use Cyber Vision
This section addresses key steps to take before using Cyber Vision that make the key use cases more beneficial. The section assumes familiarity with Cisco Cyber Vision navigation, refer to the Cisco Cyber Vision GUI User Guide for more information.
Organizing Cyber Vision information
Cisco Cyber Vision information is displayed and organized for optimum use. Three concepts are introduced: Groups, Presets, and Baselines.
Groups
The first thing to do when using Cisco Cyber Vision is to organize components in a meaningful way. Devices and components can be organized into groups to add meaning to your network representation. For example, this can be done according to the device location, process, severity, type, etc. A device is associated with only one group, but it is possible to
create nested groups inside a parent group, that is, add a group into another group to create
several layers and structure the data.
It is recommended to use groups to organize components according to industrial processes or areas. Furthermore, the group can be assigned an industrial impact which has a direct impact on the risk score.
Some benefits of using groups are:
· Groups can be used as a filter when building a preset. This allows to monitor a specific production process or area of the plant.
· Groups simplify network map visualization by aggregating the devices and activities on the view. Aggregated activities are called conduits. The following figure shows a network map for a specific process and the communication conduits.
· Identify inter cell/process flows by looking at the map and seeing conduits leaving the area.
· Provide context to ISE for profiling of devices. See “Role of Cisco Cyber Vision in Trustec based Segmentation”.
Figure 8 Visualize Assets and flows on a Production Process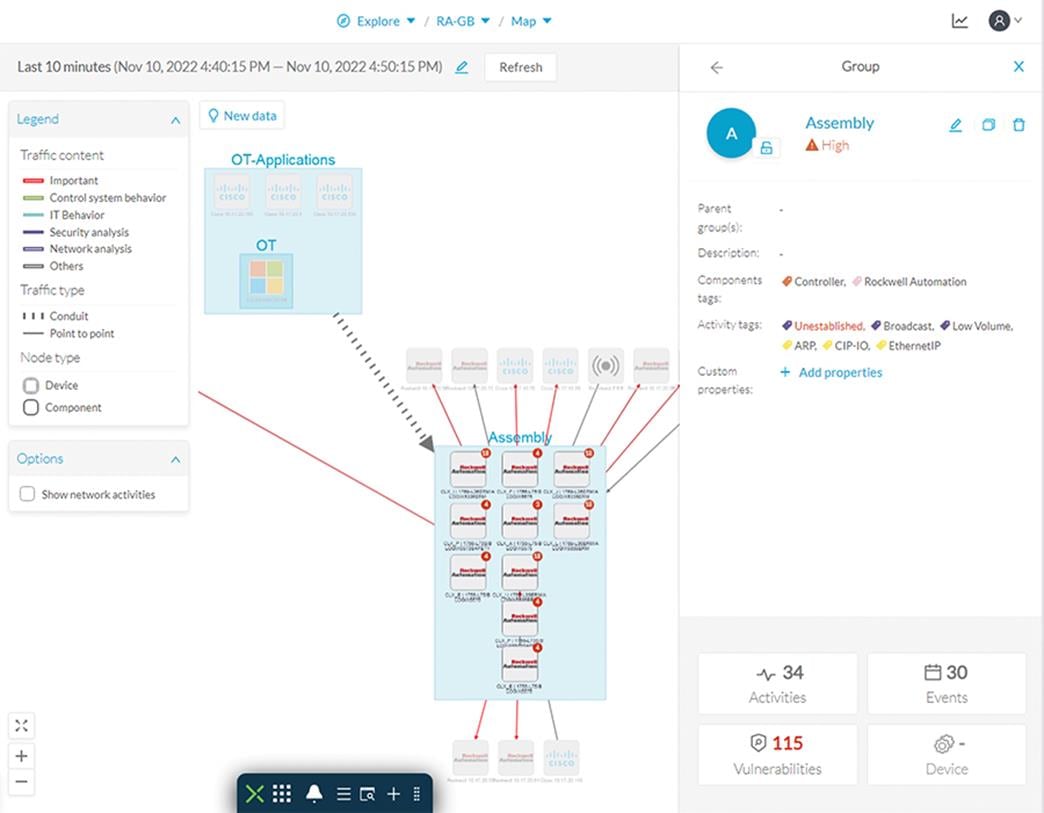
Grouping Workflow:
To start grouping devices after installing sensors follow these steps:
1. Select a filter criterion for grouping. We recommend using subnet because most deployments use different subnets for different manufacturing processes. Note that VLAN is not recommended as a filter for presets, since routed traffic loses VLAN information.
2. Create a preset using the defined filter. For example, if using subnets, filter all devices in a subnet at a time. See Presets for more information.
3. Select all devices and assign a group.
4. Repeat steps 2 and 3 with different parameters. In the subnet example, repeat for other subnets.
5. Create a preset for devices without groups to see if there are ungrouped components. Once these are identified, assign them to groups.
6. Enable monitor mode in the presets created in step 2 to get alerted about new devices matching the criteria and group them when detected. See Discover New or Changed IACS Devices for more details.
Presets
Creating Device Groups Recommendations:
· When deploying sensors on a factory for the first time, start small. Consider a single manufacturing process area first, create groups and presets, and then add other
processes gradually.
· Create groups based on manufacturing areas or processes. If the network is segmented use a subnet filter to identify components to be grouped.
· Assign an industrial impact variable to the group according to group criticality.
· ![]() If Network Address Translation (NAT) is used, group by using inside/private IP address for deployments where Cisco Cyber Vision is integrated with ISE.
If Network Address Translation (NAT) is used, group by using inside/private IP address for deployments where Cisco Cyber Vision is integrated with ISE.
· To identify new devices not part of a group use the Devices without group filter.
Presets are filters that allow the user to customize how components are displayed and grouped. In addition, the presets allow the user to quickly navigate to device activity, vulnerability, and event information. Creating presets that meet your business needs is important to visualize meaningful information on the right context. Refer to Table 3 Cisco Cyber Vision Filters for filter categories. For example, if you are interested in seeing a list of all OT devices on certain VLAN, you could create a present with devices level 0-2 on the specified VLAN, reducing the amount of data to what is relevant as shown in the following table.
Table 3-1 Cisco Cyber Vision Filters
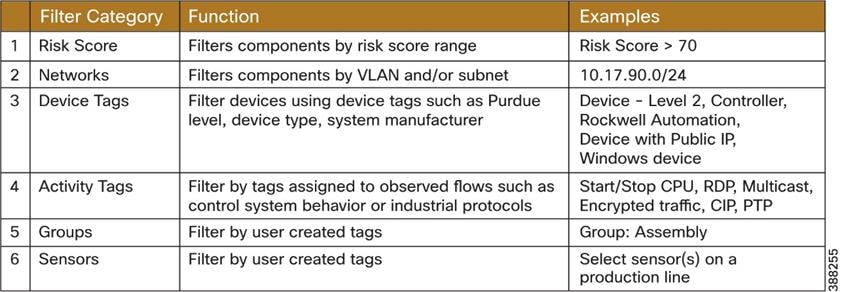
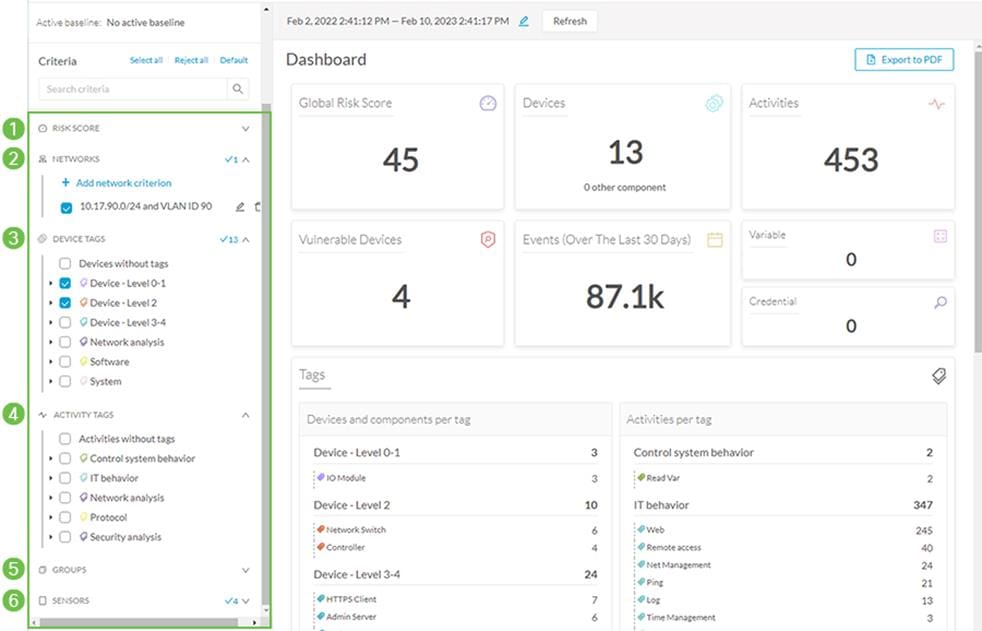
The following diagram shows a presets example; the filters are selected in the left panel. The filter categories referenced in the table above are marked with numbers 1- 6 on the following diagram.
Figure 9 Creating Meaningful Presets
Tech Tip: Cisco Cyber Vision allows filtering out criteria. When creating presets consider filtering out information that may not be relevant to the objective of the preset or may add too much noise. Some examples are:
· Ping
· Net Management
· Log
· Time Management
· Broadcast
· ARP
· Public IP
This information may be relevant, such as creating a preset to view all devices that communicate to public IP addresses, but for most of the presets, it will create distracting noise.
Examples of Presets
This section contains some examples of presets that can be used to analyze control system behavior and changes in the network. See sections Cisco Cyber Vision Monitor Mode and Operational Insights for more information. Other useful presets are:
· Production area devices and flows: to build this preset, filter out IT behavior, broadcast, ARP and Public IP.
· Check high risk assets: filter out Public IP and select risk score as filter selecting a desired range. For example, check devices with risk score from 70 to 100.
· Leverage prebuilt Cisco Cyber Vision presets and customize them. Cisco Cyber Vision comes with a set of predefined presets for different user roles such as Control Systems Management, IT communication Management or Security. These presets can be copied and modified to match additional parameters.
Baselines
A baseline is created for a situation considered as part of a normal operating process in which all network behaviors (components, activities, properties, tags, variable accesses) will be considered for review. To start monitoring a network, you need to pick up a preset and to define what would be its normal, stable state. This will represent the preset baseline. Baselines are used to detect and report changes on the network. Any new or changed behavior of components, activities, properties, tags, or variable accesses is considered for review.
· To avoid false positives, select an ample enough time-fame to capture normal operations.
· Before creating a baseline, active discovery can be used to provide information on silent hosts.
Cisco Cyber Vision Monitor Mode
When a baseline is created, Cisco Cyber Vision automatically detects changes inside industrial networks. Because a network architecture (PLC, switch, SCADA) is constant and its behaviors tend to be stable over time, an established and configured network is predictable. However, some behaviors are unpredictable and can even compromise a network's operation and security. Cisco Cyber Vision Monitor mode aims to show the evolution of a network behaviors, predicted or not, based on presets. Changes, either normal or abnormal, are noted as differences when a behavior happens. Any difference detected is highlighted. When reviewing these, they can be acknowledged and included in a new baseline or reported. It depends on whether the operator considers it normal or not. By acknowledging changes, each baseline is refined over time to match the evolving environment.
Visibility of IACS Assets and Flows
Discover New or Changed IACS Devices
New and changed devices are detected by creating baselines. To start, create a preset using filtering categories. Then, add a new baseline from the preset. Cisco Cyber Vision starts highlighting any differences from the baseline.
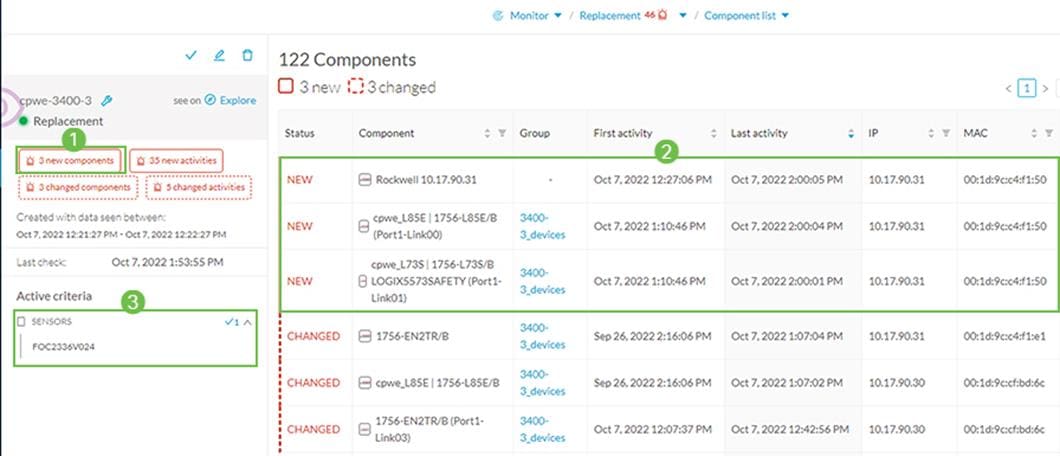
In this example, the baseline is built by filtering by specific sensors installed in industrial switches in an area. When the sensor sees the new device, it is shown as a new component on the monitored preset. Examine the differences and optionally acknowledge and include the difference in the preset going forward. Figure 10 illustrates new components being reported
with the following information:
· How many components are new or changed
· List of components
· Filter criteria for the preset, in this example Cisco Cyber Vision sensor is used
Figure 10 Discover New or Changed Devices
Asset Visibility through the ControlLogix Backplane
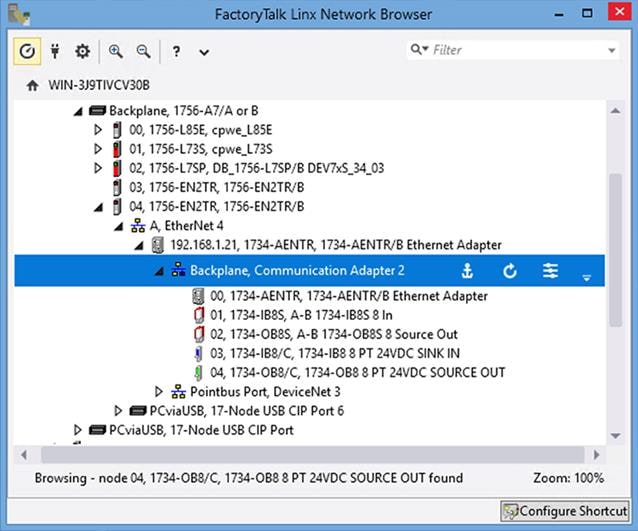
The Cisco Cyber Vision Center DPI capabilities allow for passive device discovery via the ControlLogix® backplane. For example, by using the FactoryTalk® Linx Network Browser, it is possible to view the components on a chassis connected to a monitored network interface and expand on a network module that is part of an unmonitored network. Thanks to the backplane connectivity, the sensor on the monitored network can learn details about components on the unmonitored network and add them to the inventory.
Figure 11 Visibility through the Backplane
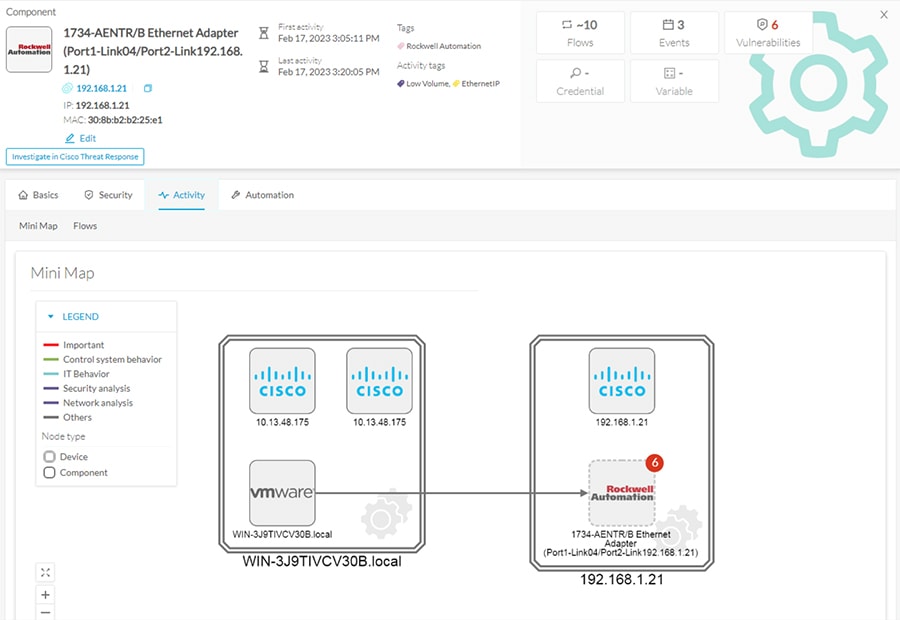
The following figure shows the discovered component on Cisco Cyber Vision Center and the communication flow from workstation running FactoryTalk Linx Network Browser to I/O connected via ControlLogix backplane.
Figure 12 Cyber Vision Center View of Communication Through Backplane
EtherNet/IP Active Discovery
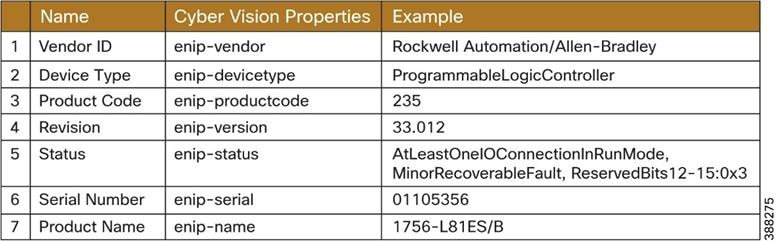
Active discovery functionality is used to learn additional details about devices and modules that are not shared through communication flows. For example, if a modular device is connected to a monitored network, but no messages are sent to the backplane during the observation period, Cisco Cyber Vision only knows the ethernet module. EtherNet/IP Active discovery can send unicast messages to all devices in a preset with an identity request. End devices that support EtherNet/IP with information for all modules is sent.
Furthermore, active discovery can be used to discover all CIP devices in the local network by sending a CIP identity request to the IPv4 broadcast address.
The following table shows the properties obtained via EtherNet/IP discovery.
Table 3 Properties learned through Ethernet/IP active discovery
Communication Flows and Industrial Protocol Support
The following section describes Cyber Vision ability to identify communication flows between IACS devices and the industrial protocols of those flows.
CIP Standard I/O
Cisco Cyber Vision has support for the Common Industrial Protocol (CIP) Ethernet/IP (EIP). CIP explicit class 3 messages (TCP port 44818) are assigned CyberVision tag EthernetIP. CIP implicit class 0/1 messages (UDP port 2222) are assigned CyberVision tags CIP-IO and EthernetIP. Flow details contain properties and statistics for observed CIP messages between the
endpoints. An example is shown in Figure 13.
Figure 13 Ethernet/IP Activity Properties
Identification of CIP Safety Flows
Cisco Cyber Vision sensor does stateful tracking of CIP Safety traffic by inspecting CIP connection manager flows during CIP session establishment. Because of this, sensor should see the beginning of the connection to assign a CIP Safety tag.
Identification of OPC UA Traffic
Cisco Cyber Vision tags OPC UA flows if using port 4840. Rockwell Automation uses port 4990 and increment by one for additional endpoints. Because of this OPC UA traffic observed during CVD validation was not tagged as such in Cisco Cyber Vision Center.
Encrypted Traffic
CIP Security and Media Access Control Security (MACSec) were tested, and the results are described below.
Note: Cyber Vision does not support inspection of CIP Security flows at the time of this CVD. Nevertheless, traffic was observed, and the findings are captured in this document.
CIP Security
Cisco Cyber Vision cannot fully inspect the traffic when CIP security is enabled, hence CIP properties cannot be obtained from the payload. Nevertheless, the flows between the endpoints will be shown as follows:
· If CIP Security Encryption and Confidentiality Profile is used, the flow will show the Cyber Vision tag SSL/TLS.
· If Integrity only mode is used, Cisco Cyber Vision will display the flow but won’t assign any Cyber Vision tag to it. Untagged flows can be examined using filter Activities without tags in a preset.
MACSec
MACSec provides point-to-point encryption to secure ethernet connection. Because of the point-to-point nature, the traffic gets decrypted at the ingress interface and traverses the industrial switch without encryption. A sensor installed on the switch sees the unencrypted traffic. MACSec traffic does
not have any effect on visibility when using Cisco Cyber Vision network sensors.
Multicast Traffic
Capture mode on the sensor could affect if this traffic is seen. When capture mode is selected as optimal the sensor does not analyze IPv4 or IPv6 multicast. If visibility for this traffic is desired select capture mode All or create a custom filter. For more information on capture mode options, refer to Installation Considerations.
Precision Time Protocol (PTP)
Cisco Cyber Vision identifies PTP flows and adds the PTP tag if the flows are sent for DPI. As explained in Multicast Traffic, capture mode on the sensor could affect if this traffic is seen. If visibility of this traffic is desired, adjust the capture mode to All or create a custom filter.
Security Posture
Vulnerability Assessment in Cisco Cyber Vision
Vulnerabilities are detected in Cisco Cyber Vision thanks to rules stored in a Cisco Cyber Vision Knowledge DB. These rules are sourced from several CERTs (Computer Emergency Response Team), manufacturers and partner manufacturers. Technically, vulnerabilities are generated from the correlation of the Knowledge DB rules and normalized device and component properties. A vulnerability is detected when a device or a component matches a knowledge DB
rule.
Figure 14 Vulnerability Assessment
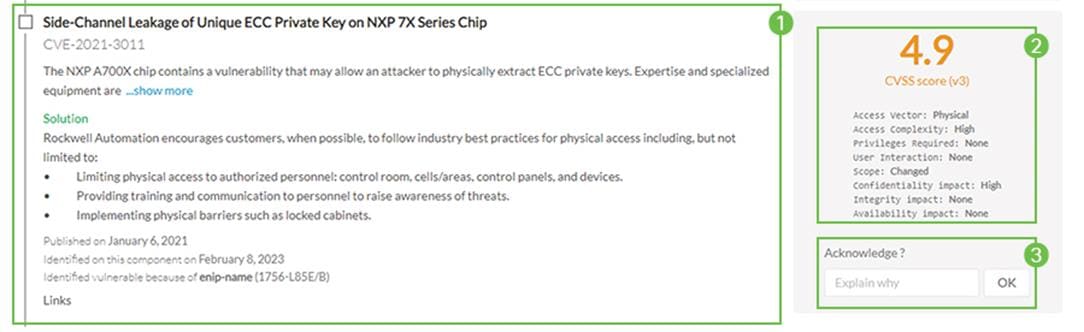
Information displayed about vulnerabilities (1) includes the vulnerability type and reference, possible consequences and solutions or actions to take on the network. Most of the time though, it is enough to upgrade the device firmware. Some links to the manufacturer website are also available for more details on the vulnerability.
A score reports the severity of the vulnerability (2). This score is calculated upon criteria from the Common Vulnerability Scoring System or CVSS. Criteria are, for example, the ease of attack, its impacts, the importance of the component on the network, and whether actions can be taken remotely or not. The score can go from 0 to 10, with 10 being the most critical score.
You also have the option to acknowledge a vulnerability (3) if you don’t want to be notified anymore about it. This is used, for example, when a PLC is detected as vulnerable, but a security policy has been defined to protect against it. The vulnerability is therefore mitigated. An acknowledgment can be canceled at any time. Vulnerabilities acknowledgment/cancelation is accessible to the Admin, Product and Operator users only.
Note: It is important to update the Knowledge Database (DB) in Cisco Cyber Vision with each new revision to be protected against vulnerabilities and download IDS signatures. New Knowledge DB versions are made available every week with detailed release notes about new CVE and Snort IoCs that are included, to allow Cisco Cyber Vision administrators to decide
whether to update.
Tip: When reviewing vulnerabilities, note that after an action has been taken to correct the vulnerability in an asset reported by Cisco Cyber Vision Center the operator should clear the vulnerability from the system.
Cisco Cyber Vision Risk Score
A risk score is an indicator of the good health and criticality level of a device, on a scale from 0 to 100. It has a color code associated to the level of risk. The risk score is meant to help the user easily identify which devices are the most critical within the overall network. It provides limited and simple information on the cybersecurity of the monitored system. It is intended as a first step in security management to take actions by showing the causes of high scores and providing solutions to reduce them. The goal is to minimize and keep risk scores as low as possible. The solutions proposed can be to:
· Patch a device to reduce the surface of attack
· Remove vulnerabilities
· Update firmware
· Remove unsafe protocols whenever possible (FTP, TFTP, Telnet, etc.)
· Create an access control policy
· Limit communications with external IP addresses
In addition, it is necessary to define the importance of the devices in your system by grouping devices and setting an industrial impact. Thereby, increasing or decreasing the risk score, which will allow you to focus on most critical devices. The risk score is computed as follows:
Risk = Impact x Likelihood
Impact answers the question; What is the device “criticality”? that is, what is its impact on the network? Does it control a small, non-significant part of the network, or does it control a large critical part of the network? To do so, the impact depends on the device tags assigned by Cisco Cyber Vision. Is the device a simple IO device that provides non-critical telemetry information, or is it critical to the entire factory operations or have human-risk implications? These will
obviously not have the same impact if they are compromised. Cyber Vision allows users to adjust the impact of a group of devices for this purpose. See section Group Devices by Criticality Level that follows.
Note: A Cisco Cyber Vision user has the possibility to act on the device impact by moving it into a group and setting the group industrial impact (from very low to very high). By default, Cisco Cyber Vision may decide the impact a device has on your network is small, because it only communicates with a handful of other devices. However, if you as an administrator decide that these group of assets are highly critical, the risk score will change based on this manually entered information. We recommend considering applying Consequence-driven, Cyber-informed Engineering methodologies (See INL for more information) as user adapt risk score parameters.
Likelihood answers the question; What is the likelihood of this device being compromised? It depends on:
· Device Activities, or more precisely activity tags. Some protocols are less secure than
others. For example, telnet is less secure than SSH.
· The exposure of the device communicating with an external IP subnet.
· Device vulnerabilities, considering CVSS scoring.
Check Vulnerabilities of Industrial Endpoints
Vulnerabilities for industrial devices can be reviewed on the vulnerability dashboard. A preset can be created to filter on devices with high-risk score. The following image depicts an example of a preset created to filter devices with a risk score higher than 75. The vulnerability dashboard shows the following information:
· Preset criteria
· Most matched vulnerabilities color coded by severity
· Number of affected devices
· List of vulnerabilities with links to get more information on vulnerability or affected devices
Figure 15 Vulnerability Dashboard
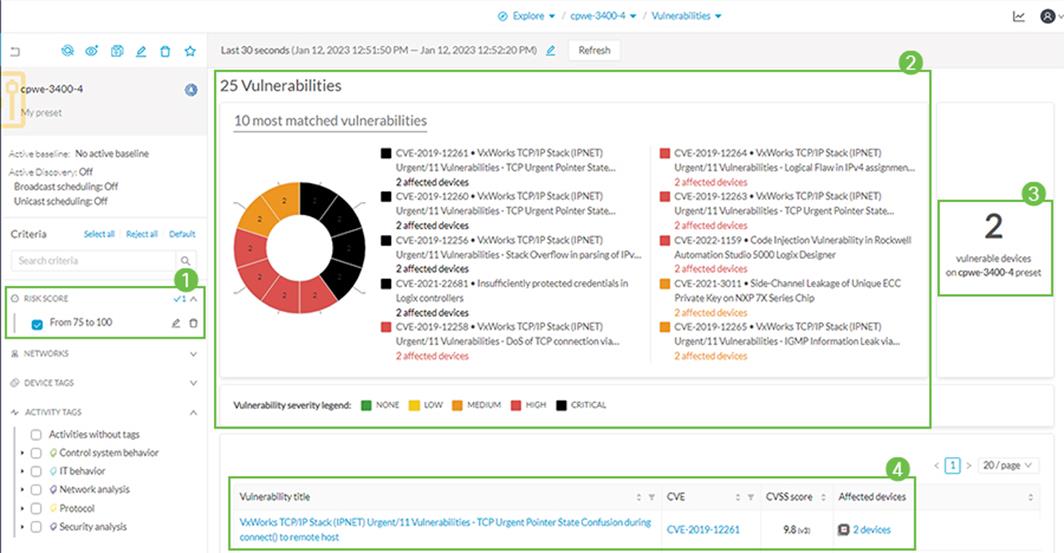
As shown in section “Vulnerability Assessment in Cisco Cyber Vision”, a vulnerability can be investigated and acknowledged.
Group Devices by Criticality Level
An operator can influence the risk score of a device by assigning an impact level by assigning a group to the device with a high impact level. In the figure below a controller that is not associated to any group shows a risk score of 50 based on the device type, activities, and vulnerabilities. Group Impact shows how to assign impact level to a group. When we add the asset to a group with a very high impact, the risk score increases accordingly as shown in Modified Risk Score.
 Figure 16 Default Risk Score
Figure 17 Group Impact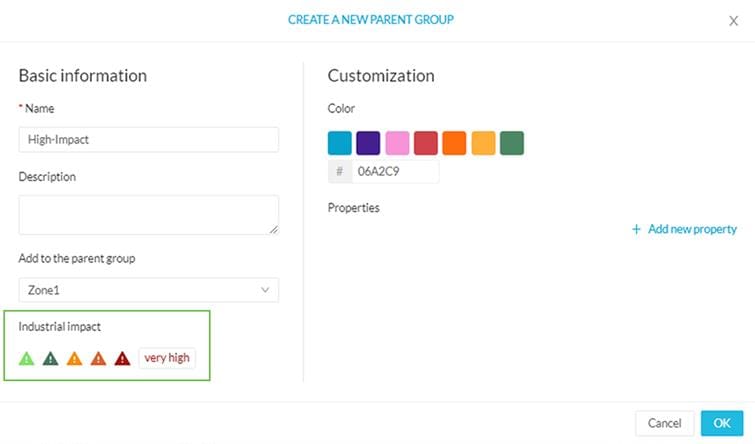
Figure 18 Modified Risk Score
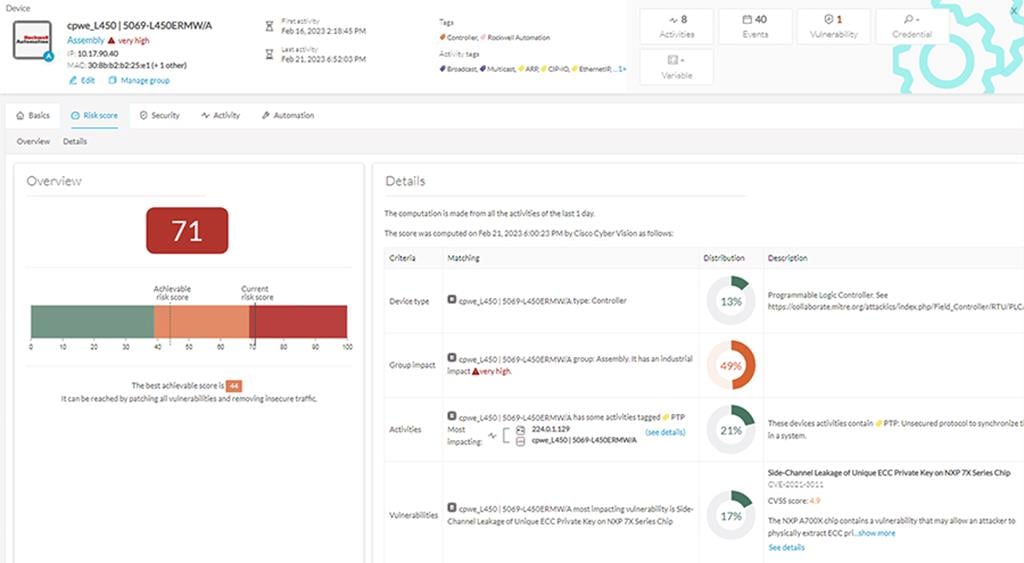
Updating Security Posture
The risk score of a device in Cyber Vision is affected by four parameters as shown on the diagram above. Device type (1) and group impact (2) affect the risk impact variable, meanwhile activities (3) and vulnerabilities (4) affect the risk likelihood. Consider how these parameters
affect the security posture:
· Device type (1): Each device type corresponds to a device tag detected by Cisco Cyber Vision. There is no action to be done at the device type level because each device tag is
assigned with a risk score by default in Cisco Cyber Vision
· The group impact (2): Action is possible if the device belongs to a group. You can increase the impact by raising the industrial impact of the group that the device belongs to as
explained in the previous section.
· Activities (3): The most impactful activity tag is displayed. The risk can be lowered if all potential insecure network activities are removed.
· Vulnerabilities (4): Click the "See Details" button for more information about how to patch the vulnerabilities and so reduce the device risk score.
While the device type cannot be updated, taking any of the actions described above to modify group impact, activities, or vulnerabilities affect the risk score. Although it may take up to an hour for the change to be displayed (risk score computation occurs once an hour).
Note that in some scenarios a vulnerability may not get cleared automatically. For example, when the vulnerability was detected based on device information, a firmware upgrade won’t clear the vulnerability. In these scenarios, it can be cleared manually by the operator.
Operational Insights
Getting Security Insights
Security Insights is a view that provides statistics for DNS requests, HTTP requests, SMB Tree names and flows with no tag. It can be used to investigate suspicious activity.
Figure 19 Getting Security Insights
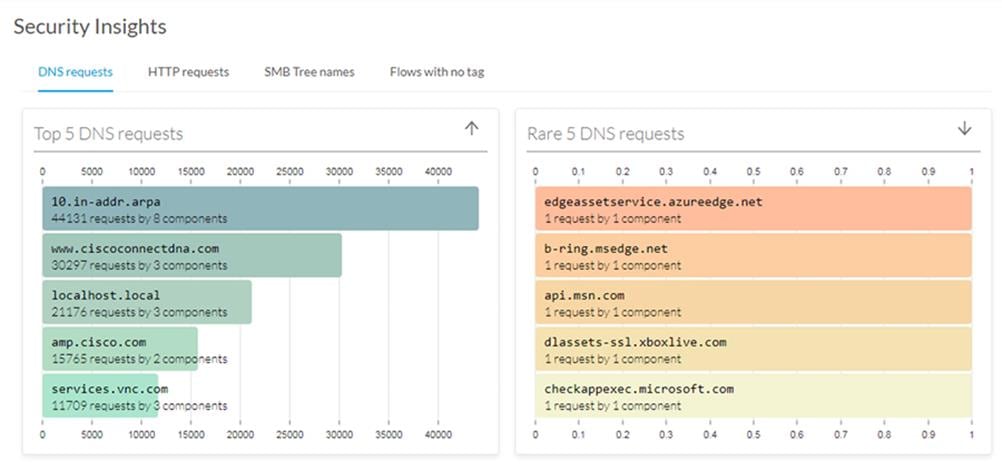
Tracking sensitive IACS assets properties
To ensure network security, its critical assets need to be monitored closely. Usually, critical assets are controllers which ensure plant operation. Cisco Cyber Vision can monitor programs and firmware versions changes that might cause malfunction or even stop a production line. For this use case, a preset can be created filtering by group(s) identifying the processes to be monitored and the Cyber Vision controller tag as depicted in Figure 20. Any changes on the component will be highlighted as well as any new activities to a controller. Cisco Cyber Vision
depicts a changed component with the following information:
1. Number of changed components
2. Detail of changes when selecting a component from the list. In this case, a controller mode was changed. It is possible to investigate the change using flows, acknowledge or report differences
3. Filter criteria for the preset, in this example Group and controller tag are used
Figure 20 Tracking sensitive assets properties
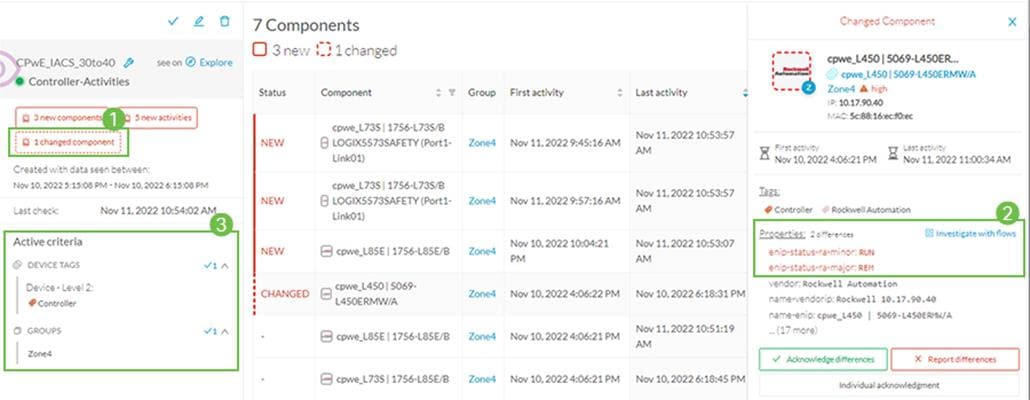
Detect changes that impact availability and integrity
Attempts to change controller mode to Program Mode or Remote Mode and other control system activities can be monitored independently. In the previous case, we were monitoring PLCs only, but the present highlighted any kind of activity or change related to it. In this scenario we are tracking only control system activities such as read/write variables and start/stop CPU. For the preset, a preset is created filtering by group(s) identifying the processes to be monitored and using the control system behavior tags. Any new or changed activities will highlight control system activities that are not present in the baseline. Figure 21 depicts a
changed activity with the following information:
1. How many new activities are seen
2. List of new or changed activities to review. If activity is expected, it can be acknowledged. Operator decides if activity should be included on the baseline.
3. Filter criteria for the preset, in this example Group and Control System Activity tag is used.
4. OT user could investigate activity with flows. In this example flow properties show
details associated with a program download such as downloaded project, workstation, and user.
Figure 21 Detect changes that impact availability and integrity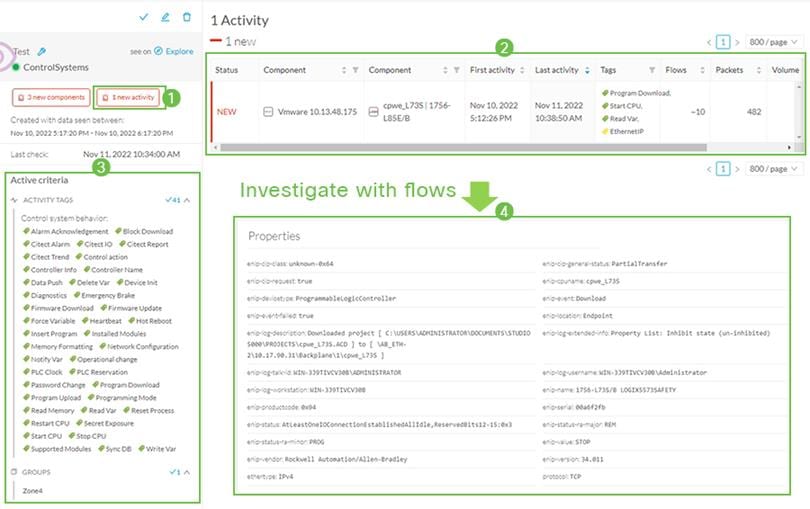
Troubleshooting IACS Device Connectivity Issues
Cisco Cyber Vision has some basic presets available by default that can be used to investigate network or security issues. One of those is the Unestablished Connections, which shows activities tagged with the unestablished tag. Unestablished refers to an analysis done by Cisco Cyber Vision to detect flows which are not correctly established. It could reveal misconfigurations or malicious actors trying to scan the network. When an unestablished tag is assigned to a previously working flow it could indicate that the endpoints are not able to communicate anymore. Figure 22 shows activities reported as changed (1) to include the
unestablished tag (2) after a controller lost connectivity to the network.
 Figure 22 Troubleshooting Connectivity Issues

![]()


 |
Integrating OT Security Visibility
This chapter describes how to configure Security Visibility to integrate into the wider Enterprise cybersecurity and network management functions. The OT visibility garnered by Cyber Vision could provide valuable context and insight to Enterprise risk and response functions as well as network management processes. This chapter provides guidance on integrating the data and events from the Security Visibility into:
· Identity Services and Network Access to apply security policy
· Security incident and event management to identify, respond and recover from breaches or issues
Cisco Identity Services Engine
Cisco Identity Services Engine (ISE) is a security administration product that enables an OT-IT security administrative team to create and enforce access level security policies. A rules-based, attribute-driven policy model is provided to create access control based on authentication and authorization policies. Cisco ISE includes the ability to create fine-grained authorization policies based on endpoint attributes.
Note: ISE design and deployment guidance is found in “Deploying Identity and Mobility Services within a Converged Plantwide Ethernet Architecture Design and Implementation Guide” (https://www.cisco.com/c/en/us/td/docs/solutions/Verticals/CPwE/3-5-1/ISE/DIG/CPwE_ISE_CVD/CPwE_ISE_Chap2.html) and Segmentation guidance is found in the “Industrial Automation Security Design Guide 2.0” (https://www.cisco.com/c/en/us/td/docs/Technology/industrial-automation-security-design-guide.html)
In the case of IACS assets, the built-in ISE probes will not be able to get all the information from the IACS asset to create a granular profiling policy. This is because IACS assets may not support some traditional IT protocols that ISE relies on to profile the device. To gain visibility into IACS assets, this design uses Cisco Cyber Vision, which provides context of industrial operations and systems. Cisco Cyber Vision Center shares endpoints and attributes with ISE using pxGrid.
Figure 23 Cisco Cyber Vision Exporting Attributes to ISE
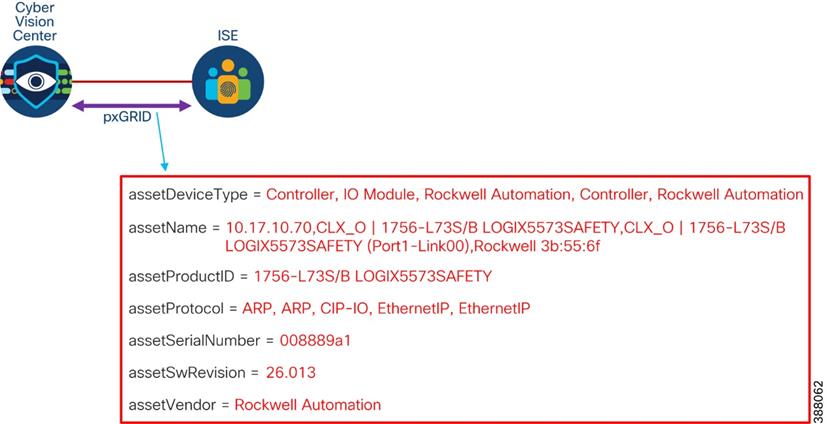
The integration between Cisco Cyber Vision and ISE provides the following benefits:
· Automatically enrolls IACS assets into the ISE endpoint database.
· Enables an OT-IT security administrative team to create granular profiling policies based on the attributes received from Cisco Cyber Vision.
· Allows the OT engineers to leverage the integration between Cisco Cyber Vision and ISE to automatically deploy new security policies in the network.
Segmentation
Segmentation is the practice of zoning the IACS network to create smaller domains of trust to help protect the IACS network from the known and unknown risks in the network. The segmentation between Cell/Area Zones was typically done using VLANs with Access Control Lists (ACLs) at the Layer 3 distribution switch. A group of IACS assets that are part of the same functional area (zone) and need to communicate with each other were put in the same VLAN.
When IACS assets need to communicate with IACS assets located in a different functional zone, communication occurs via the distribution switch which uses ACLs to either permit or deny traffic. There are many benefits associated with segmentation, such as creating functional areas (building block approach for scalability), creating smaller connected LANs for smaller broadcast/fault domains and smaller domains of trust (security groups), and helping to contain any security incidents. For example, if there is a security group access policy to restrict the communication between the VLANs (zones), traffic from an infected host is contained within the VLAN. However, as the size of the ACL increases, the complexity of managing the ACL also increases.
To provide more flexibility and simplicity to network segmentation, the Network Security within a Converged Plantwide Ethernet Architecture Design and Implementation Guide uses Cisco TrustSec technology to define access policies using security groups. This allows the segmentation of IACS assets using Security Group Tags (SGT) which group the assets regardless of their location in the plant-wide network.
Cisco TrustSec technology assigns SGTs to IACS assets, networking devices, and users when they attach to a network. By using these tags, an IT security architect can define an access policy and enforce that policy on any networking device. Cisco TrustSec is defined in three phases: classification, propagation, and enforcement. When the users and IACS assets connect to a network, the network assigns them a specific SGT in a process called classification.
Classification can be based on the results of the authentication and authorization policies and SGT is a result of that process. For example, an IACS asset can be classified and assigned a specific tag if the IACS asset is a controller, I/O, HMI, or Windows workstation. Depending on the IACS asset type, a separate tag can be assigned to the IACS asset. Figure 24 shows how a controller is assigned an SGT value of 5 because of authentication with ISE. When the controller attaches to the IES, the IES goes through port authentication and authorization with ISE and the result is a tag assignment to the IACS asset.
Figure 24 Classification with TrustSec
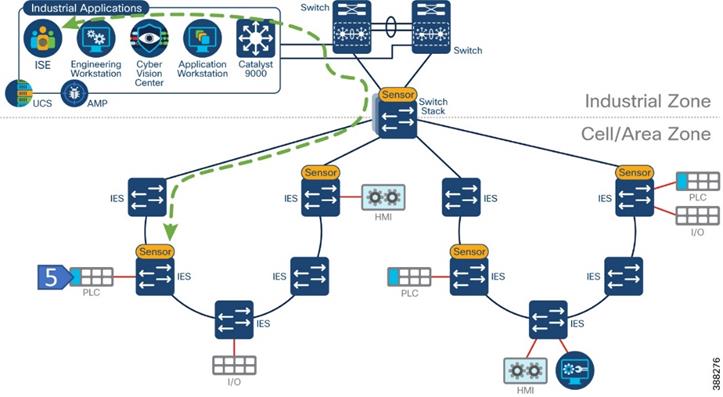
After the IACS assets are put in logical groups by the OT-IT security administrative team, a security policy that allows or denies communication between assets based on SGT is created in ISE and can be enforced on the network. The security policy should reflect the segmentation needs on the network.
The design and implementation of a security policy for an industrial network are beyond the scope of this document. However, for illustrative purposes, we will assume a policy that permits unrestricted communication among endpoints within a zone while regulating flows that enter the zone. This policy aligns with the typical requirement for industrial networks. For information on how to deploy TrustSec on CPwE architecture refer to Network Security in a Converged Plantwide Ethernet Architecture.
Role of Cisco Cyber Vision in TrustSec based Segmentation
Cisco Cyber Vision assists ISE in device profiling. In the case of IACS assets, the built-
in ISE probes will not be able to get all the information from the IACS asset to create a granular profiling policy because IACS assets may not support some traditional IT protocols that ISE relies on to profile the device. Cisco Cyber Vision provides context of industrial operations and systems.
As depicted in Figure 25, when IACS assets attach to the network, they are authenticated to ISE using MAC Authentication Bypass (MAB), which is a port-based access control method using the MAC address of the IACS asset. The following steps explain what happens after the endpoint connects and how it gets the SGT with input from Cisco Cyber Vision.
1. Endpoint authenticates using MAB.
2. Cisco Cyber Vision sensor discovers the new device and sends information to the center.
3. Optionally, the OT user assigns the new device to a group based on communication needs/flows.
4. Cisco Cyber Vision Center sends the asset details to ISE via pxGrid.
5. ISE uses the received attributes to profile the endpoint and assign an SGT via a change of authentication. The endpoint can communicate with other devices based on permissions granted to its SGT.
Figure 25 Role of Cisco Cyber Vision in TrustSec based Segmentation
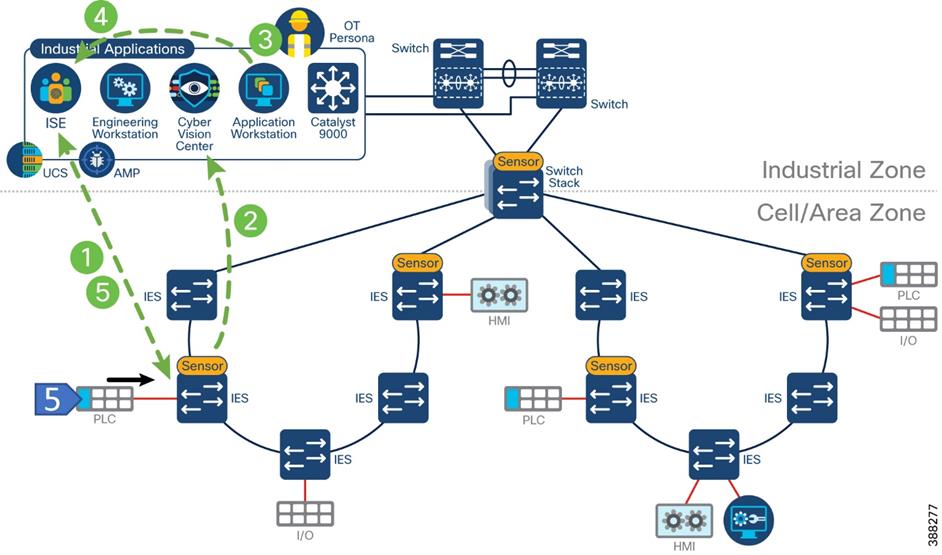
The following diagrams detail the process from the OT person point of view. Figure 27 Group Assignment shows the activity map for a new component on Cisco Cyber Vision Center. The OT user could use this data to assign the new device to a group. Figure 27 shows how a group can be assigned to the new device and Figure 28 shows the endpoint on ISE and the attributes learned from Cisco Cyber Vision. Note that the OT person does not need to sign in to ISE to check the result. Figure 29 shows the end device added to the group.
Figure 26 New Device in Cisco Cyber Vision
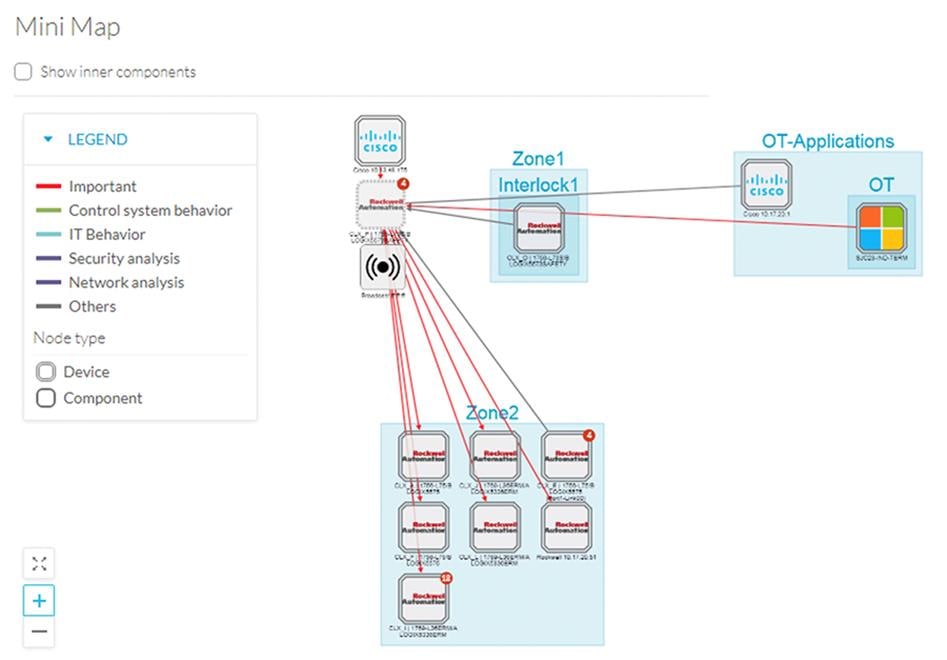
Figure 27 Group Assignment
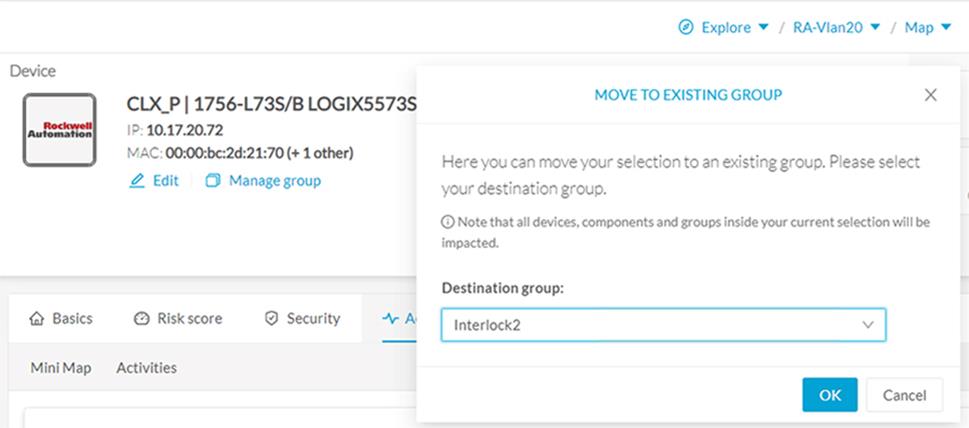
 Figure 28 Group is sent to ISE using PxGrid
Note: The recommendation in this CVD is to use a groups and parent groups for devices that need profiling as described below:
Use Group to provide some context for profiling in ISE, such as “interlocking” to indicate the device needs to communicate with other control devices in another cell/area zone.
Assign a Parent Group to indicate production process or area.
Figure 29 shows device with group Interlock2 and parent group Zone2.

· Components seen by sensors are aggregated into devices. A device represents a physical machine of the industrial network, for example a PLC. A component represents an object from a network point of view. A PLC is considered a device, while the PLC network interface is considered a component. When a group is assigned to any component on the device, it affects all components on it. In the case that a chassis, assigning a group to any component will affect all modules. If this information is sent to ISE, all modules will receive same profile and ultimately same
SGT.
· ISE uses MAC addresses to track endpoints, but Cisco Cyber Vision may not see the original MAC address of the component in the following scenarios:
o The sensor is deployed outside of the device network, because of this, the sensor sees flows that are routed and observed MAC address is the one from the
router.
o The endpoint is behind a NAT and the sensor is located on the outside
Assigning a group to a device in Cisco Cyber Vision Center that does not match the MAC address of the device will result on the endpoint not being profiled. To avoid this scenario, make sure to install sensors close to the access and use presets as described in
section “Discover New or Changed IACS Devices”.
Cisco SecureX – Security Coordination
Reducing the mean time to detect (MTTD) and mean time to respond (MTTR) are the end goals of any security operations team. How long does it take to detect an issue, and then how quickly can we respond?
Security Information and Event Management (SIEM) is a well tested take on log-and-event management solutions. At its core, SIEM is about gathering as much log information as possible from all over an organization. Many SIEM solutions can take log data from IoT security tools, firewall event logs, and everything in between. This kind of solution starts to break down the silo walls, integrating with multiple solutions and centralizing important security information. What SIEM solutions don’t do is give security engineers a boost in threat response time and efficacy. Seeing the security landscape of your organization is great for many things but responding to threats is just as important.
SecureX Ribbon
Security Orchestration, Automation, and Response (SOAR) takes a lot of what makes SIEM great and adds extra layers to account for some of the limitations. Like SIEM, SOAR solutions take data from different parts of the security infrastructure and put it in one place. SOAR solutions offer options to automate various auditing, log, and scanning tasks. Automation can’t take care of everything, however, and sometimes requires human intervention. The “response” part of SOAR is about organizing and managing the response to a security threat. This feature set utilizes orchestration and automation information to help security staff make decisions and respond to threats. SOAR automation doesn’t automate responses to security breaches. It automates simple analysis
tasks to reduce security personnel workloads.
While SIEM and SOAR emphasize logs and analysis Extended Detection and Response (XDR) solutions focus on the endpoints themselves. This is where the action is. This is what the outside parties are attacking SecureX is a cloud-native, built-in platform experience within our Cisco Secure portfolio and connected to your infrastructure, which is integrated and open for simplicity, combines multiple otherwise disparate sensor and detection technologies into one unified location for visibility, and provides automation and orchestration capabilities to maximize operational efficiency, all to secure your network, users and endpoints, cloud edge, and applications. With SecureX, security teams can:
· Radically reduce the dwell time and human-powered tasks involved with detecting, investigating, and remediating threats to counter attacks or securing access and managing policy to stay compliant – make faster decisions with less overhead
and better precision with less error.
· Enable time savings and better collaboration involved with orchestrating and automating security across Enterprise Security Operations (SecOps), IT Operations (ITOps), and Network Operations (Net Ops) teams, which help advance your security maturity level using your existing resources and realizes more desired outcomes with measured, meaningful metrics.
· Reduce MTTD / MTTR and reduce costs with real benefits in 15 minutes – even if you start small with a single product and grow as your needs dictate over time to consolidate security vendors without compromising security efficacy.
Part of the SecureX design philosophy is that you shouldn’t have to navigate to multiple different consoles to get all the functions you need for one business task. The SecureX ribbon brings this philosophy to reality across the portfolio. Using the ribbon, a persistent bar in the lower portion of the UI of all ribbon-capable products, you have access to all the functions lent to SecureX by all your deployed SecureX-capable technologies. The ribbon is collapsible and expandable to open ribbon apps, launch integrated applications, and view your account profile.
From the ribbon, you can pivot between SecureX or the console of any integrated product, into any other integrated product and search the current webpage for malicious file hashes, suspicious domains and other cyber observables. You can then also add
observables to a case or investigate observables in the threat response app.
The SecureX ribbon is a feature of Cisco Cyber Vision and will appear on the bottom of the Cisco Cyber Vision Center user interface.
Figure 30 SecureX Ribbon
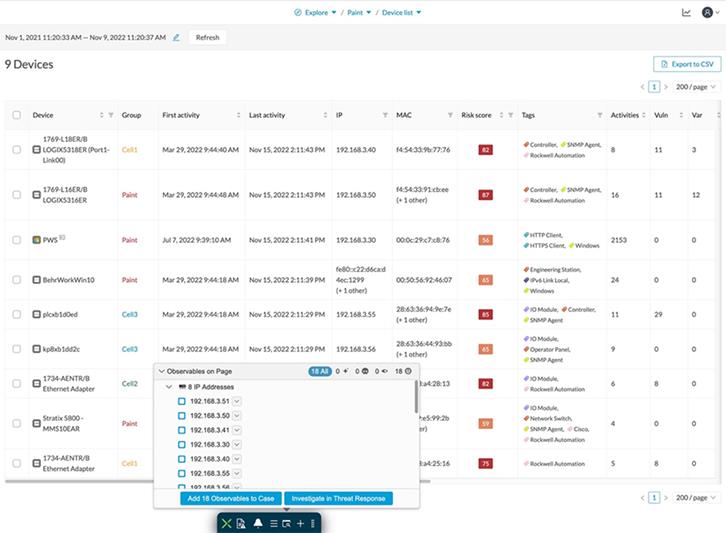
SecureX Threat Response
SecureX threat response is a security investigation and incident response application. It simplifies threat hunting and incident response by accelerating detection, investigation, and remediation of threats. The threat response application provides your security investigations with context and enrichment by connecting your Cisco security solutions (across endpoint, network, and cloud) and integrating with third-party tools, all in a single console.
To understand whether a threat has been seen in your environment as well as its impact, SecureX threat response aggregates contextual awareness from Cisco security product data sources along with global threat intelligence from Talos® and third-party sources via APIs. Threat response identifies whether observables such as file hashes, IP addresses, domains, and email addresses are suspicious or malicious, and whether you have been affected by them. It also provides the ability to remediate directly from the interface and block suspicious files, domains, isolate hosts, and more without pivoting to another product first.
Key features and benefits include:
· Relations Graph: visualize all the observables found during the investigation and determine the relationships between them
· Casebook: save, share, and enrich threat analysis to enable documentation of all analysis in a cloud casebook so seamlessly work a case across multiple tools, Cisco or otherwise and better collaborate among staff
· Response Actions: enforce protective controls without pivoting to other product consoles
It is possible to launch a SecureX investigation from Cisco Cyber Vision Center. The Cisco Cyber Vision baseline feature can help highlight unexpected and potentially malicious activity in the network by monitoring a known good state for any changes. Often, an infected device starts by scanning the network to identify vulnerable components to attack. This traffic anomaly can be easily identified using Cisco Cyber Vision Monitor Mode. To cross launch an investigation in SecureX Threat Response, click on the suspicious component, and then click Investigate in Cisco Threat Response button.
 Figure 31 SecureX – Threat Response

 |
Deploying, Configuring, Verifying and Troubleshooting Security Visibility
This section provides guidance for deploying and configuring Cyber Vision in a CPwE architecture. This section describes the following activities:
· Cisco Cyber Vision Center Installation
· Cisco Cyber Vision Sensor Installation
Troubleshooting topics included in this chapter are:
· Sensor Installation Failure
· Verify Sensor Installation and Status
· Checking Sensor Load
· Disconnected Sensor
· Missing Sensor Data
· Packet Capture
Cisco Cyber Vision Center Installation
The following link contains references to appliance and VM installation and upgrade guides: Install and Upgrade Guides.
After installation, refer to the following guide for Cisco Cyber Vision administration Cisco Cyber Vision GUI Administration Guide, Release 4.1.2.
Cisco Cyber Vision Center Navigation
After the center and sensors are installed, use Cisco Cyber Vision GUI to discover assets, create presets, and monitor the network. Cisco Cyber Vision GUI User Guide shows how to navigate through it.
Knowledge Database
Use the knowledge base to assess the security posture of assets in the inventory and identify threats.
To install a knowledge DB update, do the following:
1. Download the latest Cisco Cyber Vision Knowledge DB (.db) file from Cisco.com.
· Go to Cisco Software Central and login
· Click “Access Downloads”
· Search for Cyber Vision
· Click on Cyber Vision Updates and a link for the KDB should be displayed.
2. From the Cisco Cyber Vision system administration page click the Import
a knowledge DB button to upload the file.
Cisco Cyber Vision Center Integrations
Follow the referenced documents to configure Cisco Cyber Vision Integrations:
· Cisco xDR (formerly SecureX) and Indentity Services Engine (ISE) integration in the “integration section” of the Cisco Cyber Vision GUI Administration Guide
Cisco Cyber Vision Sensor Installation
Sensor Requirements
Cyber Vision sensors are deployed on switches, routers or computer platforms that meet the following criteria:
· IOS-XE version on the switch, router or computer platform should be 17.2.1 or higher. For Catalyst 9300 sensors, IOS-XE version should be 17.6.1 or higher.
· Industrial switches (Catalyst IE3400, Catalyst IE3300 10G, Allen-Bradley® Stratix® 5800) require and SD Card of at least 4GB. SD card should be procured from Cisco or Allen- Bradley to guarantee functionality.
· Catalyst 9300/9400 switches require and SSD Disk of at least 120GB.
Sensor Initial configuration
Initial configuration is required on the switches for the Cisco Cyber Vision Sensor to work. For Detailed configuration per platform follow the document:
Goto the Cisco Cyber Vision support documentation page and search for the relevant Sensor installation guide.
Tip: During the initial consideration a SPAN session is created to monitor the traffic. Note that this session determines which traffic is sent to the sensor. Monitoring sessions on these switches can be configured to SPAN VLANs or the switch ports.
If monitoring physical ports, it is recommended that you select either access or trunk ports to avoid monitoring traffic twice. This choice impacts the volume of traffic sent to the sensor. If the sensors are located at access switches, monitoring access ports instead ports is preferred. If
monitoring on an aggregation port, capturing at the trunks is preferred.
Sensor Installation
The recommended method to install a sensor is to use the sensor management extension, as it allows for the installation, enrollment, and maintenance of the sensors. The extension can be retrieved following these steps
· Go to Cisco Software Central and login
· Click “Access Downloads”
· Search for Cyber Vision
· Click on Cyber Vision Center and a link for the relevant version
· Download the Cisco Cyber Vison Sensor Management Extension.
from cisco.com, .
The installation guide in a previous section describes the installation steps and upgrade procedures.
When deploying sensors on a factory for the first time, start small. Consider a single manufacturing process area first, create groups and presets, and add other processes gradually. Bulk deployment of sensors is possible through scripting, refer to https://github.com/CiscoDevNet/cisco-cyber-vision-sensor-management-ansible for more information.
Installation Considerations
The installation wizard displays a capture mode option, this defines what traffic is sent to the sensor. Options are explained below:
· All: No filter is applied to the sensor DPI, all network flows will be captured and analyzed
· Optimal: Does not analyze multicast flows on capture ports. When this option is applied multicast traffic such as PTP is not seen on the sensor.
· Industrial: Only monitors common industrial protocol ports like Modbus, S7, or
EtherNet/IP.
· Custom: Custom filters are generally used to define what kind of flows should be removed from or added to the analysis process.
For industrial networks with mostly unicast traffic, we recommend the capture mode to be “Optimal” for long-term capture and monitoring. Note that this mode does not record multicast flows, if this is required use capture mode “All”
![]() For more information on Industrial or Custom options refer to Cisco Cyber Vision Architecture Guide, Release 4.1.0
For more information on Industrial or Custom options refer to Cisco Cyber Vision Architecture Guide, Release 4.1.0
During installation, the user needs to define the collection IP address for the sensor. This is the IP address that will be used by the sensor to send metadata to the Center. In this CVD, we recommend that the collection interface use same VLAN as the switch management interface.
Active discovery Configuration
The following configuration guide explains how to configure Active Discovery in Cisco Cyber Vision and gives details on expected results.
Cisco Cyber Vision Active Discovery Configuration Guide, Release 4.1.0
Sensor Troubleshooting
Sensor Installation Failure (Sensor Management Extension)
If installation of a sensor fails, check the following:
1. Is the switch management access reachable? If not resolve network connectivity issues.
2. Try accessing the local manager with local manager. Open a browser and navigate to the IP address of the switch (https://<svi ip>/) If page does not load, check https is enabled on the switch.
SW#sh run | i secure-server ip http secure-server
3. If the local manager loads, check credentials are valid.
4. Check IOx is enabled on the switch, example below:
Zone-2-SW#sh iox
IOx Infrastructure Summary:
Iox service (CAF) : Running
Iox service (HA) : Not Supported
Iox service (Ioxman) : Running Iox service (Sec storage) : Running Libvirtd 5.5.0 : Running
Dockerd v19.03.13-ce : Running
5. Use the Management Jobs menu option to get additional insights on the errors.
Figure 32 Sensor Installation Errors Troubleshooting
Verify Sensor Installation and Status
After a sensor is installed it displays on the Sensor Explorer menu. A healthy sensor shows as Connected. If a sensor shows Disconnected check following section for troubleshooting tips. Sensor Explorer also shows sensor version, if the version is displayed in red it means is outdated compared to the center version. This page also shows if active discovery is available on the
sensor and the sensor uptime.
Figure 33 Sensor Status
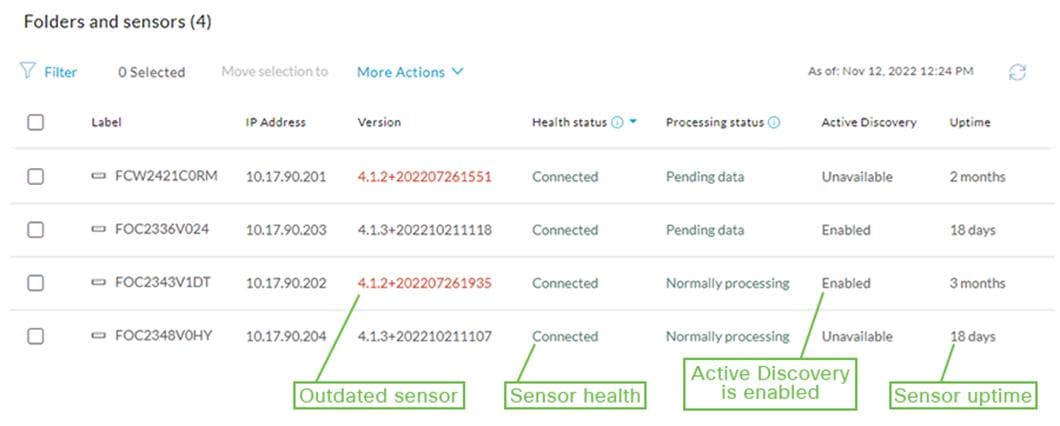
Clicking on a specific sensor will show additional information such as capture mode. It is possible to edit active discovery or capture mode settings, redeploy or uninstall the sensor.
Figure 34 Managing a Cisco Cyber Vision Sensor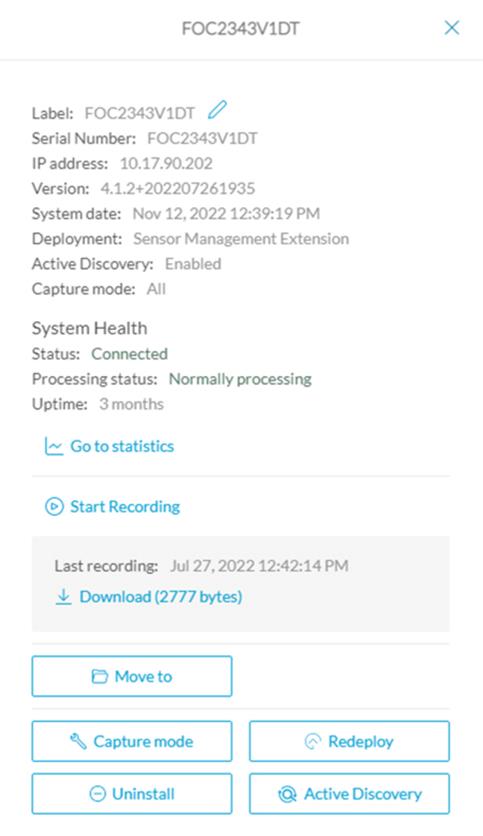
Tip: Sensor Redeploy is only available when sensor is installed using the Cisco Cyber Vision Sensor Management Extension – See Sensor Installation
Checking Sensor Load
System statistics are available to check on the health of the sensor. They display CPU, memory and disk utilization as well as captured packets and network interfaces bandwidth. High resource utilization may be seen if to many packets are sent to the sensor. See Figure 35 for an example in which a sensor deployed on Catalyst IE3400 or Stratix 5800 is receiving more packets per second than specified on performance limitations, as a result CPU utilization is very high. If this
happens review your design and configuration:
1. Check monitor settings on the switch. Are you filtering both trunk and access interfaces?
2. Check capture mode in the sensor. Is it in optimal or capture all mode? Could filters be added?
3. If sensors are deployed at an aggregation point, is it possible to install more sensors close to the access so load is distributed at different observation points?
Figure 35 Cisco Cyber Vision Sensor Statistics
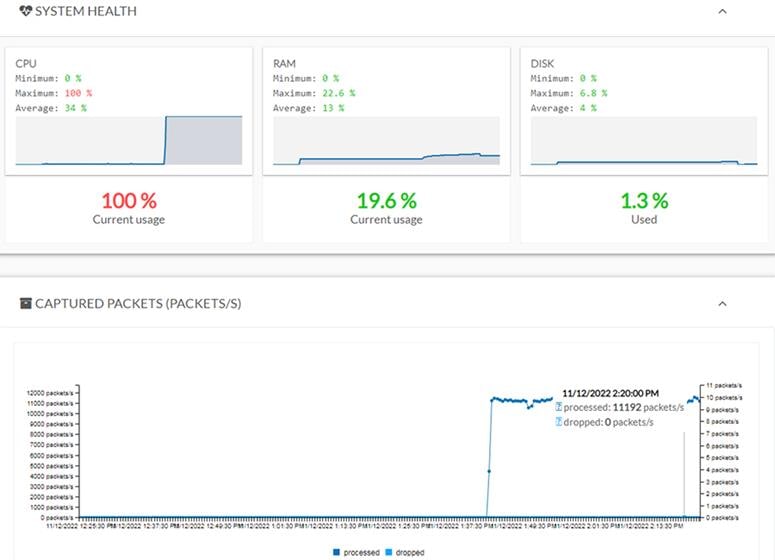
A sensor consuming high resources will create an event visible at the Events dashboard under Cisco Cyber Vision Administration category.
Figure 36 Sensor Events
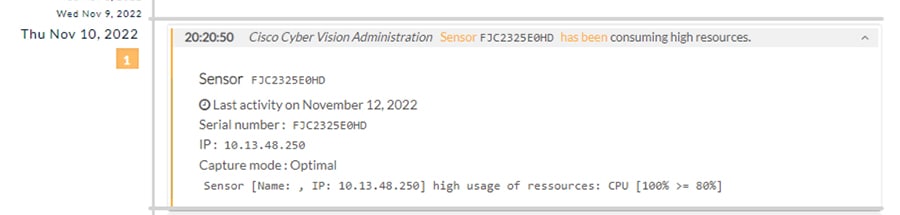
Disconnected Sensors
If a sensor is disconnected check the following:
1. Is the sensor IP address reachable from the network in which Cisco Cyber Vision Center is located? If not, check for network connectivity issues.
2. If there are no network issues but sensor IP address is not reachable, check the sensor is running on the switch and is configured with the right IP addresses. Example of a running sensor shown below.
SW#show app-hosting detail
App id : ccv_sensor_iox_aarch64
Owner : iox
State : RUNNING
Application
Type : docker
Name : ccv-sensor-iox-aarch64
Version : 4.1.3+202210211107
Description : Cisco Cyber Vision sensor for aarch64 Author : Cisco
Path :
URL Path :
Multicast : yes Activated profile name : exclusive
Resource reservation
Memory : 2048 MB
Disk : 1230 MB
CPU : 1400 units
CPU-percent : 100 %
VCPU : 2
Platform resource profiles
Profile Name CPU(unit) Memory(MB) Disk(MB)
Attached devices
Type Name Alias
serial/shell iox_console_shell serial0 serial/aux iox_console_aux serial1 serial/syslog iox_syslog serial2
serial/trace iox_trace serial3
Network interfaces
eth1:
MAC address : 52:54:dd:e0:e2:8f
IPv4 address : 169.254.1.2
IPv6 address : ::
Network name : mgmt-bridge-v2 eth0:
MAC address : 52:54:dd:e1:d7:f9
IPv4 address : 100.0.0.224
IPv6 address : ::
Network name : mgmt-bridge-v100
3. Check AppGigabit interface is configured as a trunk:
SW#show running interface AppGigabitEthernet 1/1 interface AppGigabitEthernet1/1
switchport trunk allowed vlan 2,100 switchport mode trunk
4. Check time on the industrial switch hosting the sensor and Cisco Cyber Vision Center to make sure they match.
5. Check sensor statistics as explained on previous section “Checking Sensor Load”. Overloading the sensor could cause the sensor to lose connectivity intermittently.
Tip: Sensor Redeploy is only available when sensor is installed using the Cisco Cyber Vision Sensor Management Extension
Troubleshooting Data Not Seen on Sensors
If data is not observed on the sensors check the following:
1. Check AppGigabit interface is configured as a trunk and allowing capture and collection VLANs
SW#show running interface AppGigabitEthernet 1/1 interface AppGigabitEthernet1/1
switchport trunk allowed vlan 2,100 switchport mode trunk
2. Check monitor session on the switch to confirm RSPAN vlan and monitor source.
SW#sh monitor session 1 Session 1
Type : Remote Source Session
Source Ports :
Both : Gi1/3-10
Dest RSPAN VLAN : 2
Egress Replication : ERSPAN
3. Check capture mode in the sensor. Is capture mode optimal? This mode will prevent multicast flows from being inspected. Is capture mode industrial? This mode captures industrial traffic only. Is there any custom filter applied?
4. Is the sensor deployed on the communication path? Choosing an appropriate point in the traffic path for data ingestion is key for the Cisco Cyber Vision Sensor to provide needed visibility. For example, in ring topologies with several switches and end devices distributed around the ring, there is potential for missed traffic if the end device data does not flow through the switch with the Cisco Cyber Vision Sensor. Further, resiliency mechanisms such as the REP alternate port can change the traffic path and potentially bypass the switch with the Cisco Cyber Vision Sensor Ring Topologies considerations. Keeping these things in mind can help if expected device communications are not ingested by the Cisco Cyber Vision Sensor.
Cisco Cyber Vision Center provides the capability to run a packet capture directly on a Cisco Cyber Vision Sensor for further analysis and troubleshooting. The data collected will be the raw traffic seen by the Sensor and is useful for understanding traffic flows and specific industrial traits and activities on devices. To run a packet capture on a sensor, do the following:
1. In Cisco Cyber Vision Center, navigate to Admin > Sensors > Capture.
2. In the Capture Actions column, click the Start Recording link for a given sensor.
3. When finished, click the Stop Recording link for the sensor.
4. Click the Download link to download the packet capture file.
Technical Support Case
Information required to open a support case is located at system statistics button on the top right corner of Cisco Cyber Vision. At the top of the page, you will find general information about the Center (the software version, the length of time that it has been operating (uptime).
Click on Generate Diagnostic to create a diagnostic file about the Center and attached to the case.
When creating a technical support case also provide information about the platform where sensors are installed, software version and configuration.

 |
References
This appendix includes the following major topics:
· About the Cisco Validated Design (CVD) Program, page A-1
· Converged Plantwide Ethernet (CPwE), page A-2
· Other References, page A-3
About the Cisco Validated Design (CVD) Program
Converged Plantwide Ethernet (CPwE) is a collection of tested and validated architectures developed by subject matter authorities at Cisco and Rockwell Automation which follow the Cisco Validated Design (CVD) program. CVDs provide the foundation for systems design based on common use cases or current engineering system priorities. They incorporate a broad set of technologies, features, and applications to address customer needs. Each one has been comprehensively tested and documented by engineers to help achieve faster, more reliable, and fully predictable deployment.
The CVD process is comprehensive and focuses on solving business problems for customers and documenting these solutions. The process consists of the following steps:
1. Requirements are gathered from a broad base of customers to devise a set of use cases that will fulfill these business needs.
2. Network architectures are designed or extended to provide the functionality necessary to enable these use cases, and any missing functionality is relayed back to the appropriate product development team(s).
3. Detailed test plans are developed based on the architecture designs to validate the proposed solution, with an emphasis on feature and platform interaction across the system. These tests generally consist of functionality, resiliency, scale, and performance characterization.
4. All parties contribute to the development of the CVD guide, which covers both design recommendations and implementation of the solution based on the testing outcomes.
Within the CVD program, Cisco also provides Cisco Reference Designs (CRDs) that follow the CVD process but focus on reference designs developed around specific sets of priority use cases. The scope of CRD testing typically focuses on solution functional verification with limited scale.
For more information about the CVD program, please see the Cisco Validated Designs at the following URL: https://www.cisco.com/c/en/us/solutions/enterprise/validated-design-program/index.html
Converged Plantwide Ethernet (CPwE)
• Design Zone for Manufacturing-Converged Plantwide Ethernet https://www.cisco.com/c/en/us/solutions/enterprise/design-zone-manufacturing/landing_ettf.html
• Industrial Network Architectures-Converged Plantwide Ethernet
https://www.rockwellautomation.com/global/products-technologies/network- technology/architectures.page
• Converged Plantwide Ethernet (CPwE) Design and Implementation Guide:
¾ Rockwell Automation site: https://literature.rockwellautomation.com/idc/groups/literature/documents/td/enet-td001_-en-p.pdf
¾ Cisco site:
https://www.cisco.com/c/en/us/td/docs/solutions/Verticals/CPwE/CPwE_DIG.html
· Deploying A Resilient Converged Plantwide Ethernet Architecture Design and Implementation Guide:
¾ Rockwell Automation site: https://literature.rockwellautomation.com/idc/groups/literature/documents/td/enet-td010_-en-p.pdf
¾ Cisco site: https://www.cisco.com/c/en/us/td/docs/solutions/Verticals/CPwE/REP/CPwE_REP_DG.html
· Deploying Identity and Mobility Services within a Converged Plantwide Ethernet Architecture Design and Implementation Guide:
¾ Rockwell Automation site: https://literature.rockwellautomation.com/idc/groups/literature/documents/td/enet-td008_-en-p.pdf
¾ Cisco site: https://www.cisco.com/c/en/us/td/docs/solutions/Verticals/CPwE/3-5-1/ISE/DIG/CPwE_ISE_CVD.html
· Cloud Connectivity to a Converged Plantwide Ethernet Architecture:
¾ Rockwell Automation site: https://literature.rockwellautomation.com/idc/groups/literature/documents/td/enet-td017_-en-p.pdf
¾ Cisco site:
https://www.cisco.com/c/en/us/td/docs/solutions/Verticals/CPwE/5-1/Cloud/DIG/CPwE_Cloud_Connect_CVD.html
· Securely Traversing IACS Data Across the Industrial Demilitarized Zone Design and Implementation Guide:
¾ Rockwell Automation site: https://literature.rockwellautomation.com/idc/groups/literature/documents/td/enet-td009_-en-p.pdf
¾ Cisco site:
https://www.cisco.com/c/en/us/td/docs/solutions/Verticals/CPwE/3-5-1/IDMZ/DIG/CPwE_IDMZ
· Deploying Industrial Firewalls within a Converged Plantwide Ethernet Architecture Design and Implementation Guide:
¾ Rockwell Automation site: https://literature.rockwellautomation.com/idc/groups/literature/documents/td/enet-td002_-en-p.pdf
¾ Cisco site:
https://www.cisco.com/c/en/us/td/docs/solutions/Verticals/CPwE/5-0/Firewalls/DIG/CPwE-5-IFS- DIG.html
Other References
• Stratix Managed Switches User Manual: https://literature.rockwellautomation.com/idc/groups/literature/documents/um/1783-um012_-en-p.pdf
· Industrial Automation Security Design Guide 2.0
https://www.cisco.com/c/en/us/td/docs/Technology/industrial-automation-security-design-guide.html
 |
Test Environment
Hardware and Software
This section contains hardware and software used for this CVD validation. Table B-1 lists the hardware and software used for network devices.
Table B-2 lists Rockwell Automation end devices.
Table B-3 lists Rockwell Automation Industrial Applications with software version.
Table B-1 Security Visibility Components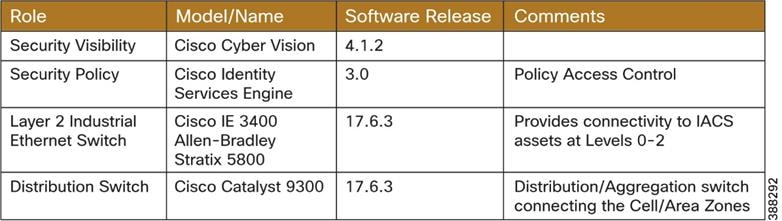
Table B-2 Rockwell Automation and Control Devices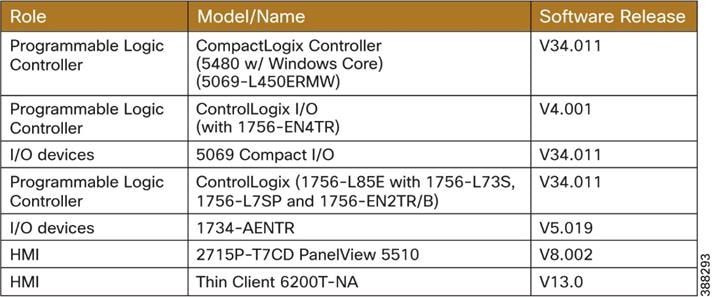
Table B-3 Rockwell Automation Industrial Applications
| Role |
Model/Name |
Software Release |
Comments |
| Programmable Logic Controller |
FactoryTalk View |
13 |
Generate CIP EIP traffic |
| IACS Asset Management |
AssetCentre |
11.0 |
Generate Plant-level traffic |
| OPC Traffic generator |
FactoryTalk Linx Gateway (OPC UA) |
6.30 |
Generate OPC traffic |
| Plant-level application communication platform |
FactoryTalk Linx Services Platform |
6.30 |
|
| IACS Configuration |
Studio 5000 |
34 |
|
| HMI |
Thin Manager |
13.0 |
|
| IACS Security |
FactoryTalk Policy Manager |
6.30 |
|
Network Topologies
Star Topology
For star topology validation sensors were installed on distribution switch (Catalyst 9300) and industrial switches with PLCs attached (Catalyst IE3400 and Allen-Bradley Stratix 5800)
Figure B-1 Validated Star Topology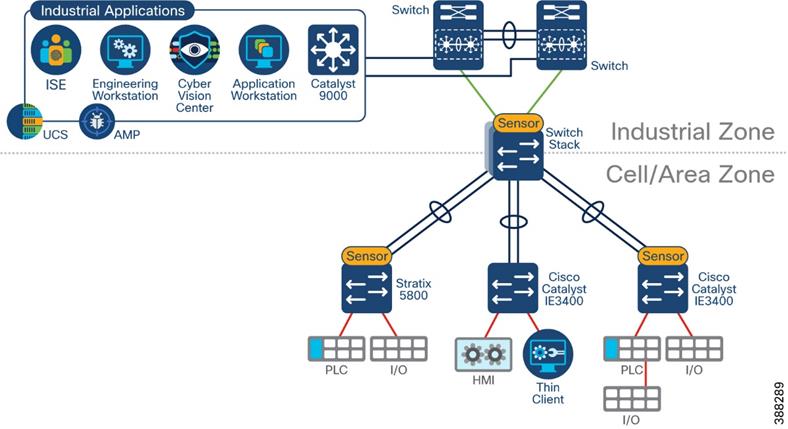
REP Ring Topology
For ring topology validation sensors were installed on distribution switch (Catalyst 9300) and industrial switches with PLCs attached (Catalyst IE3400 and Allen-Bradley Stratix 5800)
Figure B-2 Validated Ring Topology (REP)
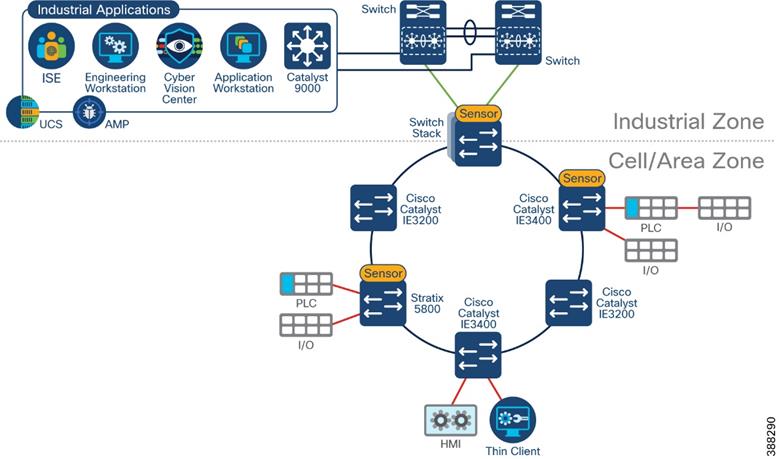
For NAT topology validation. Layer 3 NAT and Layer 2 NAT were tested as depicted in Figure B-3.
· Layer 3 NAT. A firewall is deployed between the distribution and industrial switches and the firewall is configured for Layer 3 NAT. Sensors were deployed on access switches and access and monitoring was configured on access ports.
· Layer 2 NAT. An industrial switch is used for layer 2 NAT and connected routing. Sensors was deployed on the Layer 2 NAT switch were installed on distribution switch and monitoring was configured for the data VLANs on the switch.
Figure B-3 Validated NAT Topologies
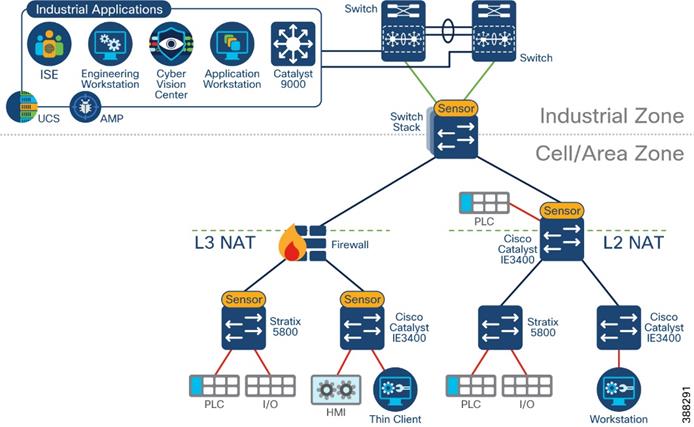
Appendix B – Test Environment Network Topologies
Validated Traffic Flows
Table B-4 has a list of most traffic flows used for validation and a result column that indicates how the activity was tagged by Cisco Cyber Vision.
 Table B-4 Validated IACS Traffic flows
 |
Acronyms and Initialisms
Table C-1 lists the acronyms and initialisms commonly used in CPwE documentation.
| Term |
Description |
| 1:1 |
One-to-One |
| AAA |
Authentication, Authorization, and Accounting |
| AD |
Microsoft Active Directory |
| AD CS |
Active Directory Certificate Services |
| AD DS |
Active Directory Domain Services |
| AES |
Advanced Encryption Standard |
| ACL |
Access Control List |
| AH |
Authentication Header |
| AIA |
Authority Information Access |
| AMP |
Advanced Malware Protection |
| ASDM |
Cisco Adaptive Security Device Manager |
| ASR |
Cisco Aggregation Services Router |
| BYOD |
Bring Your Own Device |
| CA |
Certificate Authority |
| CDP |
CRL Distribution Points |
| CIP |
ODVA, Inc. Common Industrial Protocol |
| CLI |
Command Line Interface |
| CoA |
Change of Authorization |
| CPwE |
Converged Plantwide Ethernet |
| CRD |
Cisco Reference Design |
| CRL |
Certificate Revocation List |
| CSR |
Certificate Signing Request |
| CSSM |
Cisco Smart Software Manager |
| CTL |
Certificate Trust List |
| CVD |
Cisco Validated Design |
| DACL |
Downloadable Access Control List |
| DC |
Domain Controller |
| DHCP |
Dynamic Host Configuration Protocol |
| Term |
Description |
| DIG |
Design and Implementation Guide |
| DLR |
Device Level Ring |
| DMVPN |
Dynamic Multipoint Virtual Private Network |
| DNS |
Domain Name System |
| DPI |
Deep Packet Inspection |
| DSRM |
Directory Services Restoration Mode |
| EAP |
Extensible Authentication Protocol |
| EAP-TLS |
Extensible Authentication Protocol-Transport Layer Security |
| EIGRP |
Enhanced Interior Gateway Routing Protocol |
| EMI |
Enterprise Manufacturing Intelligence |
| EoIP |
Ethernet over IP |
| ERP |
Enterprise Resource Planning |
| ESP |
Encapsulating Security Protocol |
| ESR |
Embedded Services Router |
| FIB |
Forwarding Information Base |
| FQDN |
Fully Qualified Domain Name |
| FVRF |
Front-door Virtual Route Forwarding |
| GRE |
Generic Routing Encapsulation |
| HMAC |
Hash Message Authentication Code |
| HMI |
Human-Machine Interface |
| IACS |
Industrial Automation and Control System |
| ICS |
Industrial Cyber Security |
| IDMZ |
Industrial Demilitarized Zones |
| IDS |
Intrusion Detection System |
| IES |
Industrial Ethernet Switch (Allen-Bradley Stratix, Cisco IE) |
| IIoT |
Industrial Internet of Things |
| IKE |
Internet Key Exchange |
| IoT |
Internet of Things |
| IP |
Internet Protocol |
| IPDT |
IP Device Tracking |
| IPS |
Intrusion Protection Systems |
| ISAKMP |
Internet Security Association and Key Management Protocol |
| ISP |
Internet Service Provider |
| ISE |
Cisco Identity Services Engine |
| ISR |
Integrated Service Router |
| IT |
Information Technology |
| LBS |
Location Based Services |
| LWAP |
Lightweight Access Point |
| MAB |
MAC Authentication Bypass |
| MAC |
Media Access Control |
| MDM |
Mobile Device Management |
| ME |
FactoryTalk View Machine Edition |
| mGRE |
Multipoint Generic Routing Encapsulation |
| MMC |
Microsoft Management Console |
| MnT |
Monitoring Node |
| MPLS |
Multiprotocol Label Switching |
| Term |
Description |
| MSE |
Mobile Service Engine |
| MSS |
Maximum Segment Size |
| MTTR |
Mean Time to Repair |
| MTU |
Maximum Transmission Unit |
| NAC |
Network Access Control |
| NAT |
Network Address Translation |
| NDES |
Network Device Enrollment Service |
| NHRP |
Next Hop Routing Protocol |
| NMT |
Network Monitoring Tool |
| NOC |
Network Operation Center |
| NPS |
Microsoft Network Policy Server |
| NSP |
Native Supplicant Profile |
| NTP |
Network Time Protocol |
| OCSP |
Online Certificate Status Protocol |
| OEE |
Overall Equipment Effectiveness |
| OEM |
Original Equipment Manufacturer |
| OT |
Operational Technology |
| OTA |
Over-the-Air |
| OU |
Organizational Unit |
| PAC |
Programmable Automation Controller |
| PAN |
Policy Administration Node |
| PAT |
Port Address Translation |
| PCS |
Process Control System |
| PEAP |
Protected Extensible Authentication Protocol |
| PKI |
Public Key Infrastructure |
| PLC |
Programmable Logic Controller - a deprecated term replaced by PAC |
| PSK |
Pre-Shared Key |
| PSN |
Policy Service Node |
| PTP |
Precision Time Protocol |
| pxGrid |
Cisco Platform Exchange Grid |
| RA |
Registration Authority |
| RADIUS |
Remote Authentication Dial-In User Service |
| RAS |
Remote Access Server |
| RD |
Route Descriptor |
| RDG |
Remote Desktop Gateway |
| RDP |
Remote Desktop Protocol |
| RDS |
Remote Desktop Services |
| RTT |
Round Trip Time |
| SA |
Security Association |
| SaaS |
Software-as-a-Service |
| SCEP |
Simple Certificate Enrollment Protocol |
| SE |
FactoryTalk View Site Edition |
| SGT |
Security Group Tags |
| SHA |
Secure Hash Standard |
| SIG |
Secure Internet Gateway |
| Term |
Description |
| SPW |
Software Provisioning Wizard |
| SSID |
Service Set Identifier |
| SYN |
Synchronization |
| SXP |
SGT Exchange Protocol |
| TCP |
Transmission Control Protocol |
| TLS |
Transport Layer Security |
| UDP |
User Datagram Protocol |
| VLAN |
Virtual Local Area Network |
| VM |
Virtual Machine |
| VNC |
Virtual Network Computing |
| VPN |
Virtual Private Network |
| VRF |
Virtual Route Forwarding |
| WAN |
Wide Area Network |
| wIPS |
wireless Intrusion Prevention Service |
| WLAN |
Wireless LAN |
| WLC |
Cisco Wireless LAN Controller |
| WSA |
Cisco Web Security Appliance |

| Americas Headquarters |
Asia Pacific Headquarters |
|
| Cisco Systems, Inc. |
Cisco Systems (USA) Pte. Ltd. |
Cisco Systems International BV |
| San Jose, CA |
Singapore |
Amsterdam, The Netherlands |


|
|
||
| Americas: |
Asia Pacific: |
Europe/Middle East/Africa: |
| Rockwell Automation |
Rockwell Automation |
Rockwell Automation |
| 1201 South Second Street |
Level 14, Core F, Cyberport 3 |
NV, Pegasus Park, De Kleetlaan 12a |
| Milwaukee, WI 53204-2496 USA |
100 Cyberport Road, Hong Kong |
1831 Diegem, Belgium |
| Tel: (1) 414.382.2000 |
Tel: (852) 2887 4788 |
Tel: (32) 2 663 0600 |
| Fax: (1) 414.382.4444 |
Fax: (852) 2508 1846 |
Fax: (32) 2 663 0640 |
 Feedback