What are Connectors
Connectors in Cisco Secure Workload are integrations that allow Secure Workload to interact with and gather data from various resources for different purposes. To configure and work with connectors, from the navigation pane, choose .
 Note |
Connectors require a virtual appliance. For more information, see Virtual Appliances for Connectors. |
Connectors for Flow Ingestion
Connectors stream flow observations from different Network switches, routers, and other middle-boxes (such as load balancers and firewalls) to Secure Workload for flow ingestion.
Secure Workload supports flow ingestion through NetFlow v9, IPFIX, and custom protocols. In addition to flow observations, middle-box connectors actively stitch client-side and server-side flows to understand which client flows are related to which server flows.
|
Connector |
Description |
Deployed on Virtual Appliance |
|---|---|---|
|
NetFlow |
Collect NetFlow V9 and/or IP-FIX telemetry from network devices such as routers and switches. |
Secure Workload Ingest |
|
F5 BIG-IP |
Collect telemetry from F5 BIG-IP, stitch client, and server side flows, enrich client inventory with user attributes. |
Secure Workload Ingest |
|
Citrix NetScaler |
Collect telemetry from Citrix ADC, stitch client, and server side flows. |
Secure Workload Ingest |
|
Cisco Secure Connector Firewall |
Collect telemetry data from Secure Firewall ASA, Secure Firewall Threat Defense, stitch client, and server side flows. |
Secure Workload Ingest |
|
Meraki |
Collect telemetry data from Meraki firewalls. |
Secure Workload Ingest |
|
ERSPAN |
Collect ERSPAN telemetry data from network devices which support ERSPAN |
Secure Workload Ingest |
|
See also |
– |
For more information about required virtual appliances, see Virtual Appliances for Connectors.
NetFlow Connector
NetFlow connector allows Secure Workload to ingest flow observations from routers and switches in the network.
This solution enables the hosts to avoid running software agents since the Cisco switches relay NetFlow records to a NetFlow connector hosted in a Secure Workload Ingest appliance for processing.

What is NetFlow
NetFlow protocol allows routers and switches to aggregate traffic passing through them into flows and export these flows to a flow collector.
The flow collector receives these flow records and stores them in their flow storage for offline querying and analysis. Cisco routers and switches support NetFlow.
Typically, the setup involves the following steps:
-
Enable the NetFlow feature on one or more network devices and configure the flow templates that devices should export.
-
Configure the NetFlow collector endpoint information on the remote network devices. This NetFlow collector is listening on the configured endpoint to receive and process NetFlow flow records.
Flow Ingestion to Secure Workload
NetFlow connector is essentially a NetFlow collector. The connector receives the flow records from the network devices and forwards them to Secure Workload for flow analysis. You can enable a NetFlow connector on a Secure Workload Ingest appliance and run it as a Docker container.
NetFlow connector also registers with Secure Workload as a Secure Workload NetFlow agent. NetFlow connector decapsulates the NetFlow protocol packets (that is, flow records); then processes and reports the flows like a regular Secure Workload agent. Unlike a Deep Visibility Agent, it does not report any process or interface information.
Note |
NetFlow connector supports NetFlow v9 and IPFIX protocols. |
Note |
Each NetFlow connector should report only flows for one VRF. The connector exports the flows and places them in the VRF based on the Agent VRF configuration in the Secure Workload cluster. To configure the VRF for the connector, choose and click the Configuration tab. In this page, under the Agent Remote VRF Configurations section, click Create Config and provide the details about the connector. The form requests you to provide: the name of the VRF, the IP subnet of the connector, and the range of port numbers that can potentially send flow records to the cluster. |
Rate Limiting
NetFlow connector accepts up to 15000 flows per second. Note that a given NetFlow v9 or IPFIX packet could contain one or more flow and template records. NetFlow connector parses the packets and identifies the flows. If the connector parses more than 15000 flows per second, it drops the additional flow records.
Also note the Secure Workload customer supports the NetFlow connector only if the flow rate is within this acceptable limit.
If the flow rate exceeds 15000 flows per second, we recommend first adjusting the flow rate to fall within the limits, and maintaining this level for at least three days (to rule out issues related to higher incoming flow rate).
If the original issue persists, customer support starts to investigate the issue and identify proper workaround and/or solution.
Supported Information Elements
NetFlow connector only supports the following information elements in NetFlow v9 and IPFIX protocols. For more information, see IP Flow Information Export (IPFIX) Entities.
|
Element ID |
Name |
Description |
Mandatory |
|---|---|---|---|
|
1 |
octetDeltaCount |
Number of octets in incoming packets for this flow. |
Yes |
|
2 |
packetDeltaCount |
Number of incoming packets for this flow. |
Yes |
|
4 |
protocolIdentifier |
The value of the protocol number in the IP packet header. |
Yes |
|
6 |
tcpControlBits |
TCP control bits observed for packets of this flow. The agent handles FIN, SYN, RST, PSH, ACK, and URG flags. |
No |
|
7 |
sourceTransportPort |
The source port identifier in the transport header. |
Yes |
|
8 |
sourceIPv4Address |
The IPv4 source address in the IP packet header. |
Either 8 or 27 |
|
11 |
destinationTransportPort |
The destination port identifier in the transport header. |
Yes |
|
12 |
destinationIPv4Address |
The IPv4 destination address in the IP packet header. |
Either 12 or 28 |
|
27 |
sourceIPv6Address |
The IPv6 source address in the IP packet header. |
Either 8 or 27 |
|
28 |
destinationIPv6Address |
The IPv6 destination address in the IP packet header. |
Either 12 or 28 |
|
150 |
flowStartSeconds |
The absolute timestamp of the first packet of the flow (in seconds). |
No |
|
151 |
flowEndSeconds |
The absolute timestamp of the last packet of the flow (in seconds). |
No |
|
152 |
flowStartMilliseconds |
The absolute timestamp of the first packet of the flow (in milliseconds). |
No |
|
153 |
flowEndMilliseconds |
The absolute timestamp of the last packet of the flow (in milliseconds). |
No |
|
154 |
flowStartMicroseconds |
The absolute timestamp of the first packet of the flow (in microseconds). |
No |
|
155 |
flowEndMicroseconds |
The absolute timestamp of the last packet of the flow (in microseconds). |
No |
|
156 |
flowStartNanoseconds |
The absolute timestamp of the first packet of the flow (in nanoseconds). |
No |
|
157 |
flowEndNanoseconds |
The absolute timestamp of the last packet of the flow (in nanoseconds). |
No |
How to configure NetFlow on the Switch
The following steps are for a Nexus 9000 switch. The configurations may slightly differ for other Cisco platforms. In any case, refer to the official Cisco configuration guide for the Cisco platform you're configuring.
Procedure
|
Step 1 |
Enter global configuration mode. |
|
Step 2 |
Enable NetFlow feature. |
|
Step 3 |
Configure a flow record. The following example configuration shows how to generate five tuple information of a flow in a NetFlow record. |
|
Step 4 |
Configure a flow exporter. The following example configuration specifies the NetFlow protocol version, NetFlow template exchange interval, and NetFlow collector endpoint details. Specify the IP and port on which you enable the NetFlow connector on a Secure Workload Ingest appliance. |
|
Step 5 |
Configure a flow monitor. Create a flow monitor and associate it with a flow record and flow exporter. |
|
Step 6 |
Apply the flow monitor to an interface. The above steps configure NetFlow on the Nexus 9000 to export NetFlow v9 protocol packets for ingress traffic going through interface 1/1. It sends the flow records to 172.26.230.173:4729 over a UDP protocol. Each flow record includes five tuple information of the traffic and the byte/packet count of the flow. 
|
How to Configure the Connector
For information about required virtual appliances, see Virtual Appliances for Connectors. For NetFlow connectors, IPv4 and IPv6 (dual stack mode) addresses are supported. However, do note that dual stack support is a BETA feature.
The following configurations are allowed on the connector.
-
Log: For more information, see Log Configuration .
In addition, the listening ports of IPFIX protocol on the connector can be updated on the Docker container in Secure Workload Ingest appliance using an allowed command. This command can be issued on the appliance by providing the connector ID of the connector, type of the port to be update, and the new port information. The connector ID can be found on the connector page in Secure Workload UI. For more information, see update-listening-ports.
Limits
|
Metric |
Limit |
|---|---|
|
Maximum number of NetFlow connectors on single Secure Workload Ingest appliance |
3 |
|
Maximum number of NetFlow connectors on one Tenant (root scope) |
10 |
|
Maximum number of NetFlow connectors on Secure Workload |
100 |
F5 Connector
The F5 connector allows Secure Workload to ingest flow observations from F5 BIG-IP ADCs.
It allows Secure Workload to remotely monitor of flow observations on F5 BIG-IP ADCs, stitching client-side and server-side flows, and annotating users on the client IPs (if user information is available).
Using this solution, the hosts don’t need to run software agents because F5 BIG-IP ADCs configure the export of IPFIX records to the F5 connector for processing.

What is F5 BIG-IP IPFIX
F5 BIG-IP IPFIX logging collects flow data for traffic going through the F5 BIG-IP and exports IPFIX records to flow collectors.
Typically, the setup involves the following steps:
-
Create the IPFIX Log-Publisher on the F5 BIG-IP appliance.
-
Configure the IPFIX Log-Destination on the F5 BIG-IP appliance. This log-destination listens on the configured endpoint to receive and process flow records.
-
Create an F5 iRule that publishes IPFIX flow records to the log-publisher.
-
Add the F5 iRule to the virtual server of interest.
Note
F5 connector supports F5 BIG-IP software version 12.1.2 and above.
Flow Ingestion to Secure Workload
F5 BIG-IP connector is essentially an IPFIX collector. The connector receives the flow records from F5 BIG-IP ADCs, stitch the NATed flows, and forwards them to Secure Workload for flow analysis. In addition, if LDAP configuration is provided to the F5 connector, it determines values for configured LDAP attributes of a user associated with the transaction (if F5 authenticates the user before processing the transaction). The attributes are associated to the client IP address where the flow happened.
Note |
F5 connector supports only the IPFIX protocol. |
Note |
Each F5 connector reports only flows for one VRF. The connector puts the flows it exports into the VRF based on the Agent VRF configuration in the Cisco Secure Workload cluster. To configure the VRF for the connector, choose and click the Configuration tab. In this page, under the Agent Remote VRF Configurations section, click the Create Config and provide the details about the connector. The form requests you to provide: the name of the VRF, the IP subnet of the connector, and the range of port numbers that can potentially send flow records to the cluster. |
How to configure IPFIX on F5 BIG-IP
The following steps are for F5 BIG-IP load balancer. (Ref: Configuring F5 BIG-IP for IPFIX)
|
Purpose |
Description |
|---|---|
|
1. Create a pool of IPFIX collectors. |
On a F5 BIG-IP appliance, create the pool of IPFIX collectors. These are the IP addresses associated with F5 connectors on a Secure Workload Ingest appliance. F5 connectors run in Docker containers on the VM listen on port 4739 for IPFIX packets. |
|
2. Create a log-destination. |
The log destination configuration on a F5 BIG-IP appliance specifies the actual pool of IPFIX collectors that are used. |
|
3. Create a log-publisher. |
A log publisher specifies where F5 BIG-IP sends the IPFIX messages. The publisher is bound with a log-destination. |
|
4. Add a F5 and Secure Workload approved iRule. |
Secure Workload and F5 developed iRules that will export flow records to F5 connectors. These iRules will export complete information about a given transaction: including all the endpoints, byte and packet counts, flow start and end time (in milliseconds). F5 connectors will create 4 independent flows and match each flow with its related flow. |
|
5. Add the iRule to the virtual server. |
In the iRule settings of a virtual server, add the Secure Workload, approved iRule to the virtual server. |
The above steps configures IPFIX on F5 BIG-IP load balancer to export IPFIX protocol packets for traffic going through the appliance. Here is a sample config of F5.

In the example above, flow records will be published to ipfix-pub-1. ipfix-pub-1 is configured with log-destination ipfix-collector-1 which sends the IPFIX messages to IPFIX pool ipfix-pool-1. ipfix-pool-1 has 10.28.118.6 as one of the IPFIX collectors. The virtual server vip-1 is configured with IPFIX iRule ipfix-rule-1 which specifies the IPFIX template and how the template gets filled and sent.
-
F5 and Secure Workload approved iRule for TCP virtual server. For more information, see L4 iRule for TCP virtual server.
-
F5 and Secure Workload approved iRule for UDP virtual server. For more information, see L4 iRule for UDP virtual server.
-
F5 and Secure Workload approved iRule for HTTPS virtual server. For more information, see iRule for HTTPS virtual server.
Note |
Before using the iRule downloaded from this guide, update the log-publisher to point to the log-publisher configured in the F5 connector where you add the iRule. |
Note |
F5 has published a GitHub repository, f5-tetration to help you to start with flow-stitching. The iRules for publishing IPFIX records to the F5 connector for various protocol types are available at: f5-tetration/irules. Visit the site for the latest iRule definitions. In addition, F5 also develops a script to:
This tool minimizes manual configuration and user error while enabling flow-stitching use-case. The script is available at f5-tetration/scripts. |
How to Configure the Connector
For information about required virtual appliances, see Virtual Appliances for Connectors.
The following configurations are allowed on the connector.
-
LDAP: LDAP configuration supports discovery of LDAP attributes and provide a workflow to pick the attribute that corresponds to username and a list of up to 6 attributes to fetch for each user. For more information, see Discovery.
-
Log: For more information, see Log Configuration .
In addition, the listening ports of IPFIX protocol on the connector can be updated on the Docker container in Secure Workload Ingest appliance using a command that is allowed to be run on the container. This command can be issued on the appliance by providing the connector ID of the connector, type of the port to be update, and the new port information. The connector ID can be found on the connector page in Secure Workload UI. For more information, see update-listening-ports.
Limits
|
Metric |
Limit |
|---|---|
|
Maximum number of F5 connectors on one Secure Workload Ingest appliance |
3 |
|
Maximum number of F5 connectors on one Tenant (rootscope) |
10 |
|
Maximum number of F5 connectors on Secure Workload |
100 |
NetScaler Connector
NetScaler connector allows Secure Workload to ingest flow observations from Citrix ADCs (Citrix NetScalers). It allows Secure Workload to remotely monitor flow observations on Citrix ADCs and stitch client-side and server-side flows. Using this solution, the hosts do not need to run software agents, because Citrix ADCs will be configured to export IPFIX records to NetScaler connector for processing.

What is Citrix NetScaler AppFlow
Citrix NetScaler AppFlow collects flow data for traffic going through the NetScaler and exports IPFIX records to flow collectors. Citrix AppFlow protocol uses IPFIX to export the flows to flow collectors. Citrix AppFlow is supported in Citrix NetScaler load balancers.
Typically, the setup involves the following steps:
-
Enable AppFlow feature on one or more Citrix NetScaler instances.
-
Configure the AppFlow collector endpoint information on the remote network devices. This AppFlow collector will be listening on configured endpoint to receive and process flow records.
-
Configure AppFlow actions and policies to export flow records to AppFlow collectors.
Note |
NetScaler connector supports Citrix ADC software version 11.1.51.26 and above. |
Flow Ingestion to Secure Workload
NetScaler connector is essentially a Citrix AppFlow (IPFIX) collector. The connector receives the flow records from Citrix ADCs, stitch the NATed flows and forwards them to Secure Workload for flow analysis. A NetScaler connector can be enabled on a Cisco Secure Workload Ingest appliance and runs as a Docker container. NetScaler connector also registers with Secure Workload as a Secure Workload NetScaler agent.
Note |
NetScaler connector supports only IPFIX protocol. |
Note |
Each NetScaler connector should report only flows for one VRF. The flows exported by the connector is put in the VRF based on the Agent VRF configuration in the Secure Workload cluster. To configure the VRF for the connector, go to: and click the Configuration tab. In this page, under Agent Remote VRF Configurations section, click Create Config and provide the details about the connector. The form requests the user to provide: the name of the VRF, IP subnet of the connector, and range of port numbers that can potentially send flow records to the cluster. |
How to configure AppFlow on NetScaler
The following steps are for NetScaler load balancer. (Ref: Configuring AppFlow)
Procedure
|
Step 1 |
Enable AppFlow on NetScaler. |
|
Step 2 |
Add AppFlow collector endpoints. The collector receives the AppFlow records from NetScaler. Specify the IP and port of NetScaler connector enabled on a Secure Workload Ingest appliance as an AppFlow collector. |
|
Step 3 |
Configure an AppFlow action. This lists the collectors that will get AppFlow records if the associated AppFlow policy matches. |
|
Step 4 |
Configure an AppFlow policy. This is a rule that has to match for an AppFlow record to be generated. |
|
Step 5 |
Bind AppFlow policy to Virtual Server. Traffic hitting the IP of the virtual server (VIP) will be evaluated for AppFlow policy matches. On a match, a flow record is generated and sent to all collectors listed in the associated AppFlow action. |
|
Step 6 |
Optionally, bind AppFlow policy globally (for all virtual servers). An AppFlow policy could also be bound globally to all virtual servers. This policy applies to all traffic that flows through Citrix ADC. |
|
Step 7 |
Optionally, template refresh interval. The above steps configures AppFlow on Citrix NetScaler load balancer to export IPFIX protocol packets for traffic going through NetScaler. The flow records will be sent to either 172.26.230.173:4739 (for traffic going through vserver lb1) and to 172.26.230.184:4739 (for all traffic going through the NetScaler). Each flow record includes 5 tuple information of the traffic and the byte/packet count of the flow. The following screenshot shows a running configuration of AppFlow on a Citrix NetScaler load balancer. 
|
How to Configure the Connector
For information about required virtual appliances, see Virtual Appliances for Connectors. The following configurations are allowed on the connector.
-
Log: . For more information, see Log Configuration .
In addition, the listening ports of IPFIX protocol on the connector can be updated on the Docker container in Secure Workload Ingest appliance using a an allowed command. This command can be issued on the appliance by providing the connector ID of the connector, type of the port to be update, and the new port information. The connector ID can be found on the connector page in Secure Workload UI. . For more information, see update-listening-ports.
Limits
|
Metric |
Limit |
|---|---|
|
Maximum number of NetScaler connectors on one Secure Workload Ingest appliance |
3 |
|
Maximum number of NetScaler connectors on one Tenant (rootscope) |
10 |
|
Maximum number of NetScaler connectors on Secure Workload |
100 |
Cisco Secure Firewall Connector
Secure Firewall Connector (formerly known as ASA Connector) allows Secure Workload to ingest flow observations from Secure Firewall ASA (formerly known as Cisco ASA) and Secure Firewall Threat Defense (formerly known as Firepower Threat Defense or FTD). Using this solution, the hosts do not need to run software agents, because the Cisco switches will relay NetFlow Secure Event Logging (NSEL) records to Secure Firewall Connector hosted in a Secure Workload Ingest appliance for processing.

Cisco Secure Firewall ASA NetFlow Secure Event Logging (NSEL) provides a stateful, IP flow monitoring that exports significant events in a flow to a NetFlow collector. When an event causes a state change on a flow, an NSEL event is triggered that sends the flow observation along with the event that caused the state change to the NetFlow collector. The flow collector receives these flow records and stores them in their flow storage for offline querying and analysis.
Typically, the setup involves the following steps:
-
Enable NSEL feature on Secure Firewall ASA and/or Secure Firewall Threat Defense.
-
Configure the Secure Firewall connector endpoint information on Secure Firewall ASA and/or Secure Firewall Threat Defense. Secure Firewall connector will be listening on configured endpoint to receive and process NSEL records.
Flow Ingestion to Secure Workload
Secure Firewall connector is essentially a NetFlow collector. The connector receives the NSEL records from Secure Firewall ASA and Secure Firewall Threat Defense, and forwards them to Secure Workload for flow analysis. Secure Firewall connector can be enabled on a Secure Workload Ingest appliance and runs as a Docker container.
Secure Firewall connector also registers with Secure Workload as a Secure Workload agent. Secure Firewall connector decapsulates the NSEL protocol packets (i.e., flow records); then processes and reports the flows like a regular Secure Workload agent. Unlike a Deep Visibility Agent, it does not report any process or interface information.
Note |
Secure Firewall connector supports NetFlow v9 protocol. |
Note |
Each Secure Firewall connector should report only flows for one VRF. The flows exported by the connector is put in the VRF based on the Agent VRF configuration in Secure Workload cluster. To configure the VRF for the connector, go to: and click the Configuration tab. In this page, under Agent Remote VRF Configurations section, click Create Config and provide the details about the connector. The form requests the user to provide: the name of the VRF, IP subnet of the connector, and range of port numbers that can potentially send flow records to the cluster. |
Handling NSEL Events
The following table shows how various NSEL events are handled by Secure Firewall connector. For more information about these elements, see IP Flow Information Export (IPFIX) Entities document.
|
Flow Event Element ID: 233 Element Name: NF_F_FW_EVENT |
Extended Flow Event Element ID: 33002 Element Name: NF_F_FW_EXT_EVENT |
Action on Secure Firewall connector |
|---|---|---|
|
0 (default, ignore this value) |
Don’t care |
No op |
|
1 (Flow created) |
Don’t care |
Send flow to Secure Workload |
|
2 (Flow deleted) |
> 2000 (indicates the termination reason) |
Send flow to Secure Workload |
|
3 (Flow denied) |
1001 (denied by ingress ACL) |
Send flow with disposition marked as rejected to Secure Workload |
|
1002 (denied by egress ACL) |
||
|
1003 (denied connection by ASA interface or denied ICMP(v6) to device) |
||
|
1004 (first packet on TCP is not SYN) |
||
|
4 (Flow alert) |
Don’t care |
No op |
|
5 (Flow updated) |
Don’t care |
Send flow to Secure Workload |
Based on the NSEL record, Secure Firewall connector sends flow observation to Secure Workload. NSEL flow records are bidirectional. So, Secure Firewall connector sends 2 flows: forward flow and reverse flow to Secure Workload.
Here are the details about flow observation sent by Secure Firewall connector to Secure Workload.
Forward Flow observation
|
Field |
NSEL Element ID |
NSEL Element Name |
|---|---|---|
|
Protocol |
4 |
NF_F_PROTOCOL |
|
Source Address |
8 |
NF_F_SRC_ADDR_IPV4 |
|
27 |
NF_F_SRC_ADDR_IPV6 |
|
|
Source Port |
7 |
NF_F_SRC_PORT |
|
Destination Address |
12 |
NF_F_DST_ADDR_IPV4 |
|
28 |
NF_F_DST_ADDR_IPV6 |
|
|
Destination Port |
11 |
NF_F_DST_PORT |
|
Flow Start Time |
152 |
NF_F_FLOW_CREATE_TIME_MSEC |
|
Byte Count |
231 |
NF_F_FWD_FLOW_DELTA_BYTES |
|
Packet Count |
298 |
NF_F_FWD_FLOW_DELTA_PACKETS |
Reverse Flow Information
|
Field |
NSEL Element ID |
NSEL Element Name |
|---|---|---|
|
Protocol |
4 |
NF_F_PROTOCOL |
|
Source Address |
12 |
NF_F_DST_ADDR_IPV4 |
|
28 |
NF_F_DST_ADDR_IPV6 |
|
|
Source Port |
11 |
NF_F_DST_PORT |
|
Destination Address |
8 |
NF_F_SRC_ADDR_IPV4 |
|
27 |
NF_F_SRC_ADDR_IPV6 |
|
|
Destination Port |
7 |
NF_F_SRC_PORT |
|
Flow Start Time |
152 |
NF_F_FLOW_CREATE_TIME_MSEC |
|
Byte Count |
232 |
NF_F_REV_FLOW_DELTA_BYTES |
|
Packet Count |
299 |
NF_F_REV_FLOW_DELTA_PACKETS |
NAT
If the client to ASA flow is NATed, NSEL flow records indicate the NATed IP/port on the server side. Secure Firewall connector uses this information to stitch server to ASA and ASA to client flows.
Here is the NATed flow record in the forward direction.
|
Field |
NSEL Element ID |
NSEL Element Name |
|---|---|---|
|
Protocol |
4 |
NF_F_PROTOCOL |
|
Source Address |
225 |
NF_F_XLATE_SRC_ADDR_IPV4 |
|
281 |
NF_F_XLATE_SRC_ADDR_IPV6 |
|
|
Source Port |
227 |
NF_F_XLATE_SRC_PORT |
|
Destination Address |
226 |
NF_F_XLATE_DST_ADDR_IPV4 |
|
282 |
NF_F_XLATE_DST_ADDR_IPV6 |
|
|
Destination Port |
228 |
NF_F_XLATE_DST_PORT |
|
Flow Start Time |
152 |
NF_F_FLOW_CREATE_TIME_MSEC |
|
Byte Count |
231 |
NF_F_FWD_FLOW_DELTA_BYTES |
|
Packet Count |
298 |
NF_F_FWD_FLOW_DELTA_PACKETS |
The forward flow will be marked as related to the NATed flow record in the forward direction (and vice versa)
Here is the NATed flow record in the reverse direction
|
Field |
NSEL Element ID |
NSEL Element Name |
|---|---|---|
|
Protocol |
4 |
NF_F_PROTOCOL |
|
Source Address |
226 |
NF_F_XLATE_DST_ADDR_IPV4 |
|
282 |
NF_F_XLATE_DST_ADDR_IPV6 |
|
|
Source Port |
228 |
NF_F_XLATE_DST_PORT |
|
Destination Address |
225 |
NF_F_XLATE_SRC_ADDR_IPV4 |
|
281 |
NF_F_XLATE_SRC_ADDR_IPV6 |
|
|
Destination Port |
227 |
NF_F_XLATE_SRC_PORT |
|
Flow Start Time |
152 |
NF_F_FLOW_CREATE_TIME_MSEC |
|
Byte Count |
232 |
NF_F_REV_FLOW_DELTA_BYTES |
|
Packet Count |
299 |
NF_F_REV_FLOW_DELTA_PACKETS |
The reverse flow will be marked as related to the NATed flow record in the reverse direction (and vice versa).
Note |
Only NSEL element IDs listed in this section are supported by Secure Firewall connector. |
TCP Flags Heuristics
The NSEL records do not have TCP flags information. The Secure Firewall connector uses the following heuristics to set the TCP flags so that the flows can be further analyzed by automatic policy discovery:
-
If there are at least one forward packets, adds
SYNto the forward flow TCP flags. -
If there are at least two forward packets and one reverse packet, adds
ACKto the forward flow TCP flags andSYN-ACKto the reverse flow TCP flags. -
If the previous condition holds true and the flow event is Flow deleted, adds
FINto both forward and reverse TCP flags.
How to Configure NSEL on Secure Firewall ASA
The following steps are guidelines on how to configure NSEL and export NetFlow packets to a collector (i.e., Secure Firewall connector). For more information, see the official Cisco configuration guide at Cisco Secure Firewall ASA NetFlow Implementation Guide for more details.
    flow-export destination outside 172.29.142.27 4729
    flow-export template timeout-rate 1
    !
    policy-map flow_export_policy
      class class-default
      flow-export event-type flow-create destination 172.29.142.27
      flow-export event-type flow-teardown destination 172.29.142.27
      flow-export event-type flow-denied destination 172.29.142.27
      flow-export event-type flow-update destination 172.29.142.27
      user-statistics accounting
    service-policy flow_export_policy global
In this example, Secure Firewall ASA appliance is configured to sent NetFlow packets to 172.29.142.27 on port 4729. In addition, flow-export actions are enabled on flow-create, flow-teardown, flow-denied, and flow-update events. When these flow events occur on ASA, a NetFlow record is generated and sent to the destination specified in the configuration.
Assuming a Secure Firewall connector is enabled on Secure Workload and listening on 172.29.142.27:4729 in a Secure Workload Ingest appliance, the connector will receive NetFlow packets from Secure Firewall ASA appliance. The connector processes the NetFlow records as discussed in Handling NSEL Events and exports flow observations to Secure Workload. In addition, for NATed flows, the connector stitches the related flows (client-side and server-side) flows.
How to Configure the Connector
For information about required virtual appliances, see Virtual Appliances for Connectors. The following configurations are allowed on the connector.
-
Log: For more information, see Log Configuration .
In addition, the listening ports of IPFIX protocol on the connector can be updated on the Docker container in Secure Workload Ingest appliance using a an allowed command. This command can be issued on the appliance by providing the connector ID of the connector, type of the port to be update, and the new port information. The connector ID can be found on the connector page in Secure Workload UI. For more information, see update-listening-ports.
Limits
|
Metric |
Limit |
|---|---|
|
Maximum number of Secure Firewall connectors on one Secure Workload Ingest appliance |
1 |
|
Maximum number of Secure Firewall connectors on one Tenant (rootscope) |
10 |
|
Maximum number of Secure Firewall connectors on Secure Workload |
100 |
Meraki Connector
Meraki connector allows Secure Workload to ingest flow observations from Meraki firewalls (included in Meraki MX security appliances and wireless access points). Using this solution, the hosts do not need to run software agents, because the Cisco switches will relay NetFlow records to Meraki connector hosted in a Secure Workload Ingest appliance for processing.

What is NetFlow
NetFlow protocol allows network devices such as Meraki Firewall to aggregate traffic that passes through them into flows and export these flows to a flow collector. The flow collector receives these flow records and stores them in their flow storage for offline querying and analysis.
Typically, the setup involves the following steps:
-
Enable NetFlow statistics reporting on Meraki Firewall.
-
Configure the NetFlow collector endpoint information on Meraki Firewall.
Flow Ingestion to Secure Workload
Meraki connector is essentially a NetFlow collector. The connector receives the flow records from the Meraki firewalls that are configured to export NetFlow traffic statistics. It processes the NetFlow records and sends the flow observations reported by Meraki firewalls to Secure Workload for flow analysis. A Meraki connector can be enabled on a Secure Workload Ingest appliance and runs as a Docker container.
Meraki connector also registers with Secure Workload as a Secure Workload Meraki agent. Meraki connector decapsulates the NetFlow protocol packets (i.e., flow records); then processes and reports the flows like a regular Secure Workload agent. Unlike a Deep Visibility Agent, it does not report any process or interface information.
Note |
Meraki connector supports NetFlow v9 protocol. |
Note |
Each Meraki connector should report only flows for one VRF. The flows exported by the connector is put in the VRF based on the Agent VRF configuration in Secure Workload cluster. To configure the VRF for the connector, go to: and click the Configuration tab. In this page, under Agent Remote VRF Configurations section, click Create Config and provide the details about the connector. The form requests the user to provide: the name of the VRF, IP subnet of the connector, and range of port numbers that can potentially send flow records to the cluster. |
Handling NetFlow Records
Based on the NetFlow record, Meraki connector sends flow observation to Secure Workload. Meraki NetFlow flow records are bidirectional. So, Meraki connector sends 2 flows: forward flow and reverse flow to Secure Workload.
Here are the details about flow observation sent by Meraki connector to Secure Workload.
Forward Flow observation
|
Field |
Element ID |
Element Name |
|---|---|---|
|
Protocol |
4 |
protocolIdentifier |
|
Source Address |
8 |
sourceIPv4Address |
|
Source Port |
7 |
sourceTransportPort |
|
Destination Address |
12 |
destinationIPv4Address |
|
Destination Port |
11 |
destinationTransportPort |
|
Byte Count |
1 |
octetDeltaCount |
|
Packet Count |
2 |
packetDeltaCount |
|
Flow Start Time |
Set based on when the NetFlow record for this flow is received on the connector |
Reverse Flow Information
|
Field |
Element ID |
|
|---|---|---|
|
Protocol |
4 |
protocolIdentifier |
|
Source Address |
8 |
sourceIPv4Address |
|
Source Port |
7 |
sourceTransportPort |
|
Destination Address |
12 |
destinationIPv4Address |
|
Destination Port |
11 |
destinationTransportPort |
|
Byte Count |
23 |
postOctetDeltaCount |
|
Packet Count |
24 |
postPacketDeltaCount |
|
Flow Start Time |
Set based on when the NetFlow record for this flow is received on the connector |
How to configure NetFlow on Meraki Firewall
The following steps show how to configure NetFlow reporting on Meraki Firewall.
Procedure
|
Step 1 |
Login to Meraki UI console. |
|
Step 2 |
Navigate to . In Reporting settings, enable NetFlow traffic reporting and make sure the value is set to Enabled: send NetFlow traffic statistics. |
|
Step 3 |
Set NetFlow collector IP and NetFlow collector port to the IP and port on which Meraki connector is listening in Secure Workload Ingest appliance. Default port on which Meraki connector listens for NetFlow records is 4729. |
|
Step 4 |
Save the changes. 
|
How to Configure the Connector
For information about required virtual appliances, see Virtual Appliances for Connectors. The following configurations are allowed on the connector.
-
Log: For more information, see Log Configuration .
In addition, the listening ports of NetFlow v9 protocol on the connector can be updated on the Docker container in Secure Workload Ingest appliance using an allowed command. This command can be issued on the appliance by providing the connector ID of the connector, type of the port to be update, and the new port information. The connector ID can be found on the connector page in Secure Workload UI. For more information, see update-listening-ports.
Limits
|
Metric |
Limit |
|---|---|
|
Maximum number of Meraki connectors on one Secure Workload Ingest appliance |
1 |
|
Maximum number of Meraki connectors on one Tenant (rootscope) |
10 |
|
Maximum number of Meraki connectors on Secure Workload |
100 |
ERSPAN Connector
ERSPAN connector allows Secure Workload to ingest flow observations from routers and switches in the network. Using this solution, the hosts do not need to run software agents, because the Cisco switches will relay the hosts’ traffic to the ERSPAN connector for processing.
What is ERSPAN
Encapsulated Remote Switch Port Analyzer (ERSPAN) is a feature present in most of Cisco switches. It mirrors frames seen by a network device, encapsulates them in a IP packet and sends them to a remote analyzer. Users can select a list of interfaces and/or VLANS on the switch to be monitored.
Commonly, the setup involves configuring source ERSPAN monitoring session(s) on one or more network devices and configuring the destination ERSPAN monitoring session(s) on the remote network device(s) directly connected to a traffic analyzer.
The Secure Workload ERSPAN connector provides both the destination ERSPAN session and traffic analyzer functionalities; therefore there is no need to configure any destination sessions on the switches with the Secure Workload solution.
What are the SPAN Agents
Each ERSPAN connector registers a SPAN agent with the cluster. The Secure Workload SPAN agents are regular Secure Workload agents configured to only process ERSPAN packets: Like Cisco destination ERSPAN sessions, they decapsulate the mirrored frames; then they process and report the flows like a regular Secure Workload agent. Unlike Deep Visibility Agents, they do not report any process or interface information.
What is the Ingest Appliance for ERSPAN
The Secure Workload Ingest appliance for ERSPAN is a VM that internally runs three ERSPAN Secure Workload connectors. It uses the same OVA or QCOW2 as the normal Ingest appliance.
Each connector runs inside a dedicated Docker container to which one vNIC and two vCPU cores with no limiting quota are exclusively assigned.
The ERSPAN connector register a SPAN agent with the cluster with the container hostname: <VM hostname>-<interface IP address>.
The connectors and agents are preserved/restored upon VM, Docker daemon or Docker container crash/reboot.
Note |
The ERSPAN connector’s status will be reported back to the Connector page. See the Agent List page and check the corresponding SPAN agents state. |
For more information about required virtual appliances, see Virtual Appliances for Connectors. For ERSPAN connectors, IPv4 and IPv6 (dual stack mode) addresses are supported. However, do note that dual stack support is a BETA feature.
How to configure the source ERSPAN session
The following steps are for a Nexus 9000 switch. The configurations may slightly differ for other Cisco platforms. For configuring a Cisco platform, see the Cisco Secure Workload User Guide.

The above steps created a source ERSPAN session with id 10. The switch will mirror the frames ingressing and egressing (both) the interface eth1/23 and the ones on VLANS 315 and 512. The outer GRE packet carrying the mirrored frame will have source IP 172.28.126.1 (must be the address of a L3 interface on this switch) and destination IP 172.28.126.194. This is one of the IP addresses configured on the ERSPAN VM.
Supported ERSPAN formats
The Secure Workload SPAN Agents can process ERSPAN type I, II and III packets described in the proposed ERSPAN RFC. Therefore they can process ERSPAN packets generated by Cisco devices. Among the non RFC compliant formats, they can process the ERSPAN packets generated by VMware vSphere Distributed Switch (VDS).
Performance considerations when configuring ERSPAN source
Carefully choose the ERSPAN source’s port/VLAN list. Although the SPAN agent has two dedicated vCPUs, the session may generate considerable amount of packets which could saturate the processing power of the agent. If an agent is receiving more packets than it can process, it will be shown in the Agent Packet Misses graph on the cluster’s Deep Visibility Agent page.
More fine grained tuning on which frames the ERSPAN source will mirror can be achieved with ACL policies, usually via the filter configuration keyword.
If the switch supports it, the ERSPAN source session can be configured to modify the maximum transport unit (MTU) of the ERSPAN packet (commonly the default value 1500 bytes), usually via a mtu keyword. Decreasing it will limit the ERSPAN bandwidth usage in your network infrastructure, but it will have no effect on the SPAN Agent load, given the agent’s workload is on a per-packet basis. When reducing this value, allow room for 160 bytes for the mirrored frame. For the ERSPAN header overhead details, see the proposed ERSPAN RFC.
There are three versions of ERSPAN. The smaller the version, the lower the ERSPAN header overhead. Version II and III allow for applying QOS policies to the ERSPAN packets, and provide some VLAN info. Version III carries even more settings. Version II is usually the default one on Cisco switches. While Secure Workload SPAN Agents support all three versions, at the moment they do not make use of any extra information the ERSPAN version II and III packets carry.
Security considerations
The Ingest Virtual Machine for ERSPAN guest Operating System is CentOS 7.9, from which OpenSSL server/clients packages were removed.
Note |
CentOS 7.9 is the guest operating system for Ingest and Edge virtual appliances in Secure Workload 3.8.1.19 and earlier releases. Starting Secure Workload 3.8.1.36, the operating system is AlmaLinux 9.2. |
Once the VM is booted and the SPAN agent containers are deployed (this takes a couple of minutes on first time boot only), no network interfaces, besides the loopback, will be present in the Virtual Machine. Therefore the only way to access the appliance is via its console.
The VM network interface are now moved inside the Docker containers. The containers run a centos:7.9.2009 based Docker image with no TCP/UDP port open.
Note |
Starting Secure Workload 3.8.1.36, the containers run almalinux/9-base:9.2. |
Also, the containers are run with the base privileges (no –privileged option) plus the NET_ADMIN capability.
In the unlikely case a container is compromised, the VM guest OS should not be compromisable from inside the container.
All the other security consideration valid for Secure Workload Agents running inside a host do also apply to the Secure Workload SPAN Agents running inside the Docker containers.
Troubleshooting
Once SPAN Agents show in active state in the cluster Monitoring/Agent Overview page, no action is needed on the ERSPAN Virtual Machine, user does not need to log into it. If that is not happening or if the flows are not reported to the cluster, following information will help pinpoint deployment problems.
In normal conditions, on the VM:
-
systemctl status tet_vm_setupreports an inactive service with SUCCESS exit status; -
systemctl status tet-nic-driverreports an active service; -
docker network lsreports five networks:host, noneand threeerspan-<iface name>; -
ip linkonly reports the loopback interface; -
docker psreports three running containers; -
docker logs <cid>for each container contains the message:INFO success: tet-sensor entered RUNNING state, process has stayed up for > than 1 seconds (startsecs) -
docker exec <cid> ifconfigreports only one interface, besides the loopback; -
docker exec <cid> route -nreports the default gateway; -
docker exec <cid> iptables -t raw -S PREROUTINGreports the rule-A PREROUTING -p gre -j DROP;
If any of the above does not hold true, check the deployment script logs in /local/tetration/logs/ tet_vm_setup.log for the reason why the SPAN agent containers deployment failed.
Any other agent registration/connectivity issue can be troubleshooted the same way it is done for agents running on a host via the docker exec command:
-
docker exec <cid> ps -efreports the twotet-engine, tet-engine check_confinstances and two/usr/local/tet/tet-sensor -f /usr/local/tet/conf/.sensor_configinstances, one with root user and one with tet-sensor user, along with the process manager/usr/bin/ python /usr/bin/supervisord -c /etc/supervisord.conf -ninstance. -
docker exec <cid> cat /usr/local/tet/log/tet-sensor.logshows the agent’s logs; -
docker exec <cid> cat /usr/local/tet/log/fetch_sensor_id.logshows the agent’s registration logs; -
docker exec <cid> cat /usr/local/tet/log/check_conf_update.logshows the configuration update polling logs;If necessary, traffic to/from the container can be monitored with tcpdump after setting into the container’s network namespace:
-
Retrieve the container’s network namespace (SandboxKey) via docker inspect <cid> | grep SandboxKey;
-
Set into the container’s network namespace nsenter --net=/var/run/docker/netns/...;
-
Monitor eth0 traffic tcpdump -i eth0 -n.
-
Limits
|
Metric |
Limit |
|---|---|
|
Maximum number of ERSPAN connectors on one Secure Workload Ingest appliance |
3 |
|
Maximum number of ERSPAN connectors on one Tenant (rootscope) |
24 (12 for TaaS) |
|
Maximum number of ERSPAN connectors on Secure Workload |
450 |
Connectors for Endpoints
Connectors for endpoints provide endpoint context for Secure Workload.
|
Connector |
Description |
Deployed on Virtual Appliance |
|---|---|---|
|
AnyConnect |
Collect telemetry data from Cisco AnyConnect Network Visibility Module (NVM) and enrich endpoint inventories with user attributes |
Secure Workload Ingest |
|
ISE |
Collect information about endpoints and inventories managed by Cisco ISE appliances and enrich endpoint inventories with user attributes and secure group labels (SGL). |
Secure Workload Edge |
For more information about required virtual appliances, see Virtual Appliances for Connectors.
AnyConnect Connector
AnyConnect connector monitors endpoints that run Cisco AnyConnect Secure Mobility Client with Network Visibility Module (NVM). Using this solution, the hosts do not need to run any software agents on endpoints, because NVM sends host, interface, and flow records in IPFIX format to a collector (e.g., AnyConnect connector).
AnyConnect connector does the following high-level functions.
-
Register each endpoint (supported user devices such as a desktop, a laptop, or a smartphone) on Cisco Secure Workload as an AnyConnect agent.
-
Update interface snapshots from these endpoints with Secure Workload.
-
Send flow information exported by these endpoints to Secure Workload collectors.
-
Periodically send process snapshots for processes that generate flows on the endpoints tracked by the AnyConnect connector.
-
Label endpoint interface IP addresses with Lightweight Directory Access Protocol (LDAP) attributes corresponding to the logged-in-user at each endpoint.
Figure 11. AnyConnect connector 
What is AnyConnect NVM
AnyConnect NVM provides visibility and monitoring of endpoint and user behavior both on and off premises. It collects information from endpoints that includes the following context.
-
Device/Endpoint Context: Device/endpoint specific information.
-
User Context: Users associated with the flow.
-
Application Context: Processes associated with the flow.
-
Location Context: Location specific attributes -if available.
-
Destination Context: FQDN of the destination. AnyConnect NVM generates 3 types of records.
NVM Record
Description
Endpoint Record
Device/endpoint information including unique device identifier (UDID), hostname, OS name, OS version and manufacturer.
Interface Record
Information about each interface in the endpoint including the endpoint UDID, interface unique identifier (UID), interface index, interface type, interface name, and MAC address.
Flow Record
Information about flows seen on the endpoint including endpoint UDID, interface UID, 5-tuple (source/destination ip/port and protocol), in/out byte counts, process information, user information, and fqdn of the destination.
Each record is generated and exported in IPFIX protocol format. When the device is in a trusted network (on- premise/VPN), AnyConnect NVM exports records to a configured collector. AnyConnect connector is an example IPFIX collector that can receive and process IPFIX stream from AnyConnect NVM.
Note |
AnyConnect connector supports AnyConnect NVM from 4.2+ versions of Cisco AnyConnect Secure Mobility Client. |
How to configure AnyConnect NVM
See How to Implement AnyConnect NVM document for step by step instructions on how to implement AnyConnect NVM using either Cisco Secure Firewall ASA or Cisco Identity Services engine (ISE). Once NVM module is deployed, an NVM profile should be specified and pushed to and installed on the endpoints running Cisco AnyConnect Secure Mobility Client. When specifying NVM profile, the IPFIX collector should be configured to point to AnyConnect connector on port 4739.
AnyConnect connector also registers with Secure Workload as a Secure Workload AnyConnect Proxy agent.
Processing NVM records
AnyConnect connector processes AnyConnect NVM records as shown below.
Endpoint Record
Upon receiving an endpoint record, AnyConnect connector registers that endpoint as AnyConnect agent on Secure Workload. AnyConnect connector uses the endpoint specific information present in the NVM record along with AnyConnect connector’s certificate to register the endpoint. Once an endpoint is registered, data-plane for the endpoint is enabled by creating a new connection to one of the collectors in Secure Workload. Based on the activity (flow records) from this endpoint, AnyConnect connector checks-in the AnyConnect agent corresponding to this endpoint with the cluster periodically (20-30 minutes).
AnyConnect NVM starts to send agent version from 4.9. By default, the AnyConnect endpoint would be registered as version 4.2.x on Secure Workload. This version indicates the minimum supported AnyConnect NVM version. For the AnyConnect endpoints with version 4.9 or newer, the corresponding AnyConnect agent on Secure Workload would show the actual version installed.
Note |
The AnyConnect agent installed version is not controlled by Secure Workload. Attempting to upgrade the AnyConnect endpoint agent on Secure Workload UI would not take effect. |
Interface Record
Interface Record IP address for an interface is not part of the AnyConnect NVM interface record. IP address for an interface is determined when flow records start coming from the endpoint for that interface. Once IP address is determined for an interface, AnyConnect connector sends a complete snapshot of all interfaces of that endpoint whose IP address is determined to config server of Secure Workload. This associates the VRF with the interface data and flows coming in on these interfaces will now be marked with this VRF.Flow Record
Upon receiving a flow record, AnyConnect connector translates the record to the format that Secure Workload understands and sends FlowInfo over the dataplane corresponding to that endpoint. Furthermore, it stores process information included in the flow record locally. In addition, if LDAP configuration is provided to AnyConnect connector, it determines values for configured LDAP attributes of the logged-in-user of the endpoint. The attributes are associated to the endpoint IP address where the flow happened. Periodically, process information and user labels are pushed to Secure Workload.
Note |
Each AnyConnect connector will report only endpoints/interfaces/ flows for one VRF. The endpoints and interfaces reported by AnyConnect connector are associated with the VRF based on the Agent VRF configuration in Secure Workload. The flows exported by the AnyConnect connector agent on behalf of the AnyConnect endpoint belong to the same VRF. To configure the VRF for the agent, go to: and click the Configuration tab. In this page, under “Agent Remote VRF Configurations” section, click “Create Config” and provide the details about the AnyConnect connector. The form requests the user to provide: the name of the VRF, IP subnet of the host on which the agent is installed, and range of port numbers that can potentially send flow records to the cluster. |
Duplicate UDIDs in Windows Endpoints
If endpoint machines are cloned from the same golden image, it is possible that the UDID of all cloned endpoints are identical. In such cases, AnyConnect connector receives endpoint records from these endpoints with identical UDID and registers them on Secure Workload with same UDID. When interface/flow records are received by the connector from these endpoints, it is impossible for the connector to determine the correct AnyConnect agent on Secure Workload to associate the data. The connector associates all the data to one endpoint (and it is not deterministic).
To deal with this problem, AnyConnect NVM 4.8 release ships a tool called dartcli.exe to find and regenerate UDID on the endpoint.
-
dartcli.exe -u retrieves the UDID of the endpoint.
-
dartcli.exe -nu regenerates the UDID of the endpoint. To run this tool, use the following steps.
    C:\Program Files (x86)\Cisco\Cisco AnyConnect Secure Mobility Client\DART>dartcli.exe -u
    UDID : 8D0D1E8FA0AB09BE82599F10068593E41EF1BFFF

    C:\Program Files (x86)\Cisco\Cisco AnyConnect Secure Mobility Client\DART>dartcli.exe -nu
    Are you sure you want to re-generate UDID [y/n]: y
    Adding nonce success
    UDID : 29F596758941E606BD0AFF49049216ED5BB9F7A5

    C:\Program Files (x86)\Cisco\Cisco AnyConnect Secure Mobility Client\DART>dartcli.exe -u
    UDID : 29F596758941E606BD0AFF49049216ED5BB9F7A5
Periodic Tasks
Periodically, AnyConnect connector sends process snapshots and user labels on AnyConnect endpoint inventories.
-
Process Snapshots: every 5 minutes, AnyConnect connector walks through the processes it maintains locally for that interval and sends process snapshot for all the endpoints that had flows during that interval.
-
User Labels: every 2 minutes, AnyConnect connector walks through the LDAP user labels it maintains locally and updates User Labels on those IP addresses.
For user labels, AnyConnect connector creates a local snapshot of LDAP attributes of all users in the organization. When AnyConnect connector is enabled, configuration for LDAP (server/port information, attributes to fetch for a user, attribute that contains the username) may be provided. In addition, the LDAP user credentials to access LDAP server may be provided. LDAP user credentials are encrypted and never revealed in the AnyConnect connector. Optionally, an LDAP certificate may be provided for securely accessing LDAP server.
Note |
AnyConnect connector creates a new local LDAP snapshot every 24 hours. This interval is configurable in LDAP configuration of the connector. |
How to Configure the Connector
For information about required virtual appliances, see Virtual Appliances for Connectors. The following configurations are allowed on the connector.
-
LDAP: LDAP configuration supports discovery of LDAP attributes and provide a workflow to pick the attribute that corresponds to username and a list of up to 6 attributes to fetch for each user. For more information, see Discovery .
-
Endpoint: For more information, see Endpoint Configuration.
-
Log: For more information, see Log Configuration.
In addition, the listening ports of IPFIX protocol on the connector can be updated on the Docker container in Secure Workload Ingest appliance using an allowed command. This command can be issued on the appliance by providing the connector ID of the connector, type of the port to be update, and the new port information. The connector ID can be found on the connector page in Secure Workload UI. For more information, see update-listening-ports.
Limits
|
Metric |
Limit |
|---|---|
|
Maximum number of AnyConnect connectors on one Secure Workload Ingest appliance |
1 |
|
Maximum number of AnyConnect connectors on one Tenant (rootscope) |
50 |
|
Maximum number of AnyConnect connectors on Secure Workload |
500 |
ISE Connector
The ISE connector in Secure Workload connects with Cisco Identity Services Engine (ISE) and ISE Passive Identity Connector (ISE-PIC) using the Cisco Platform Exchange Grid (pxGrid), to retrieve contextual information, such as metadata, for endpoints reported by ISE.
An ISE connector performs these functions:
-
Registers each endpoint that are identified as an ISE endpoint on Secure Workload.
-
Updates metadata information on Secure Workload regarding the endpoints, such as MDM details, authentication, Security Group labels, ISE group name, and ISE group type.
-
Periodically takes a snapshot and updates the cluster with active endpoints visible on the ISE. Figure 12. ISE connector 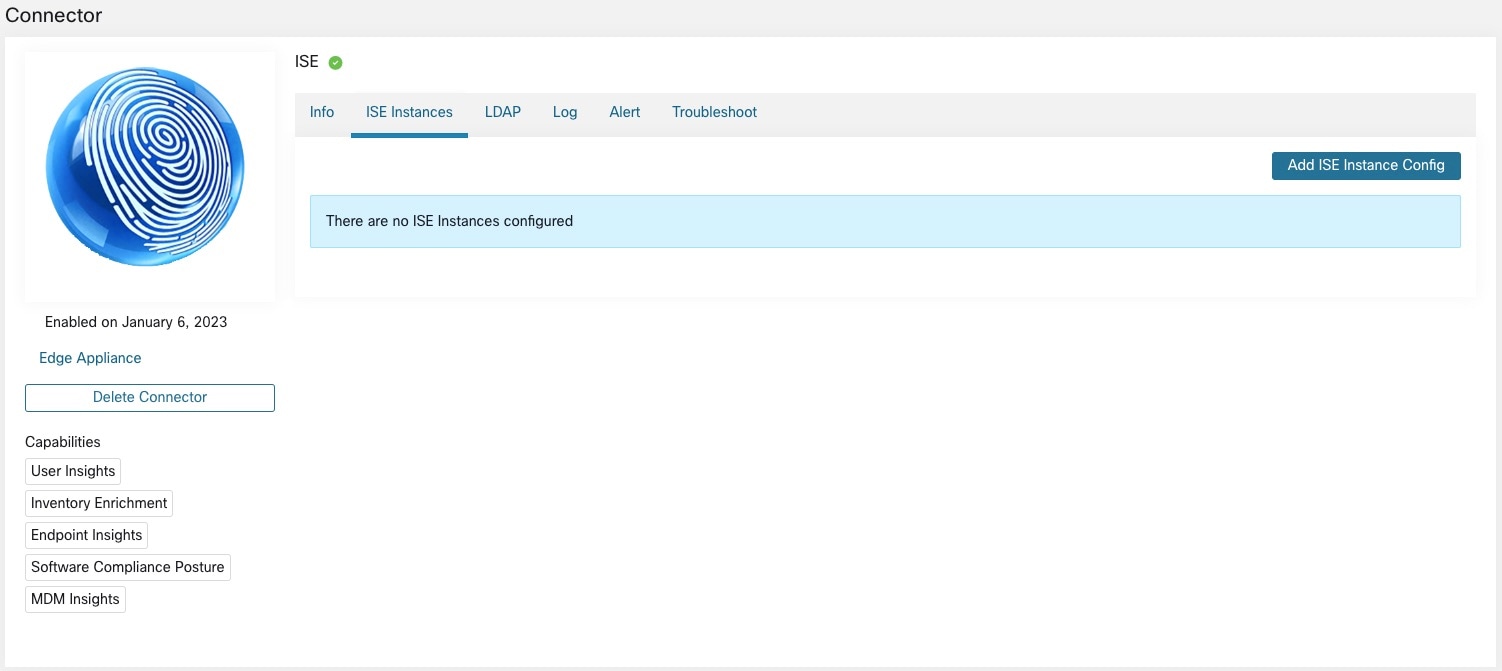
Note |
Each ISE connector registers only endpoints and interfaces for one VRF. The endpoints and interfaces reported by ISE connectors are associated with the VRF based on the Agent VRF configuration in Secure Workload. To configure the VRF for the agent, from the navigation pane, choose and click the Configuration tab. In this page, under the Agent Remote VRF Configurations section, click Create Config and provide the details about the ISE connector—Name of the VRF, IP subnet of the host on which the agent is installed, and the range of port numbers that can potentially register ISE endpoints and interfaces on Secure Workload. |
Note |
The ISE endpoint agents are not listed on the Agents List page; instead ISE endpoints with the attributes can be viewed on the Inventory page. |
How to Configure the Connector
Note |
ISE version 2.4+ and ISE PIC version 3.1+ are required for this integration. |
For information about required virtual appliances, see Virtual Appliances for Connectors. For ISE connectors, IPv4 and IPv6 (dual stack mode) addresses are supported. However, do note that dual stack support is a BETA feature.
The following configurations are allowed on the connector.
-
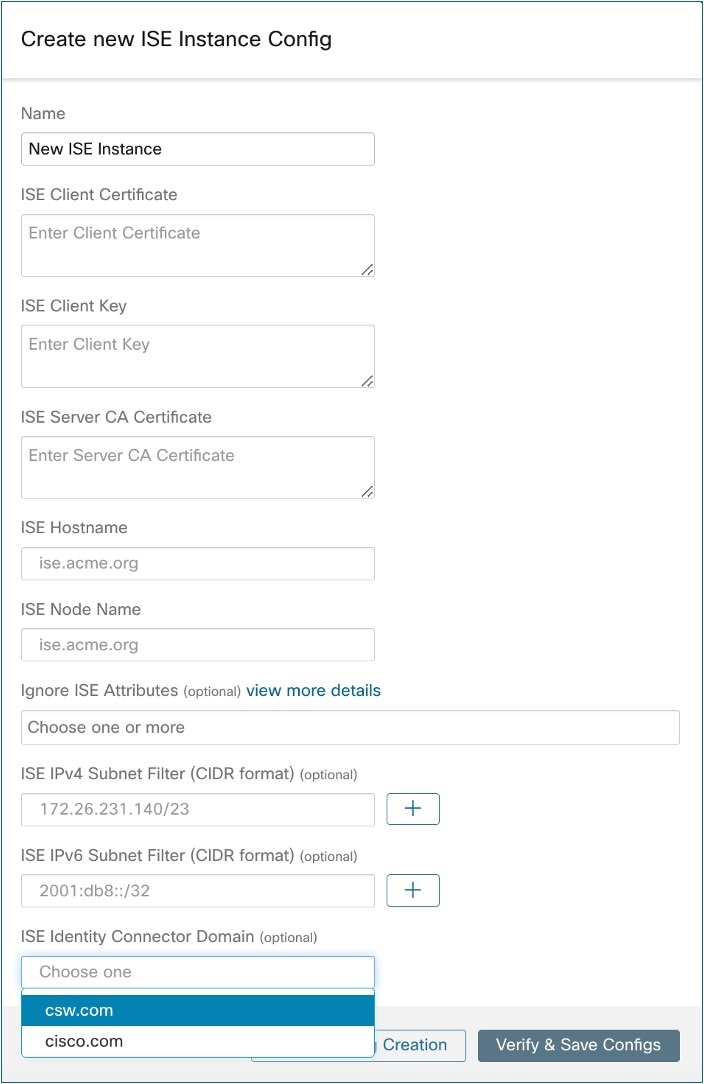
ISE Instance: ISE connector can connect to multiple instances of ISE using provided configurations. Each instance requires ISE certificate credentials along with hostname and nodename to connect to ISE. For more information, see ISE Instance Configuration.
-
LDAP: LDAP configuration supports discovery of LDAP attributes and provides a workflow to select the attribute that corresponds to username and a list of up to six attributes to fetch for each user. For more information, see Discovery .
-
Log: For more information, see Log Configuration.
Note
ISE connector connects with the getSessions API call to fetch all active endpoints during the timeframe. The ISE connector also has a listener that subscribes to session topic in PxGrid that provides all the new endpoints updates.
ISE Instance Configuration

Note |
Starting Cisco Secure Workload version 3.7, the SSL certificate for Cisco ISE pxGrid node requires Subject Alternative Names (SAN) for this integration. Ensure the certification configuration of the ISE nodes is done by your ISE administrator prior to performing the integration with Secure Workload. |
To verify your pxGrid node’s certificate and confirm if SAN is configured, you need to do the following to verify the certificate from ISE.
Procedure
|
Step 1 |
Go to Certificates under . |
||||||||||||||||||||||
|
Step 2 |
Under Certificate Management, select System Certificates, select your “Used by” pxGrid certificate and choose View to review the pxGrid node cert. |
||||||||||||||||||||||
|
Step 3 |
Scroll the certificate and ensure the Subject Alternative Names are configured for this certificate. |
||||||||||||||||||||||
|
Step 4 |
This certificate should be signed by a valid Certificate Authority (CA), which should also be used to sign the pxGrid client certificate used for the Secure Workload ISE connector.  |
||||||||||||||||||||||
|
Step 5 |
You can now generate the pxGrid client certificate signing request using the following template on any host installed with OpenSSL. Save the file as ‘example-connector.cfg’ and use the OpenSSL command from your host to generate a Certificate Signing Request (CSR) and the certificate private key with the following command. |
||||||||||||||||||||||
|
Step 6 |
Sign the Certificate Signing Request (CSR) by your CA using a Windows CA server. If you are also using a Windows CA server, run the following command to sign the pxGrid client’s CSR.
 |
||||||||||||||||||||||
|
Step 7 |
Copy the signed client certificate and the root CA in PEM format onto your host. This is the same host that generates the client CSR and the private key. Use OpenSSL to ensure the client certificate is in X.509 PEM format. Run the following command using OpenSSL to convert the signed client certificate to the X.509 PEM format. |
||||||||||||||||||||||
|
Step 8 |
You can also confirm the PEM that is signed by the CA, use the following command.
|
||||||||||||||||||||||
|
Step 9 |
Using the above example’s file names, copy the ISE client cert - example-connector.pem, client key - example-connector.key and CA – root-ca.example.com.pem into the respective fields on the ISE configuration page on Secure Workload as shown below.

|
Note |
|
Processing ISE records
ISE connector processes records as described below.
Endpoint Record
ISE connector connects to ISE instance and subscribes for any updates for endpoints over pxGrid. Upon receiving an endpoint record, ISE connector registers that endpoint as ISE agent on Secure Workload. ISE connector uses the endpoint specific information present in endpoint record along with ISE connector’s certificate to register the endpoint. Once an endpoint is registered. ISE connector uses the endpoint object for inventory enrichment by sending this as user labels on Secure Workload. When ISE connector gets a disconnected endpoint from ISE, it deletes the inventory enrichment from Secure Workload.
Security Group Record
ISE connect also subscribes for updates about Security Group Labels change via pxGrid. On receiving this record, ISE connectors maintains a local database. It uses this database to map SGT name with value on receiving an endpoint record.
Periodic Tasks
ISE connector periodically shares user labels on ISE endpoint inventories.
-
Endpoint Snapshots: Every 20 hours, ISE connector fetches a snapshot of endpoints and security group labels from ISE instance and updates the cluster if any change is detected. This call does not compute for endpoints that are disconnected in case we do not see endpoints on Secure Workload coming from ISE.
-
User Labels: Every 2 minutes, ISE connector scans through the LDAP user and ISE endpoint labels maintained locally and updates user labels on those IP addresses.
For user labels, ISE connector creates a local snapshot of LDAP attributes of all users in the organization. When ISE connector is enabled, configuration for LDAP (server/port information, attributes to fetch for a user, attribute that contains the username) may be provided. In addition, the LDAP user credentials to access LDAP server may be provided. LDAP user credentials are encrypted and never revealed in the ISE connector. Optionally, an LDAP certificate may be provided for securely accessing LDAP server.
Note |
ISE connector creates a new local LDAP snapshot every 24 hours. This interval is configurable in LDAP configuration of the connector. |
Note |
On upgrading Cisco ISE device, ISE connector will need to be re-configured with new certificates generated by ISE after upgrade. |
Limits
|
Metric |
Limit |
|---|---|
|
Maximum number of ISE instances that can be configured on one ISE connector |
20 |
|
Maximum number of ISE connectors on one Secure Workload Edge appliance |
1 |
|
Maximum number of ISE connectors on one Tenant (rootscope) |
1 |
|
Maximum number of ISE connectors on Secure Workload |
150 |
Note |
Maximum number of ISE agents supported per connector is 400000. |
Connectors for Inventory Enrichment
Connectors for inventory enrichment provides additional meta-data and context about the inventories (IP addresses) monitored by Secure Workload.
|
Connector |
Description |
Deployed on Virtual Appliance |
|---|---|---|
|
ServiceNow |
Collect endpoint information from ServiceNow instance and enrich the inventory with ServiceNow attributes. |
Secure Workload Edge |
|
See also: |
– |
For more information about required virtual appliances, see Virtual Appliances for Connector.
ServiceNow Connector
ServiceNow connector connects with ServiceNow Instance to get all the ServiceNow CMDB related labels for the endpoints in ServiceNow inventory. Using this solution, we can get enriched metadata for the endpoints in Cisco Secure Workload.
ServiceNow connector does the following high-level functions.
-
Update ServiceNow metadata in Secure Workload’s inventory for these endpoints.
-
Periodically take snapshot and update the labels on these endpoints.
Figure 18. ServiceNow connector 
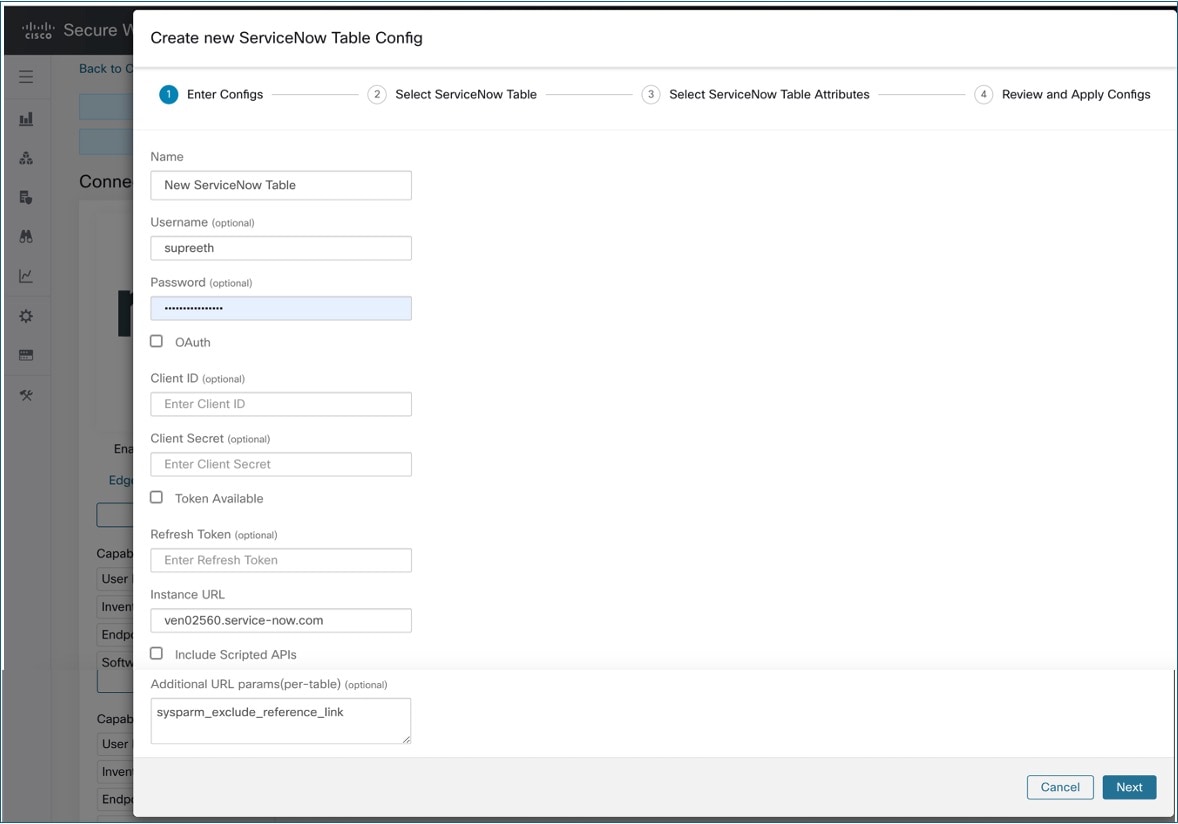
How to Configure the ServiceNow Connector
For information about required virtual appliances, see Virtual Appliances for Connectors. The following configurations are allowed on the connector.
-
ServiceNow Tables: ServiceNow Tables configures the ServiceNow instance with it’s credentials, and the information about ServiceNow tables to fetch the data from.
-
Scripted REST api: ServiceNow scripted REST API tables can be configured similar to ServiceNow tables.
-
Sync Interval: Sync Interval configuration allows to make change the periodicity at which Secure Workload should query ServiceNow instance for updated data. The default sync interval is set to 60 minutes.
-
Log: For more information, see Log Configuration .
ServiceNow Instance Configuration
You will need the following items to successfully configure a ServiceNow instance.
-
ServiceNow username
-
ServiceNow password
-
ServiceNow Instance URL
-
Scripted APIs
-
(Optional) Additional URL parameters (per-table)

Subsequently, Secure Workload performs a discovery of all the tables from the ServiceNow Instance and Scripted REST API’s (only if Include Scripted APIs check box is enabled). It presents user with the list of tables to choose from, once a user selects table, Secure Workload fetches all the list of attributes from that table for the user to select. User has to chose the ip_address attribute from the table as the key. Subsequently, user can chose upto 10 unique attributes from the table. See the following figures for each step.
Note |
ServiceNow Connector can only support integrating with tables having IP Address field. |
Note |
To integrate with ServiceNow Scripted REST API’s you need to enable the Scripted APIs check box, which would give you a similar workflow to any other table. |
Note |
For scripted REST APIs to integrate with aServiceNow Connector, the scripted REST APIs cannot have path parameters. Also, the scripted REST APIs must support sysparm_limit, sysparm_fields, and sysparm_offset as query parameters. |
Note |
The ServiceNow user roles must include cmdb_read for tables and web_service_admin for scripted REST APIs to integrate with Cisco Secure Workload. |


Processing ServiceNow records
Based on the instance url you gives in configuration, ServiceNow connector connects to ServiceNow Instance. ServiceNow Instance uses HTTP calls using https://{Instance URL}/api/now/doc/table/schema, to obtain the initial table schema from the ServiceNow Table API. Based on the configured Tables, it queries those tables to fetch the ServiceNow labels/metadata. Secure Workload annotates the ServiceNow labels to IP addresses in its inventory. ServiceNow connector periodically fetches new labels and updates Secure Workload inventory.
Note |
Secure Workload fetches records from ServiceNow tables periodically. This is configurable under SyncInterval tab in the ServiceNow connector. The default sync interval is 60 minutes. For cases where integrating with ServiceNow table with large number of entries, this sync interval should be set to a higher value. |
Note |
Secure Workload will delete any entry not seen for 10 continuous sync intervals. In case the connection to ServiceNow instance is down for that long that could result in cleaning up of all labels for that instance. |
Sync Interval Configuration
Secure Workload ServiceNow connector provides a way to configure the frequency of sync between Secure Workload and ServiceNow instance. By default the sync interval is set to 60 minutes, but it can be changed under the sync interval configuration as Data fetch frequency.
-
For detecting deletion of a record, Secure Workload ServiceNow connector relies on syncs from ServiceNow instances. If an entry is not seen in 48 consecutive sync intervals, we go ahead and delete the entry. This can be configured under sync interval config as Delete entry interval.
-
If any additional parameters are to be passed when calling REST APIs for ServiceNow tables, you can configure them as part of Additional Rest API url params. This configuration is optional. For example, to get a reference lookup from ServiceNow, use sysparm_exclude_reference_link=true&sysparm_display_value=true URL parameter.

Edge Appliance Communication Flow with Secure Workload and ServiceNow
After a successful Secure Workload ServiceNow connector integration and ServiceNow instance configuration, Edge Virtual Machines communicate with them through ports and IP addresses as follows:
-
Edge VM communicates with a ServiceNow instance through the port 443 from Secure Workload to ServiceNow. The IP addresses used would be as configured on the ServiceNow instance.
-
Edge VM communicates with the Secure Workload cluster through ports 443 and 9092. The Kafka addresses used would be as configured in the Secure Workload Cluster for Kafka-1, Kafka-2, Kafka-3, Kafka-1 FQDN.
Note
Secure Workload cluster does not initiate connections with Edge VM. It is always an Edge VM that initiates connection with the cluster.
Explore Command to Delete the Labels
In case user wants to cleanup the labels for a particular IP for a given instance immediately, without waiting for delete interval, they can do so using an explore command. Here are the steps to run the command.
-
Finding vrf ID for a Tenant
-
Getting to Explore command UI
-
Running the commands
Finding VRF ID for a Tenant
Site Admins and Customer Support users can access the Tenant page under the Platform menu in the navigation bar at the left side of the window. This page displays all of the currently configured Tenants and VRFs. For more information, see the Tenants section for more details.
On Tenants page, ID field of Tenants table is vrf ID for the Tenant.
Getting to Explore Command UI
To reach the Maintenance Explorer command interface, choose from the left navigation bar in the Secure Workload web interface.
Note |
Customer Support privileges are required to access explore menu. If explore tab does not show up, the account may not have needed permissions. |
Click on explore tab in the drop down menu to get to the Maintenance Explorer page.

Running the Commands
-
Choose the action as
POST -
Enter snapshot host as
orchestrator.service.consul -
Enter snapshot path
To delete the labels for a particular IP for a
servicenow instance: servicenow_cleanup_annotations?args=<vrf-id> <ip_address> <instance_url> <table_name> -
Click Send
Note
If after deleting using explore command, we see the record show up in ServiceNow instance, it will be repopulated
Frequently Asked Questions
-
What if a ServiceNow CMDB table does not have IP address?
In such case, the recommendation is to create a View on ServiceNow which will have desired fields from current table along with IP address (potentially coming from a JOIN operation with another table). Once such a view is created, it can be used in place of table name.
-
What if a ServiceNow instance requires MFA?
Currently we do not support integrating with ServiceNow instance with MFA.
Limitations of ServiceNow Connectors
|
Metric |
Limit |
|---|---|
|
Maximum number of ServiceNow instances configured on one ServiceNow connector |
20 |
|
Maximum number of attributes that can be fetched from one ServiceNow instance |
15 |
|
Maximum number of ServiceNow connectors on one Secure Workload Edge appliance |
1 |
|
Maximum number of ServiceNow connectors on one Tenant (rootscope) |
1 |
|
Maximum number of ServiceNow connectors on Secure Workload |
150 |
Connectors for Alert Notifications
Connectors for alert notifications enable Secure Workload to publish Secure Workload alerts on various messaging and logging platforms. These connectors run on TAN service on Secure Workload Edge Appliance.
|
Connector |
Description |
Deployed on Virtual Appliance |
|---|---|---|
|
Syslog |
Send Secure Workload alerts to Syslog server. |
Secure Workload Edge |
|
|
Send Secure Workload alerts on Email. |
Secure Workload Edge |
|
Slack |
Send Secure Workload alerts on Slack. |
Secure Workload Edge |
|
Pager Duty |
Send Secure Workload alerts on Pager Duty. |
Secure Workload Edge |
|
Kinesis |
Send Secure Workload alerts on Amazon Kinesis. |
Secure Workload Edge |
For more information about required virtual appliances, see Virtual Appliances for Connectors.
Syslog Connector
When enabled, TAN service on Cisco Secure Workload Edge appliance can send alerts to Syslog server using configuration.

The following table explains the configuration details for publishing Secure Workload alerts on Syslog server. For more information, see Syslog Notifier Configuration .
|
Parameter Name |
Type |
Description |
|---|---|---|
|
Protocol |
drop-down |
Protocol to use to connect to server |
| •UDP | ||
| • TCP | ||
|
Server Address |
string |
IP address or hostname of the Syslog server |
|
Port |
number |
Listening port of Syslog server. Default port value is 514. |


Syslog Severity Mapping
The following table shows the default severity mapping for Secure Workload alerts on Syslog.
|
Secure Workload Alerts Severity |
Syslog Severity |
|---|---|
|
LOW |
LOG_DEBUG |
|
MEDIUM |
LOG_WARNING |
|
HIGH |
LOG_ERR |
|
CRITICAL |
LOG_CRIT |
|
IMMEDIATE ACTION |
LOG_EMERG |
This setting can be modified using Severity Mapping configuration under Syslog Connector. You can choose any corresponding Syslog priority for each Secure Workload Alert Severity and change the Severity Mapping. For more information, see Syslog Severity Mapping Configuration .
|
Parameter Name |
Dropdown of mappings |
|---|---|
|
IMMEDIATE_ACTION |
|
|
CRITICAL |
|
|
HIGH |
|
|
MEDIUM |
|
|
LOW |

Limits
|
Metric |
Limit |
|---|---|
|
Maximum number of Syslog connectors on one Secure Workload Edge appliance |
1 |
|
Maximum number of Syslog connectors on one Tenant (rootscope) |
1 |
|
Maximum number of Syslog connectors on Secure Workload |
150 |
Email Connector
When you enable Email Connector, TAN service on Secure Workload Edge Appliance sends alerts Email using the configuration for Email Connector.

The following table explains the configuration details for publishing Secure Workload alerts on Email. For more information, see Email Notifier Configuration .
|
Parameter Name |
Type |
Description |
|---|---|---|
|
SMTP Username |
string |
SMTP server username. This parameter is optional. |
|
SMTP Password |
string |
SMTP server password for the user (if given). This parameter is optional. |
|
SMTP Server |
string |
IP address or hostname of the SMTP server |
|
SMTP Port |
number |
Listening port of SMTP server. Default value is 587. |
|
Secure Connection |
checkbox |
Should SSL be used for SMTP server connection? |
|
From Email Address |
string |
Email address to use for sending alerts |
|
Default Recipients |
string |
Comma separated list of recipient email addresses |

Note |
|
Limits
|
Metric |
Limit |
|---|---|
|
Maximum number of Email connectors on one Secure Workload Edge appliance |
1 |
|
Maximum number of Email connectors on one Tenant (rootscope) |
1 |
|
Maximum number of Email connectors on Secure Workload |
150 |
Slack Connector
When enabled, TAN service on Secure Workload Edge appliance can send alerts to Slack using configuration.

The following table explains the configuration details for publishing Secure Workload alerts on Slack. For more information, see Slack Notifier Configuration .
|
Parameter Name |
Type |
Description |
|---|---|---|
|
Slack Webhook URL |
string |
Slack webhook on which Secure Workload alerts should be published |
Note |
|


Limits
|
Metric |
Limit |
|---|---|
|
Maximum number of Slack connectors on one Secure Workload Edge appliance |
1 |
|
Maximum number of Slack connectors on one Tenant (rootscope) |
1 |
|
Maximum number of Slack connectors on Secure Workload |
150 |
PagerDuty Connector
When enabled, TAN service on Secure Workload Edge appliance can send alerts to PagerDuty using configuration.

The following table explains the configuration details for publishing Secure Workload alerts on PagerDuty. For more information, see PagerDuty Notifier Configuration .
|
Parameter Name |
Type |
Description |
|---|---|---|
|
PagerDuty Service Key |
string |
PagerDuty service key for pushing Secure Workload alerts on PagerDuty. |


Limits
|
Metric |
Limit |
|---|---|
|
Maximum number of PagerDuty connectors on one Secure Workload Edge appliance |
1 |
|
Maximum number of PagerDuty connectors on one Tenant (rootscope) |
1 |
|
Maximum number of PagerDuty connectors on Secure Workload |
150 |
Kinesis Connector
When enabled, TAN service on Secure Workload Edge appliance can send alerts using configuration.

The following table explains the configuration details for publishing Secure Workload alerts on Amazon Kinesis. For more information, see Kinesis Notifier Configuration .
|
Parameter Name |
Type |
Description |
|---|---|---|
|
AWS Access Key ID |
string |
AWS access key ID to communicate with AWS |
|
AWS Secret Access Key |
string |
AWS secret access key to communicate with AWS |
|
AWS Region |
dropdown of AWS regions |
Name of the AWS region where Kinesis stream is configured |
|
Kinesis Stream |
string |
Name of the Kinesis stream |
|
Stream Partition |
string |
Partition Name of the stream |

Limits
|
Metric |
Limit |
|---|---|
|
Maximum number of Kinesis connectors on one Secure Workload Edge appliance |
1 |
|
Maximum number of Kinesis connectors on one Tenant (rootscope) |
1 |
|
Maximum number of Kinesis connectors on Secure Workload |
150 |


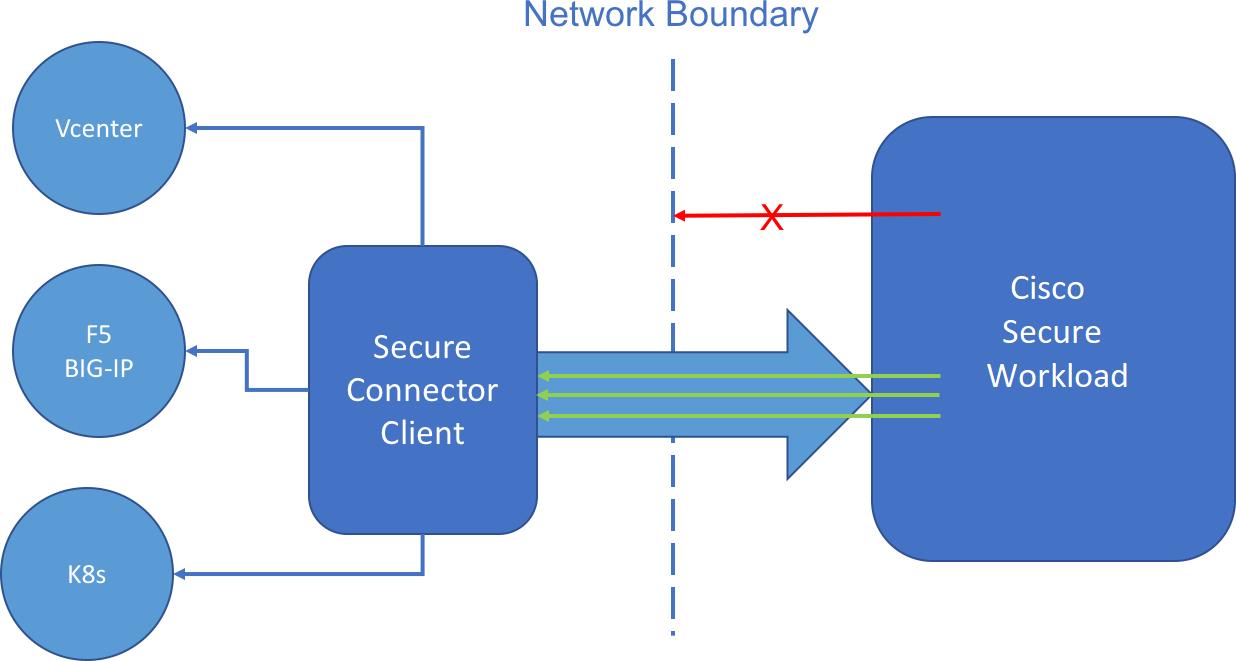
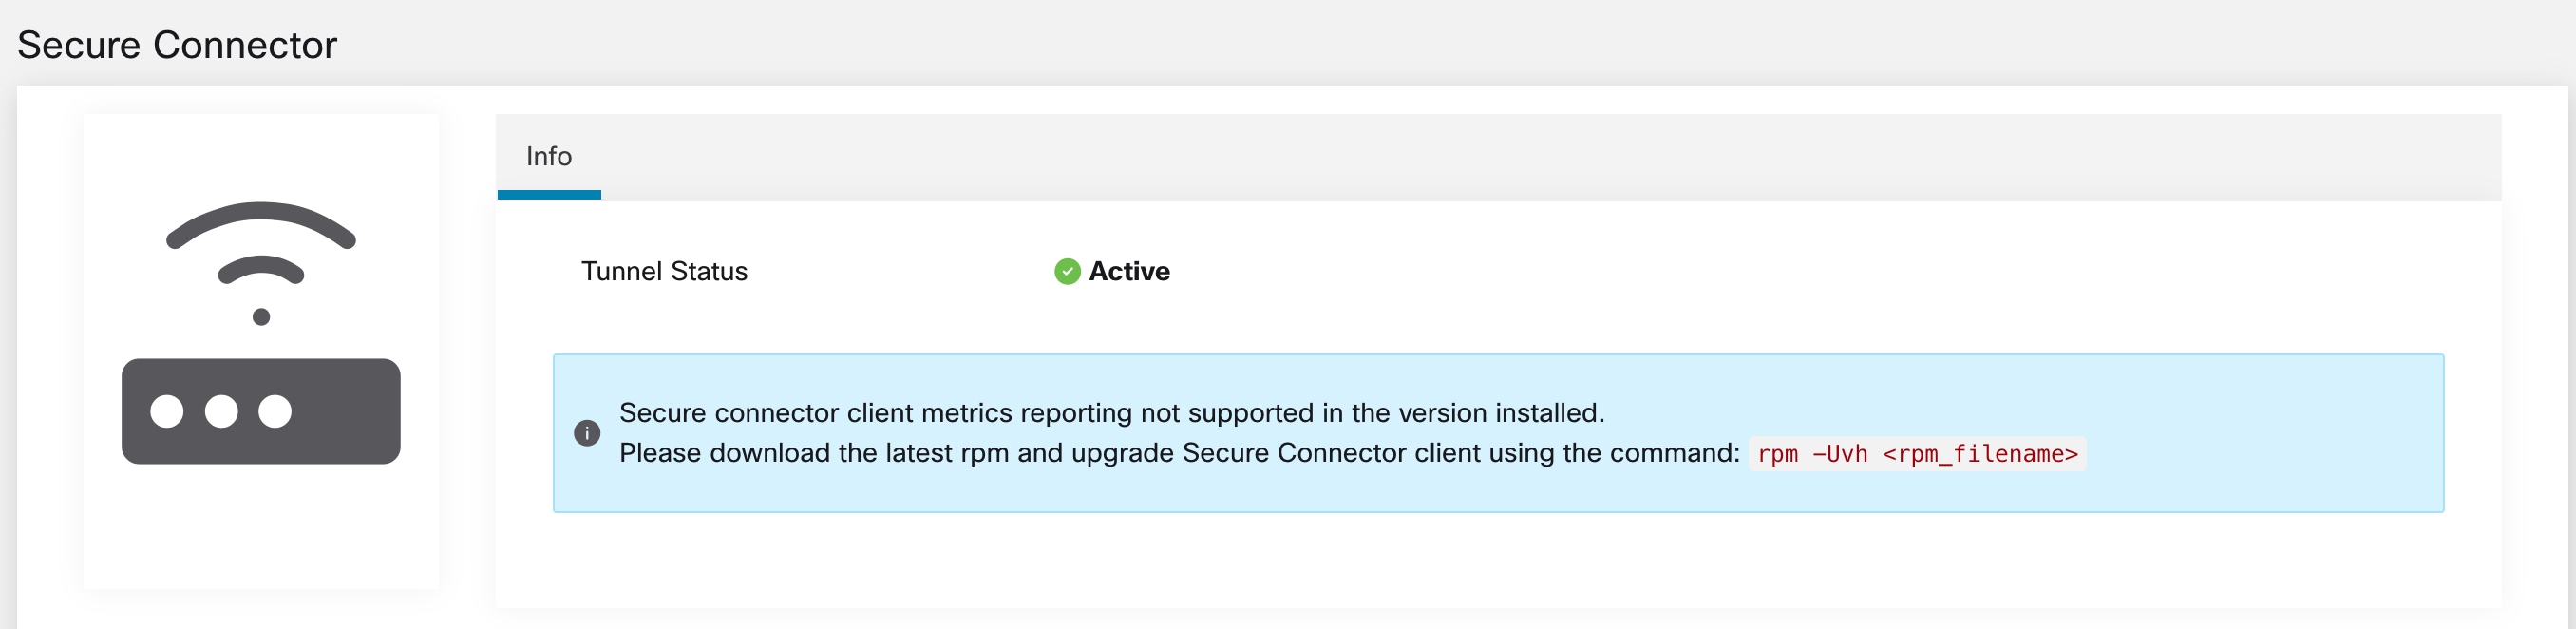


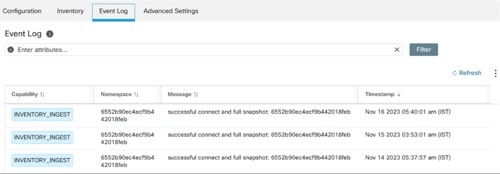
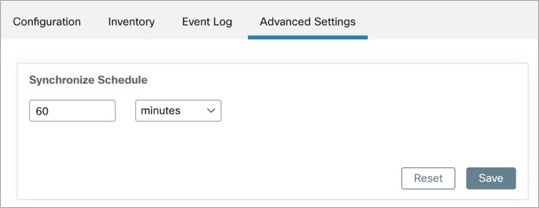

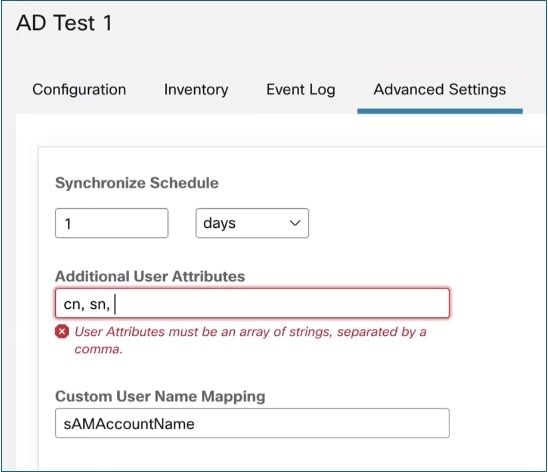
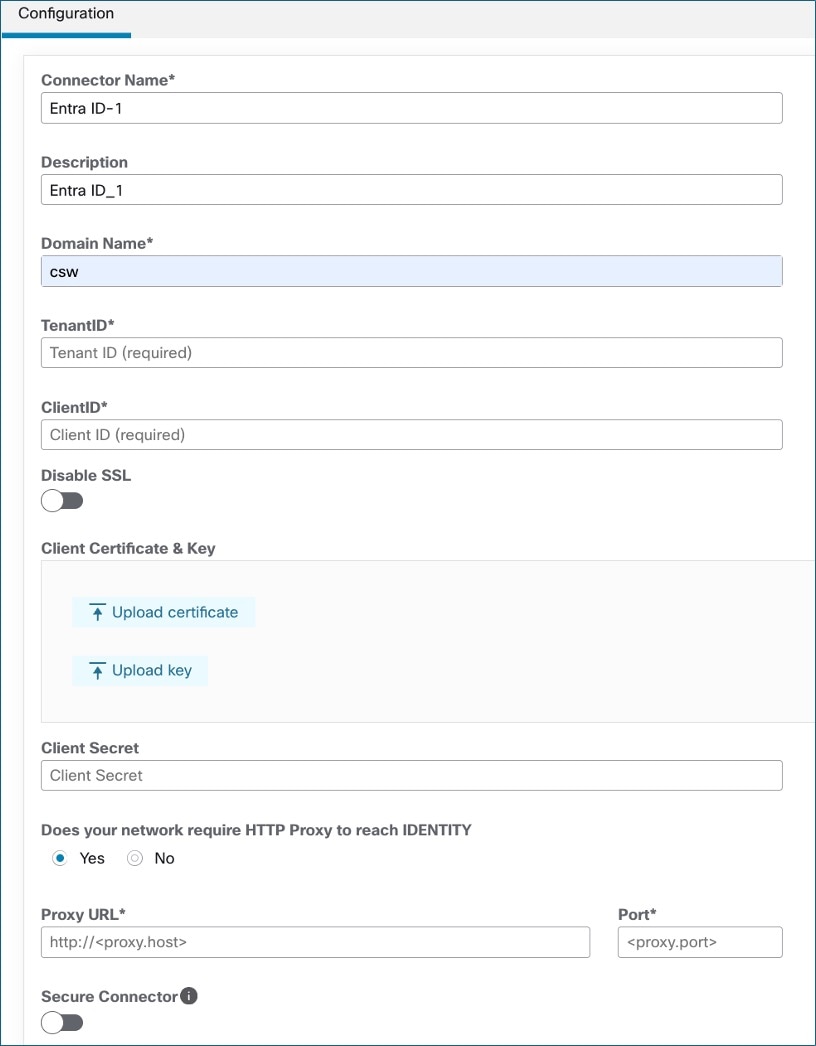
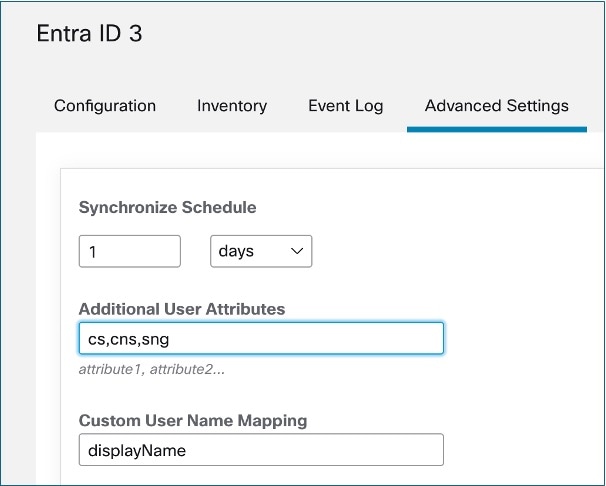


 Feedback