- Index
- New and Changed
- Preface
- Overview
- Installing Cisco MDS NX-OS and Fabric Manager
- Fabric Manager Server
- Authentication in Fabric Manager
- Fabric Manager Client
- Device Manager
- Fabric Manager Web Cient
- Performance Manager
- Cisco Traffic Analyzer
- Network Monitoring
- Performance Monitoring
- Software Images
- Management Software FAQs
- Launching Fabric Manager in Cisco SAN-OS Releases Prior to 3.2(1)
- Cisco Fabric Manager Unsupported Feature List
- Interface Nonoperational Reason Codes
- Managing Cisco FabricWare
Cisco Fabric Manager Fundamentals Configuration Guide
Bias-Free Language
The documentation set for this product strives to use bias-free language. For the purposes of this documentation set, bias-free is defined as language that does not imply discrimination based on age, disability, gender, racial identity, ethnic identity, sexual orientation, socioeconomic status, and intersectionality. Exceptions may be present in the documentation due to language that is hardcoded in the user interfaces of the product software, language used based on RFP documentation, or language that is used by a referenced third-party product. Learn more about how Cisco is using Inclusive Language.
- Updated:
- March 20, 2015
Chapter: Fabric Manager Web Cient
- Fabric Manager Web Client
- About Fabric Manager Web Client
- Navigating Fabric Manager Web Client
- Installing Fabric Manager Web Client
- Launching Fabric Manager Web Client
- Health
- Performance
- Viewing Performance Summary Information
- Performance Detail Summary Report
- Viewing Performance Information for End Devices
- Viewing Performance Information for ISLs
- Viewing Performance Information for NPV Links
- Viewing Performance Information for Flows
- Viewing Performance Information for Gigabit Ethernet and Ethernet Ports
- Viewing Other Statistics
- Viewing Detailed Traffic Information
- Viewing Switch Bandwidth
- Viewing Predicted Future Performance
- Viewing Switch Bandwidth
- Inventory
- Viewing Summary Inventory Information
- Viewing Detailed Summary Inventory Information
- Viewing Detailed Information for VSANs
- Viewing Detailed Information for Switches
- Viewing License Information
- Viewing Detailed Information for Modules
- Viewing Detailed Information for End Devices
- Viewing Detailed Information for ISLs
- Viewing Detailed Information for NPV Links
- Viewing Detailed Information for Zones
- Reports
- Admin
- Recovering a Web Server Password
- Starting, Restarting, and Stopping Services
- Adding, Editing, and Removing Managed Fabrics
- Viewing Trap and Syslog Registration Information
- Configuring Forwarding of Notifications for Events
- Viewing and Disconnecting Clients
- Configuring Fabric Manager Server Preferences
- Adding and Removing Communities
- Configuring AAA Information
- Adding and Removing Users
- Adding and Removing Roles
- Creating Performance Collections
- Configuring Other Statistics
- Configuring Collection Thresholds
- Importing the RRD Statistics Index
- Configuring the RRD Database
- Viewing Log Information
- Downloading Fabric Manager Client
- Fabric Manager Web Search Engine
- Configuring Backups Using Fabric Manager WebClient
Fabric Manager Web Client
Fabric Manager Web Client
With Fabric Manager Web Client, you can monitor Cisco MDS switch events, performance, and inventory from a remote location using a web browser. You can also monitor the events, performance, and inventory information of Cisco Nexus 5000 Series switches.
This chapter contains the following sections:
•![]() About Fabric Manager Web Client
About Fabric Manager Web Client
•![]() Navigating Fabric Manager Web Client
Navigating Fabric Manager Web Client
•![]() Installing Fabric Manager Web Client
Installing Fabric Manager Web Client
•![]() Launching Fabric Manager Web Client
Launching Fabric Manager Web Client
•![]() Fabric Manager Web Search Engine
Fabric Manager Web Search Engine
•![]() Configuring Backups Using Fabric Manager WebClient
Configuring Backups Using Fabric Manager WebClient
About Fabric Manager Web Client
Using Fabric Manager Web Client, you can monitor Cisco MDS 9000 Series or Cisco Nexus 5000 Series switch events, performance, and inventory, and perform minor administrative tasks.
Fabric Manager Web Client provides the following features:
•![]() Summary and drill down reports—The Performance Manager summary report provides a high-level view of your network performance. These reports list the average and peak throughput and provides hot-links to additional performance graphs and tables with additional statistics. Both tabular and graphical reports are available for all interconnections monitored by Performance Manager. Performance Manager also analyzes daily, weekly, monthly and yearly trends. You can also view the results for specific time intervals using the interactive zooming functionality. These reports are only available if you create a collection using Performance Manager and start the collector. To view historical performance reports, you need to install Adobe Flash Player 10 or later.
Summary and drill down reports—The Performance Manager summary report provides a high-level view of your network performance. These reports list the average and peak throughput and provides hot-links to additional performance graphs and tables with additional statistics. Both tabular and graphical reports are available for all interconnections monitored by Performance Manager. Performance Manager also analyzes daily, weekly, monthly and yearly trends. You can also view the results for specific time intervals using the interactive zooming functionality. These reports are only available if you create a collection using Performance Manager and start the collector. To view historical performance reports, you need to install Adobe Flash Player 10 or later.
See the "Historical Performance Monitoring" section.
•![]() Zero maintenance database for statistics storage—No maintenance is required to maintain Performance Manager's round-robin database, because its size does not grow over time. At prescribed intervals the oldest samples are averaged (rolled-up) and saved. A full two days of raw samples are saved for maximum resolution. Gradually the resolution is reduced as groups of the oldest samples are rolled up together.
Zero maintenance database for statistics storage—No maintenance is required to maintain Performance Manager's round-robin database, because its size does not grow over time. At prescribed intervals the oldest samples are averaged (rolled-up) and saved. A full two days of raw samples are saved for maximum resolution. Gradually the resolution is reduced as groups of the oldest samples are rolled up together.
You see Fabric Manager Web Client window as shown in Figure 7-1.
Figure 7-1 Fabric Manager Web Client

Navigating Fabric Manager Web Client
With most screens, Fabric Manager Web Client has standardized certain navigation conventions.
Navigation Tree
You can use the filter navigation tree in the left pane to access the areas you want as follows:
•![]() Select SAN to view information for all fabrics and VSANs in the SAN. When you do this, a Fabric column is added as the first column of the tables.
Select SAN to view information for all fabrics and VSANs in the SAN. When you do this, a Fabric column is added as the first column of the tables.
•![]() Click a fabric folder to view information for that specific fabric.
Click a fabric folder to view information for that specific fabric.
•![]() Some screens have expandable fabric folders. You can expand the fabric folders (by clicking the + or - icons in front of the folders) to see a list of VSANs in that fabric. Select a VSAN to view information for that VSAN.
Some screens have expandable fabric folders. You can expand the fabric folders (by clicking the + or - icons in front of the folders) to see a list of VSANs in that fabric. Select a VSAN to view information for that VSAN.
The features accessible from the tabs are limited to the areas you select in the filter tree.
Table Filtering and Navigation
You can filter the display of some tables to view subsets of the information. At the top right of these tables are one or more drop-down lists. Select an item from these lists, and then click Filter to filter the table information on that item.
You can change the number of rows displayed per page by selecting a number from the Rows per page drop-down list at the lower left corner of the table. Once you select a number, the table is updated with the new number of rows; you do not have to click a button.
For tables with multiple pages of information, you can:
•![]() Jump to the first or last page of the table by clicking the first page or last page icons (arrows with a bar in front of it)
Jump to the first or last page of the table by clicking the first page or last page icons (arrows with a bar in front of it)
•![]() Jump to the next page or previous page by clicking the next page or previous page icons (arrows)
Jump to the next page or previous page by clicking the next page or previous page icons (arrows)
•![]() Jump to a specific page by entering the page number in the Go to page field and clicking the Go button.
Jump to a specific page by entering the page number in the Go to page field and clicking the Go button.
You can search certain columns in the tables for information if a table column has a black icon next to the column head. Click the icon to display a Search dialog box.
Printing
There is a Print icon in the lower right corner of some tables. Click this icon to view the table in a printer-friendly format. You can then print the page from the browser.
Exporting to a File
There is an Export icon in the lower right corner of some tables. Click this icon to export the data to a .CSV file that can be read by programs such as Microsoft Excel.
Sorting Columns
On some screens, you can click a column head to sort the information for that column.
Installing Fabric Manager Web Client
If you are installing the Fabric Manager Web Client software for the first time, or if you want to update or reinstall the software, you access the supervisor module of the switch using a web browser. Install Fabric Manager Web Client on the same workstation where you installed Fabric Manager Server.
You must install Fabric Manager Web Client to view Performance Manager reports through a web browser.
For switches running Cisco MDS 9000 FabricWare, you need to install the Fabric Manager Web Client software from the CD-ROM included with your switch, or download Fabric Manager from Cisco.com.
To install Fabric Manager Web Client from the CD-ROM, navigate to the Fabric Manager installation notes and follow the directions.
To download the software from Cisco.com (requires a valid user name and password), open a web browser and go to the following website:
http://www.cisco.com/
The Cisco web page opens.
From the Support menu, choose Download Software.
To download and install the software on your workstation, follow these steps:
Step 1 ![]() Optionally, enter the IP address or host name of the supervisor module running Cisco MDS NX-OS in the Location or Address field of your browser. You see the installation page displayed by the HTTP server of the supervisor module.
Optionally, enter the IP address or host name of the supervisor module running Cisco MDS NX-OS in the Location or Address field of your browser. You see the installation page displayed by the HTTP server of the supervisor module.
When you connect to the server for the first time, it checks to see if you have the correct Sun Java Virtual Machine version installed on your workstation. If you do not have the correct version installed, a link is provided to the appropriate web page on the Sun Microsystems website so you can install it.
a. ![]() Click the Sun Java Virtual Machine software link (if required) to install the software.
Click the Sun Java Virtual Machine software link (if required) to install the software.
b. ![]() Using the instructions provided by the Sun Microsystems website, reconnect to the supervisor module by reentering the IP address or host name in the Location or Address field of your browser.
Using the instructions provided by the Sun Microsystems website, reconnect to the supervisor module by reentering the IP address or host name in the Location or Address field of your browser.

Note ![]() We recommend Java version 1.5(x) or later. To use IPv6 addresses, you must have Java version 1.5. To change the Java Runtime Environment (JRE) version, start Java Web Start and set the Java preferences.
We recommend Java version 1.5(x) or later. To use IPv6 addresses, you must have Java version 1.5. To change the Java Runtime Environment (JRE) version, start Java Web Start and set the Java preferences.
Step 2 ![]() Click the Fabric Manager Web Client installation link. You see a prompt asking for permission to install the application on your workstation.
Click the Fabric Manager Web Client installation link. You see a prompt asking for permission to install the application on your workstation.
Step 3 ![]() Click Yes to run the installer, which detects the installed version of the software, and prompts for upgrades or downgrades and other options if applicable.
Click Yes to run the installer, which detects the installed version of the software, and prompts for upgrades or downgrades and other options if applicable.
Note ![]() If TCP port 80 is in use, Fabric Manager Web Client checks port 8080 next. If that port is also in use, Fabric Manager Web Client uses the next available port. You can set the TCP port that you want Fabric Manager Web Client to use during the installation process.
If TCP port 80 is in use, Fabric Manager Web Client checks port 8080 next. If that port is also in use, Fabric Manager Web Client uses the next available port. You can set the TCP port that you want Fabric Manager Web Client to use during the installation process.
Unless you specify a different directory on a Windows PC, the software is installed in the default location of C:\Program Files\Cisco Systems\MDS 9000. A Cisco MDS 9000 program group is created under
Start > Programs. This program group contains shortcuts to Fabric Manager and Device manager.
On a UNIX (Solaris or Linux) machine, the installation path is /usr/local/cisco_mds9000. If this directory is not writable by the user, which is the case for non-root users, the default is set to $HOME/cisco_mds9000. Shell scripts are created in the bin directory.
Note ![]() On a Windows PC, you install Fabric Manager Web Client as a service. This service can then be administered using the Services Panel from the Windows Control Panel. By default, Fabric Manager Web Client automatically starts when the workstation is rebooted. You can change this behavior by modifying the properties in the Services Panel.
On a Windows PC, you install Fabric Manager Web Client as a service. This service can then be administered using the Services Panel from the Windows Control Panel. By default, Fabric Manager Web Client automatically starts when the workstation is rebooted. You can change this behavior by modifying the properties in the Services Panel.
Note ![]() You need to configure the Fabric Manager Server on the DNS server for remote logins unless the Fabric Manager Server is binding to a specific interface.
You need to configure the Fabric Manager Server on the DNS server for remote logins unless the Fabric Manager Server is binding to a specific interface.
Using Fabric Manager Web Client with SSL
Fabric Manager Web Client uses TCP port 80 by default. If you want to install SSL certificates and use Fabric Manager Web Client over HTTPS (using TCP port 443 or another custom port), you need a certificate for each external IP address that accepts secure connections. You can purchase these certificates from a well-known Certificate Authority (CA).
To enable SSL, users must set up the keystore to use either a self-signed certificate or a certificate from a trusted third-party company such as Verisign.
To create a local certificate, follow these steps:
Step 1 ![]() Set up a keystore to use self-signed certificate (local certificate). From the command line, enter the following command:
Set up a keystore to use self-signed certificate (local certificate). From the command line, enter the following command:
%JAVA_HOME%/bin/keytool -genkey -alias tomcat -keyalg RSA -keystore "C:\Program
Files\Cisco Systems\MDS 9000\keystore"
Step 2 ![]() Enter your name, organization, state, and country. Enter changeit when prompted for a keystore password. If you prefer to use your own password, do not forget to change the keystorepass attribute in the server.xml file. When prompted for a key password, press Enter or use the same password as the keystore password.
Enter your name, organization, state, and country. Enter changeit when prompted for a keystore password. If you prefer to use your own password, do not forget to change the keystorepass attribute in the server.xml file. When prompted for a key password, press Enter or use the same password as the keystore password.
Note ![]() You can now follow the steps in the next section for modifying Fabric Manager Web Client to use SSL.
You can now follow the steps in the next section for modifying Fabric Manager Web Client to use SSL.
In order to obtain a certificate from the Certificate Authority of your choice, you must create a Certificate Signing Request (CSR). The CSR is used by the certificate authority to create a certificate that identifies your website as secure.
To create a CSR, follow these steps:
Step 1 ![]() Create a local certificate (as described in the previous section).
Create a local certificate (as described in the previous section).
Note ![]() You must enter the domain of your website in the field first and last name in order to create a working certificate.
You must enter the domain of your website in the field first and last name in order to create a working certificate.
Step 2 ![]() The CSR is then created with this command:
The CSR is then created with this command:
keytool -certreq -keyalg RSA -alias tomcat -file certreq.csr -keystore "C:\Program
Files\Cisco Systems\MDS 9000\keystore"
Now you have a file called certreq.csr. The file is encoded in PEM format. You can submit it to the certificate authority. You can find instructions for submitting the file on the Certificate Authority website. You will receive a certificate.
Step 3 ![]() Once you have your certificate, you can import it into your local keystore. You must first import a Chain Certificate or Root Certificate into your keystore. You can then import your certificate.
Once you have your certificate, you can import it into your local keystore. You must first import a Chain Certificate or Root Certificate into your keystore. You can then import your certificate.
Step 4 ![]() Download a Chain Certificate from the Certificate Authority where you obtained the certificate:
Download a Chain Certificate from the Certificate Authority where you obtained the certificate:
•![]() For Verisign.com commercial certificates, go to:
For Verisign.com commercial certificates, go to:
http://www.verisign.com/support/install/intermediate.html
•![]() For Verisign.com trial certificates, go to:
For Verisign.com trial certificates, go to:
http://www.verisign.com/support/verisign-intermediate-ca/Trial_Secure_Server_Root/index.html
•![]() For Trustcenter.de, go to:
For Trustcenter.de, go to:
http://www.trustcenter.de/certservices/cacerts/en/en.htm#server
•![]() For Thawte.com, go to:
For Thawte.com, go to:
http://www.thawte.com/certs/trustmap.html
•![]() Import the Chain Certificate into your keystore by entering the following command:
Import the Chain Certificate into your keystore by entering the following command:
keytool -import -alias root -keystore "C:\Program Files\Cisco Systems\MDS 9000\keystore" -trustcacerts -file filename_of_the_chain_certificate
•![]() Import the new certificate in X509 format:
Import the new certificate in X509 format:
keytool -import -alias tomcat -keystore "C:\Program Files\Cisco Systems\MDS 9000\keystore" -trustcacerts -file your_certificate_filename
To modify Fabric Manager Web Client to use SSL, follow these steps:
Step 1 ![]() Stop Fabric Manager Web Client if you have already launched it. If you installed this on Windows, you can stop the service using Windows Services under Administrative Tools.
Stop Fabric Manager Web Client if you have already launched it. If you installed this on Windows, you can stop the service using Windows Services under Administrative Tools.
Step 2 ![]() Use a text editor to open \jboss\server\default\deploy\jboss-web.deployer\server.xml from the directory where Fabric Manager Web Client is installed. You see the following lines in the beginning after some copyright information:
Use a text editor to open \jboss\server\default\deploy\jboss-web.deployer\server.xml from the directory where Fabric Manager Web Client is installed. You see the following lines in the beginning after some copyright information:
<Connector className="org.apache.catalina.connector.http.HttpConnector"
port="80" minProcessors="5" maxProcessors="75"
enableLookups="false" redirectPort="8443"
acceptCount="10" debug="0" connectionTimeout="60000"/>
<!-- Define an SSL HTTP/1.1 Connector on port 8443 -->
<!--
<Connector className="org.apache.catalina.connector.http.HttpConnector"
port="8443" minProcessors="5" maxProcessors="75"
enableLookups="true"
acceptCount="10" debug="0" scheme="https" secure="true">
<Factory className="org.apache.catalina.net.SSLServerSocketFactory"
clientAuth="false" protocol="TLS"/>
</Connector>
-->
Step 3 ![]() Comment the first <Connector> element and uncomment the second one. Note that the port changes from 8443 to 443 and keystore and keypass are added. Your file should look like the following example:
Comment the first <Connector> element and uncomment the second one. Note that the port changes from 8443 to 443 and keystore and keypass are added. Your file should look like the following example:
<!--
<Connector className="org.apache.catalina.connector.http.HttpConnector"
port="80" minProcessors="5" maxProcessors="75"
enableLookups="false" redirectPort="8443"
acceptCount="10" debug="0" connectionTimeout="60000"/>
-->
<!-- Define an SSL HTTP/1.1 Connector on port 8443 -->
<Connector className="org.apache.catalina.connector.http.HttpConnector"
port="443" minProcessors="5" maxProcessors="75"
enableLookups="true"
acceptCount="10" debug="0" scheme="https" secure="true">
<Factory className="org.apache.catalina.net.SSLServerSocketFactory"
clientAuth="false" protocol="TLS"
keystoreFile="C:\Program Files\Cisco Systems\MDS 9000\keystore"
keystorePass="changeit"/>
</Connector>
Step 4 ![]() Save this file.
Save this file.
Step 5 ![]() Restart Fabric Manager Web Client.
Restart Fabric Manager Web Client.
Note ![]() If you restart Fabric Manager Server with SSL enabled, you must restart Fabric Manager Web Client. If you want to stop and restart Fabric Manager Server with SSL disabled, then you must restart Fabric Manager Web Client.
If you restart Fabric Manager Server with SSL enabled, you must restart Fabric Manager Web Client. If you want to stop and restart Fabric Manager Server with SSL disabled, then you must restart Fabric Manager Web Client.
Launching Fabric Manager Web Client
Before you can use Fabric Manager Web Client to monitor a switch, the service must be started on the server you are connecting through. The browser does not have to be on the same workstation where Fabric Manager Web Client is installed.
To launch Fabric Manager Web Client, follow these steps:
Step 1 ![]() If you are on the same workstation where you installed Fabric Manager Web Client, then open your browser and in the Location field enter http://localhost:PORT. Enter your port number if you specified a different port during installation. You can omit the port number if you used port 80 by default.
If you are on the same workstation where you installed Fabric Manager Web Client, then open your browser and in the Location field enter http://localhost:PORT. Enter your port number if you specified a different port during installation. You can omit the port number if you used port 80 by default.
If you are on a different workstation from where you installed Fabric Manager Web Client, then open your browser and in the Location field enter http://<yourServerAddress>:PORT, where <yourServerAddress> is the address where you installed Fabric Manager Web Client, and PORT is 80 by default. Enter your port number if you specified a different port during installation.

Tip ![]() Choose Start > Control Panel > Administrative Tools > Services to verify that Fabric Manager Web Client has started. To start Fabric Manager Web Client, use a browser to go to the location of the service.
Choose Start > Control Panel > Administrative Tools > Services to verify that Fabric Manager Web Client has started. To start Fabric Manager Web Client, use a browser to go to the location of the service.
You can also view this information using the Admin > Status menu of the Fabric Manager Web Client.
On a UNIX workstation, use the following command:
$ /usr/local/cisco_mds9000/bin/FMWebClient.sh status
You see the Fabric Manager Web Client Login dialog box as shown in Figure 7-2. The text field at the bottom shows the Message of the Day from the server you logged into.
Figure 7-2 Fabric Manager Web Client Login Dialog Box

Step 2 ![]() Enter your user name and password.
Enter your user name and password.
Step 3 ![]() Click Login.
Click Login.
Note ![]() If you have a new installation of Fabric Manager, the default user ID and password is admin/password. We recommend you change your password the first time you use Fabric Manager Server. If you do not have a new installation, you can use any existing passwords.
If you have a new installation of Fabric Manager, the default user ID and password is admin/password. We recommend you change your password the first time you use Fabric Manager Server. If you do not have a new installation, you can use any existing passwords.
Note ![]() If you are using Firefox to access Fabric Manager Web Client, you may receive a warning message indicating a problem with the security certificate of the website. To resolve this issue, you may need to add the security exception.
If you are using Firefox to access Fabric Manager Web Client, you may receive a warning message indicating a problem with the security certificate of the website. To resolve this issue, you may need to add the security exception.
To add the security exception, follow these steps:
Step 1 ![]() On the warning page, click Or you can add an exception.
On the warning page, click Or you can add an exception.
Step 2 ![]() Click Add Exception.
Click Add Exception.
The Add Security Exception dialog will appear.
Step 3 ![]() Click Get Certificate.
Click Get Certificate.
Read the text describing the problems with this site.
Step 4 ![]() Click Confirm Security Exception.
Click Confirm Security Exception.
After launching Fabric Manager Web Client, you see the screen as shown in Figure 7-1, which you can also see by choosing Health > Summary. Fabric Manager Web Client polls the Fabric Manager Server database to display the managed devices in the left pane.
Health
The Health tab shows events and issues for the selected items, persistent across user sessions.
The Health tab contains the following subtabs:
•![]() Summary—Shows a summary of events and problems for all SANs, or a selected SAN, fabric, or switch. You can click any of the blue links for more information about that item.
Summary—Shows a summary of events and problems for all SANs, or a selected SAN, fabric, or switch. You can click any of the blue links for more information about that item.
•![]() Fabric—Shows a detailed list of events and hardware, or accounting. You can filter these events by severity, date, and type of event.
Fabric—Shows a detailed list of events and hardware, or accounting. You can filter these events by severity, date, and type of event.
•![]() Syslog—Shows a detailed list of system messages. You can filter these events by severity, date, and type of event.
Syslog—Shows a detailed list of system messages. You can filter these events by severity, date, and type of event.
•![]() Analysis—Enables you to schedule or run analysis reports and compile results to analyze the Fabric Manager Server database statistics.
Analysis—Enables you to schedule or run analysis reports and compile results to analyze the Fabric Manager Server database statistics.
Viewing Summary Information
To view a summary of events and problems using Fabric Manager Web Client, follow these steps:
Step 1 ![]() Click the Health tab, and then click Summary tab.
Click the Health tab, and then click Summary tab.
You see the Summary tab window. In the left navigation pane you see a list of the fabrics managed by Fabric Manager Server. In the right pane is a summary table of problems and events for the last 24 hours as shown in Figure 7-3.
Figure 7-3 Summary Tab

Step 2 ![]() Do one of the following:
Do one of the following:
•![]() Choose SAN to display summary information for all fabrics.
Choose SAN to display summary information for all fabrics.
•![]() Choose one of the fabrics to display summary information for that fabric.
Choose one of the fabrics to display summary information for that fabric.
Step 3 ![]() Click the warnings next to Switches, ISLs, Hosts, or Storage (other than 0) to see an inventory of switches, ISLs, or end devices for that fabric.
Click the warnings next to Switches, ISLs, Hosts, or Storage (other than 0) to see an inventory of switches, ISLs, or end devices for that fabric.
Step 4 ![]() Choose the number of events next to the event severity levels (Emergency, Alert, Critical, Error, Warning, Notice, Info, or Debug) to see a table of events and descriptions for that fabric.
Choose the number of events next to the event severity levels (Emergency, Alert, Critical, Error, Warning, Notice, Info, or Debug) to see a table of events and descriptions for that fabric.
Viewing Fabric Information
To view a detailed list of events and hardware or accounting using Fabric Manager Web Client, follow these steps:
Step 1 ![]() Click the Health tab, and then click Fabric Events tab.
Click the Health tab, and then click Fabric Events tab.
You see the Fabric tab window as shown in Figure 7-4.
Figure 7-4 Fabric Events Tab
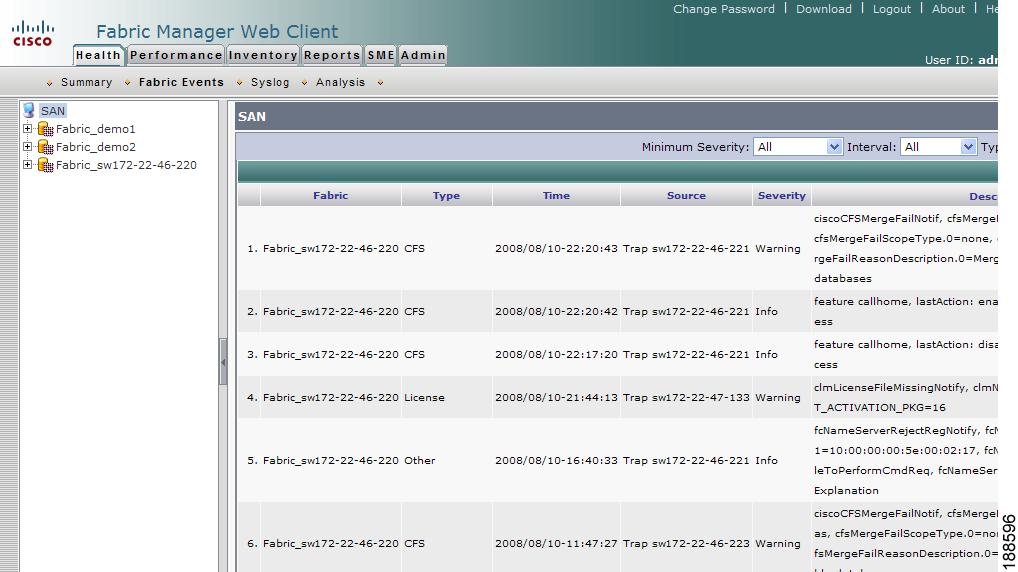
Step 2 ![]() Expand a fabric and choose one of the switches to display event information for that switch.
Expand a fabric and choose one of the switches to display event information for that switch.
Viewing Syslog Information
To view a detailed list of system messages using Fabric Manager Web Client, follow these steps:
Step 1 ![]() Click the Health tab, and then click Syslog tab.
Click the Health tab, and then click Syslog tab.
You see the Syslog tab as shown in Figure 7-5.
Figure 7-5 Syslog Tab
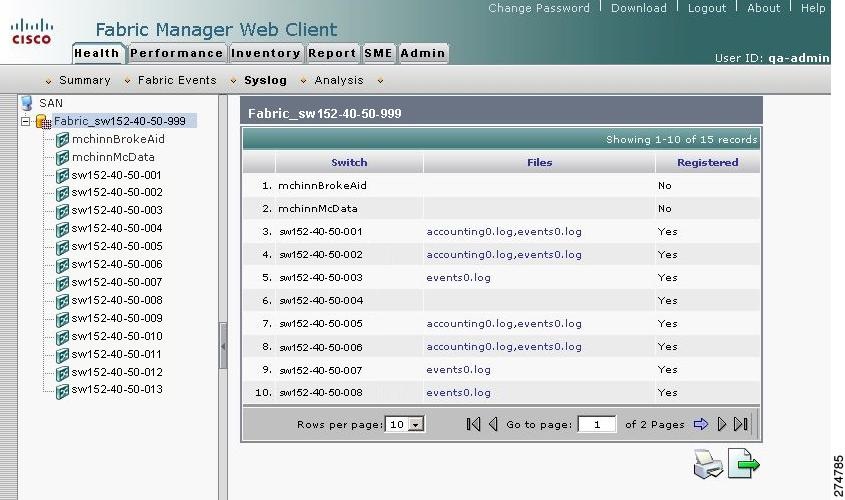
Step 2 ![]() Select one of the fabrics to display a table of syslog information for that fabric.
Select one of the fabrics to display a table of syslog information for that fabric.
Step 3 ![]() Expand a fabric and select one of the switches to display syslog information for that switch.
Expand a fabric and select one of the switches to display syslog information for that switch.
Step 4 ![]() If you have selected a fabric and one or more switches in that fabric have system messages, you see Events, Hardware, Accounting, and Link Incidents in the Files column. Click one of these message types to see system messages for the switches in that fabric filtered by the message type you clicked.
If you have selected a fabric and one or more switches in that fabric have system messages, you see Events, Hardware, Accounting, and Link Incidents in the Files column. Click one of these message types to see system messages for the switches in that fabric filtered by the message type you clicked.
Note ![]() If you select a switch, choose an interval and a message type from the drop-down lists, and then click Filter to see system messages filtered by the message type you chose.
If you select a switch, choose an interval and a message type from the drop-down lists, and then click Filter to see system messages filtered by the message type you chose.
Note ![]() To view MDS configuration changes, click accountingX.log under Files. To view the configuration changes of a switch using Device Manager, click Logs > FMServer > Accounting > Current.
To view MDS configuration changes, click accountingX.log under Files. To view the configuration changes of a switch using Device Manager, click Logs > FMServer > Accounting > Current.
Viewing Analysis Reports
As of Cisco SAN-OS Release 3.2(1) and up to Cisco NX-OS 4.1(3), you can run or schedule analysis reports to summarize the Fabric Manager Server database statistics. You can run or schedule the following analysis reports:
•![]() Connectivity (Host to Storage or Storage to Host)—The connectivity report summarizes zoning for multiple hosts or storage devices. If you choose host to storage, the report shows all storage devices zoned as accessible by each host. If you choose storage to host, the report shows all hosts that can access a specific storage device.
Connectivity (Host to Storage or Storage to Host)—The connectivity report summarizes zoning for multiple hosts or storage devices. If you choose host to storage, the report shows all storage devices zoned as accessible by each host. If you choose storage to host, the report shows all hosts that can access a specific storage device.
•![]() Zoning Discrepancies—The zoning discrepancies report identifies zoning issues that might impact connectivity or security.
Zoning Discrepancies—The zoning discrepancies report identifies zoning issues that might impact connectivity or security.
•![]() Multi Path—The multi path report determines the number of active and inactive paths between hosts and storage enclosures.
Multi Path—The multi path report determines the number of active and inactive paths between hosts and storage enclosures.
•![]() Switch Health—The switch health report provides status information on all critical Cisco MDS 9000 system, module, port, and Fibre Channel services.
Switch Health—The switch health report provides status information on all critical Cisco MDS 9000 system, module, port, and Fibre Channel services.
•![]() Fabric Configuration—The fabric configuration analysis compares multiple switches to a specific switch or a saved configuration.
Fabric Configuration—The fabric configuration analysis compares multiple switches to a specific switch or a saved configuration.
To run analysis reports using Fabric Manager Web Client, follow these steps:
Step 1 ![]() Click the Health tab, and then click Analysis tab.
Click the Health tab, and then click Analysis tab.
You see the Analysis tab shown in Figure 7-6.
Figure 7-6 Analysis Tab
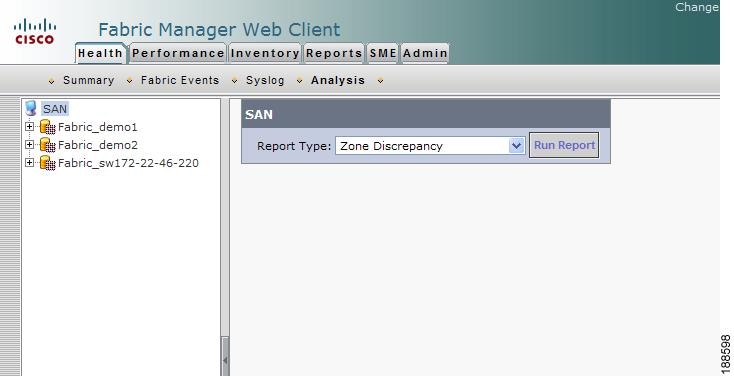
Step 2 ![]() Select a report from the Report Type drop-down list.
Select a report from the Report Type drop-down list.
Step 3 ![]() Click Run Report to run the report.
Click Run Report to run the report.
To schedule a report to run at a specified time, see "Generating Custom Reports by Template" section.
Performance
The Performance tab shows an overview of the average throughput and link utilization of SAN components. You see pie charts for the throughput and utilization. You can click a pie chart to view a table of the data. In these tables, clicking a blue link displays a graph of that data, if applicable. The Filter drop-down list at the top right of the screen allows you to filter the data based on various periods of time.
The Performance tab contains the following subtabs:
•![]() Summary—Shows the total utilization and throughput in summary form.
Summary—Shows the total utilization and throughput in summary form.
•![]() End Devices—Shows a detailed list of end devices (host or storage), port traffic, and errors.
End Devices—Shows a detailed list of end devices (host or storage), port traffic, and errors.
•![]() ISLs—Shows a detailed list of ISL traffic and errors.
ISLs—Shows a detailed list of ISL traffic and errors.
•![]() NPV Links— Shows a detailed list of traffic between NPV devices and ports.
NPV Links— Shows a detailed list of traffic between NPV devices and ports.
•![]() Flows—Shows a detailed list of host-to-storage traffic.
Flows—Shows a detailed list of host-to-storage traffic.
•![]() Ethernet—Shows a detailed list of Gigabit Ethernet ports and Cisco Nexus 5000 Series Ethernet ports and Ethernet port channels.
Ethernet—Shows a detailed list of Gigabit Ethernet ports and Cisco Nexus 5000 Series Ethernet ports and Ethernet port channels.
•![]() Others—Shows a detailed list of other statistics.
Others—Shows a detailed list of other statistics.
•![]() Traffic Analyzer—Shows a summary of SPAN ports configured in the SAN and any traffic analyzers configured.
Traffic Analyzer—Shows a summary of SPAN ports configured in the SAN and any traffic analyzers configured.
•![]() Prediction—Displays a graph that predicts future performance to help determine when storage network connections will become overutilized.
Prediction—Displays a graph that predicts future performance to help determine when storage network connections will become overutilized.
•![]() Switch Bandwidth—Shows total bandwidth for a switch.
Switch Bandwidth—Shows total bandwidth for a switch.
Viewing Performance Summary Information
To view total utilization and throughput in summary form using Fabric Manager Web Client, follow these steps:
Step 1 ![]() Click the Performance tab, and then click Summary tab.
Click the Performance tab, and then click Summary tab.
You see the Summary tab shown in Figure 7-7.
Figure 7-7 Summary Tab
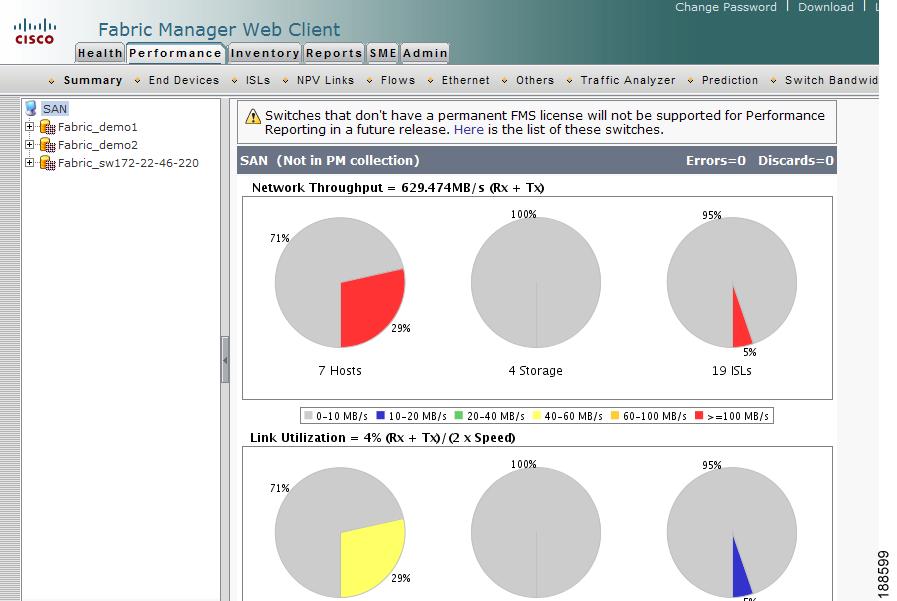
Step 2 ![]() Expand a fabric and select one of the VSANs to display network throughput and link utilization information for that VSAN.
Expand a fabric and select one of the VSANs to display network throughput and link utilization information for that VSAN.
Note ![]() Click a pie chart (Hosts, Storage, or ISLs) to go to the appropriate performance table.
Click a pie chart (Hosts, Storage, or ISLs) to go to the appropriate performance table.
Note ![]() License compliance information is provided at the top of the pane indicating that unlicensed switches may not be supported in the future. You can click the link to view the list of unlicensed switches.
License compliance information is provided at the top of the pane indicating that unlicensed switches may not be supported in the future. You can click the link to view the list of unlicensed switches.
Note ![]() To view performance information, you must activate performance collector. To configure Performance Manager, follow the instructions described in the "Creating Performance Collections" section.
To view performance information, you must activate performance collector. To configure Performance Manager, follow the instructions described in the "Creating Performance Collections" section.
Performance Detail Summary Report
To view a detailed summary report of the performance details using Fabric Manager Web Client, follow these steps:
Step 1 ![]() Click the Performance tab, and then click Summary tab.
Click the Performance tab, and then click Summary tab.
Step 2 ![]() Click the Performance Utilization Summary Details link at the bottom of the page.
Click the Performance Utilization Summary Details link at the bottom of the page.
You will see the summary report details as shown in Figure 7-8.
Figure 7-8 Performance Utilization Detail Summary Report

Viewing Performance Information for End Devices
To view host and storage port traffic and errors using Fabric Manager Web Client, follow these steps:
Step 1 ![]() Click the Performance tab, and then click End Devices tab.
Click the Performance tab, and then click End Devices tab.
You see the End Devices tab window as shown in Figure 7-9.
Figure 7-9 End Devices Tab
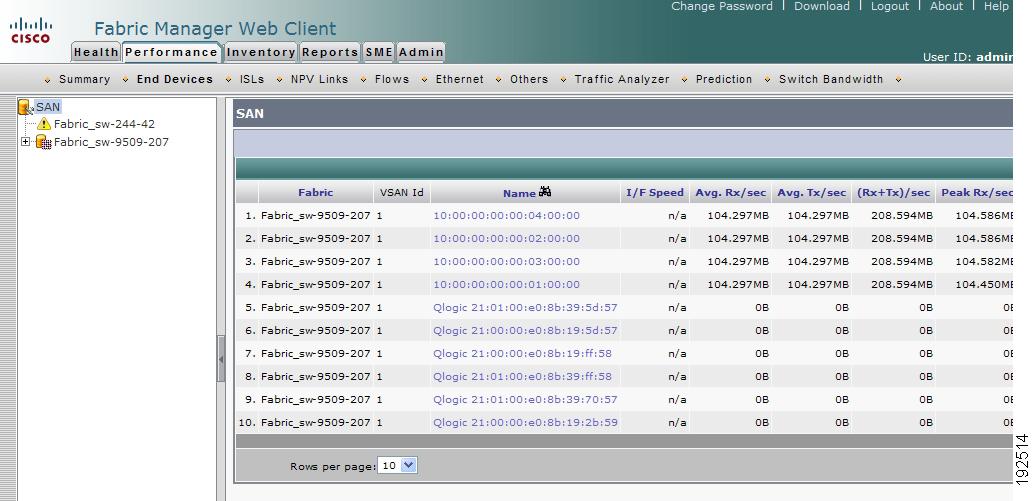
Step 2 ![]() Expand a fabric and select one of the VSANs to display performance information for the end devices in that VSAN.
Expand a fabric and select one of the VSANs to display performance information for the end devices in that VSAN.
Step 3 ![]() Click the name of a device in the Name column to see a graph of the traffic on that device for the past 24 hours.
Click the name of a device in the Name column to see a graph of the traffic on that device for the past 24 hours.
Note ![]() There are variations to this procedure. In addition to these basic steps, you can also perform the following steps to view detailed information for the end devices:
There are variations to this procedure. In addition to these basic steps, you can also perform the following steps to view detailed information for the end devices:
•![]() To change the time range for this graph, select it from the drop-down list in the upper right corner.
To change the time range for this graph, select it from the drop-down list in the upper right corner.
•![]() To view the detailed information for specific period, drag the slider control to choose the time interval for which you need the information.
To view the detailed information for specific period, drag the slider control to choose the time interval for which you need the information.
•![]() To view information in grid format, click the grid icon in the bottom right corner.
To view information in grid format, click the grid icon in the bottom right corner.
•![]() To export the data into a spreadsheet, click the excel icon in the upper right corner and then click Save.
To export the data into a spreadsheet, click the excel icon in the upper right corner and then click Save.
•![]() To view real time information, select Real Time from the drop-down list in the upper right corner. Real time data is updated in every 10 seconds.
To view real time information, select Real Time from the drop-down list in the upper right corner. Real time data is updated in every 10 seconds.
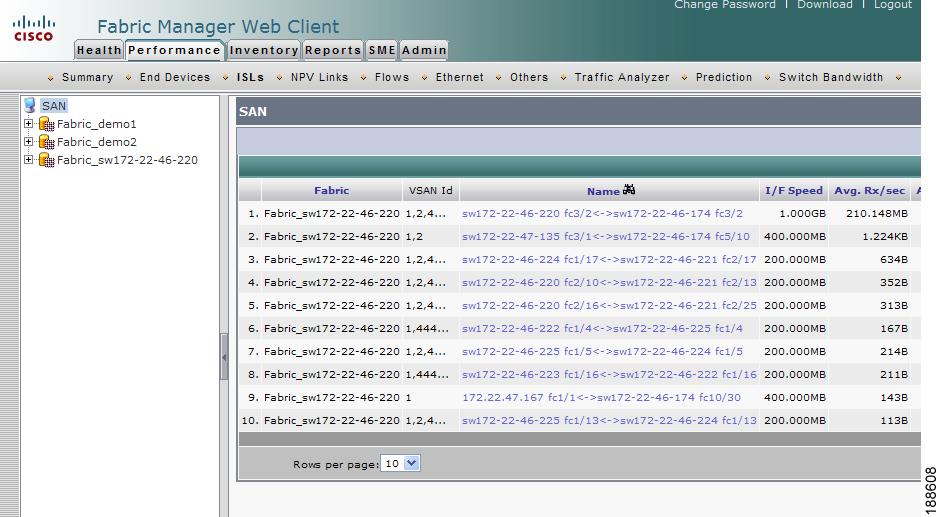
Viewing Performance Information for ISLs
To view ISL traffic and errors using Fabric Manager Web Client, follow these steps:
Step 1 ![]() Click the Performance tab, and then click ISLs tab.
Click the Performance tab, and then click ISLs tab.
You see the ISLs tab window as shown in Figure 7-10.
Figure 7-10 ISLs Tab

Step 2 ![]() Expand a fabric and select one of the VSANs to display performance information for the ISLs in that VSAN.
Expand a fabric and select one of the VSANs to display performance information for the ISLs in that VSAN.
Step 3 ![]() Click the name of an ISL from the Name column to see a graph of the traffic across that ISL for the past 24 hours.
Click the name of an ISL from the Name column to see a graph of the traffic across that ISL for the past 24 hours.
You see the ISL traffic information window as shown in Figure 7-11.
Figure 7-11
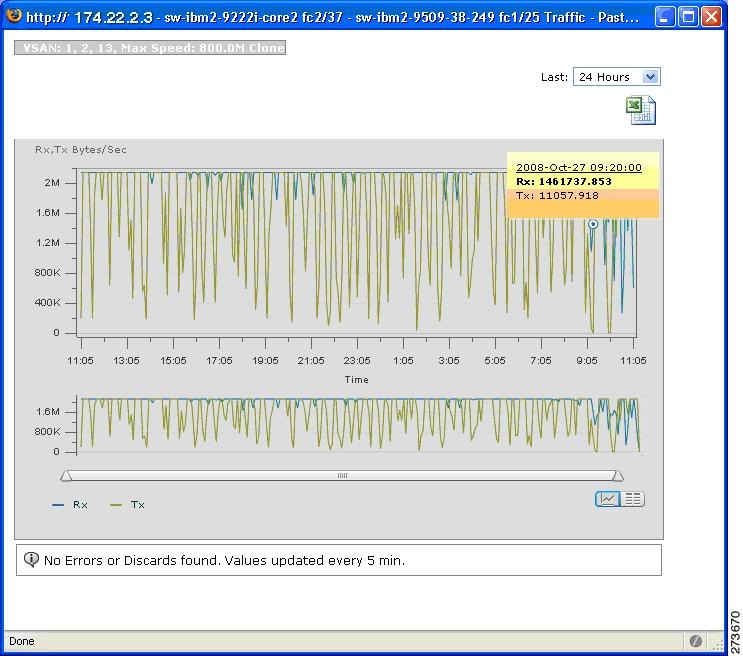
ISL Traffic (24 Hours)
Figure 7-12
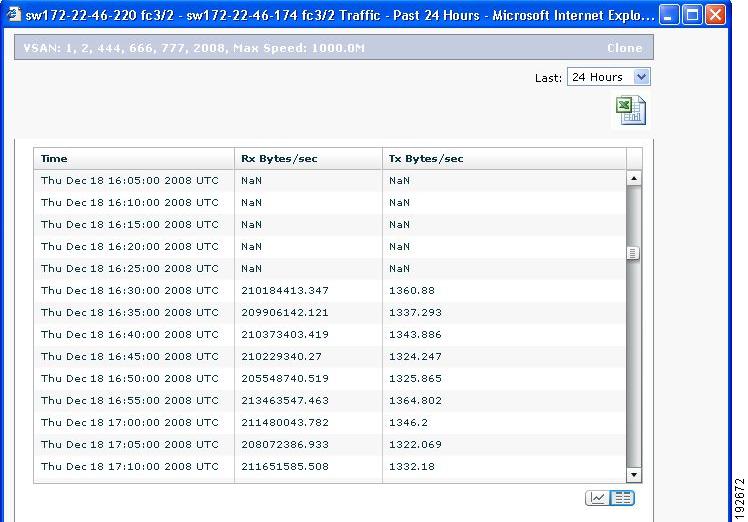
ISL Traffic Grid View
Note ![]() Notation NaN (Not a Number) in the data grid means it is a negative value.
Notation NaN (Not a Number) in the data grid means it is a negative value.
Figure 7-13
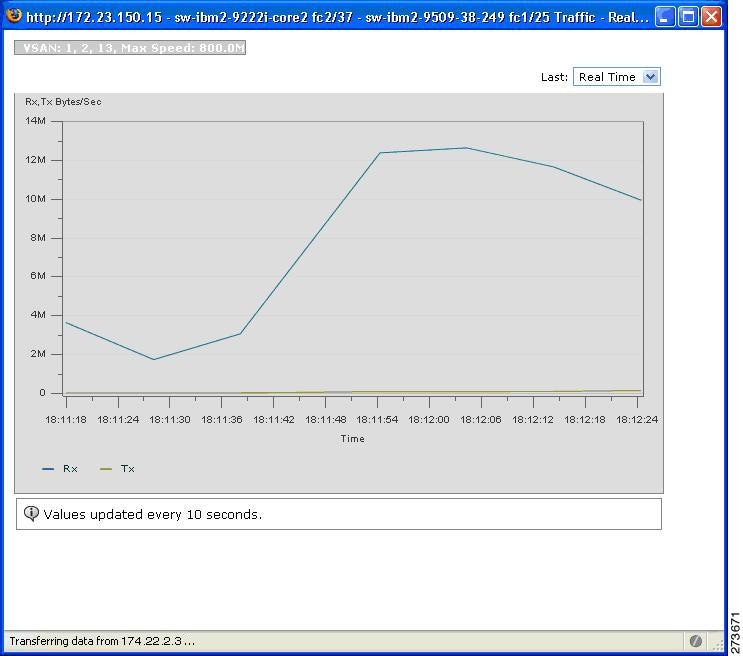
ISL Traffic (Real Time)
Note ![]() There are variations to this procedure. In addition to the basic steps described above, you can also perform the following steps to view detailed information for ISLs:
There are variations to this procedure. In addition to the basic steps described above, you can also perform the following steps to view detailed information for ISLs:
•![]() To change the time range for this graph, select it from the drop-down list in the upper right corner.
To change the time range for this graph, select it from the drop-down list in the upper right corner.
•![]() To view the detailed information for specific period, drag the slider control to choose the time interval for which you need the information.
To view the detailed information for specific period, drag the slider control to choose the time interval for which you need the information.
•![]() To view information in grid format, click the grid icon in the bottom right corner.
To view information in grid format, click the grid icon in the bottom right corner.
•![]() To export the data into a spreadsheet, click the excel icon in the upper right corner and then click Save.
To export the data into a spreadsheet, click the excel icon in the upper right corner and then click Save.
•![]() To view real time information, select Real Time from the drop-down list in the upper right corner. Real time data is updated in every 10 seconds.
To view real time information, select Real Time from the drop-down list in the upper right corner. Real time data is updated in every 10 seconds.
Viewing Performance Information for NPV Links
To view traffic between NPV devices and ports using Fabric Manager Web Client, follow these steps:
Step 1 ![]() Click the Performance tab, and then click NPV Links.
Click the Performance tab, and then click NPV Links.
You see the NPV Links tab window shown in Figure 7-14.
Figure 7-14
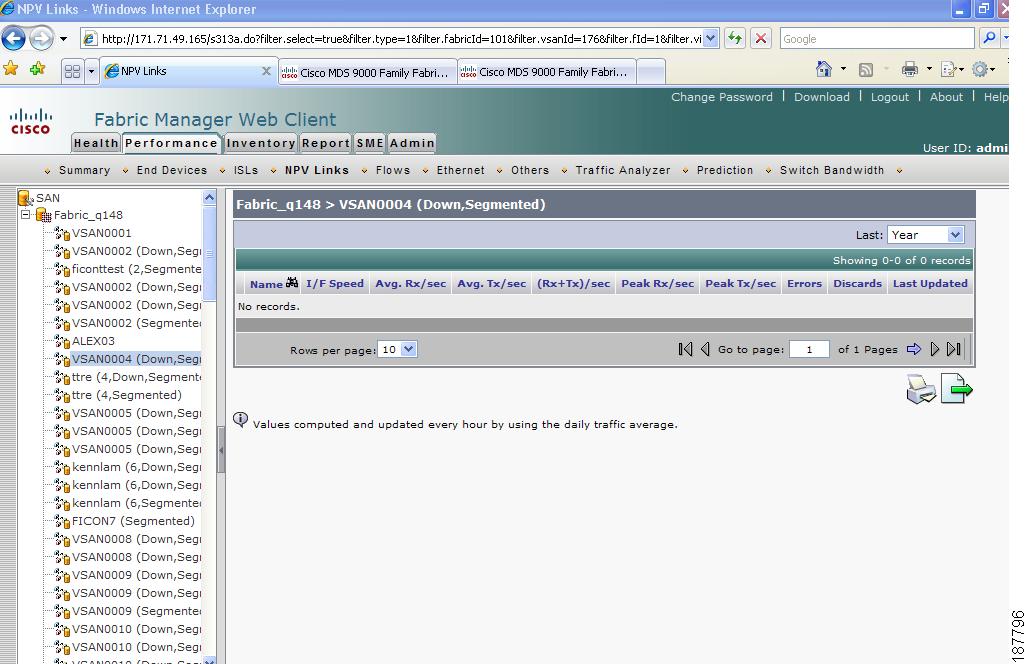
NPV Links Tab
Step 2 ![]() Expand a fabric and select one of the VSANs to display performance information for the NPV Links in that VSAN.
Expand a fabric and select one of the VSANs to display performance information for the NPV Links in that VSAN.
Step 3 ![]() Click the name of an NPV Link from the Name column to see a list of the traffic for the past 24 hours.
Click the name of an NPV Link from the Name column to see a list of the traffic for the past 24 hours.
Note ![]() There are variations to this procedure. In addition to the basic steps described above, you can also perform the following steps to view detailed information for NPV Links:
There are variations to this procedure. In addition to the basic steps described above, you can also perform the following steps to view detailed information for NPV Links:
•![]() You can change the time range for this information by selecting it from the drop-down list in the upper right corner.
You can change the time range for this information by selecting it from the drop-down list in the upper right corner.
•![]() To view the detailed information for specific period, drag the slider control to choose the time interval for which you need the information.
To view the detailed information for specific period, drag the slider control to choose the time interval for which you need the information.
•![]() To view information in grid format, click the grid icon in the bottom right corner.
To view information in grid format, click the grid icon in the bottom right corner.
•![]() To export the data into a spreadsheet, click the excel icon in the upper right corner and then click Save.
To export the data into a spreadsheet, click the excel icon in the upper right corner and then click Save.
•![]() To view real time information, select Real Time from the drop-down list in the upper right corner. Real time data is updated in every 10 seconds.
To view real time information, select Real Time from the drop-down list in the upper right corner. Real time data is updated in every 10 seconds.
Viewing Performance Information for Flows
To view host and storage traffic using Fabric Manager Web Client, follow these steps:
Step 1 ![]() Click the Performance tab, and then click Flows.
Click the Performance tab, and then click Flows.
You see the Flows tab window as shown in Figure 7-15.
Figure 7-15 Flows Tab

Step 2 ![]() Expand a fabric and select one of the VSANs to display performance information for the flows in that VSAN.
Expand a fabric and select one of the VSANs to display performance information for the flows in that VSAN.
Step 3 ![]() Click the name of a flow from the Name column to see a list of the traffic for the past 24 hours.
Click the name of a flow from the Name column to see a list of the traffic for the past 24 hours.
Note ![]() There are variations to this procedure. In addition to these basic steps, you can also perform the following steps to view detailed information for Flows:
There are variations to this procedure. In addition to these basic steps, you can also perform the following steps to view detailed information for Flows:
•![]() To change the time range for this graph, select it from the drop-down list in the upper right corner.
To change the time range for this graph, select it from the drop-down list in the upper right corner.
•![]() To view the detailed information for specific period, drag the slider control to choose the time interval for which you need the information.
To view the detailed information for specific period, drag the slider control to choose the time interval for which you need the information.
•![]() To view information in grid format, click the grid icon in the bottom right corner.
To view information in grid format, click the grid icon in the bottom right corner.
•![]() To export the data into a spreadsheet, click the excel icon in the upper right corner and then click Save.
To export the data into a spreadsheet, click the excel icon in the upper right corner and then click Save.
•![]() To view real time information, select Real Time from the drop-down list in the upper right corner. Real time data is updated in every 10 seconds.
To view real time information, select Real Time from the drop-down list in the upper right corner. Real time data is updated in every 10 seconds.
Viewing Performance Information for Gigabit Ethernet and Ethernet Ports
To view Gigabit Ethernet ports and Cisco Nexus 5000 Series Ethernet ports and Ethernet PortChannel using Fabric Manager Web Client, follow these steps:
Step 1 ![]() Click the Performance tab, and then click Ethernet.
Click the Performance tab, and then click Ethernet.
You see the Ethernet tab window as shown in Figure 7-16.
Figure 7-16 Ethernet Tab
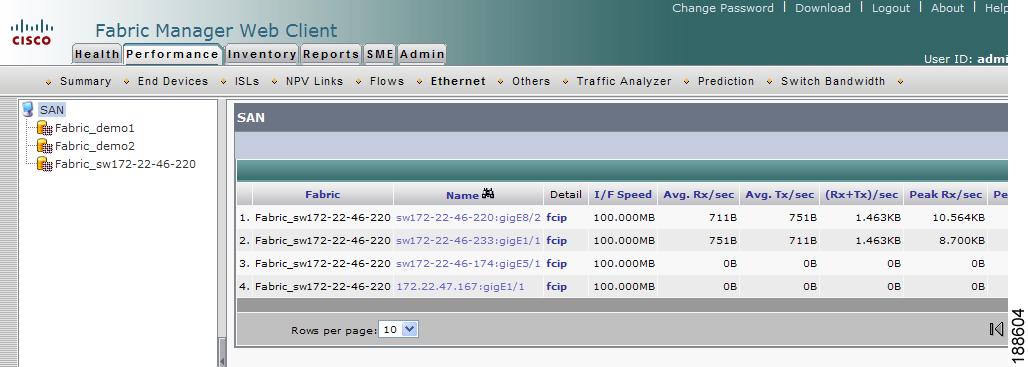
Step 2 ![]() Expand a fabric and choose one of the VSANs to display the Gigabit Ethernet ports and Cisco Nexus 5000 Series Ethernet ports and PortChannel in that VSAN.
Expand a fabric and choose one of the VSANs to display the Gigabit Ethernet ports and Cisco Nexus 5000 Series Ethernet ports and PortChannel in that VSAN.
Note ![]() There are variations to this procedure. In addition to these basic steps, you can also:
There are variations to this procedure. In addition to these basic steps, you can also:
•![]() Select the time range, and click Filter to filter the display.
Select the time range, and click Filter to filter the display.
•![]() Select the name of a GigE port from the Name column to see a graph of the traffic across that GigE port for the past 24 hours. You can change the time range for this graph by selecting it from the drop-down list in the upper right corner.
Select the name of a GigE port from the Name column to see a graph of the traffic across that GigE port for the past 24 hours. You can change the time range for this graph by selecting it from the drop-down list in the upper right corner.
Viewing Other Statistics
To view other statistics using Fabric Manager Web Client, follow these steps:
Step 1 ![]() Click the Performance tab, and then click Others.
Click the Performance tab, and then click Others.
You see the Others tab window as shown in Figure 7-17.
Figure 7-17 Others Tab
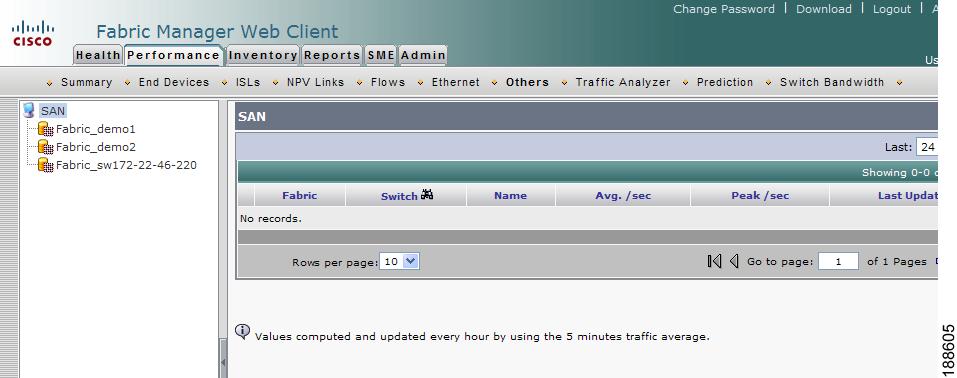
Step 2 ![]() Expand a fabric and select one of the VSANs to display the other statistics in that VSAN.
Expand a fabric and select one of the VSANs to display the other statistics in that VSAN.
Note ![]() There are variations to this procedure. In addition to these basic steps, you can also:
There are variations to this procedure. In addition to these basic steps, you can also:
•![]() Select the time range, and click Filter to filter the display.
Select the time range, and click Filter to filter the display.
•![]() Select the IP address of a switch from the Name column to see a graph of the traffic across that switch for the past 24 hours. You can change the time range for this graph by selecting it from the drop-down list in the upper right corner.
Select the IP address of a switch from the Name column to see a graph of the traffic across that switch for the past 24 hours. You can change the time range for this graph by selecting it from the drop-down list in the upper right corner.
Note ![]() To configure Other Statistics, follow the instructions described in the "Configuring Other Statistics" section.
To configure Other Statistics, follow the instructions described in the "Configuring Other Statistics" section.
Viewing Detailed Traffic Information
To view SPAN port detailed traffic using Fabric Manager Web Client, follow these steps:
Step 1 ![]() Click the Performance tab, and then click Traffic Analyzer.
Click the Performance tab, and then click Traffic Analyzer.
You see the Traffic Analyzer tab window as shown in Figure 7-18.
Figure 7-18 Traffic Analyzer Tab

Step 2 ![]() Do one of the following:
Do one of the following:
•![]() Select a SAN to display a list of SPAN ports for switches in all fabrics in the SAN.
Select a SAN to display a list of SPAN ports for switches in all fabrics in the SAN.
•![]() Select one of the fabrics to display a list of SPAN ports for switches in that fabric.
Select one of the fabrics to display a list of SPAN ports for switches in that fabric.
Viewing Switch Bandwidth
To view the total bandwidth for a switch using Fabric Manager Web Server, follow these steps:
Step 1 ![]() Choose Performance > Switch Bandwidth.
Choose Performance > Switch Bandwidth.
Step 2 ![]() Select the period of time (24 Hours, Week, Month or Year) for which you want to view bandwidth usage from the Last drop-down list.
Select the period of time (24 Hours, Week, Month or Year) for which you want to view bandwidth usage from the Last drop-down list.
Viewing Predicted Future Performance
To plan storage network changes, it is necessary to determine when configuration changes (such as rezoning) may be needed to meet growing performance demands. Fabric Manager Server provides a performance prediction report to enable you to more easily predict when storage network connections will become overutilized.
In general, to create a performance prediction report, do the following:
•![]() Specify the period of time in the past that you want to use as a sample to predict the future performance.
Specify the period of time in the past that you want to use as a sample to predict the future performance.
•![]() Specify the threshold values that you do not want to exceed.
Specify the threshold values that you do not want to exceed.
•![]() Specify the period of time in the future for which you want to view performance.
Specify the period of time in the future for which you want to view performance.
Fabric Manager Server extrapolates the performance and lists in chronological order which interfaces are expected to reach the threshold within the specified time period.
Using the Default Values
When you first view predicted future performance by clicking the Performance tab and then the Prediction tab, you see a table showing the predicted performance for your entire SAN using the default values. The default values are as follows:
•![]() Scope—Entire SAN
Scope—Entire SAN
•![]() Past performance period—Month
Past performance period—Month
•![]() Future performance period—Month
Future performance period—Month
•![]() Threshold—80%
Threshold—80%
•![]() SAN elements or links—ISLs
SAN elements or links—ISLs
•![]() Performance prediction type—Average
Performance prediction type—Average
Click a link in the Name column to view a graph of that ISL's performance for the past 24 hours. To view the performance for the past week, month, year, or custom time, select an option from the drop-down list.
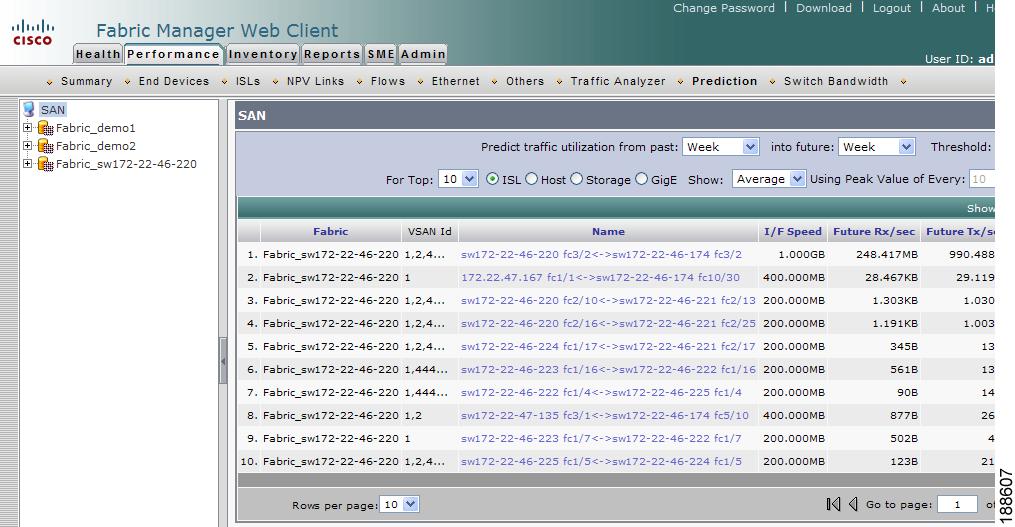
Using Your Own Values
To view a table of predicted future performance with your own values using Fabric Manager Web Client, follow these steps:
Step 1 ![]() Click the Performance tab, and then click Prediction.
Click the Performance tab, and then click Prediction.
You see the Prediction tab window as shown in Figure 7-19.
Figure 7-19 Prediction Tab
Step 2 ![]() Expand a fabric and select one of the VSANs to specify that the prediction report will be generated for that VSAN.
Expand a fabric and select one of the VSANs to specify that the prediction report will be generated for that VSAN.
Step 3 ![]() Select the period of time (Week, Month, 3 Months, 6 Months or Year) to use to predict performance from the past drop-down list.
Select the period of time (Week, Month, 3 Months, 6 Months or Year) to use to predict performance from the past drop-down list.
Step 4 ![]() Select the period of time (Week, Month, 3 Months, 6 Months or Year) for which to make the prediction from the future drop-down list.
Select the period of time (Week, Month, 3 Months, 6 Months or Year) for which to make the prediction from the future drop-down list.
Step 5 ![]() Enter the threshold percentage (1—100) of utilization that you do not want the traffic to exceed.
Enter the threshold percentage (1—100) of utilization that you do not want the traffic to exceed.
Step 6 ![]() Enter the number of ISLs, hosts, storage devices, port group or flows for which you want to make the prediction. The prediction will show the top 10, top 20, or top 50 with the most traffic.
Enter the number of ISLs, hosts, storage devices, port group or flows for which you want to make the prediction. The prediction will show the top 10, top 20, or top 50 with the most traffic.
Step 7 ![]() Select the type of traffic prediction to show:
Select the type of traffic prediction to show:
•![]() Average—The average value of all the sample data is used.
Average—The average value of all the sample data is used.
•![]() Peak—The average value of all the peak values is used. The number of peak values is obtained by dividing the total number of records into groups based on the number you enter in the Use Peak Value of Every xx Records field. For example, if you have 1000 records and you enter 100 into the field, your records are divided into 10 groups and 10 peak values are used.
Peak—The average value of all the peak values is used. The number of peak values is obtained by dividing the total number of records into groups based on the number you enter in the Use Peak Value of Every xx Records field. For example, if you have 1000 records and you enter 100 into the field, your records are divided into 10 groups and 10 peak values are used.
Step 8 ![]() Click Predict.
Click Predict.
You see the prediction table with the new data. Click the links in the Name column to show performance charts based on the history data.
Viewing Switch Bandwidth
To view the total bandwidth for a switch using Fabric Manager Web Client, follow these steps:
Step 1 ![]() Click the Performance tab, and then click Switch Bandwidth.
Click the Performance tab, and then click Switch Bandwidth.
You see the Switch Bandwidth tab window as shown in Figure 7-20.
Figure 7-20 Switch Bandwidth Tab
Step 2 ![]() Select the period of time (24 Hours, Week, Month or Year) for which you want to view bandwidth usage from the Last drop-down list.
Select the period of time (24 Hours, Week, Month or Year) for which you want to view bandwidth usage from the Last drop-down list.
Inventory
The Inventory tab shows an inventory of the selected SAN, fabric, or switch. You can export this information to an ASCII file in comma-separated value format that can be read by applications such as Microsoft Excel. You can set the number of rows and columns per page.
The Inventory tab contains the following subtabs:
•![]() VSANs—Shows details about VSANs.
VSANs—Shows details about VSANs.
•![]() Switches—Shows details about switches.
Switches—Shows details about switches.
•![]() Licenses—Shows details about the licenses in use in the fabric.
Licenses—Shows details about the licenses in use in the fabric.
•![]() Modules—Shows details for MDS switching and services modules, fans, and power supplies.
Modules—Shows details for MDS switching and services modules, fans, and power supplies.
•![]() End Devices—Shows the host and storage ports.
End Devices—Shows the host and storage ports.
•![]() ISLs—Shows the Inter-Switch Links.
ISLs—Shows the Inter-Switch Links.
•![]() NPV Links—Shows the links between NPV devices and ports.
NPV Links—Shows the links between NPV devices and ports.
•![]() Zones—Shows the active zone members (including those in inter-VSAN zones).
Zones—Shows the active zone members (including those in inter-VSAN zones).
•![]() Summary—Shows VSANs, switches, ISLs, ports, and end devices.
Summary—Shows VSANs, switches, ISLs, ports, and end devices.
Viewing Summary Inventory Information
To view a summary of VSANs, switches, ISLs, ports, and end devices using Fabric Manager Web Client, follow these steps:
Step 1 ![]() Click the Inventory tab, and then click Summary.
Click the Inventory tab, and then click Summary.
You see the Summary tab window as shown in Figure 7-21.
Figure 7-21 Summary Tab

Step 2 ![]() Do one of the following:
Do one of the following:
•![]() Select a SAN to display a summary of inventory information for all fabrics in the SAN.
Select a SAN to display a summary of inventory information for all fabrics in the SAN.
•![]() Select one of the fabrics to display a summary of inventory information for that fabric.
Select one of the fabrics to display a summary of inventory information for that fabric.
Viewing Detailed Summary Inventory Information
Detailed summary includes a number of key summary statistics such as port usage and any statistics information, license use summary, environmental status and switch states, monitoring and alerting status that is useful for creating comprehensive SAN health reports.
To view a detailed summary using Fabric Manager Web Client, follow these steps:
Step 1 ![]() Click the Inventory tab, and then click Summary.
Click the Inventory tab, and then click Summary.
Step 2 ![]() Click Inventory Summary Details at the bottom of the page.
Click Inventory Summary Details at the bottom of the page.
You see the Inventory Summary Details as shown in Figure 7-22.
Figure 7-22
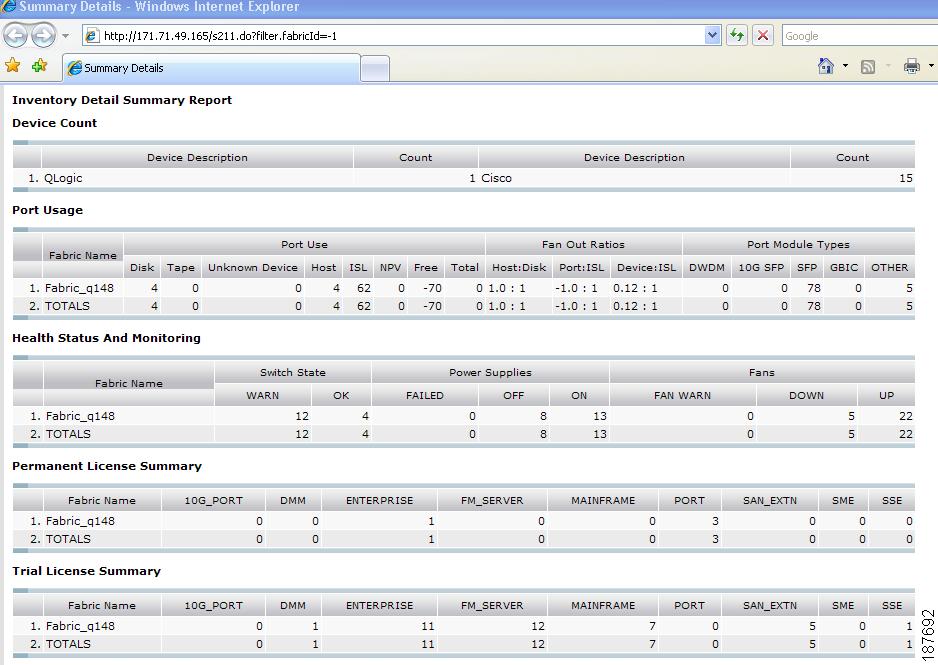
Detailed Summary Information
Viewing Detailed Information for VSANs
To view detailed inventory information about VSANs using Fabric Manager Web Client, follow these steps:
Step 1 ![]() Click the Inventory tab, and then click VSANs.
Click the Inventory tab, and then click VSANs.
You see the VSANs tab window as shown in Figure 7-23.
Figure 7-23 VSANs Tab
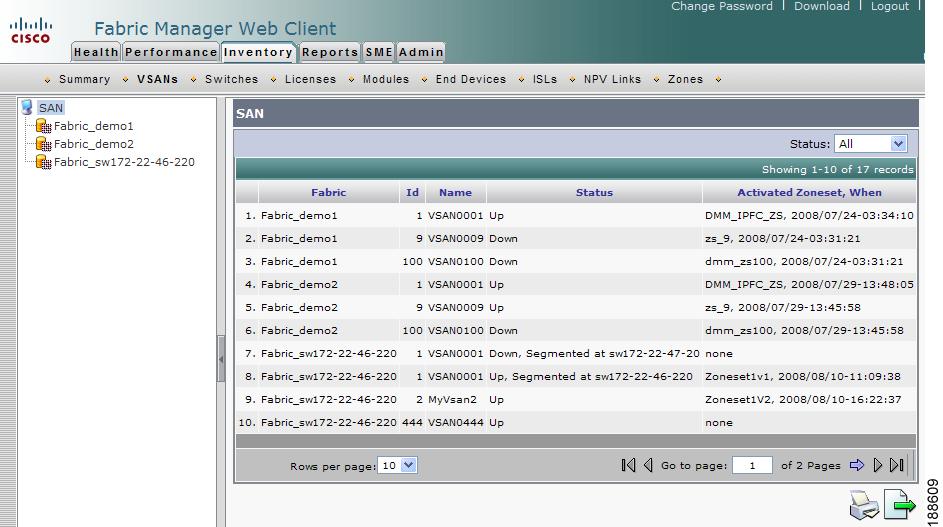
Step 2 ![]() Select one of the fabrics to display VSAN inventory information for that fabric.
Select one of the fabrics to display VSAN inventory information for that fabric.
Note ![]() There are variations to this procedure. In addition to these basic steps, you can also:
There are variations to this procedure. In addition to these basic steps, you can also:
•![]() Select the status level, then click Filter to filter the display to show all VSANs or just those with errors.
Select the status level, then click Filter to filter the display to show all VSANs or just those with errors.
Viewing Detailed Information for Switches
To view detailed inventory information about switches using Fabric Manager Web Client, follow these steps:
Step 1 ![]() Click the Inventory tab, and then click Switches.
Click the Inventory tab, and then click Switches.
You see the Switches tab window as shown in Figure 7-24.
Figure 7-24 Switches Tab

Step 2 ![]() Do one of the following:
Do one of the following:
•![]() Select a SAN to display switch inventory information for all fabrics in the SAN.
Select a SAN to display switch inventory information for all fabrics in the SAN.
•![]() Select one of the fabrics to display switch inventory information for that fabric.
Select one of the fabrics to display switch inventory information for that fabric.
•![]() Expand a fabric and select one of the VSANs to display switch inventory information for that VSAN.
Expand a fabric and select one of the VSANs to display switch inventory information for that VSAN.
Note ![]() (u-a-t) indicates the number of used (u), available (a) and total (t) Fibre Channel ports.
(u-a-t) indicates the number of used (u), available (a) and total (t) Fibre Channel ports.
Viewing License Information
To view license information for switches using Fabric Manager Web Client, follow these steps:
Step 1 ![]() Click the Inventory tab, and then click Licenses.
Click the Inventory tab, and then click Licenses.
You see the Switch Licenses tab window as shown in Figure 7-25.
Figure 7-25 Switch Licenses Tab

Step 2 ![]() Select one of the fabrics to display license information for switches in that fabric.
Select one of the fabrics to display license information for switches in that fabric.
Note ![]() There are variations to this procedure. In addition to these basic steps, you can also:
There are variations to this procedure. In addition to these basic steps, you can also:
•![]() Select the status level, and click Filter to filter the display to show all licenses or just those with errors.
Select the status level, and click Filter to filter the display to show all licenses or just those with errors.
Viewing Detailed Information for Modules
To view detailed inventory information about modules using Fabric Manager Web Client, follow these steps:
Step 1 ![]() Click the Inventory tab, and then click Modules.
Click the Inventory tab, and then click Modules.
You see the Modules tab window as shown in Figure 7-26.
Figure 7-26 Modules Tab
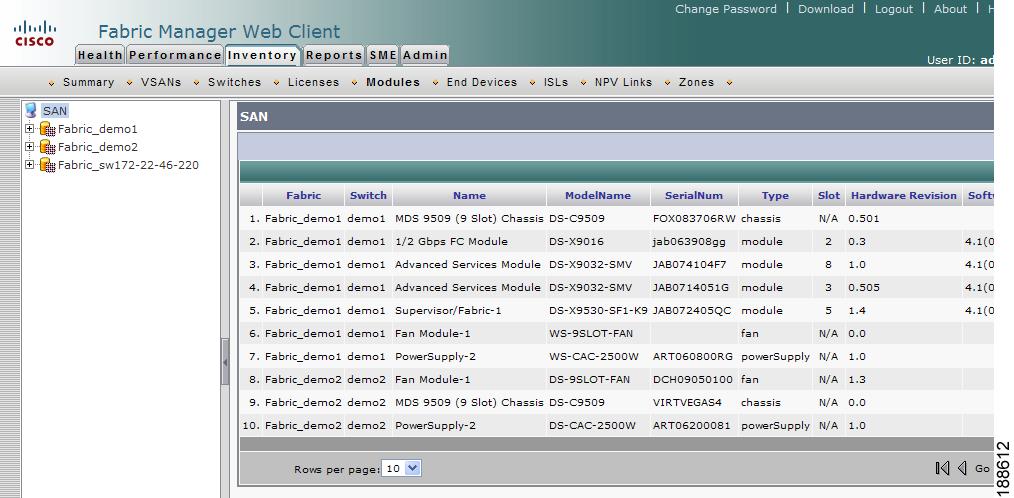
Step 2 ![]() Do one of the following:
Do one of the following:
•![]() Select a SAN to display module inventory information for all fabrics in the SAN.
Select a SAN to display module inventory information for all fabrics in the SAN.
•![]() Select one of the fabrics to display module inventory information for that fabric.
Select one of the fabrics to display module inventory information for that fabric.
•![]() Expand a fabric and select one of the VSANs to display module inventory information for that VSAN.
Expand a fabric and select one of the VSANs to display module inventory information for that VSAN.
Viewing Detailed Information for End Devices
To view detailed inventory information about end devices using Fabric Manager Web Client, follow these steps:
Step 1 ![]() Click the Inventory tab, and then click End Devices.
Click the Inventory tab, and then click End Devices.
You see the End Devices tab window as shown in Figure 7-27.
Figure 7-27 End Devices Tab

Step 2 ![]() Expand a fabric and select one of the VSANs to display end device inventory information for that VSAN.
Expand a fabric and select one of the VSANs to display end device inventory information for that VSAN.
Note ![]() If you filter by hosts or enclosures, you can click a host in the resulting table to see host enclosure performance, a list of hosts, a list of hosts to which your device is connected, and the connection paths. This allows you to see performance statistics for hosts and enclosures.
If you filter by hosts or enclosures, you can click a host in the resulting table to see host enclosure performance, a list of hosts, a list of hosts to which your device is connected, and the connection paths. This allows you to see performance statistics for hosts and enclosures.
You can also filter by end devices or by port groups to view aggregate information for those port groups, such as peak and average usage.
Viewing Detailed Information for ISLs
To view detailed inventory information about ISLs using Fabric Manager Web Client, follow these steps:
Step 1 ![]() Click the Inventory tab, and then click ISLs.
Click the Inventory tab, and then click ISLs.
You see the ISLs tab window as shown in Figure 7-28.
Figure 7-28 ISLs Tab
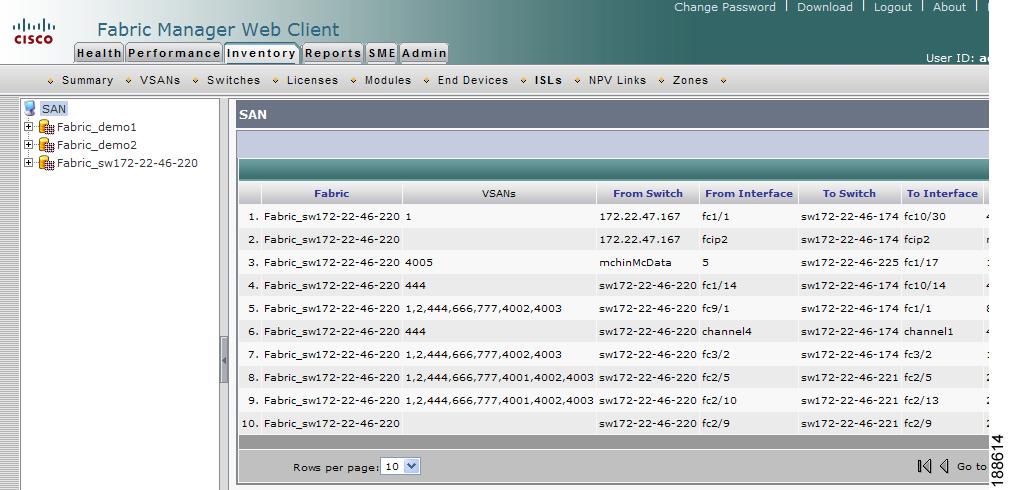
Step 2 ![]() Expand a fabric and select one of the VSANs to display ISL inventory information for that VSAN.
Expand a fabric and select one of the VSANs to display ISL inventory information for that VSAN.
Note ![]() There are variations to this procedure. In addition to these basic steps, you can also:
There are variations to this procedure. In addition to these basic steps, you can also:
•![]() Select the status level, and click Filter to filter the display to show all ISLs or only those with errors.
Select the status level, and click Filter to filter the display to show all ISLs or only those with errors.
Viewing Detailed Information for NPV Links
To view detailed inventory information about NPV Links using Fabric Manager Web Client, follow these steps:
Step 1 ![]() Click the Inventory tab, and then click NPV Links.
Click the Inventory tab, and then click NPV Links.
You see the NPV Links tab window as shown in Figure 7-29.
Figure 7-29 NPV Links
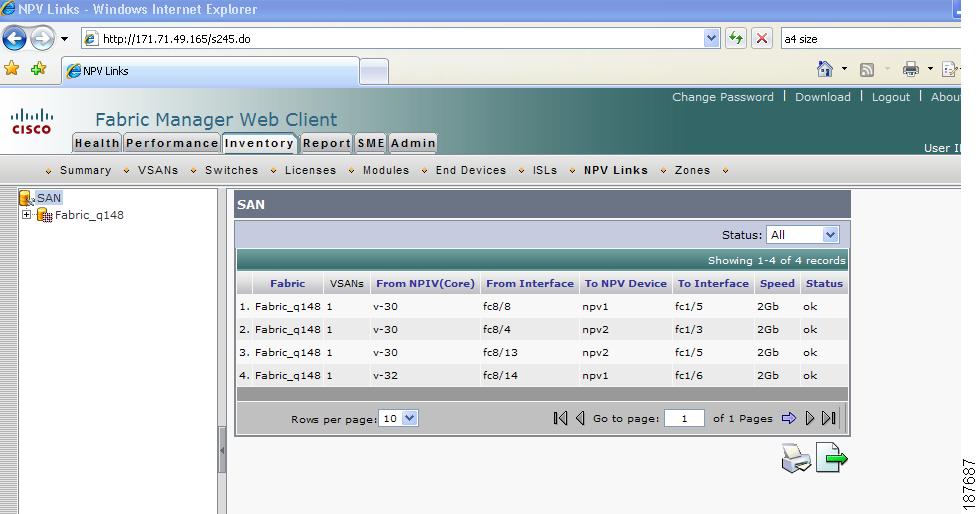
Step 2 ![]() Expand a fabric and select one of the VSANs to display NPV Links information for that VSAN.
Expand a fabric and select one of the VSANs to display NPV Links information for that VSAN.
Viewing Detailed Information for Zones
To view detailed inventory information about zones using Fabric Manager Web Client, follow these steps:
Step 1 ![]() Click the Inventory tab, and then click Zones.
Click the Inventory tab, and then click Zones.
You see the Zones tab window as shown in Figure 7-30.
Figure 7-30 Zones Tab

Step 2 ![]() Expand a fabric and select one of the VSANs to display zone inventory information for that VSAN.
Expand a fabric and select one of the VSANs to display zone inventory information for that VSAN.
Note ![]() There are variations to this procedure. In addition to these basic steps, you can also:
There are variations to this procedure. In addition to these basic steps, you can also:
•![]() Select the status level, and click Filter to filter the display to show all zones or just those with errors.
Select the status level, and click Filter to filter the display to show all zones or just those with errors.
Reports
The Reports tab allows you to create customized reports based on historical performance, events, and inventory information gathered by the Fabric Manager Server. You can create aggregate reports with summary and detailed views. You can also view previously saved reports.
The Report tab contains the following subtabs:
•![]() View—Displays previously saved reports.
View—Displays previously saved reports.
•![]() Generate—Generates a custom report based on the selected report template.
Generate—Generates a custom report based on the selected report template.
•![]() Configuration—Creates and configures a report template, allowing you to select any combination of events, performance categories, and inventory.
Configuration—Creates and configures a report template, allowing you to select any combination of events, performance categories, and inventory.
•![]() Scheduled Jobs—Displays scheduled jobs based on the selected report template.
Scheduled Jobs—Displays scheduled jobs based on the selected report template.
Creating a Custom Report Template
You can create custom reports from all or any subset of information gathered by Fabric Manager Server. You create a report template by selecting events, performance, and inventory statistics that you want in your report and set the desired SAN, fabric or VSAN to limit the scope of the template. You can generate and schedule a report of your fabric based on this template immediately or at a later time. Fabric Manager Web Client saves each report based on the report template used and the time you generate the report.
As of Cisco MDS NX-OS Release 5.0, the report template design has changed to resolve the limitations of the earlier versions. With the new design model, you can perform add, delete and modify funcationalities in a single page. You can choose multiple fabrics and VSANs using the new navigation system and it has good scalability to add new items and categories in future.
The new design model has three panels:
•![]() Template panel.
Template panel.
•![]() Configuration panel.
Configuration panel.
•![]() User selection panel.
User selection panel.
The Template panel allows you to navigate through the available templates, add new templates and delete existing templates.
The Configuration panel allows you to configure a new template when it is added and modify an existing template. The options in the configuration panel will be disabled until the user either adds a new template or select an existing template. The upper portion of the configuration panel is stacked with categories that you can choose and configure.
The User Selection panel displays the user's configuration options in real time. While the configuration panel can display information pertaining to one category at a time, user selection panel displays all the user's selection or configuration.
To create a custom report template using Fabric Manager Web Client, follow these steps:
Step 1 ![]() Click the Report tab, and then click Configuration.
Click the Report tab, and then click Configuration.
You see the Report Configuration tab as shown in Figure 7-31.
Figure 7-31 Report Configuration Tab
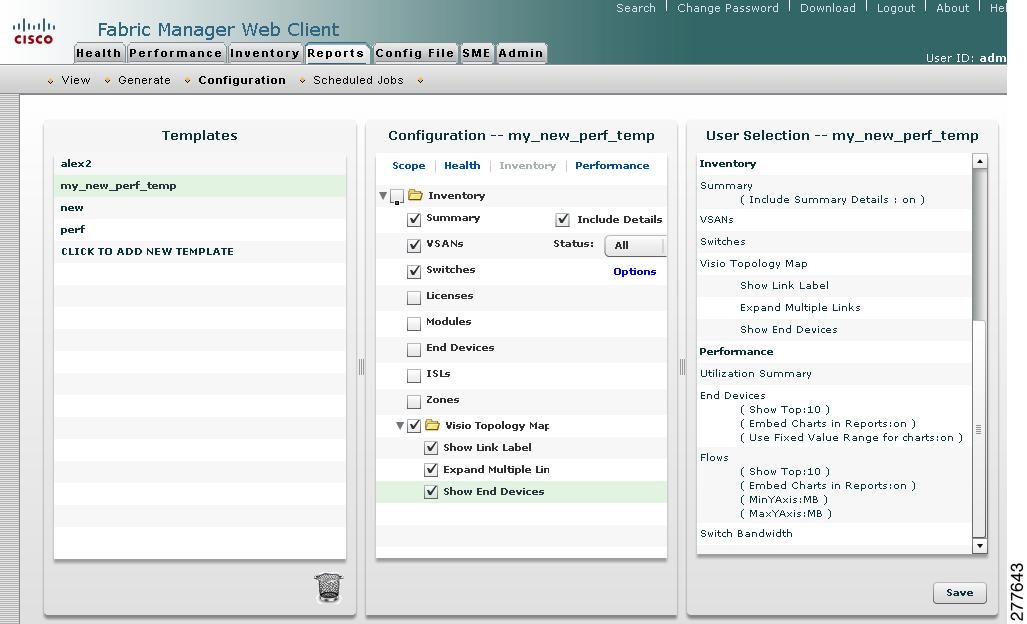
Step 2 ![]() Click CLICK TO ADD NEW TEMPLATE in the Templates panel to create a new name for your report.
Click CLICK TO ADD NEW TEMPLATE in the Templates panel to create a new name for your report.
Step 3 ![]() Click Scope in the configuration panel to define the scope.
Click Scope in the configuration panel to define the scope.
Step 4 ![]() Indicate the information you want in the report by navigating to each category such as Health, Performance, and Inventory in the Configuration panel.
Indicate the information you want in the report by navigating to each category such as Health, Performance, and Inventory in the Configuration panel.
Figure 7-32
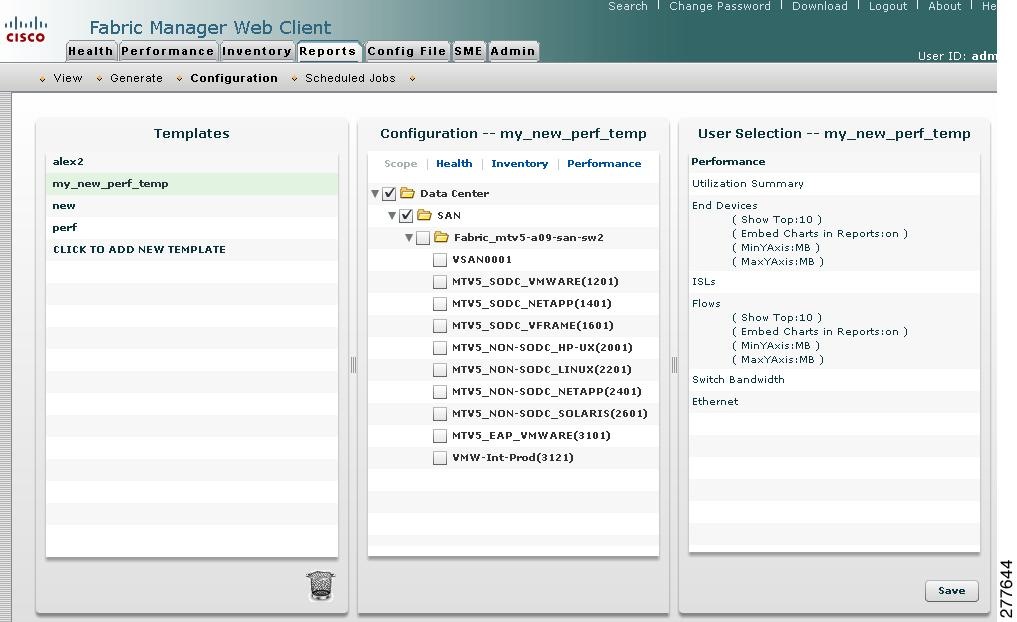
Configuration Panel
Step 5 ![]() (Optional) Select Severity for events, Status for inventory information, or Type of end devices for performance information and inventory information.
(Optional) Select Severity for events, Status for inventory information, or Type of end devices for performance information and inventory information.
Step 6 ![]() Click Save to save this report template.
Click Save to save this report template.
Viewing Custom Reports by Template
To view a custom report based on a specific template using Fabric Manager Web Client, follow these steps:
Step 1 ![]() Click the Reports tab, and then click View.
Click the Reports tab, and then click View.
You see the Report table window as shown in Figure 7-33.
Figure 7-33 View Report Table

Step 2 ![]() In the left pane expand Templates.
In the left pane expand Templates.
Step 3 ![]() Select the report that you want to view. You can view the report in the main screen or you can view the report in a new browser window if you click the report in the report table.
Select the report that you want to view. You can view the report in the main screen or you can view the report in a new browser window if you click the report in the report table.
Step 4 ![]() To delete a specific report, click the check box and then click Remove.
To delete a specific report, click the check box and then click Remove.
Step 5 ![]() To delete all the reports click the check box in the header and then click Remove.
To delete all the reports click the check box in the header and then click Remove.
Viewing Custom Reports by Users
To view a custom report based on a specific user using Fabric Manager Web Client, follow these steps:
Step 1 ![]() Click the Reports tab, and then click View.
Click the Reports tab, and then click View.
You see the report table window as shown in Figure 7-34.
Figure 7-34 View Report Table

Step 2 ![]() In the left pane, click to expand Users.
In the left pane, click to expand Users.
Step 3 ![]() Double-click the user name.
Double-click the user name.
Step 4 ![]() Select the report that you want to view. You can view the report in the main screen or you can view the report in a new browser window if you click the report in the report table.
Select the report that you want to view. You can view the report in the main screen or you can view the report in a new browser window if you click the report in the report table.
Step 5 ![]() To delete a specific report, click the check box and then click Remove.
To delete a specific report, click the check box and then click Remove.
Step 6 ![]() To delete all reports click the check box in the header and then click Remove.
To delete all reports click the check box in the header and then click Remove.
Delete a Report Template
To delete a custom report using Fabric Manager Web Client, follow these steps:
Step 1 ![]() In the Template panel, click to select the report template you want to delete.
In the Template panel, click to select the report template you want to delete.
Figure 7-35
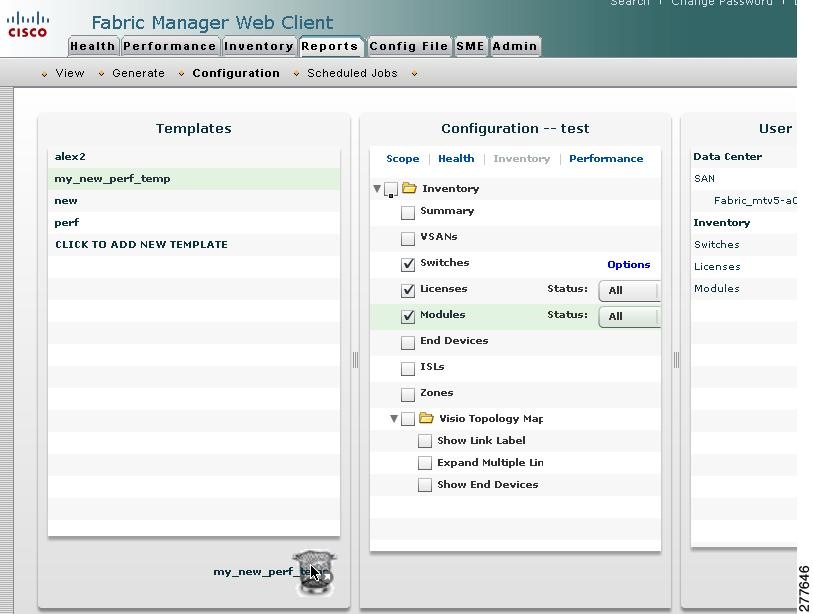
Delete Report Template
Step 2 ![]() Drag the selected report template to the trash at the right-bottom corner of the Template panel.
Drag the selected report template to the trash at the right-bottom corner of the Template panel.
Figure 7-36
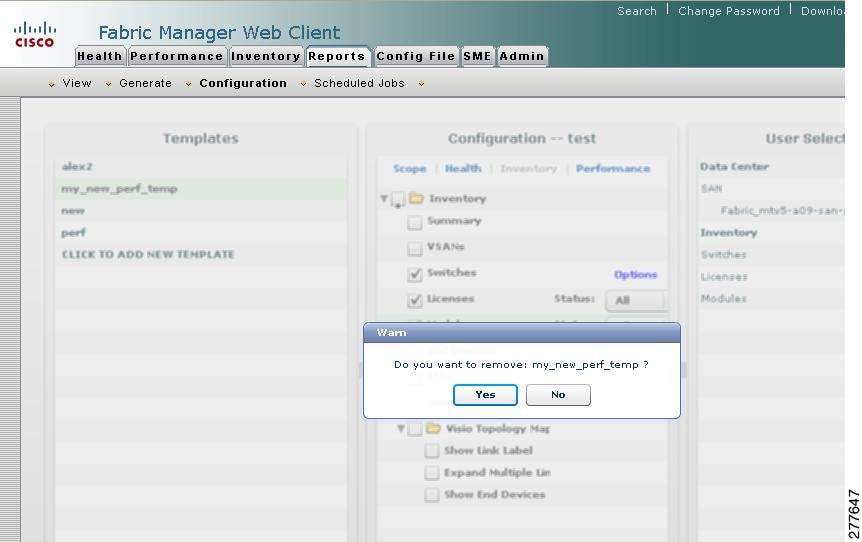
Delete Report Template Confirm
Step 3 ![]() Click Yes to delete the template.
Click Yes to delete the template.
Generating Custom Reports by Template
You can generate reports based on a selected template or you can schedule the report to run at a specified time.
To generate a report or to schedule a report using Fabric Manager Web Client, follow these steps:
Step 1 ![]() Select a SAN, fabric, or VSAN on which to base the report.
Select a SAN, fabric, or VSAN on which to base the report.
Step 2 ![]() Click the Reports tab, and then click Generate.
Click the Reports tab, and then click Generate.
You see the Generate Custom Report tab window as shown in Figure 7-37.
Figure 7-37 Generate Custom Report Tab

Step 3 ![]() Choose a report template from the Available drop-down list.
Choose a report template from the Available drop-down list.
Step 4 ![]() (Optional) Change the name of the report. By default, report names are based on the date and time generated.
(Optional) Change the name of the report. By default, report names are based on the date and time generated.
Step 5 ![]() (Optional) Uncheck the Use Scope from Template check box to override the scope defined by the filter type.
(Optional) Uncheck the Use Scope from Template check box to override the scope defined by the filter type.
Step 6 ![]() (Optional) Check the Private check box to change the attribute of the report. If selected, the report can be viewed only by the specific user and network administrator.
(Optional) Check the Private check box to change the attribute of the report. If selected, the report can be viewed only by the specific user and network administrator.
Step 7 ![]() (Optional) Check the Email Report check box to receive an e-mail notification.
(Optional) Check the Email Report check box to receive an e-mail notification.
Step 8 ![]() Click Generate to generate a report based on this template.
Click Generate to generate a report based on this template.
You see the report results in a new browser window. Alternatively, you can view the report by clicking Report > View and selecting the report name from the report template you used in the navigation pane.
Step 9 ![]() Click Schedule to schedule a report based on this template. You see the schedule panel.
Click Schedule to schedule a report based on this template. You see the schedule panel.
You see the Generate Custom Report tab window as shown in Figure 7-38.
Figure 7-38 Schedule Reports
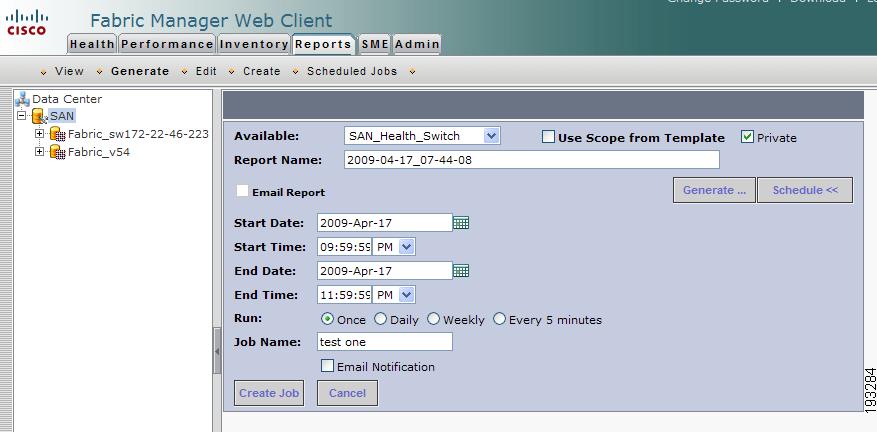
Step 10 ![]() In the schedule panel, specify the scheduled run time and how often you want the report to run.
In the schedule panel, specify the scheduled run time and how often you want the report to run.
Step 11 ![]() Click the calendar next to Start Date or End Date to modify the date settings.
Click the calendar next to Start Date or End Date to modify the date settings.
Step 12 ![]() Select the Start Time or End Time drop-down list to modify time settings.
Select the Start Time or End Time drop-down list to modify time settings.
Step 13 ![]() Select the frequency at which you need the report to be generated.
Select the frequency at which you need the report to be generated.
Step 14 ![]() Enter a name for the report in the Job Name field and click Create Job to save the report.
Enter a name for the report in the Job Name field and click Create Job to save the report.
You can view the scheduled jobs on the Scheduled Jobs page but once the scheduled jobs have started running, they are removed from the Scheduled Job table.
Note ![]() The End Date must be at least five minutes earlier than the Start Date.
The End Date must be at least five minutes earlier than the Start Date.
Modifying a Custom Report Template
To edit a custom report template using Fabric Manager Web Client, follow these steps:
Step 1 ![]() Click the Reports tab, and then click Configuration.
Click the Reports tab, and then click Configuration.
You see the Templates, Configuration and User Selection panels.
Step 2 ![]() Double-click to select a report from the template panel.
Double-click to select a report from the template panel.
You see the current information about this report in the Configuration panel as shown in Figure 7-39.
Figure 7-39 Report
Step 3 ![]() Indicate the information you want to gather in the report by clicking the Health, Performance, and Inventory tabs in the configuration panel.
Indicate the information you want to gather in the report by clicking the Health, Performance, and Inventory tabs in the configuration panel.
Step 4 ![]() (Optional) Select a severity level for events, status for inventory information, or type of end device for performance information and inventory information.
(Optional) Select a severity level for events, status for inventory information, or type of end device for performance information and inventory information.
Step 5 ![]() Click Save to save this report template.
Click Save to save this report template.
Note ![]() You cannot change the SAN, fabrics or VSAN the report is based on. Generate a new report for a new SAN, fabrics or VSAN.
You cannot change the SAN, fabrics or VSAN the report is based on. Generate a new report for a new SAN, fabrics or VSAN.
Deleting Custom Reports
Reports you generate are saved by Fabric Manager Server. To delete a custom report, you need to first select the report you want to delete. To delete a custom report based on a specific user using Fabric Manager Web Client, follow these steps:
Step 1 ![]() Click the Reports tab, and then click View.
Click the Reports tab, and then click View.
Step 2 ![]() In the left pane, expand Users.
In the left pane, expand Users.
Step 3 ![]() Double-click the user name.
Double-click the user name.
Step 4 ![]() In the right pane, select the report that you want to delete and then click Remove.
In the right pane, select the report that you want to delete and then click Remove.
Viewing Scheduled Jobs by Report Template
To view scheduled jobs by report template using Fabric Manager Web Client, follow these steps:
Step 1 ![]() Click the Reports tab, and then click Scheduled Jobs.
Click the Reports tab, and then click Scheduled Jobs.
You see the Scheduled Jobs table window as shown in Figure 7-40.
Figure 7-40 Scheduled Jobs Table

Step 2 ![]() Click a report template in the left navigation pane to view the scheduled jobs based on the selected template.
Click a report template in the left navigation pane to view the scheduled jobs based on the selected template.
Modifying Scheduled Jobs
To modify scheduled jobs using Fabric Manager Web Client, follow these steps:
Step 1 ![]() Click the Reports tab, and then click Scheduled Jobs.
Click the Reports tab, and then click Scheduled Jobs.
Step 2 ![]() In the right pane, click View.
In the right pane, click View.
You see the modify options in the Scheduled Jobs table as shown in Figure 7-41.
Figure 7-41

Modify Scheduled Jobs
Step 3 ![]() Click the calendar next to Start Date to modify the date settings.
Click the calendar next to Start Date to modify the date settings.
Step 4 ![]() Select the Start Time drop-down list to modify time settings.
Select the Start Time drop-down list to modify time settings.
Step 5 ![]() Click to select the appropriate radio button to change the frequency of generating report.
Click to select the appropriate radio button to change the frequency of generating report.
Step 6 ![]() (Optional) Check the Email Notification check box to get the report by e-mail.
(Optional) Check the Email Notification check box to get the report by e-mail.
Step 7 ![]() Click Edit Job to save changes.
Click Edit Job to save changes.
Admin
Note ![]() Only network administrators can access the Fabric Manager Web Client Admin tab. Network operators cannot view the Admin tab.
Only network administrators can access the Fabric Manager Web Client Admin tab. Network operators cannot view the Admin tab.
The Admin tab allows you to perform minor administrative and configuration tasks on the Fabric Manager Server sending data to your web client.
The Admin tab contains the following subtabs:
•![]() Status—Displays the status of the Database Server, and allows you to start and stop Performance Collector services on your server. You should to restart services only if something is not working properly, or if too large a percentage of system resources are being consumed.
Status—Displays the status of the Database Server, and allows you to start and stop Performance Collector services on your server. You should to restart services only if something is not working properly, or if too large a percentage of system resources are being consumed.
Note ![]() You cannot start or stop the Database Server services using Fabric Manager WebClient. If you are using Microsoft Windows operating system, you need to use Microsoft Management Console to stop, start, or restart the Database Server.
You cannot start or stop the Database Server services using Fabric Manager WebClient. If you are using Microsoft Windows operating system, you need to use Microsoft Management Console to stop, start, or restart the Database Server.
•![]() Configure—Allows you to configure various parameters for Fabric Manager Server.
Configure—Allows you to configure various parameters for Fabric Manager Server.
•![]() Logs—Allows you to view all the logs from the various services running on the Fabric Manager Server.
Logs—Allows you to view all the logs from the various services running on the Fabric Manager Server.
Note ![]() If you see a database file lock error in the database log, you can fix it by shutting down and restarting the database server using the web client.
If you see a database file lock error in the database log, you can fix it by shutting down and restarting the database server using the web client.
Recovering a Web Server Password
Fabric Manager Web Client user passwords are encrypted and stored locally on the workstation where you installed Web Server. If you forget a password, you can create a new network-admin user locally on the workstation where you installed Web Server and then log in and delete the old user account under the Admin tab.
To create a user on the workstation where you installed Web Server and delete the old user, follow these steps:
Step 1 ![]() Go to the Web Server installation directory and enter the cd command to access the bin directory.
Go to the Web Server installation directory and enter the cd command to access the bin directory.
Step 2 ![]() Enter the following line to create a user:
Enter the following line to create a user:
addUser.{sh,bat} <userName> <dbpassword>
Step 3 ![]() Choose Admin > Configure > Web Users > Local Database.
Choose Admin > Configure > Web Users > Local Database.
You see the list of users in the local database.
Step 4 ![]() Select the user that you want to delete and click Delete to remove the old user.
Select the user that you want to delete and click Delete to remove the old user.
Starting, Restarting, and Stopping Services
To start, restart, or stop services using Fabric Manager Web Client, follow these steps:
Step 1 ![]() Click the Admin tab, and then click Status.
Click the Admin tab, and then click Status.
You see a table of services and the status of each as shown in Figure 7-42.
Figure 7-42 Fabric Manager Services Status
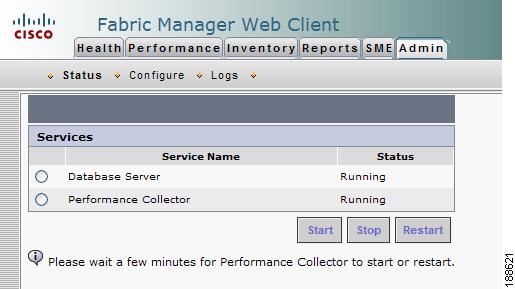
Step 2 ![]() Select the services you want to start, restart, or stop.
Select the services you want to start, restart, or stop.
Step 3 ![]() Click Start or Stop, or Restart.
Click Start or Stop, or Restart.
The selected services are started, restarted, or stopped.
Note ![]() If the word "more" is in the Status column, you can click it to view a detailed status of the service.
If the word "more" is in the Status column, you can click it to view a detailed status of the service.
Note ![]() You need to configure Performance collection in order to start, stop or restart Performance Collector.
You need to configure Performance collection in order to start, stop or restart Performance Collector.
Adding, Editing, and Removing Managed Fabrics
Fabric Manager Web Client reports information gathered by the Fabric Manager Server on any fabric known to the Fabric Manager Server.
To start managing a fabric from the Fabric Manager Server using Fabric Manager Web Client, follow these steps:
Step 1 ![]() Click the Admin tab, and then click Configure.
Click the Admin tab, and then click Configure.
Step 2 ![]() Click Fabrics in the left navigation pane.
Click Fabrics in the left navigation pane.
You see the list of fabrics (if any) managed by Fabric Manager Server in the Opened column as shown in Figure 7-43.
Figure 7-43 List of Fabrics Managed by the Fabric Manager Server
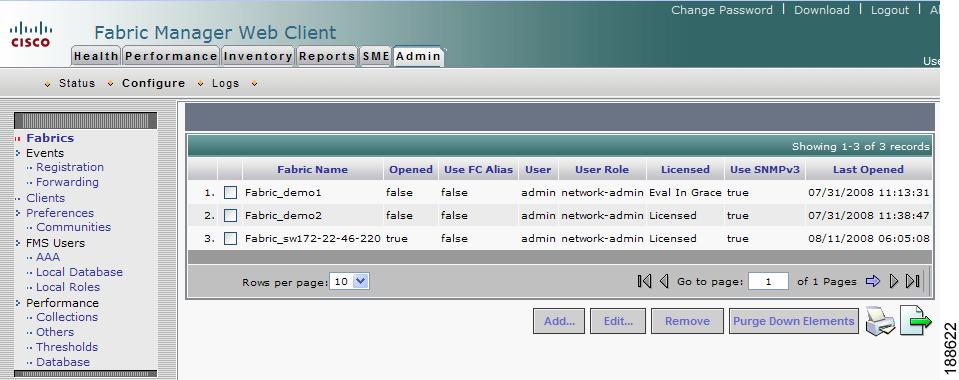
Step 3 ![]() Click Add.
Click Add.
You see the Add Fabric dialog box as shown in Figure 7-44.
Figure 7-44 Add Fabric Dialog Box
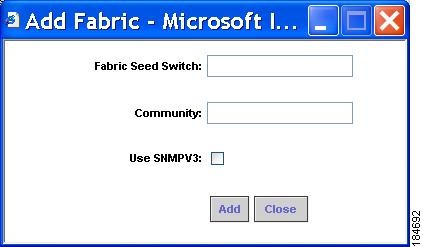
Step 4 ![]() Enter the seed switch IP address, read community and write community for this fabric.
Enter the seed switch IP address, read community and write community for this fabric.
Step 5 ![]() Enter the user name and password for this fabric.
Enter the user name and password for this fabric.
Step 6 ![]() (Optional) Check the SNMPV3 check box. If you check SNMPV3, the fields Read Community and Write Community change to User Name and Password. You must enter your user name and password.
(Optional) Check the SNMPV3 check box. If you check SNMPV3, the fields Read Community and Write Community change to User Name and Password. You must enter your user name and password.
Step 7 ![]() Select the privacy settings from the Auth-Privacy listbox.
Select the privacy settings from the Auth-Privacy listbox.
Step 8 ![]() Click Add to begin managing this fabric.
Click Add to begin managing this fabric.
Step 9 ![]() Select the IP address of the server from the Server listbox.
Select the IP address of the server from the Server listbox.
To stop managing a fabric from Fabric Manager Server using Fabric Manager Web Client, follow these steps:
Step 1 ![]() Click the Admin tab, and then click Configure.
Click the Admin tab, and then click Configure.
Step 2 ![]() Click Fabrics in the left navigation pane.
Click Fabrics in the left navigation pane.
Step 3 ![]() Check the check box next to the fabric that you want to remove and click Remove to discontinue data collection for that fabric.
Check the check box next to the fabric that you want to remove and click Remove to discontinue data collection for that fabric.
To edit a fabric from Fabric Manager Server using Fabric Manager Web Client, follow these steps:
Step 1 ![]() Click the Admin tab, and then click Configure.
Click the Admin tab, and then click Configure.
Step 2 ![]() Click Fabrics in the left navigation pane.
Click Fabrics in the left navigation pane.
Step 3 ![]() Check the check box next to the fabric that you want to edit and click Edit.
Check the check box next to the fabric that you want to edit and click Edit.
You see the Edit Fabric dialog box as shown in Figure 7-45.
Figure 7-45 Edit Fabric Dialog Box

Step 4 ![]() Enter a new fabric name, user name and password and specify how you want Fabric Manager Server to manage the fabric by selecting an option from the drop-down list.
Enter a new fabric name, user name and password and specify how you want Fabric Manager Server to manage the fabric by selecting an option from the drop-down list.
Step 5 ![]() Click Modify to save the changes.
Click Modify to save the changes.
Viewing Trap and Syslog Registration Information
To view trap and syslog registration information from Fabric Manager Server using Fabric Manager Web Client, follow these steps:
Step 1 ![]() Click the Admin tab, and then click Configure.
Click the Admin tab, and then click Configure.
Step 2 ![]() Click Registration in the left navigation pane.
Click Registration in the left navigation pane.
Step 3 ![]() Select a fabric to display registration information for that fabric.
Select a fabric to display registration information for that fabric.
You see the Registration screen showing the registration information for the selected fabric as shown in Figure 7-46.
Figure 7-46 Registration Screen
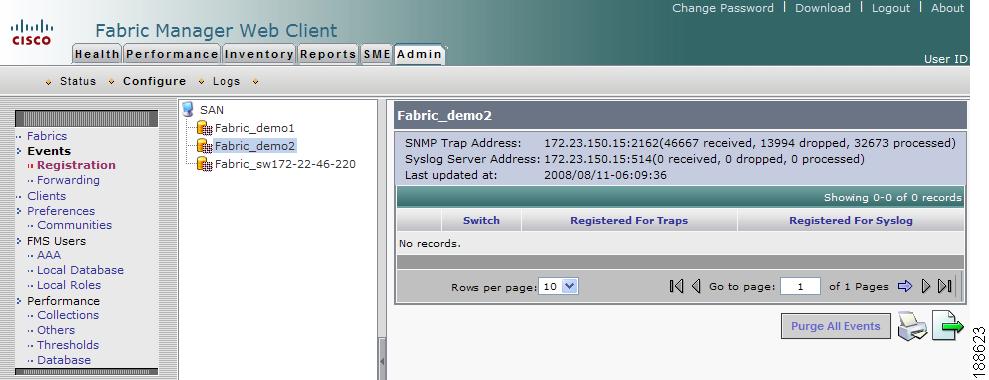
Step 4 ![]() (Optional) Click the Print icon or the Export Report icon for a copy of the information.
(Optional) Click the Print icon or the Export Report icon for a copy of the information.
Configuring Forwarding of Notifications for Events
You can use Fabric Manager Web Client to add and remove notification forwards for system messages.
Note ![]() Fabric Manager Web Client forwards fabric events via e-mail or SNMPv1 traps.
Fabric Manager Web Client forwards fabric events via e-mail or SNMPv1 traps.
To add a notification forward using Fabric Manager Web Client, follow these steps:
Step 1 ![]() Click the Admin tab, and then click Configure.
Click the Admin tab, and then click Configure.
Step 2 ![]() Click Forwarding in the left navigation pane.
Click Forwarding in the left navigation pane.
Step 3 ![]() Click Add.
Click Add.
You see the Add Notification dialog box as shown in Figure 7-47.
Figure 7-47 Add Notification Dialog Box
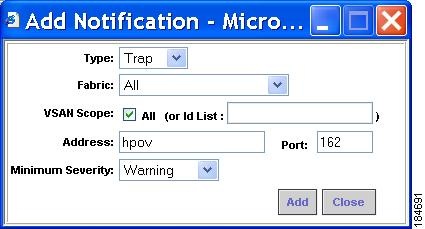
Step 4 ![]() In the Type field, either choose E-Mail or SNMP Trap. If you choose Trap, a Port field is added to the dialog box.
In the Type field, either choose E-Mail or SNMP Trap. If you choose Trap, a Port field is added to the dialog box.
Step 5 ![]() From the Fabric drop-down list, choose the fabric for notification.
From the Fabric drop-down list, choose the fabric for notification.
Step 6 ![]() Either check the VSAN Scope check box to receive notifications for all VSANs, or enter the VSAN IDs in the ID List field to limit the VSANs for which you want to receive notifications.
Either check the VSAN Scope check box to receive notifications for all VSANs, or enter the VSAN IDs in the ID List field to limit the VSANs for which you want to receive notifications.
Step 7 ![]() Enter the e-mail address for notifications in the Address field.
Enter the e-mail address for notifications in the Address field.
Step 8 ![]() From the Minimum Severity drop-down list, select the severity level of the messages to receive.
From the Minimum Severity drop-down list, select the severity level of the messages to receive.
Step 9 ![]() Click Add to add the notification.
Click Add to add the notification.
Note ![]() The traps sent by Fabric Manager Server correspond to the severity type followed by a text description:
The traps sent by Fabric Manager Server correspond to the severity type followed by a text description:
trap type(s) = 40990 (emergency) 40991 (alert) 40992 (critical) 40993 (error) 40994
(warning) 40995 (notice) 40996 (info) 40997 (debug)textDescriptionOid = 1, 3, 6, 1, 4, 1,
9, 9, 40999, 1, 1, 3, 0
To remove a notification forward using Fabric Manager Web Client, follow these steps:
Step 1 ![]() Click the Admin tab, and then click Configure.
Click the Admin tab, and then click Configure.
Step 2 ![]() Click Forwarding in the left navigation pane.
Click Forwarding in the left navigation pane.
Step 3 ![]() Check the check box in front of the notification that you want to remove.
Check the check box in front of the notification that you want to remove.
Step 4 ![]() Click Remove.
Click Remove.
Viewing and Disconnecting Clients
To view or disconnect clients from the Fabric Manager Server using Fabric Manager Web Client, follow these steps:
Step 1 ![]() Click the Admin tab, and then click Configure.
Click the Admin tab, and then click Configure.
Step 2 ![]() Click Clients in the left navigation pane.
Click Clients in the left navigation pane.
You see the Clients page as shown in Figure 7-48.
Figure 7-48 List of Clients

Step 3 ![]() Check the check box next to the client you want to disconnect.
Check the check box next to the client you want to disconnect.
Step 4 ![]() Click Disconnect.
Click Disconnect.
Configuring Fabric Manager Server Preferences
To configure Fabric Manager Server preferences, click the Admin tab, click Configure and then click Preferences in the left navigation pane. Follow the on-screen instructions.
Adding and Removing Communities
You can use Fabric Manager Web Client to add and remove communities.
To add a community fabric using Fabric Manager Web Client, follow these steps:
Step 1 ![]() Click the Admin tab, and then click Configure.
Click the Admin tab, and then click Configure.
Step 2 ![]() Click Communities in the left navigation pane.
Click Communities in the left navigation pane.
Step 3 ![]() Click Add.
Click Add.
You see the Add Community dialog box shown in Figure 7-49.
Figure 7-49 Add Community Dialog Box

Step 4 ![]() Enter the IP mask or address of the community in the IP Mask/Address field.
Enter the IP mask or address of the community in the IP Mask/Address field.
Note ![]() The IP mask can contain wildcards (0s) you can use to assign communities to subnets.
The IP mask can contain wildcards (0s) you can use to assign communities to subnets.
Step 5 ![]() Enter the name of the community in the Community field.
Enter the name of the community in the Community field.
Step 6 ![]() Click Add to add the community.
Click Add to add the community.
To remove a community using Fabric Manager Web Client, follow these steps:
Step 1 ![]() Click the Admin tab, and then click Configure.
Click the Admin tab, and then click Configure.
Step 2 ![]() Click Communities in the left navigation pane.
Click Communities in the left navigation pane.
You see the Communities page shown in Figure 7-50.
Figure 7-50 Communities Page
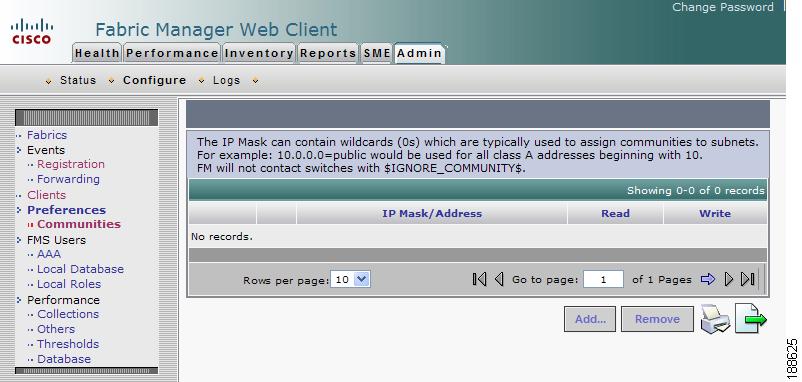
Step 3 ![]() Check the check box next to the community that you want to remove and click Remove.
Check the check box next to the community that you want to remove and click Remove.
Note ![]() Cisco Fabric Manager 3.0(1) does not require you to make changes to the communities.properties file even if you are using a Cisco MDS 9020 switch or any third-party devices.
Cisco Fabric Manager 3.0(1) does not require you to make changes to the communities.properties file even if you are using a Cisco MDS 9020 switch or any third-party devices.
Configuring AAA Information
To configure Fabric Manager Server preferences, click the Admin tab, click Configure, and then inthe left pane, select FMS Users and AAA and follow the instructions on the screen.
Adding and Removing Users
You can use Fabric Manager Web Client to add and remove Web Server users.
To add a user using Fabric Manager Web Client, follow these steps:
Step 1 ![]() Click the Admin tab, and then click Configure.
Click the Admin tab, and then click Configure.
Step 2 ![]() Select Local Database in the left navigation pane.
Select Local Database in the left navigation pane.
You see the Local Database page as shown in Figure 7-51.
Figure 7-51 Local Database Page
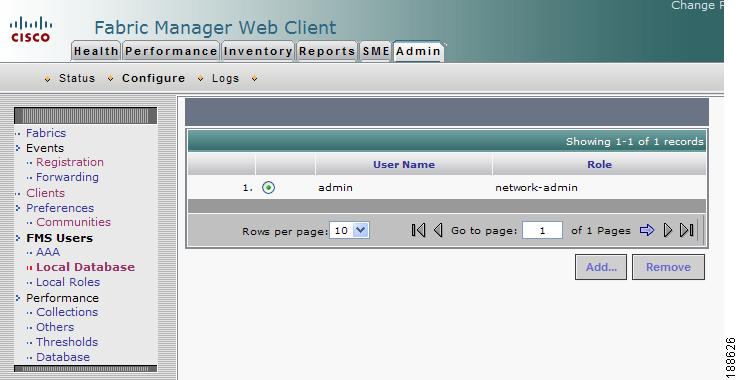
Step 3 ![]() Click Add.
Click Add.
You see the Add User dialog box as shown in Figure 7-52.
Figure 7-52 Add User Dialog Box

Step 4 ![]() Enter the user name in the User Name field.
Enter the user name in the User Name field.
Note ![]() The user name guest is a reserved name (case insensitive). The guest user can only view reports. The guest user cannot change the guest password, nor can the guest user access the Admin tab in Fabric Manager Web Client.
The user name guest is a reserved name (case insensitive). The guest user can only view reports. The guest user cannot change the guest password, nor can the guest user access the Admin tab in Fabric Manager Web Client.
Step 5 ![]() Select a role for the user from the Role drop-down list.
Select a role for the user from the Role drop-down list.
Step 6 ![]() Enter the password in the Password field.
Enter the password in the Password field.
Step 7 ![]() Enter the password again in the Confirm Password field.
Enter the password again in the Confirm Password field.
Step 8 ![]() Click Add to add the user to the database.
Click Add to add the user to the database.
Step 9 ![]() Repeat Steps 3 through 7 to continue adding users.
Repeat Steps 3 through 7 to continue adding users.
To remove a user using Fabric Manager Web Client, follow these steps:
Step 1 ![]() Click the Admin tab, and then click Configure.
Click the Admin tab, and then click Configure.
Step 2 ![]() Select Local Database in the left navigation pane.
Select Local Database in the left navigation pane.
Step 3 ![]() Click the radio button next to the user that you want to remove and click Remove.
Click the radio button next to the user that you want to remove and click Remove.
Adding and Removing Roles
You can use Fabric Manager Web Client to add and remove Web Server roles.
To add a role using Fabric Manager Web Client, follow these steps:
Step 1 ![]() Click the Admin tab, and then click Configure.
Click the Admin tab, and then click Configure.
Step 2 ![]() Click Local Roles in the left navigation pane.
Click Local Roles in the left navigation pane.
You see the Local Roles page as shown in Figure 7-53.
Figure 7-53 Local Roles Page
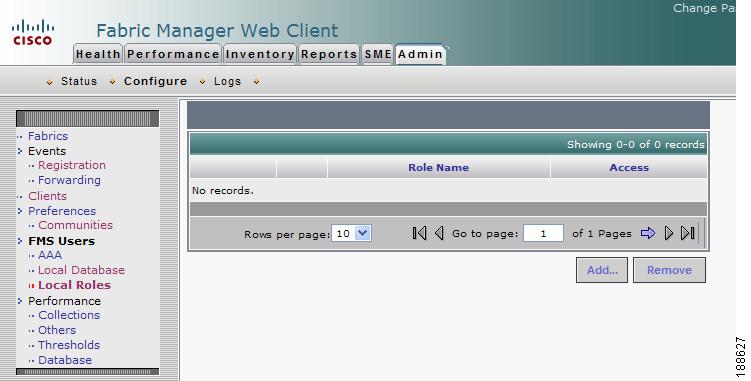
Step 3 ![]() Click Add.
Click Add.
You see the Add Role dialog box as shown in Figure 7-54.
Figure 7-54 Add Role Dialog Box
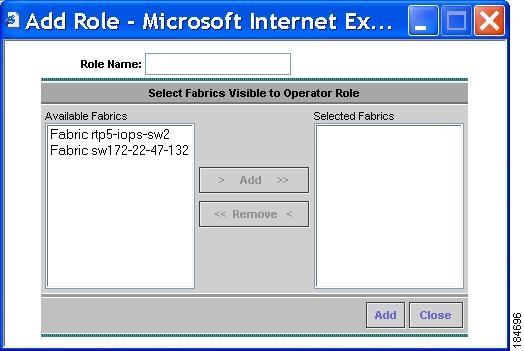
Step 4 ![]() Enter the role name in the Role Name field.
Enter the role name in the Role Name field.
Step 5 ![]() Select fabrics that the role can access from the Available Fabrics column and add them to the Selected Fabrics column.
Select fabrics that the role can access from the Available Fabrics column and add them to the Selected Fabrics column.
Step 6 ![]() Click Add to add the role to the database.
Click Add to add the role to the database.
Step 7 ![]() Repeat Steps 3 through 5 to add additional roles.
Repeat Steps 3 through 5 to add additional roles.
To remove a role using Fabric Manager Web Client, follow these steps:
Step 1 ![]() Click the Admin tab and then click Configure.
Click the Admin tab and then click Configure.
Step 2 ![]() Select Local Roles in the left navigation pane.
Select Local Roles in the left navigation pane.
Step 3 ![]() Click the radio button next to the role you want to remove and click Remove.
Click the radio button next to the role you want to remove and click Remove.
Creating Performance Collections
If you are managing your fabrics with Performance Manager, you need to set up an initial set of flows and collections on the fabric. You can use Fabric Manager Web Client to add and remove performance collections. The fabric has to be licensed and in the Managed Continuously state before a collection for the fabric can be created.
Note ![]() You cannot manage performance collections for multiple devices through a single port interface. Since only one set of statistics exists per interface, Fabric Manager Web Client can manage performance collections for only one visible FL or iSCSI device through an interface.
You cannot manage performance collections for multiple devices through a single port interface. Since only one set of statistics exists per interface, Fabric Manager Web Client can manage performance collections for only one visible FL or iSCSI device through an interface.
To add a collection using Fabric Manager Web Client, follow these steps:
Step 1 ![]() Click the Admin tab, and then click Configure.
Click the Admin tab, and then click Configure.
Step 2 ![]() Click Collections in the left navigation pane.
Click Collections in the left navigation pane.
You see the Collections page as shown in Figure 7-55.
Figure 7-55 Collections Page
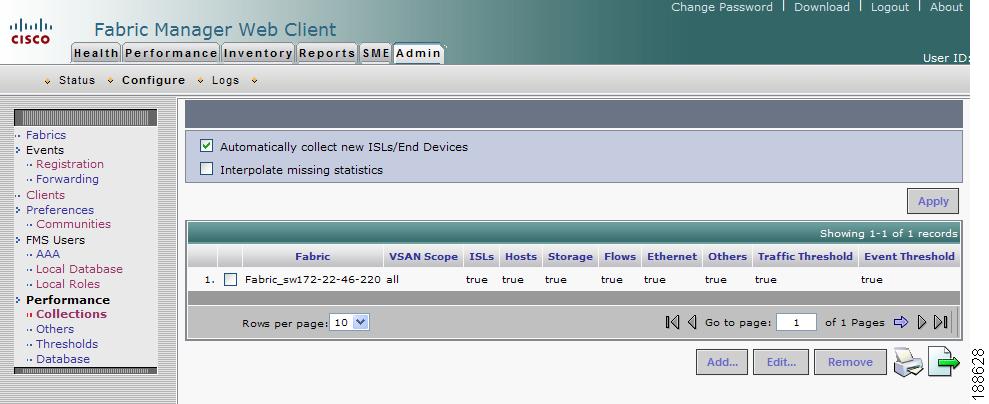
Step 3 ![]() Click Add.
Click Add.
You see the Create Collection dialog box as shown in Figure 7-56.
Figure 7-56 Create Collection Dialog Box

Step 4 ![]() Select a fabric for which to collect performance data from the Fabric drop-down list.
Select a fabric for which to collect performance data from the Fabric drop-down list.
Step 5 ![]() Either check the VSAN Scope check box to receive notifications for all VSANs, or enter the VSAN IDs in the ID List field to limit the VSANs for which you want to collect performance data.
Either check the VSAN Scope check box to receive notifications for all VSANs, or enter the VSAN IDs in the ID List field to limit the VSANs for which you want to collect performance data.
Step 6 ![]() Check the check boxes for the type(s) of entities for which you want to collect performance data.
Check the check boxes for the type(s) of entities for which you want to collect performance data.
Step 7 ![]() Check the check boxes for the type(s) of thresholds you want to enable.
Check the check boxes for the type(s) of thresholds you want to enable.
Step 8 ![]() Click Create to add the collection and add it to the table.
Click Create to add the collection and add it to the table.
Step 9 ![]() Repeat Steps 3 through 8 to continue adding roles.
Repeat Steps 3 through 8 to continue adding roles.
Note ![]() Performance Manager shows statistics for fabrics that you have configured collections for using the Collection Wizard.
Performance Manager shows statistics for fabrics that you have configured collections for using the Collection Wizard.
To remove a collection using Fabric Manager Web Client, follow these steps:
Step 1 ![]() Click the Admin tab, and then click Configure.
Click the Admin tab, and then click Configure.
Step 2 ![]() Click Collections in the left navigation pane.
Click Collections in the left navigation pane.
Step 3 ![]() Check the check box next to the collection you want to remove and click Remove.
Check the check box next to the collection you want to remove and click Remove.
Configuring Other Statistics
To configue other statistics using Fabric Manager Web Client, follow these steps:
Step 1 ![]() Click the Admin tab, and then click Configure.
Click the Admin tab, and then click Configure.
Step 2 ![]() Click Others in the left navigation pane.
Click Others in the left navigation pane.
You see the Others page as shown in Figure 7-57.
Figure 7-57 Others Page
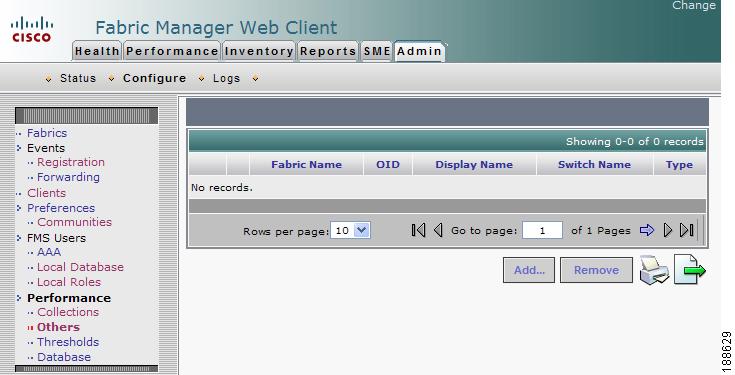
Step 3 ![]() Click Add.
Click Add.
You see the Add Oid dialog box as shown in Figure 7-58.
Figure 7-58 Add Oid Dialog Box

Step 4 ![]() Select a fabric for which you want to add other statistics.
Select a fabric for which you want to add other statistics.
Step 5 ![]() Select the statistic that you want to add from the Other OID drop-down list and specify a name for the statistic in the Display Name field.
Select the statistic that you want to add from the Other OID drop-down list and specify a name for the statistic in the Display Name field.
Step 6 ![]() Click Add to add this statistic.
Click Add to add this statistic.
Configuring Collection Thresholds
To configure collection thresholds using Fabric Manager Web Client, follow these steps:
Step 1 ![]() Click the Admin tab, and then click Configure.
Click the Admin tab, and then click Configure.
Step 2 ![]() Select Thresholds in the left navigation pane.
Select Thresholds in the left navigation pane.
You see the Thresholds page as shown in Figure 7-59.
Figure 7-59 Thresholds Page
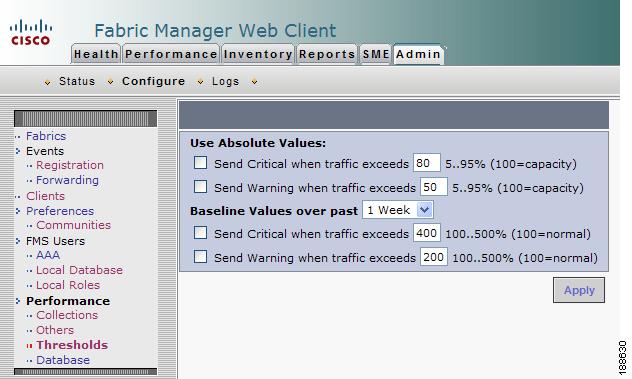
Step 3 ![]() If you are using absolute values, follow these steps, otherwise skip to Step 3.
If you are using absolute values, follow these steps, otherwise skip to Step 3.
a. ![]() To configure conditions for sending Critical notifications, check the Send Critical check box. In the "...when traffic exceeds" field, enter a number (from 5 to 95) to indicate the percentage at which the Critical notification is sent. For example, entering 10 causes a notification to be sent when traffic at any given time exceeds 10% of capacity.
To configure conditions for sending Critical notifications, check the Send Critical check box. In the "...when traffic exceeds" field, enter a number (from 5 to 95) to indicate the percentage at which the Critical notification is sent. For example, entering 10 causes a notification to be sent when traffic at any given time exceeds 10% of capacity.
b. ![]() To configure conditions for sending Warning notifications, check the Send Warning check box. In the "...when traffic exceeds" field, enter a number (from 5 to 95) to indicate the percentage at which the Warning notification is sent. For example, entering 9 causes a notification to be sent when traffic at any given time exceeds 9% of capacity.
To configure conditions for sending Warning notifications, check the Send Warning check box. In the "...when traffic exceeds" field, enter a number (from 5 to 95) to indicate the percentage at which the Warning notification is sent. For example, entering 9 causes a notification to be sent when traffic at any given time exceeds 9% of capacity.
Step 4 ![]() Select the time period for the collection (1 Week, 1 Month, or 1 Year) from the Baseline Values over past drop-down list. The baseline value represents the sum of the absolute values.
Select the time period for the collection (1 Week, 1 Month, or 1 Year) from the Baseline Values over past drop-down list. The baseline value represents the sum of the absolute values.
a. ![]() To configure conditions for sending Critical notifications, check the Send Critical check box. In the "...when traffic exceeds" field, enter a number to indicate the percentage at which the Critical notification is sent. For example, entering 300 causes a notification to be sent when traffic for the selected period exceeds 300% of capacity.
To configure conditions for sending Critical notifications, check the Send Critical check box. In the "...when traffic exceeds" field, enter a number to indicate the percentage at which the Critical notification is sent. For example, entering 300 causes a notification to be sent when traffic for the selected period exceeds 300% of capacity.
b. ![]() To configure conditions for sending Warning notifications, check the Send Warning check box. In the "...when traffic exceeds" field, enter a number to indicate the percentage at which the Warning notification is sent. For example, entering 150 causes a notification to be sent when traffic for the selected period exceeds 150% of capacity.
To configure conditions for sending Warning notifications, check the Send Warning check box. In the "...when traffic exceeds" field, enter a number to indicate the percentage at which the Warning notification is sent. For example, entering 150 causes a notification to be sent when traffic for the selected period exceeds 150% of capacity.
Step 5 ![]() Click Apply.
Click Apply.
Importing the RRD Statistics Index
To manually import the RRD statistics index, follow these steps:
Step 1 ![]() Stop Fabric Manager Server.
Stop Fabric Manager Server.
Step 2 ![]() Copy the original RRD file into $INSTALLDIR/pm/db.
Copy the original RRD file into $INSTALLDIR/pm/db.
Step 3 ![]() Run $INSTALLDIR/bin/pm.bat s.
Run $INSTALLDIR/bin/pm.bat s.
Step 4 ![]() Restart the Fabric Manager Server and add the fabric.
Restart the Fabric Manager Server and add the fabric.
Configuring the RRD Database
Configuring the RRD database allows you to set the intervals at which data samples are collected. After applying the configuration, the database storage format is converted to a new format at those intervals. Since database formats are incompatible with each other, you must copy the old data (before the conversion) to the $INSTALLDIR/pm directory. See"Importing the RRD Statistics Index" section.
To configure the RRD database using Fabric Manager Web Client, follow these steps:
Step 1 ![]() Click the Admin tab, and then click Configure.
Click the Admin tab, and then click Configure.
Step 2 ![]() Select Database in the left navigation pane.
Select Database in the left navigation pane.
You see the Performance Database (collection interval) page as shown in Figure 7-60.
Figure 7-60 Performance Database Page
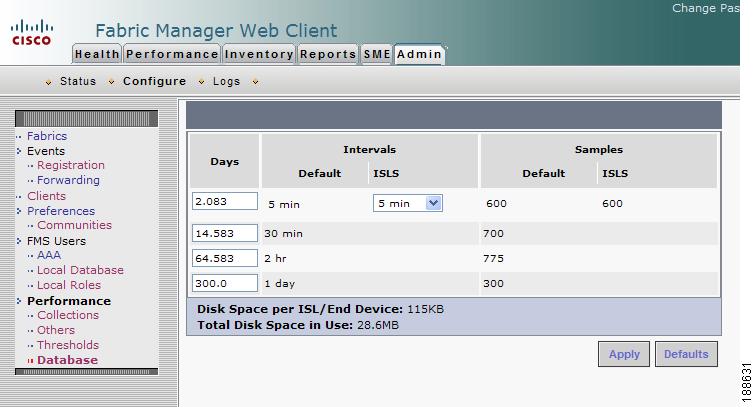
Step 3 ![]() Enter the number of days to collect samples at 5-minute intervals in the top row of the Days column.
Enter the number of days to collect samples at 5-minute intervals in the top row of the Days column.
Step 4 ![]() Enter the number of days to collect samples at 30-minute intervals in the second row of the Days column.
Enter the number of days to collect samples at 30-minute intervals in the second row of the Days column.
Step 5 ![]() Enter the number of days to collect samples at 2-hour intervals in the third row of the Days column.
Enter the number of days to collect samples at 2-hour intervals in the third row of the Days column.
Step 6 ![]() Enter the number of days to collect samples at 1-day intervals in the bottom row of the Days column.
Enter the number of days to collect samples at 1-day intervals in the bottom row of the Days column.
Note ![]() As of Cisco SAN-OS Release 3.1(1) and later, you can configure the sampling interval for ISLs. Select a sampling interval from the ISLs drop-down list.
As of Cisco SAN-OS Release 3.1(1) and later, you can configure the sampling interval for ISLs. Select a sampling interval from the ISLs drop-down list.
Step 7 ![]() Click Apply to apply your changes, or click Defaults to reset the file sizes to the default values.
Click Apply to apply your changes, or click Defaults to reset the file sizes to the default values.
If you are applying new values, or if the current values are not the default values, you see a message indicating that conversion of the RRD files will take a certain amount of time and that the database will be unavailable until then. The time it takes depends on the difference between the old and new values.
Note ![]() The system allows you to convert data, one process at a time. When you start converting the data, the Apply and Default buttons change to Refresh and Cancel so that another process cannot be inadvertently started. The display is the same for all browsers accessing the server during this time. Click Refresh to view the latest progress. Click Cancel to cancel the process of converting the data. If the job is successfully canceled, you see the Apply and Default buttons again. If the cancel job is not successful, you see a message indicating that the cancellation has failed.
The system allows you to convert data, one process at a time. When you start converting the data, the Apply and Default buttons change to Refresh and Cancel so that another process cannot be inadvertently started. The display is the same for all browsers accessing the server during this time. Click Refresh to view the latest progress. Click Cancel to cancel the process of converting the data. If the job is successfully canceled, you see the Apply and Default buttons again. If the cancel job is not successful, you see a message indicating that the cancellation has failed.
If you want to perform this procedure, it is best to perform it before collecting a lot of data. Otherwise, converting the data can take a long time.
Viewing Log Information
You may occasionally want to view logs such as the Fabric Manager Server log. These processes have no corresponding GUI to allow you to view information about these log files. If you see errors, preserve these two files for viewing.
To view log information using Fabric Manager Web Client, follow these steps:
Step 1 ![]() Click the Admin tab, and then click Logs.
Click the Admin tab, and then click Logs.
You see a list of viewable logs in the left column.
Step 2 ![]() Click a log file to view it.
Click a log file to view it.
Downloading Fabric Manager Client
You must use Fabric Manager Web Client to launch Fabric Manager Client. See the "Launching Fabric Manager Client in Cisco SAN-OS Release 3.2(1) and Later" section for information on launching Fabric Manager Client.
To launch Fabric Manager Client, follow these steps:
Step 1 ![]() Choose Admin > Download.
Choose Admin > Download.
Step 2 ![]() Click the link for either Fabric Manager or Device Manager.
Click the link for either Fabric Manager or Device Manager.
If you are launching Fabric Manager Client for the first time, you see a message asking whether you want to create shortcuts for Fabric Manager.
Step 3 ![]() Click Yes to create shortcuts for Fabric Manager.
Click Yes to create shortcuts for Fabric Manager.
Note ![]() This message only appears the first time you launch Fabric Manager Client.
This message only appears the first time you launch Fabric Manager Client.
Fabric Manager Web Search Engine
The search engine helps you locate records that mach a specific criteria. The search entity is divided into two categories: inventory and performance. In the inventory type, you can search by the switch (name of the switch, IP address of the switch and WWN), Endport (alias, IP address of the switch and WWN) and VSANs (name of the VSAN, IP address of the principle switch and WWN). In the performance type, you can search by end device (Endport alias, Endport WWN), Flow (name of the flow) and ISLs (name of the ISL and WWN of the ISL). You can also use wild card characters in the search.
Using Fabric Manager Search Engine
To conduct a search, follow these steps:
Step 1 ![]() Click Search on the top.
Click Search on the top.
You see the search page as shown in Figure 7-61.
Figure 7-61
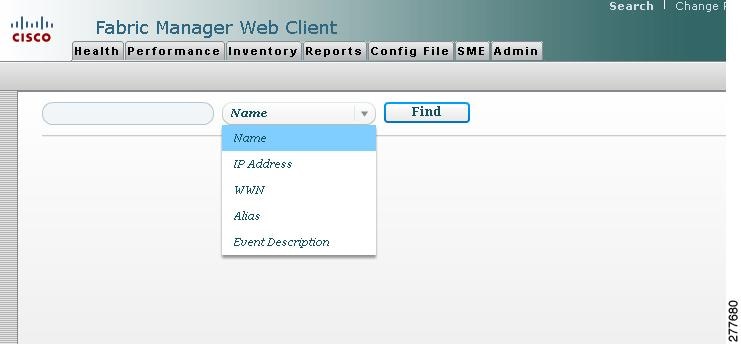
Search Page
Step 2 ![]() Enter the name to search in the text box.
Enter the name to search in the text box.
Step 3 ![]() Select the appropriate type from the combo box and then click Find.
Select the appropriate type from the combo box and then click Find.
A window appears with your results as shown in Figure 7-62.
Figure 7-62
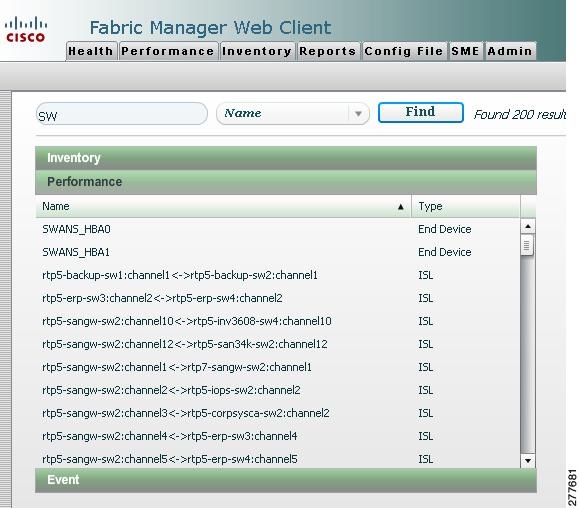
Search Results
Step 4 ![]() Click the entity type to see the details.
Click the entity type to see the details.
You see the details of the selected entity in the right pane as shown in Figure 7-63.
Figure 7-63 Detailed Results

Step 5 ![]() Click the chart icon at the bottom of the right pane to view the graphical representation of the data.
Click the chart icon at the bottom of the right pane to view the graphical representation of the data.
You see the graph as shown in Figure 7-64.
Figure 7-64

Data in Chart
Step 6 ![]() Click the grid icon in the right pane to View the data in grid format.
Click the grid icon in the right pane to View the data in grid format.
You see the data in grid format as shown in Figure 7-65.
Figure 7-65

Data in Grid
Step 7 ![]() Click Range Selecter to analyze performance data in a specific range.
Click Range Selecter to analyze performance data in a specific range.
Step 8 ![]() You see the range selector as shown in Figure 7-66.
You see the range selector as shown in Figure 7-66.
Figure 7-66

Range Selector
Step 9 ![]() Use the sliders to select a specific range.
Use the sliders to select a specific range.
Step 10 ![]() Click the Range Selector again to turn off the range selector.
Click the Range Selector again to turn off the range selector.
Configuring Backups Using Fabric Manager WebClient
Using Fabric Manager WebClient, you can periodically backup startup and running configurations of the switch. You can also view backed-up configurations, schedule configuration backups, compare two backed-up configurations, and restore a configuration onto a switch.
Viewing a Configuration
To view a configuration, follow these steps:
Step 1 ![]() Click the Config File tab and then click View.
Click the Config File tab and then click View.
You see the configuration information as shown in Figure 7-67.
Figure 7-67

Viewing Configuration
Step 2 ![]() Select a fabric name from the Fabric drop-down list.
Select a fabric name from the Fabric drop-down list.
Step 3 ![]() Select a switch from the Switch drop-down list.
Select a switch from the Switch drop-down list.
Step 4 ![]() Select a configuration file name from the Configuration file drop-down list.
Select a configuration file name from the Configuration file drop-down list.
Step 5 ![]() Click View.
Click View.
Comparing Configurations
To compare configurations, follow these steps:
Step 1 ![]() Click the Config File tab, and then click Compare.
Click the Config File tab, and then click Compare.
You see the compare configuration information as shown in Figure 7-68.
Figure 7-68

Compare Configurations
Step 2 ![]() Select a fabric name from the Fabric drop-down list.
Select a fabric name from the Fabric drop-down list.
Step 3 ![]() Select a switch from the Switch drop-down list.
Select a switch from the Switch drop-down list.
Step 4 ![]() Select a configuration file name from the Configuration file drop-down list.
Select a configuration file name from the Configuration file drop-down list.
Step 5 ![]() Select a fabric name from the Fabric drop-down list in the second row.
Select a fabric name from the Fabric drop-down list in the second row.
Step 6 ![]() Select a switch from the Switch drop-down list in the second row.
Select a switch from the Switch drop-down list in the second row.
Step 7 ![]() Click to select a configuration type (Archive, Running, Startup).
Click to select a configuration type (Archive, Running, Startup).
Step 8 ![]() Click to select a Server Type (TFTP, FTP, SFTP, SFP).
Click to select a Server Type (TFTP, FTP, SFTP, SFP).
Step 9 ![]() Click Compare.
Click Compare.
Restoring Configurations
To restore a configuration on a switch, follow these steps:
Step 1 ![]() Click the Config File tab, and then click Restore.
Click the Config File tab, and then click Restore.
You see the compare configuration information as shown in Figure 7-69.
Figure 7-69
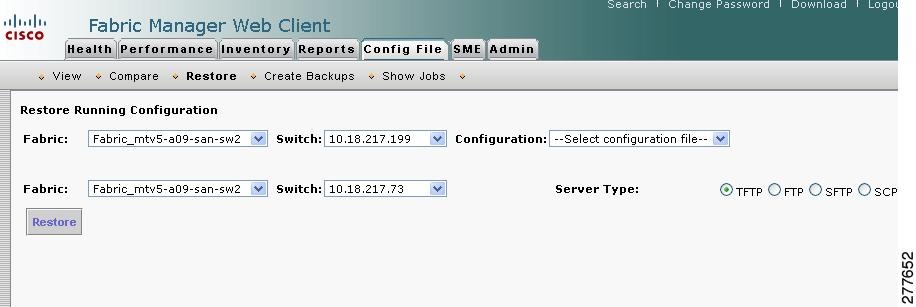
Restore Configurations
Step 2 ![]() Select a fabric name from the Fabric drop-down list.
Select a fabric name from the Fabric drop-down list.
Step 3 ![]() Select a switch from the Switch drop-down list.
Select a switch from the Switch drop-down list.
Step 4 ![]() Select a configuration file name from the Configuration file drop-down list.
Select a configuration file name from the Configuration file drop-down list.
Step 5 ![]() Select a fabric name from the Fabric drop-down list in the second row.
Select a fabric name from the Fabric drop-down list in the second row.
Step 6 ![]() Select a switch from the Switch drop-down list in the second row.
Select a switch from the Switch drop-down list in the second row.
Step 7 ![]() Click to select a Server Type (TFTP, FTP, SFTP, SFP).
Click to select a Server Type (TFTP, FTP, SFTP, SFP).
Step 8 ![]() Click Restore.
Click Restore.
Creating Backups
To create a backup of the configuration, follow these steps:
Step 1 ![]() Click Config File tab and then click Create Backups.
Click Config File tab and then click Create Backups.
You see the backup configuration page as shown in Figure 7-70.
Figure 7-70
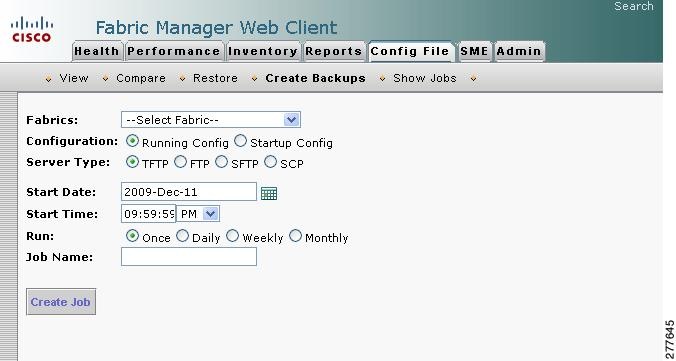
Creating Backups
Step 2 ![]() Select a fabric name from the Fabric drop-down list.
Select a fabric name from the Fabric drop-down list.
Step 3 ![]() Click to select a configuration type (Archive, Running, Startup).
Click to select a configuration type (Archive, Running, Startup).
Step 4 ![]() Click to select a Server Type (TFTP, FTP, SFTP, SFP).
Click to select a Server Type (TFTP, FTP, SFTP, SFP).
Step 5 ![]() Click the calendar icon to select a start date.
Click the calendar icon to select a start date.
Step 6 ![]() Enter the start time.
Enter the start time.
Step 7 ![]() Click to select the frequency (Once, Daily, Weekly, Monthly) at which you want to perform backup.
Click to select the frequency (Once, Daily, Weekly, Monthly) at which you want to perform backup.
Step 8 ![]() Enter a name to identify this backup task.
Enter a name to identify this backup task.
Step 9 ![]() Click Create Job to save this job schedule.
Click Create Job to save this job schedule.
Viewing Scheduled Jobs
To view the scheduled backup jobs, follow these steps:
Step 1 ![]() Click the Config File tab, and then click Show Jobs.
Click the Config File tab, and then click Show Jobs.
You see the scheduled jobs information as shown in Figure 7-71.
Figure 7-71
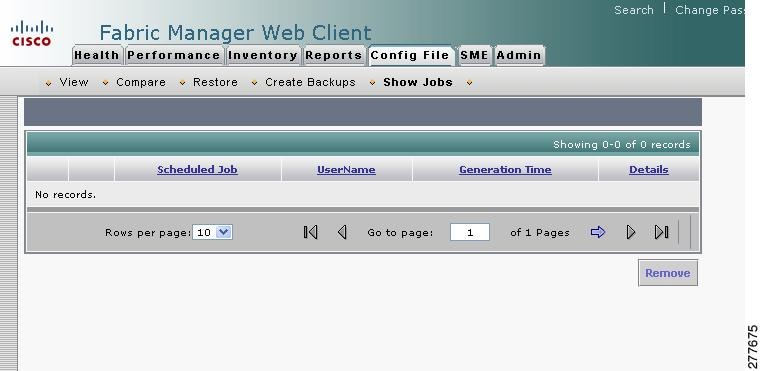
Viewing Scheduled Jobs
Step 2 ![]() Double-click one of the listed scheduled jobs to view them.
Double-click one of the listed scheduled jobs to view them.
 Feedback