- New and Changed
- Preface
- Overview
- Using the CFS Infrastructure
- Configuring System Message Logging
- Configuring Call Home
- Scheduling Maintenance Jobs
- Monitoring System Processes and Logs
- Configuring SNMP
- Configuring RMON
- Configuring Domain Parameters
- Monitoring Network Traffic Using SPAN
- Configuring Fabric Configuration Server
Cisco Fabric Manager System Management Configuration Guide
Bias-Free Language
The documentation set for this product strives to use bias-free language. For the purposes of this documentation set, bias-free is defined as language that does not imply discrimination based on age, disability, gender, racial identity, ethnic identity, sexual orientation, socioeconomic status, and intersectionality. Exceptions may be present in the documentation due to language that is hardcoded in the user interfaces of the product software, language used based on RFP documentation, or language that is used by a referenced third-party product. Learn more about how Cisco is using Inclusive Language.
- Updated:
- August 21, 2009
Chapter: Monitoring System Processes and Logs
Monitoring System Processes and Logs
This chapter provides details on monitoring the health of the switch. It includes the following sections:
Displaying System Processes
To obtain general information about all processes using Device Manager, follow these steps:
Step 1 ![]() Choose Admin > Running Processes.
Choose Admin > Running Processes.
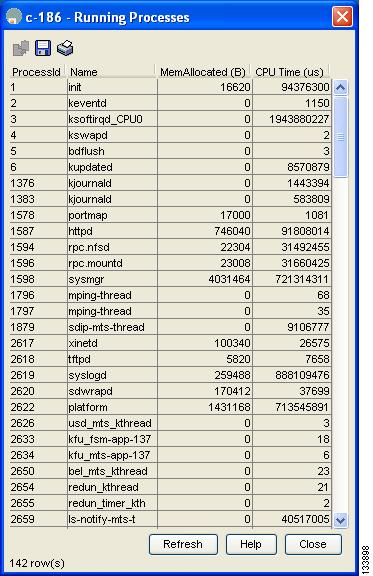
You see the Running Processes dialog box shown in Figure 6-1.
Figure 6-1 Running Processes Dialog Box
Where:
•![]() ProcessId = Process ID
ProcessId = Process ID
•![]() Name = Name of the process
Name = Name of the process
•![]() MemAllocated = Sum of all the dynamically allocated memory that this process has received from the system, including memory that may have been returned
MemAllocated = Sum of all the dynamically allocated memory that this process has received from the system, including memory that may have been returned
•![]() CPU Time (ms) = CPU time the process has used, in microseconds
CPU Time (ms) = CPU time the process has used, in microseconds
Step 2 ![]() Click Close to close the dialog box.
Click Close to close the dialog box.
Displaying System Status
To display system status from Device Manager, follow these steps:
Step 1 ![]() Choose Physical > System.
Choose Physical > System.
You see the System dialog box shown in Figure 6-2.
Figure 6-2 System Dialog Box

Step 2 ![]() Click Close to close the dialog box.
Click Close to close the dialog box.
Core and Log Files
This section contains the following topics:
Displaying Core Status

Note ![]() Be sure SSH2 is enabled on this switch.
Be sure SSH2 is enabled on this switch.
To display cores on a switch using Device Manager, follow these steps:
Step 1 ![]() Choose Admin > Show Cores.
Choose Admin > Show Cores.
You see the Show Cores dialog box shown in Figure 6-3.
Figure 6-3 Show Cores Dialog Box
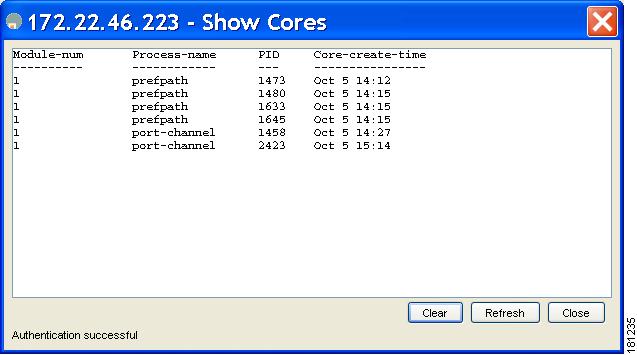
Module-num shows the slot number on which the core was generated. In this example, the fspf core was generated on the active supervisor module (slot 5), fcc was generated on the standby supervisor module (slot 6), and acltcam and fib were generated on the switching module (slot 8).
Step 2 ![]() Click Close to close the dialog box.
Click Close to close the dialog box.
Clearing the Core Directory
Note ![]() Be sure SSH2 is enabled on this switch.
Be sure SSH2 is enabled on this switch.
To clear the cores on a switch using Device Manager, follow these steps:
Step 1 ![]() Click Clear to clear the cores.
Click Clear to clear the cores.
The software keeps the last few cores per service and per slot and clears all other cores present on the active supervisor module.
Step 2 ![]() Click Close to close the dialog box.
Click Close to close the dialog box.
First and Last Core
The first and last core feature uses the limited system resource and retains the most important core files. Generally, the first core and the most recently generated core have the information for debugging and, the first and last core feature tries to retain the first and the last core information.
If the core files are generated from an active supervisor module, the number of core files for the service is defined in the service.conf file. There is no upper limit on the total number of core files in the active supervisor module.
Verifying First and Last Core Status
You can view specific information about the saved core files. Example 6-1 provides further details on saved core files.
Example 6-1 Regular Service on vdc 2 on Active Supervisor Module
There are five radius core files from vdc2 on the active supervisor module. The second and third oldest files are deleted to comply with the number of core files defined in the service.conf file.
switch# show cores vdc vdc2
VDC No Module-num Process-name PID Core-create-time
------ ---------- ------------ --- ----------------
2 5 radius 6100 Jan 29 01:47
2 5 radius 6101 Jan 29 01:55
2 5 radius 6102 Jan 29 01:55
2 5 radius 6103 Jan 29 01:55
2 5 radius 6104 Jan 29 01:57
switch# show cores vdc vdc2
VDC No Module-num Process-name PID Core-create-time
------ ---------- ------------ --- ----------------
2 5 radius 6100 Jan 29 01:47
2 5 radius 6103 Jan 29 01:55
2 5 radius 6104 Jan 29 01:57
Online System Health Management
The Online Health Management System (OHMS) (system health) is a hardware fault detection and recovery feature. It ensures the general health of switching, services, and supervisor modules in any switch in the Cisco MDS 9000 Family.
This section includes the following topics:
•![]() Performing Internal Loopback Tests
Performing Internal Loopback Tests
•![]() Performing External Loopback Tests
Performing External Loopback Tests
About OHMS
The OHMS monitors system hardware in the following ways:
•![]() The OHMS component running on the active supervisor maintains control over all other OHMS components running on the other modules in the switch.
The OHMS component running on the active supervisor maintains control over all other OHMS components running on the other modules in the switch.
•![]() The system health application running in the standby supervisor module only monitors the standby supervisor module, if that module is available in the HA standby mode.
The system health application running in the standby supervisor module only monitors the standby supervisor module, if that module is available in the HA standby mode.
The OHMS application launches a daemon process in all modules and runs multiple tests on each module to test individual module components. The tests run at preconfigured intervals, cover all major fault points, and isolate any failing component in the MDS switch. The OHMS running on the active supervisor maintains control over all other OHMS components running on all other modules in the switch.
On detecting a fault, the system health application attempts the following recovery actions:
•![]() Performs additional testing to isolate the faulty component.
Performs additional testing to isolate the faulty component.
•![]() Attempts to reconfigure the component by retrieving its configuration information from persistent storage.
Attempts to reconfigure the component by retrieving its configuration information from persistent storage.
•![]() If unable to recover, sends Call Home notifications, system messages and exception logs; and shuts down and discontinues testing the failed module or component (such as an interface).
If unable to recover, sends Call Home notifications, system messages and exception logs; and shuts down and discontinues testing the failed module or component (such as an interface).
•![]() Sends Call Home and system messages and exception logs as soon as it detects a failure.
Sends Call Home and system messages and exception logs as soon as it detects a failure.
•![]() Shuts down the failing module or component (such as an interface).
Shuts down the failing module or component (such as an interface).
•![]() Isolates failed ports from further testing.
Isolates failed ports from further testing.
•![]() Reports the failure to the appropriate software component.
Reports the failure to the appropriate software component.
•![]() Switches to the standby supervisor module, if an error is detected on the active supervisor module and a standby supervisor module exists in the Cisco MDS switch. After the switchover, the new active supervisor module restarts the active supervisor tests.
Switches to the standby supervisor module, if an error is detected on the active supervisor module and a standby supervisor module exists in the Cisco MDS switch. After the switchover, the new active supervisor module restarts the active supervisor tests.
•![]() Reloads the switch if a standby supervisor module does not exist in the switch.
Reloads the switch if a standby supervisor module does not exist in the switch.
•![]() Provides CLI support to view, test, and obtain test run statistics or change the system health test configuration on the switch.
Provides CLI support to view, test, and obtain test run statistics or change the system health test configuration on the switch.
•![]() Performs tests to focus on the problem area.
Performs tests to focus on the problem area.
Each module is configured to run the test relevant to that module. You can change the default parameters of the test in each module as required.
Performing Internal Loopback Tests
You can run manual loopback tests to identify hardware errors in the data path in the switching or services modules, and the control path in the supervisor modules. Internal loopback tests send and receive FC2 frames to and from the same ports and provide the round-trip time taken in microseconds. These tests are available for Fibre Channel, IPS, and iSCSI interfaces.
Choose Interface > Diagnostics > Internal to perform an internal loopback test from Device Manager.
Performing External Loopback Tests
You can run manual loopback tests to identify hardware errors in the data path in the switching or services modules, and the control path in the supervisor modules. External loopback tests send and receive FC2 frames to and from the same port or between two ports.
You need to connect a cable (or a plug) to loop the Rx port to the Tx port before running the test. If you are testing to and from the same port, you need a special loop cable. If you are testing to and from different ports, you can use a regular cable. This test is only available for Fibre Channel interfaces.
Choose Interface > Diagnostics > External to perform an external loopback test from Device Manager.
Default Settings
Table 6-1 lists the default system health and log settings.
|
|
|
|---|---|
Kernel core generation |
One module |
System health |
Enabled |
Loopback frequency |
5 seconds |
Failure action |
Enabled |
 Feedback