Configurar rastreamentos e coletar registros UCCE
Opções de download
Linguagem imparcial
O conjunto de documentação deste produto faz o possível para usar uma linguagem imparcial. Para os fins deste conjunto de documentação, a imparcialidade é definida como uma linguagem que não implica em discriminação baseada em idade, deficiência, gênero, identidade racial, identidade étnica, orientação sexual, status socioeconômico e interseccionalidade. Pode haver exceções na documentação devido à linguagem codificada nas interfaces de usuário do software do produto, linguagem usada com base na documentação de RFP ou linguagem usada por um produto de terceiros referenciado. Saiba mais sobre como a Cisco está usando a linguagem inclusiva.
Sobre esta tradução
A Cisco traduziu este documento com a ajuda de tecnologias de tradução automática e humana para oferecer conteúdo de suporte aos seus usuários no seu próprio idioma, independentemente da localização. Observe que mesmo a melhor tradução automática não será tão precisa quanto as realizadas por um tradutor profissional. A Cisco Systems, Inc. não se responsabiliza pela precisão destas traduções e recomenda que o documento original em inglês (link fornecido) seja sempre consultado.
Contents
Introduction
Este documento descreve como definir rastreamentos nos gateways Cisco UCCE, Finesse, Customer Voice Portal (CVP), UCCE Outbound Dialer e Cisco.
Prerequisites
Requirements
A Cisco recomenda o conhecimento destes tópicos:
- Cisco Unified Contact Center Enterprise (UCCE)
- Central de Contatos em Pacotes Corporativa (PCCE)
- Cisco Finesse
- Cisco Customer Voice Portal (CVP)
- Cisco Virtualized Voice Browser (CVB)
- Cisco Unified Border Element (CUBE)
- Proxy Cisco Unified Session Initiation Protocol (SIP) (CUSP)
Componentes Utilizados
As informações neste documento são baseadas nestas versões de software:
- Cisco Finesse 11.5
- Servidor CVP 11.5
- Unified Contact Center Enterprise (UCCE) 11.5
- Cisco Virtualized Voice Browser 11.5
Este documento descreve como definir rastreamentos no Cisco Unified Contact Center Enterprise (UCCE), Cisco Finesse, Cisco Customer Voice Portal (CVP), Cisco UCCE Outbound Dialer e gateways Cisco.
The information in this document was created from the devices in a specific lab environment. All of the devices used in this document started with a cleared (default) configuration. Se a rede estiver ativa, certifique-se de que você entenda o impacto potencial de qualquer comando.
Definições de Rastreamento e Finesse de Coleta de Log
Cliente Finesse
Há várias opções para coletar logs do cliente Finesse.
Opção 1: Colete logs do cliente com o Relatório de erros de envio.
Etapa 1. Fazer logon de um agente.
Etapa 2. Se um agente tiver algum problema durante uma chamada ou evento de mídia, instrua-o a clicar no link Enviar relatório de erros no canto inferior direito da área de trabalho do finesse.

Etapa 3. O agente vê a mensagem Logs enviados com êxito!.
Etapa 4. Os logs do cliente são enviados ao servidor Finesse. Navegue até https://x.x.x.x/finesse/logs e faça login com uma conta de administração.
Etapa 5. Colete os logs no diretório clientlogs/. 
Opção 2: Definir registro persistente
Etapa 1. Navegue até https://x.x.x.x:8445/desktop/locallog.
Etapa 2. Clique Em Iniciar Sessão Com Registro Persistente.

Etapa 3. A página de logon do Cisco Finesse Agent Desktop é aberta. Faça logon do agente.

Etapa 4. Toda a interação do Agent Desktop é registrada e enviada aos logs de armazenamento local. Para coletar os logs, navegue até https://x.x.x.x:8445/desktop/locallog e copie o conteúdo em um arquivo de texto. Salve o arquivo para análise posterior.
.
Observação: existe uma advertência relacionada ao Log Persistente. Depois que o log persistente é habilitado, as informações não são enviadas aos logs de armazenamento local. ID de bug da Cisco CSCvf93030  - O registro persistente não consegue capturar registros. Finesse 11.5(1) ES-2 em diante. Para obter mais informações sobre essa advertência e as etapas para corrigi-la, visite
Opção 3: Console do navegador da Web
Etapa 1. Depois que um agente fizer logon, pressione F12 para abrir o console do navegador.
Etapa 2. Selecione a guia Console.
Etapa 3.Verifique os erros no console do navegador. Copie o conteúdo em um arquivo de texto e salve-o.

Etapa 4. Selecione a guia Rede e marque a opção Preservar registro.
Etapa 5. Clique com o botão direito do mouse em qualquer evento de nome de rede e selecione Salvar como HAR com conteúdo.

Servidor Finesse
Opção 1: Através da interface do usuário (UI) - serviços da Web (obrigatórios) e registros adicionais
Etapa 1. Navegue até https://x.x.x.x/finesse/logs e faça login com a conta de administração.
Etapa 2. Expanda o diretório webservices/

Etapa 3. Colete os últimos logs do serviço Web. Selecione o último arquivo unzip. Por Exemplo, Desktop-Webservices.201X-.log.zip. Clique no link do arquivo e você verá a opção para salvar o arquivo.


Etapa 4. Colete os outros logs necessários (dependendo do cenário). Por exemplo, o openfire para problemas de serviço de notificação, logs de realm para problemas de autenticação e logs de tomate para problemas de APIs.
Observação: o método recomendado para coletar os logs do servidor Cisco Finesse é via Secure Shell (SSH) e Secure File Transfer Protocol (SFTP). Esse método não só permite que você colete os logs de serviços da Web, mas também todos os logs adicionais como, Fippa, openfire, Realm e Clientlogs.
Opção 2: via SSH e SFTP (Secure File Transfer Protocol) - Opção recomendada
Etapa 1. Faça login no servidor Finesse com o Secure Shell (SSH).
Etapa 2. Insira este comando para coletar os logs necessários. Os logs são compactados e têm um tempo relativo de 2 horas. Você é solicitado a identificar o servidor SFTP no qual os logs são carregados.
arquivo obter ativelog desktop recurs compress reltime horas 2.

Etapa 3. Esses logs são armazenados no caminho do servidor SFTP: <endereço IP>\<carimbo de data/hora>\ative_nnn.tgz , onde nnn é carimbo de data/hora em formato longo.
Etapa 4. Para coletar logs adicionais, como tomcat, serviço de contexto, Servm e logs de instalação, consulte a seção Coleta de logs do Guia de Administração do Cisco Finesse
Guia de administração do Cisco Finesse versão 11.5(1)
Observação: para obter mais informações sobre o SFTP para arquivos de transferência Finesse, visite este documento Finesse Backup and Upgrade Configuration with SFTP
CVP e CVB de configurações de rastreamento e coleta de logs
Servidor de chamadas CVP
O nível padrão de rastreamentos do CVP CallServer é suficiente para solucionar a maioria dos casos. No entanto, quando você precisa obter mais detalhes sobre as mensagens do Session Initiation Protocol (SIP), você precisa definir os rastreamentos de pilha SIP para o nível DEBUG
Etapa 1. Navegue até a URL da página da Web CVP CallServer Diag http://cvp.cc.lab:8000/cvp/diag.
Observação: esta página fornece boas informações sobre o CVP CallServer e é muito útil para solucionar determinados cenários.
Etapa 2. Selecione com.dynamicsoft.DsLibs.DsUALibs no Serv. menu suspenso Mgr no canto superior esquerdo

Etapa 3. Clique no botão Definir.


Etapa 4. Role para baixo na janela de rastreamento para garantir que o nível de rastreamentos tenha sido definido corretamente. Estas são suas configurações de depuração.

Etapa 5. Ao reproduzir o problema, colete os logs de C:\Cisco\CVP\logs e selecione o arquivo de log do CVP com base na hora em que o problema ocorreu.

Aplicativo CVP Voice XML (VXML)
Em circunstâncias muito raras, você precisa aumentar o nível de rastreamentos dos aplicativos do servidor VXML. Por outro lado, não é recomendável aumentá-lo, a menos que um engenheiro da Cisco solicite.
Para coletar os logs de aplicativo do servidor VXML, navegue para o diretório de aplicativo específico no servidor VXML, por exemplo: C:\Cisco\CVP\VXMLServer\applications\{nome do aplicativo}\logs\ActivityLog\ e colete os logs de atividade

Portal de gerenciamento de operações e administração (OAMP) do CVP
Na maioria dos casos, o nível padrão de rastreamentos de OAMP e ORM é suficiente para determinar a causa raiz do problema. No entanto, se o nível de rastreamentos precisar ser aumentado, estas são as etapas para executar esta ação:
Etapa 2. Edite %CVP_HOME%\conf\oamp.properties
omgr.traceMask=-1
omgr.logLevel=DEBUG
org.hibernate.logLevel=DEPURAÇÃO
org.apache.logLevel=ERRO
net.sf.ehcache.logLevel=ERRO
Etapa 3. Reinicie o OPSConsoleServer.
Informações do nível de rastreamento
| Nível de Rastreamento |
Descrição |
Nível de log |
Máscara de Rastreamento |
| 0 |
Instalação padrão do produto. Não tem impacto no desempenho ou tem impacto mínimo. |
INFORMAÇÕES |
Nenhum |
| 1 |
Mensagens de rastreamento menos detalhadas com um pequeno impacto no desempenho. |
DEBUG |
DEVICE_CONFIGURATION + |
| 2 |
Mensagens de rastreamento detalhadas com impacto médio no desempenho. |
DEBUG |
DEVICE_CONFIGURATION + |
| 3 |
Mensagem de rastreamento detalhada com alto impacto no desempenho. |
DEBUG |
DEVICE_CONFIGURATION + |
| 4 |
Mensagem de rastreamento detalhada com um impacto de desempenho muito alto. |
DEBUG |
DIVERSOS + |
| 5 |
Mensagem de rastreamento mais detalhada. |
DEBUG |
DIVERSOS + |
Cisco Virtualized Voice Browser (CVB)
No CVB, um arquivo de rastreamento é um arquivo de registro que registra a atividade dos subsistemas e etapas do componente do Cisco VB.
O Cisco VVB tem dois componentes principais:
- Rastreamentos de "administração" do Cisco VB denominados logs MADM
- Rastreamentos de "mecanismo" do Cisco VB denominados logs MIVR
Você pode especificar os componentes para os quais deseja coletar informações e o nível de informações que deseja coletar.
Os níveis de log se estendem de:
Depuração - Detalhes básicos do fluxo para
XDebugging 5 - Nível detalhado com rastreamento de pilha

Aviso: Xdebugging5 não deve ser habilitado no sistema carregado de produção
Os logs mais comuns que você precisa coletar são o Mecanismo do . O nível padrão de rastreamentos para os rastreamentos do Mecanismo CVB é suficiente para solucionar a maioria dos problemas. No entanto, se você precisar alterar o nível de rastreamentos para um cenário específico, a Cisco recomenda que você use os Perfis de log do sistema predefinidos
| Perfis de log do sistema |
|
| Nome |
Cenário no qual este perfil deve ser ativado |
| VBpadrão |
Logs genéricos estão habilitados. |
| AppAdminVB |
Para problemas com a administração da Web através do AppAdmin, Cisco VB Serviceability e outras páginas da Web. |
| MídiaVB |
Para problemas com a configuração ou transmissão de mídia. |
| VoiceBrowserVB |
Para problemas com o tratamento de chamadas. |
| MRCPVB |
Para problemas com ASR/TTS com interação Cisco VVB. |
| ControleChamadaVVB |
Para problemas com a sinalização SIP relacionada, são publicados no registro. |
Etapa 1. Abra a página principal do CVB (https://X.X.X.X/uccxservice/main.htm), navegue até a página Cisco VVB Serviceability e faça login com a conta de administração

Etapa 2. Selecione Rastrear -> Perfil

Etapa 3. Marque o perfil que você deseja ativar para o cenário específico e clique no botão Ativar. Por exemplo, habilite o perfil CallControlVVB para problemas relacionados ao SIP ou MRCPVB para problemas relacionados à interação Automatic Speech Recognition and Text to Speech (ASR/TTS).
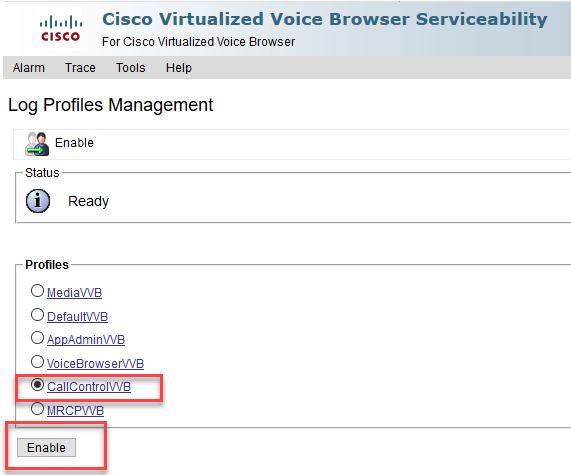
Você verá a mensagem de êxito depois de clicar no botão de ativação.

Etapa 4. Depois que o problema for reproduzido, colete os logs. Use a Real Time Monitor Tool (RTMT) que acompanha o CVB para coletar os logs.
Etapa 5. Clique no ícone Cisco Unified Real-Time Monitoring Tool em sua área de trabalho ( Se você já tiver feito o download dessa ferramenta no CVB)

Etapa 6. Forneça o endereço IP do VVB e clique em OK.

Passo 7. Aceite as informações do certificado, se exibidas.

Etapa 8. Forneça a credencial e clique em OK.

Etapa 9. Se você receber um Aviso de incompatibilidade de fuso horário, clique em SIM e continue.

Etapa 10. Se você recebeu o erro TimeZone, o RTMT possivelmente fecha depois que você clica no botão Yes (Sim). Reinicie a ferramenta RTMT.
Etapa 11. Deixe a configuração padrão selecionada e clique em OK

Etapa 12. Selecione Trace & Log Central e clique duas vezes em Coletar Arquivos

Etapa 13. Na nova janela aberta, selecione o Mecanismo e clique em Avançar

Etapa 14. Clique em Avançar novamente na próxima janela

Etapa 15. Selecione Intervalo relativo e certifique-se de selecionar o horário para cobrir o horário da chamada ruim

Etapa 16. Em Download File Options (Opções de download de arquivo), clique em Browse (Procurar) e selecione o diretório no qual deseja salvar o arquivo e clique em Open (Abrir)

Etapa 14. Quando tudo estiver selecionado, clique no botão Concluir

Etapa 15. Coleta os arquivos de log. Aguarde até ver a mensagem de confirmação no RTMT

Etapa 16. Navegue até a pasta onde os rastreamentos são salvos.
Etapa 17. Os registros do mecanismo são tudo o que é necessário. Para localizá-los, navegue até a pasta \<carimbo de data/hora>\uccx\log\MIVR.
Configurações de rastreamento e coleta de log para CUBE e CUSP
CUBE (SIP)
Etapa 1. Definir o carimbo de data/hora dos logs e habilitar o buffer de registro
#conf  t
service timestamps debug datetime msec
service timestamps log datetime msec
service sequence-numbers
no logging console
no logging monitor
logging buffered 5000000 7
end
clear logging
Aviso: qualquer alteração em um GW de produção do software Cisco IOS® pode causar uma interrupção.
Esta é uma plataforma muito robusta que pode manipular as depurações sugeridas no volume de chamada fornecido sem problemas. No entanto, a Cisco recomenda que você:
- Enviar todos os logs para um servidor syslog em vez de para o buffer de registro:
logging <syslog server ip>
logging trap debugs - Aplique os comandos debug um de cada vez e verifique a utilização da CPU após cada um:
show proc cpu hist
Aviso: se a CPU obtiver de 70 a 80% de utilização, o risco de um impacto no serviço relacionado ao desempenho será muito maior. Portanto, não habilite depurações adicionais se o GW atingir 60%
Etapa 2. Ative estas depurações:
debug voip ccapi inout
debug ccsip mess
After you make the call and simulate the issue, stop the debugging:
#undebug all
term len 0
show ver
show run
show log
CUSP
Etapa 1. Ative os rastreamentos SIP no CUSP.
(cusp)> config
(cusp-config)> sip logging
(cusp)> trace enable
(cusp)> trace level debug component sip-wire
Etapa 2. Reproduza o problema.
Etapa 3. Desative o logoff depois de terminar.
Colete os logs.
Etapa 1. Configure um usuário no CUSP (por exemplo, teste).
Etapa 2. Adicione essa configuração no prompt do CUSP.
username <userid> create
username <userid> password <password>
username <userid> group pfs-privusers
Etapa 3. Faça FTP para o endereço IP do CUSP. Use o nome de usuário (teste) e a senha conforme definido na etapa anterior.
Etapa 4. Altere os diretórios para /cusp/log/trace.
Etapa 5. Obtenha o log_<filename>.
Configurações de Rastreamento e Coleta de Log UCCE
A Cisco recomenda definir níveis de rastreamento e coletar rastreamentos por meio do Diagnostics Framework Portico ou das ferramentas CLI do sistema
Observação: para obter mais informações sobre o Diagnostic Framework Portico e o System CLI, visite o capítulo Ferramentas de diagnóstico no Guia de manutenção do Cisco Unified ICM/Contact Center Enterprise, Versão 11.5(1).
Ao Troubleshoot a maioria dos cenários de UCCE, se o nível padrão de rastreamentos não fornecer informações suficientes, defina o nível de rastreamentos como 3 nos componentes necessários (com algumas exceções).
Observação: Visite a seção Nível de Rastreamento no Guia de Manutenção do Cisco Unified ICM/Contact Center Enterprise, Versão 11.5(1) para obter mais informações.
Por exemplo, ao solucionar problemas do Outbound Dialer, defina o nível de rastreamentos como 2 se o Dialer estiver ocupado.
Para CTISVR (CTISVR), o nível 2 e o nível 3 não definem o nível exato de registro recomendado pela Cisco. O registro de rastreamento recomendado para CTISVR é 0XF8.
Etapa 1. No UCCE Agent PG, abra o Editor do Registro (Regedit).
Etapa 2. Navegue até HKLM\software\Cisco Systems, Inc\icm\<cust_inst>\CG1(a e b)\EMS\CurrentVersion\library\Processes\ctisvr.

Etapa 3.Clique duas vezes em EMSTraceMask e defina o valor como f8.

Etapa 4. Clique em Ok e feche o Editor do Registro


Etapa 3. Na janela SetTraceLevel, selecione o componente e o nível.

Etapa 4. Clique em Submit. Quando terminar, você verá a mensagem Ok.

Aviso: defina o nível de rastreamentos para o nível 3 enquanto participa para reproduzir o problema. Depois que o problema for reproduzido, defina o nível de rastreamento como padrão. Tome cuidado especial ao definir os rastreamentos JTAPIGW, já que os níveis 2 e 3 definem os rastreamentos de baixo nível e isso pode causar um impacto no desempenho. Defina o Nível 2 ou o Nível 3 no JTAPIGW durante o tempo de não produção ou em um ambiente de laboratório.


Configurações de Rastreamento e Coleta de Log PCCE
O PCCE tem sua própria ferramenta para configurar níveis de rastreamento. Não é aplicável ao ambiente UCCE, onde o Diagnostic Framework Portico ou o CLI do sistema são as maneiras preferidas de ativar e coletar logs.
Etapa 1. No servidor PCCE AW, abra a ferramenta Unified CCE Web Administration e faça login com a conta de administrador.

Etapa 2. Navegue até Sistema ->Coleta de logs.

Etapa 3. A página Coleta de logs é aberta.
Etapa 4. Clique em , Níveis de rastreamento, uma caixa de diálogo pop-up será carregada

Etapa 5. Defina trace Level (Nível de rastreamento) como Detailed (Detalhado) no CCE, deixe-o como No Change (Sem alteração) para CM, CVP. E clique em Atualizar níveis de rastreamento

Etapa 6. Clique em Sim para confirmar o Aviso.

Passo 7. Depois que o problema for reproduzido, abra o Unified CCE Administration e navegue de volta para Sistema -> Coleta de logs.
Etapa 8. Selecione CCE e CVP no painel Componentes.
Etapa 9. Selecione o Tempo de Coleta de Log apropriado (o padrão são os últimos 30min).

Observação: Atualize a página para a Hora de Término para atualizar com a hora atual
Etapa 10. Clique em Collect Logs (Coletar logs) e em Yes (Sim) para o aviso da caixa de diálogo. A coleta de logs é iniciada. Aguarde alguns minutos antes que termine.

Etapa 11. Quando terminar, clique no botão Download na coluna Ações para fazer o download de um arquivo zipado com todos os logs contidos nele. Salve o arquivo zip em qualquer local que achar apropriado.
Histórico de revisões
| Revisão | Data de publicação | Comentários |
|---|---|---|
3.0 |
23-Mar-2023 |
Recertificação |
1.0 |
14-Jan-2018 |
Versão inicial |
Colaborado por engenheiros da Cisco
- Ramiro AmayaEngenheiro do Cisco TAC
- Anuj BhatiaEngenheiro do Cisco TAC
 Feedback
Contate a Cisco
- Abrir um caso de suporte

- (É necessário um Contrato de Serviço da Cisco)