在Catalyst 9800上使用Telegraf、InfluenceDB和Grafana配置高级gRPC工作流程
下载选项
非歧视性语言
此产品的文档集力求使用非歧视性语言。在本文档集中,非歧视性语言是指不隐含针对年龄、残障、性别、种族身份、族群身份、性取向、社会经济地位和交叉性的歧视的语言。由于产品软件的用户界面中使用的硬编码语言、基于 RFP 文档使用的语言或引用的第三方产品使用的语言,文档中可能无法确保完全使用非歧视性语言。 深入了解思科如何使用包容性语言。
关于此翻译
思科采用人工翻译与机器翻译相结合的方式将此文档翻译成不同语言,希望全球的用户都能通过各自的语言得到支持性的内容。 请注意:即使是最好的机器翻译,其准确度也不及专业翻译人员的水平。 Cisco Systems, Inc. 对于翻译的准确性不承担任何责任,并建议您总是参考英文原始文档(已提供链接)。
简介
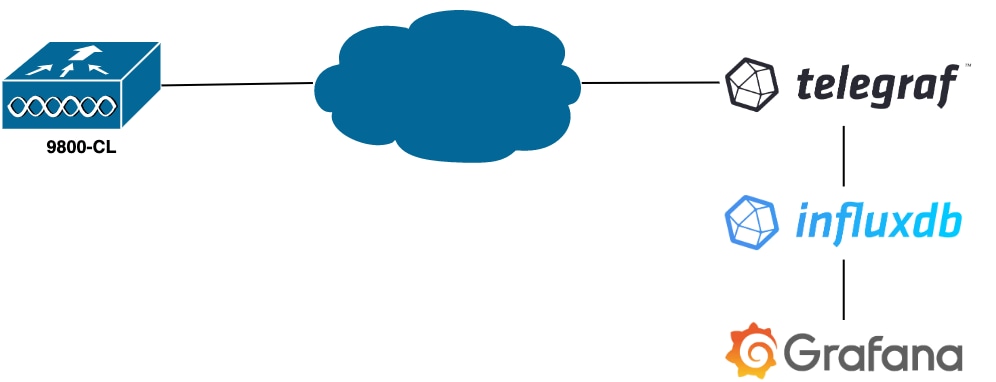
本文档介绍如何部署Telegraf、InfluenceDB和Grafana (TIG)堆栈以及如何将其与Catalyst 9800互联。
先决条件
本文档通过复杂的集成演示Catalyst 9800的编程接口功能。本文档旨在展示如何根据任何需求完全定制这些功能,以及如何节省日常时间。此处显示的部署依赖于gRPC,并提供遥测配置,以便在任何Telegraf、IncusionDB、Grafana (TIG)可观察堆栈中提供Catalyst 9800的无线数据。
要求
Cisco 建议您了解以下主题:
- Catalyst Wireless 9800配置型号。
- 网络可编程性和数据模型。
- TIG堆栈基础知识。
使用的组件
本文档中的信息基于以下软件和硬件版本:
- Catalyst 9800-CL (v. 17.12.03)。
- Ubuntu (v. 22.04.03)。
- InfluenceDB (v. 1.06.07)。
- Telegraf (v. 1.21.04)。
- Grafana (v. 10.02.01)。
本文档中的信息都是基于特定实验室环境中的设备编写的。本文档中使用的所有设备最初均采用原始(默认)配置。如果您的网络处于活动状态,请确保您了解所有命令的潜在影响。
配置
网络图
配置
在本示例中,使用gRPC拨出,在9800-CL上配置遥测,以便将存储信息的Telegraf应用上的信息推送到ConfusionDB数据库中。这里使用了两个设备,
- 托管整个TIG堆栈的Ubuntu服务器。
- Catalyst 9800-CL。
本配置指南并不侧重于这些设备的整个部署,而是侧重于每个应用上为正确发送、接收和提供9800信息所需的配置。
步骤1:准备数据库
在进入配置部分之前,请确保您的Infusion实例运行正常。使用Linux发行版时,可以使用systemctl status命令方便地完成此操作。
admin@tig:~$ systemctl status influxd
● influxdb.service - InfluxDB is an open-source, distributed, time series database
     Loaded: loaded (/lib/systemd/system/influxdb.service; enabled; vendor preset: enabled)
     Active: active (running) since Wed 2023-06-14 13:06:18 UTC; 2 weeks 5 days ago
       Docs: https://docs.influxdata.com/influxdb/
   Main PID: 733 (influxd)
      Tasks: 15 (limit: 19180)
     Memory: 4.2G
        CPU: 1h 28min 47.366s
     CGroup: /system.slice/influxdb.service
             └─733 /usr/bin/influxd -config /etc/influxdb/influxdb.conf
例如,Telegraf需要一个数据库来存储度量,还需要一个用户连接到该数据库。可以使用以下命令从IncusionDB CLI轻松创建这些命令:
admin@tig:~$ influx
Connected to http://localhost:8086 version 1.8.10
InfluxDB shell version: 1.8.10
> create database TELEGRAF
> create user telegraf with password 'YOUR_PASSWORD'
现在创建的数据库可以配置Telegraf以将度量正确存储到其中。
第二步:准备电报
本示例中只有两个值得关注的电话配置有效。这些可以通过/etc/telegraf/telegraf.conf配置文件(对运行在Unix上的应用程序照常如此)实现。
第一个命令声明Telegraf使用的输出。如上所述,此处使用InfluenceDB,并在telegraf.conf文件输出部分进行如下配置:
###############################################################################
#                            OUTPUT PLUGINS                                   #
###############################################################################
# Output Plugin InfluxDB
[[outputs.influxdb]]
## The full HTTP or UDP URL for your InfluxDB instance.
#   ##
#   ## Multiple URLs can be specified for a single cluster, only ONE of the
#   ## urls will be written to each interval.
  urls = [ "http://127.0.0.1:8086" ]
#   ## The target database for metrics; will be created as needed.
#   ## For UDP url endpoint database needs to be configured on server side.
  database = "TELEGRAF"
#   ## HTTP Basic Auth
  username = "telegraf"
  password = "YOUR_PASSWORD"
这指示Telegraf进程将其接收到的数据存储在端口8086上运行于同一主机上的InfusionDB中,并使用名为“TELEGRAF”的数据库(以及访问它的凭证telegraf/YOUR_PASSWORD)。
如果第一个声明的内容是输出格式,那么第二个当然是输入格式。要通知Telegraf,它收到的数据来自使用遥测技术的思科设备,您可以使用cisco_telemetry_mdt”输入模块。要配置此功能,您只需在/etc/telegraf/telegraf.conf文件中添加以下行:
###############################################################################
#                             INPUT PLUGINS                                   #
###############################################################################
# # Cisco model-driven telemetry (MDT) input plugin for IOS XR, IOS XE and NX-OS platforms
[[inputs.cisco_telemetry_mdt]]
#  ## Telemetry transport can be "tcp" or "grpc".  TLS is only supported when
#  ## using the grpc transport.
    transport = "grpc"
#
#  ## Address and port to host telemetry listener
    service_address = ":57000"
#  ## Define aliases to map telemetry encoding paths to simple measurement names
[inputs.cisco_telemetry_mdt.aliases]
    ifstats = "ietf-interfaces:interfaces-state/interface/statistics"
这使主机上运行的Telegraf应用程序(默认端口57000)能够解码从WLC收到的数据。
保存配置后,请务必重新启动Telegraf以将其应用于服务。还要确保服务已正确重新启动:
admin@tig:~$ sudo systemctl restart telegraf
admin@tig:~$ systemctl status telegraf.service
● telegraf.service - Telegraf
     Loaded: loaded (/lib/systemd/system/telegraf.service; enabled; vendor preset: enabled)
     Active: active (running) since Mon 2023-07-03 17:12:49 UTC; 2min 18s ago
       Docs: https://github.com/influxdata/telegraf
   Main PID: 110182 (telegraf)
      Tasks: 10 (limit: 19180)
     Memory: 47.6M
        CPU: 614ms
     CGroup: /system.slice/telegraf.service
             └─110182 /usr/bin/telegraf -config /etc/telegraf/telegraf.conf -config-directory /etc/telegraf/telegraf.d
第三步:确定包含所需度量的遥测订阅
如上所述,在思科设备和许多其他设备上,度量是按照YANG模型组织的。可以在此处找到每个版本的IOS XE(用于9800)的特定Cisco YANG型号,特别是本示例中使用的用于IOS XE Dublin 17.12.03的型号。
在本例中,我们侧重于从使用的9800-CL实例收集CPU利用率指标。通过检查Cisco IOS XE Dublin 17.12.03的YANG型号,可以确定哪个模块包含控制器的CPU使用率,尤其是在最近5秒内。它们是Cisco-IOS-XE-process-cpu-oper模块的一部分,位于cpu-utilization分组(叶5秒)下。
第四步:在控制器上启用NETCONF
gRPC拨出框架依赖于NETCONF以同样方式工作。因此,必须在9800上启用此功能,可通过运行以下命令来实现:
WLC(config)#netconf ssh
WLC(config)#netconf-yang
第五步:在控制器上配置遥测订阅
一旦根据YANG模型确定度量的XPaths(a.k.a,XML路径语言),就可以从9800 CLI轻松配置遥测订阅,以便开始将这些遥测流传输到步骤2中配置的Telegraf实例。这可以通过执行以下命令来完成:
WLC(config)#telemetry ietf subscription 101
WLC(config-mdt-subs)#encoding encode-kvgpb
WLC(config-mdt-subs)#filter xpath /process-cpu-ios-xe-oper:cpu-usage/cpu-utilization/five-seconds
WLC(config-mdt-subs)#source-address 10.48.39.130
WLC(config-mdt-subs)#stream yang-push
WLC(config-mdt-subs)#update-policy periodic 100
WLC(config-mdt-subs)#receiver ip address 10.48.39.98 57000 protocol grpc-tcp
在此代码块中,首先定义标识符为101的遥测订阅。订用标识符可以是<0-2147483647>之间的任何数字,只要它与其他订用不重叠。对于此订用,按以下顺序进行配置:
- 使用的编码方法,使用gRPC传输协议时,必须是kvGPB。
- 订用发送的度量的过滤器,是定义我们感兴趣的度量的XPath(若要知道,为
/process-cpu-ios-xe-oper:cpu-usage/cpu-utilization/five-seconds)。 - 控制器用于发送度量的源IP地址。
- 用于传递度量的流类型,在本例中为YANG Push IETF标准。
- 控制器在100秒内向用户发送数据所使用的频率。在这种情况下,配置为每秒定期发送更新。
- 接收方IP地址和端口号以及用于控制器与用户之间通信的协议。在本示例中,gRPC-TCP用于将度量发送到端口57000上的主机10.48.39.98。
第六步:配置Grafana数据源
现在,控制器开始向Telegraf发送数据,这些数据存储在TELEGRAF IncusionDB数据库中,是时候将Grafana配置为允许其浏览这些指标了。
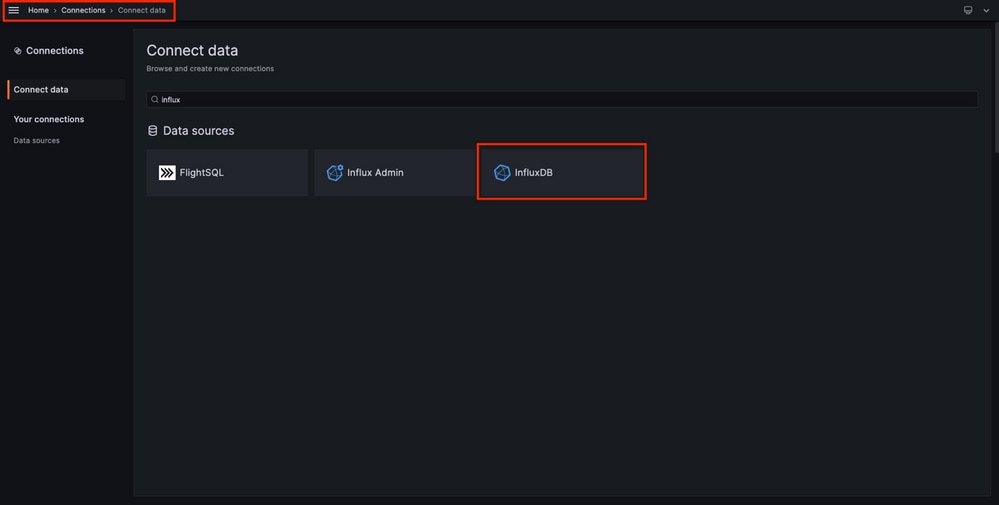
在Grafana GUI中,导航到Home > Connections > Connect data,然后使用搜索栏查找InfusionDB数据源。
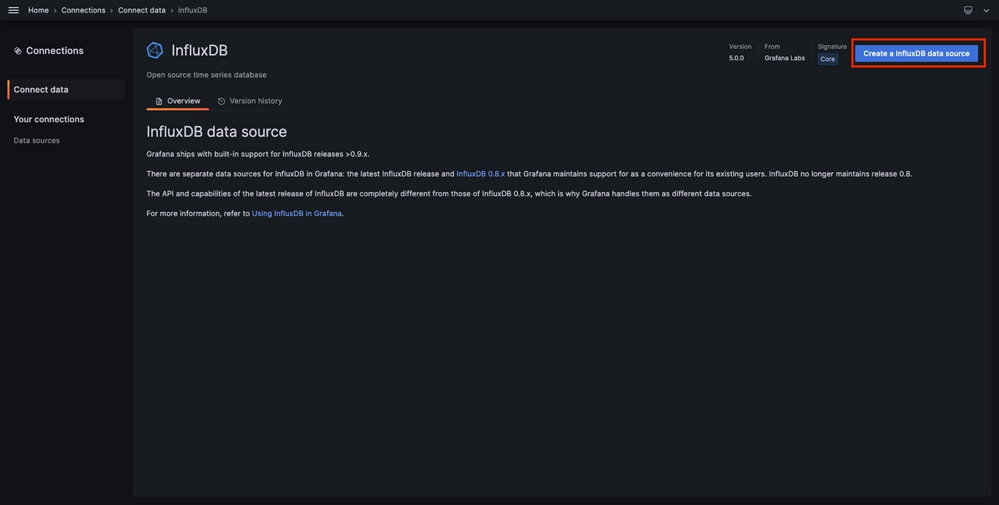
选择此数据源类型并使用“Create a InfluenceDB data source”按钮连接Grafana和在步骤1中创建的TELEGRAPH数据库。
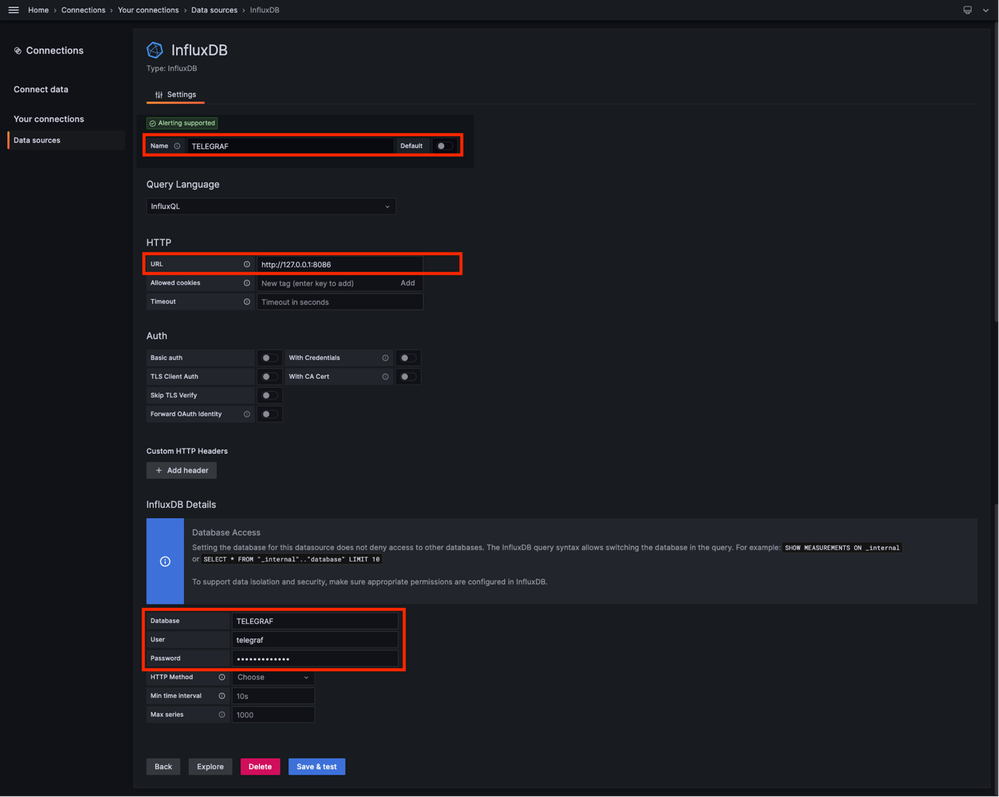
填写出现在屏幕上的表单,尤其是提供:
- 数据源的名称。
- 所用IncusionDB实例的URL。
- 使用的数据库名称(在本例中为“TELEGRAF”)。
- 用户定义的访问它的凭据(在本例中为telegraf/YOUR_PASSWORD)。
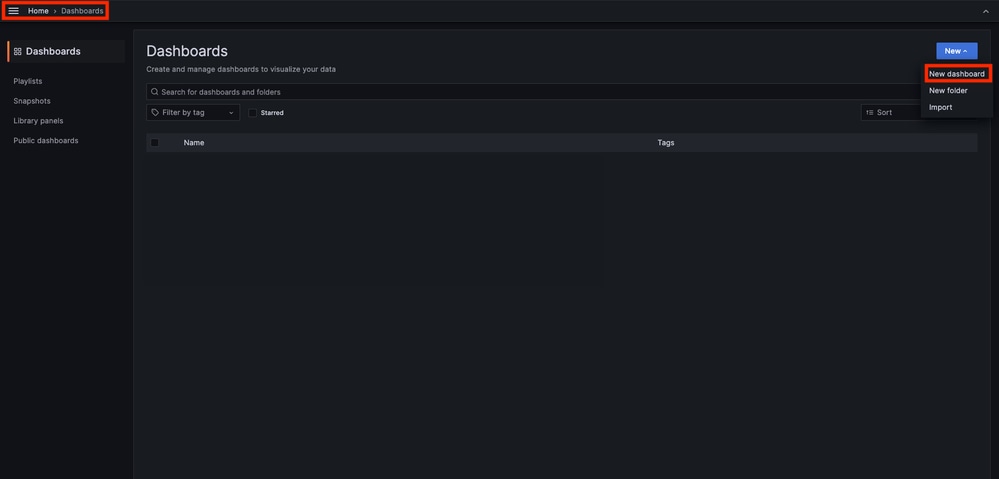
步骤 7.创建控制面板
Grafana可视化内容被组织到控制面板中。要创建包含Catalyst 9800指标可视化的控制面板,请导航到主页>控制面板,然后使用“新建控制面板”按钮
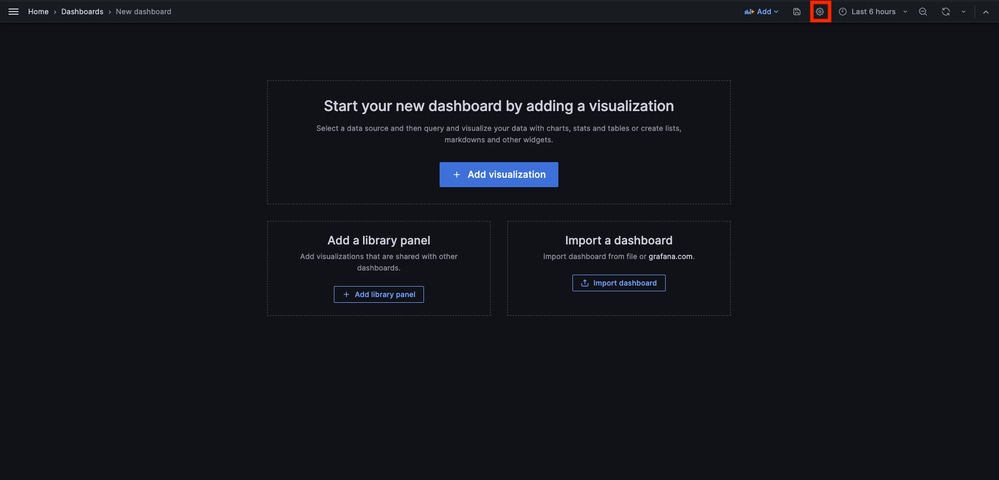
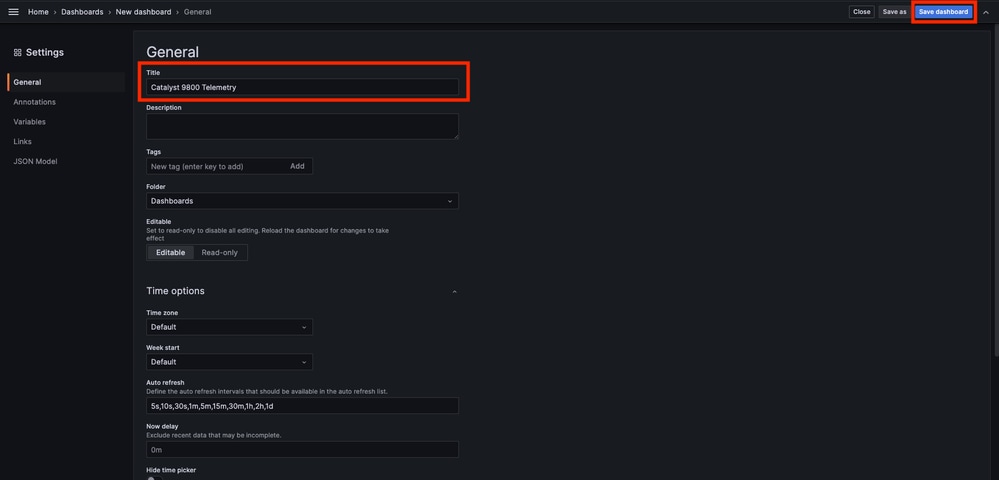
这将打开已创建的新控制面板。单击齿轮图标可访问操控板参数并更改其名称。在本例中,使用“Catalyst 9800遥测”。执行此操作后,请使用“保存控制面板”按钮保存控制面板。
步骤 8向仪表板添加可视化
现在,数据可以正确发送、接收和存储,而且Grafana可以访问该存储位置,因此,是时候为他们创建可视化界面了。
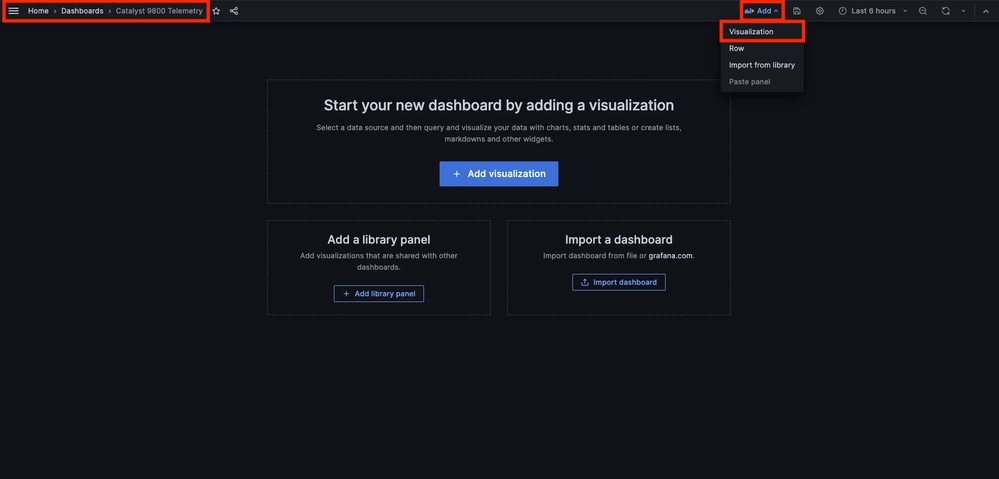
从任意Grafana控制面板中,使用“添加”按钮,并从显示的菜单中选择“可视化”以创建指标的可视化。
这将打开已创建可视化的Edit面板:
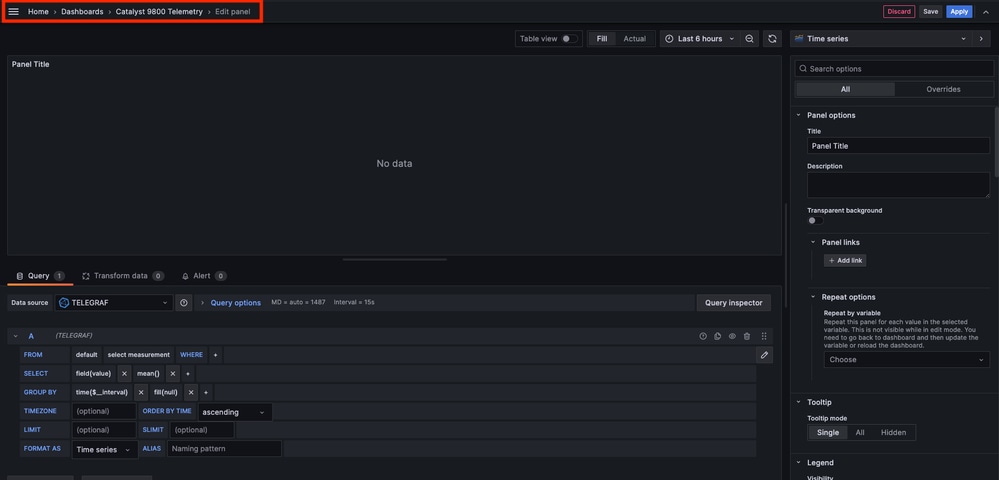
在此面板中选择
- 在步骤6中创建的数据源的名称,在本示例中为TELEGRAF。
- 包含要可视化的数据的度量(架构),在本例中为“Cisco-IOS-XE-process-cpu-oper:cpu-usage/cpu-utilization”。
- 表示要可视化的度量的数据库字段,在本例中为“five_seconds”。
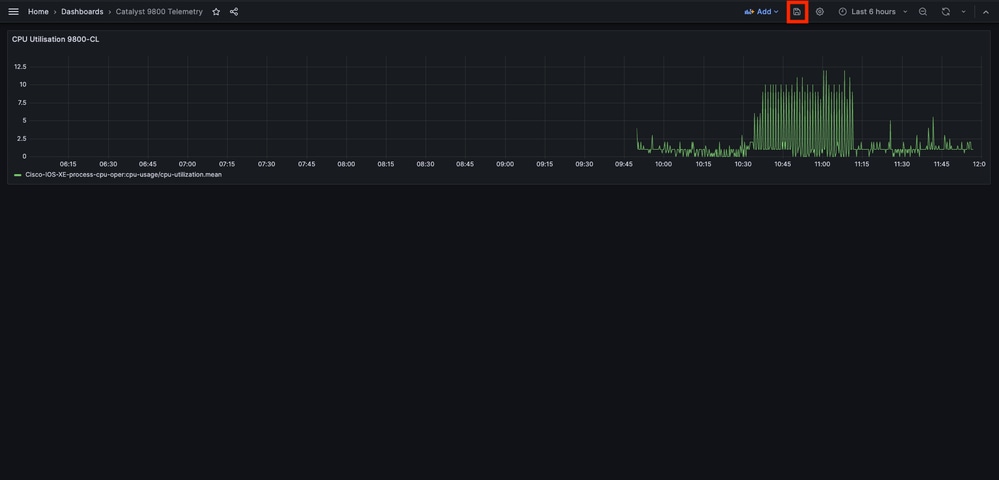
- 此示例中可视化内容的标题“CPU Utilization 9800-CL”。

一旦按下上一个图中的“保存/应用”按钮,显示Catalyst 9800控制器CPU使用率随时间的可视化信息就会被添加到控制面板中。使用软盘图标按钮可保存对控制面板所做的更改。
验证
WLC运行配置
Building configuration...
Current configuration : 112215 bytes
!
! Last configuration change at 14:28:36 UTC Thu May 23 2024 by admin
! NVRAM config last updated at 14:28:23 UTC Thu May 23 2024 by admin
!
version 17.12
[...]
aaa new-model
!
!
aaa authentication login default local
aaa authentication login local-auth local
aaa authentication dot1x default group radius
aaa authorization exec default local
aaa authorization network default group radius
[...]
vlan internal allocation policy ascending
!
vlan 39
!
vlan 1413
 name VLAN_1413
!
!
interface GigabitEthernet1
 switchport access vlan 1413
 negotiation auto
 no mop enabled
 no mop sysid
!
interface GigabitEthernet2
 switchport trunk allowed vlan 39,1413
 switchport mode trunk
 negotiation auto
 no mop enabled
 no mop sysid
!
interface Vlan1
 no ip address
 no ip proxy-arp
 no mop enabled
 no mop sysid
!
interface Vlan39
 ip address 10.48.39.130 255.255.255.0
 no ip proxy-arp
 no mop enabled
 no mop sysid
[...]
telemetry ietf subscription 101
 encoding encode-kvgpb
 filter xpath /process-cpu-ios-xe-oper:cpu-usage/cpu-utilization
 source-address 10.48.39.130
 stream yang-push
 update-policy periodic 1000
 receiver ip address 10.48.39.98 57000 protocol grpc-tcp
[...]
netconf-yang
电话配置
# Configuration for telegraf agent
[agent]
  metric_buffer_limit = 10000
  collection_jitter = "0s"
  debug = true
  quiet = false
  flush_jitter = "0s"
  hostname = ""
  omit_hostname = false

###############################################################################
#                            OUTPUT PLUGINS                                   #
###############################################################################
# Configuration for sending metrics to InfluxDB
[[outputs.influxdb]]
  urls = ["http://127.0.0.1:8086"]
  database = "TELEGRAF"
  username = "telegraf"
  password = "Wireless123#"

###############################################################################
#                            INPUT PLUGINS                                    #
###############################################################################

###############################################################################
#                            SERVICE INPUT PLUGINS                            #
###############################################################################
# # Cisco model-driven telemetry (MDT) input plugin for IOS XR, IOS XE and NX-OS platforms
[[inputs.cisco_telemetry_mdt]]
  transport = "grpc"
  service_address = "10.48.39.98:57000"
 [inputs.cisco_telemetry_mdt.aliases]
    ifstats = "ietf-interfaces:interfaces-state/interface/statistics"
ConfusionDB配置
### Welcome to the InfluxDB configuration file.
reporting-enabled = false
[meta]
  dir = "/var/lib/influxdb/meta"

[data]
  dir = "/var/lib/influxdb/data"
  wal-dir = "/var/lib/influxdb/wal"

[retention]
  enabled = true
  check-interval = "30m"
Grafana配置
#################################### Server ####################################
[server]
http_addr = 10.48.39.98
domain = 10.48.39.98
故障排除
WLC一站式反射
从WLC方面来看,首先要检验的是与编程接口相关的进程已启动并正在运行。
#show platform software yang-management process
confd : Running
nesd : Running
syncfd : Running
ncsshd : Running               <-- NETCONF / gRPC Dial-Out
dmiauthd : Running             <-- For all of them, Device Managment Interface needs to be up.
nginx : Running                <-- RESTCONF
ndbmand : Running
pubd : Running
gnmib : Running                <-- gNMI
对于NETCONF(由gRPC拨出),这些命令也可以帮助检查进程的状态。
WLC#show netconf-yang status
netconf-yang: enabled
netconf-yang candidate-datastore: disabled
netconf-yang side-effect-sync: enabled
netconf-yang ssh port: 830
netconf-yang turbocli: disabled
netconf-yang ssh hostkey algorithms: rsa-sha2-256,rsa-sha2-512,ssh-rsa
netconf-yang ssh encryption algorithms: aes128-ctr,aes192-ctr,aes256-ctr,aes128-cbc,aes256-cbc
netconf-yang ssh MAC algorithms: hmac-sha2-256,hmac-sha2-512,hmac-sha1
netconf-yang ssh KEX algorithms: diffie-hellman-group14-sha1,diffie-hellman-group14-sha256,ecdh-sha2-nistp256,ecdh-sha2-nistp384,ecdh-sha2-nistp521,diffie-hellman-group16-sha512
检查进程状态后,另一个重要检查是Catalyst 9800和Telegraf接收器之间的遥测连接状态。可使用“show telemetry connection all”命令查看该报告。
WLC#show telemetry connection all
Telemetry connections

Index Peer Address               Port  VRF Source Address             State      State Description
----- -------------------------- ----- --- -------------------------- ---------- --------------------
28851 10.48.39.98                57000 0   10.48.39.130               Active     Connection up
如果WLC和接收者之间的遥测连接正常,那么也可以使用show telemetry ietf subscription all brief命令保证配置的订阅有效。
WLC#show telemetry ietf subscription all brief
ID         Type       State      State Description
101 Configured Valid Subscription validated此命令的详细版本show telemetry ietf subscription all detail提供有关预订的更多信息,可帮助指出其配置中的问题。
WLC#show telemetry ietf subscription all detail
Telemetry subscription detail:

  Subscription ID: 101
  Type: Configured
  State: Valid
  Stream: yang-push
  Filter:
    Filter type: xpath
    XPath: /process-cpu-ios-xe-oper:cpu-usage/cpu-utilization
  Update policy:
    Update Trigger: periodic
    Period: 1000
  Encoding: encode-kvgpb
  Source VRF:
  Source Address: 10.48.39.130
  Notes: Subscription validated

  Named Receivers:
    Name                                              Last State Change  State                 Explanation
    -------------------------------------------------------------------------------------------------------------------------------------------------------
    grpc-tcp://10.48.39.98:57000                      05/23/24 08:00:25  Connected
确认网络可达性
Catalyst 9800控制器将gRPC数据发送到为每个遥测订阅配置的接收器端口。
WLC#show run | include receiver ip address
receiver ip address 10.48.39.98 57000 protocol grpc-tcp
要验证WLC与接收器之间在此已配置端口上的网络连接,可以使用多种工具。
从WLC中,可以对已配置的接收器IP/端口(此处为10.48.39.98:57000)使用telnet来验证此接收器是否打开以及是否可从控制器本身访问。如果流量未被阻塞,端口必须在输出中显示为打开:
WLC#telnet 10.48.39.98 57000
Trying 10.48.39.98, 57000 ... Open <-------或者,您可以使用Nmap从任何主机确保接收方在已配置的端口上正确暴露。
$ sudo nmap -sU -p 57000 10.48.39.98
Starting Nmap 7.95 ( https://nmap.org ) at 2024-05-17 13:12 CEST
Nmap scan report for air-1852e-i-1.cisco.com (10.48.39.98)
Host is up (0.020s latency).

PORT      STATE         SERVICE
57000/udp open|filtered unknown

Nmap done: 1 IP address (1 host up) scanned in 0.35 seconds
日志记录和调试
2024/05/23 14:40:36.566486156 {pubd_R0-0}{2}: [mdt-ctrl] [30214]: (note): **** Event Entry: Configured legacy receiver creation/modification of subscription 101 receiver 'grpc-tcp://10.48.39.98:57000'
2024/05/23 14:40:36.566598609 {pubd_R0-0}{2}: [mdt-ctrl] [30214]: (note): Use count for named receiver 'grpc-tcp://10.48.39.98:57000' set to 46.
2024/05/23 14:40:36.566600301 {pubd_R0-0}{2}: [mdt-ctrl] [30214]: (note): {subscription receiver event='configuration created'} received for subscription 101 receiver 'grpc-tcp://10.48.39.98:57000'
[...]
2024/05/23 14:40:36.572402901 {pubd_R0-0}{2}: [pubd] [30214]: (info): Collated data collector filters for subscription 101.
2024/05/23 14:40:36.572405081 {pubd_R0-0}{2}: [pubd] [30214]: (debug): Creating periodic sensor for subscription 101.
2024/05/23 14:40:36.572670046 {pubd_R0-0}{2}: [pubd] [30214]: (info): Creating data collector type 'ei_do periodic' for subscription 101 using filter '/process-cpu-ios-xe-oper:cpu-usage/cpu-utilization'.
2024/05/23 14:40:36.572670761 {pubd_R0-0}{2}: [pubd] [30214]: (debug): Creating crimson data collector for filter '/process-cpu-ios-xe-oper:cpu-usage/cpu-utilization' (1 subfilters) with cap 0x0001.
2024/05/23 14:40:36.572671763 {pubd_R0-0}{2}: [pubd] [30214]: (debug): Need new data collector instance 0 for subfilter '/process-cpu-ios-xe-oper:cpu-usage/cpu-utilization'.
2024/05/23 14:40:36.572675434 {pubd_R0-0}{2}: [pubd] [30214]: (debug): Creating CRIMSON periodic data collector for filter '/process-cpu-ios-xe-oper:cpu-usage/cpu-utilization'.
2024/05/23 14:40:36.572688399 {pubd_R0-0}{2}: [pubd] [30214]: (debug): tree rooted at cpu-usage
2024/05/23 14:40:36.572715384 {pubd_R0-0}{2}: [pubd] [30214]: (debug): last container/list node 0
2024/05/23 14:40:36.572740734 {pubd_R0-0}{2}: [pubd] [30214]: (debug): 1 non leaf children to render from cpu-usage down
2024/05/23 14:40:36.573135594 {pubd_R0-0}{2}: [pubd] [30214]: (debug): URI:/cpu_usage;singleton_id=0 SINGLETON
2024/05/23 14:40:36.573147953 {pubd_R0-0}{2}: [pubd] [30214]: (debug): 0 non leaf children to render from cpu-utilization down
2024/05/23 14:40:36.573159482 {pubd_R0-0}{2}: [pubd] [30214]: (debug): Timer created for subscription 101, sensor 0x62551136f0e8
2024/05/23 14:40:36.573166451 {pubd_R0-0}{2}: [mdt-ctrl] [30214]: (note): {subscription receiver event='receiver connected'} received with peer (10.48.39.98:57000) for subscription 101 receiver 'grpc-tcp://10.48.39.98:57000'
2024/05/23 14:40:36.573197750 {pubd_R0-0}{2}: [pubd] [30214]: (debug): Starting batch from periodic collector 'ei_do periodic'.
2024/05/23 14:40:36.573198408 {pubd_R0-0}{2}: [pubd] [30214]: (debug): Building from the template
2024/05/23 14:40:36.575467870 {pubd_R0-0}{2}: [pubd] [30214]: (debug): Created dbal batch:133, for crimson subscription
2024/05/23 14:40:36.575470867 {pubd_R0-0}{2}: [pubd] [30214]: (debug): Done building from the template
2024/05/23 14:40:36.575481078 {pubd_R0-0}{2}: [pubd] [30214]: (debug): Executing batch:133 for periodic subscription
2024/05/23 14:40:36.575539723 {pubd_R0-0}{2}: [mdt-ctrl] [30214]: (note): {subscription id=101 receiver name='grpc-tcp://10.48.39.98:57000', state='connecting'} handling 'receiver connected' event with result 'e_mdt_rc_ok'
2024/05/23 14:40:36.575558274 {pubd_R0-0}{2}: [mdt-ctrl] [30214]: (note): {subscription receiver event='receiver connected'} subscription 101 receiver 'grpc-tcp://10.48.39.98:57000' changed
2024/05/23 14:40:36.577274757 {ndbmand_R0-0}{2}: [ndbmand] [30690]: (info): get__next_table reached the end of table for /services;serviceName=ewlc_oper/capwap_data@23
2024/05/23 14:40:36.577279206 {ndbmand_R0-0}{2}: [ndbmand] [30690]: (debug): Cleanup table for /services;serviceName=ewlc_oper/capwap_data cursor=0x57672da538b0
2024/05/23 14:40:36.577314397 {ndbmand_R0-0}{2}: [ndbmand] [30690]: (info): get__next_object cp=ewlc-oper-db exit return CONFD_OK
2024/05/23 14:40:36.577326609 {ndbmand_R0-0}{2}: [ndbmand] [30690]: (debug): yield ewlc-oper-db
2024/05/23 14:40:36.579099782 {iosrp_R0-0}{1}: [parser_cmd] [26295]: (note): id= A.B.C.D@vty0:user= cmd: 'receiver ip address 10.48.39.98 57000 protocol grpc-tcp' SUCCESS 2024/05/23 14:40:36.578 UTC
2024/05/23 14:40:36.580979429 {pubd_R0-0}{2}: [pubd] [30214]: (debug): Batch response received for crimson sensor, batch:133
2024/05/23 14:40:36.580988867 {pubd_R0-0}{2}: [pubd] [30214]: (debug): Green response: Result rc 0, Length: 360, num_records 1
2024/05/23 14:40:36.581175013 {pubd_R0-0}{2}: [pubd] [30214]: (debug): Green Resp cursor len 63
2024/05/23 14:40:36.581176173 {pubd_R0-0}{2}: [pubd] [30214]: (debug): There is no more data left to be retrieved from batch 133.
2024/05/23 14:40:36.581504331 {iosrp_R0-0}{2}: [parser_cmd] [24367]: (note): id= 10.227.65.133@vty1:user=admin cmd: 'receiver ip address 10.48.39.98 57000 protocol grpc-tcp' SUCCESS 2024/05/23 14:40:36.553 UTC
[...]
2024/05/23 14:40:37.173223406 {pubd_R0-0}{2}: [pubd] [30214]: (info): Added queue (wq: tc_inst 60293411, 101) to be monitored (mqid: 470)
2024/05/23 14:40:37.173226005 {pubd_R0-0}{2}: [pubd] [30214]: (debug): New subscription (subscription 101) monitoring object stored at id 19
2024/05/23 14:40:37.173226315 {pubd_R0-0}{2}: [pubd] [30214]: (note): Added subscription for monitoring (subscription 101, msid 19)
2024/05/23 14:40:37.173230769 {pubd_R0-0}{2}: [pubd] [30214]: (debug): Stats updated for Q (wq: tc_inst 60293411, 101), total_enqueue: 1
2024/05/23 14:40:37.173235969 {pubd_R0-0}{2}: [pubd] [30214]: (debug): (grpc::events) Processing event Q
2024/05/23 14:40:37.173241290 {pubd_R0-0}{2}: [pubd] [30214]: (debug): GRPC telemetry connector update data for subscription 101, period 1 (first: true)
2024/05/23 14:40:37.173257944 {pubd_R0-0}{2}: [pubd] [30214]: (debug): Encoding path is Cisco-IOS-XE-process-cpu-oper:cpu-usage/cpu-utilization
2024/05/23 14:40:37.173289128 {pubd_R0-0}{2}: [pubd] [30214]: (debug): Creating kvgpb encoder
2024/05/23 14:40:37.173307771 {pubd_R0-0}{2}: [pubd] [30214]: (debug): Creating combined parser
2024/05/23 14:40:37.173310050 {pubd_R0-0}{2}: [pubd] [30214]: (debug): Beginning MDT yang container walk for record 0
2024/05/23 14:40:37.173329761 {pubd_R0-0}{2}: [pubd] [30214]: (debug): Dispatching new container [data_node: name=Cisco-IOS-XE-process-cpu-oper:cpu-usage, type=container, parent=n/a, key=false]
2024/05/23 14:40:37.173334681 {pubd_R0-0}{2}: [pubd] [30214]: (debug): Container 'Cisco-IOS-XE-process-cpu-oper:cpu-usage' started successfully
2024/05/23 14:40:37.173340313 {pubd_R0-0}{2}: [pubd] [30214]: (debug): add data in progress
2024/05/23 14:40:37.173343079 {pubd_R0-0}{2}: [pubd] [30214]: (debug): GRPC telemetry connector continue data for subscription 101, period 1 (first: true)
2024/05/23 14:40:37.173345689 {pubd_R0-0}{2}: [pubd] [30214]: (debug): (grpc::events) Processing event Q
2024/05/23 14:40:37.173350431 {pubd_R0-0}{2}: [pubd] [30214]: (debug): Dispatching new container [data_node: name=cpu-utilization, type=container, parent=Cisco-IOS-XE-process-cpu-oper:cpu-usage, key=false]
2024/05/23 14:40:37.173353194 {pubd_R0-0}{2}: [pubd] [30214]: (debug): Deferred container cpu-utilization
2024/05/23 14:40:37.173355275 {pubd_R0-0}{2}: [pubd] [30214]: (debug): Container 'cpu-utilization' started successfully
2024/05/23 14:40:37.173380121 {pubd_R0-0}{2}: [pubd] [30214]: (debug): Dispatching new leaf [name=five-seconds, value=3, parent=cpu-utilization, key=false]
2024/05/23 14:40:37.173390655 {pubd_R0-0}{2}: [pubd] [30214]: (debug): Leaf 'five-seconds' added successfully
2024/05/23 14:40:37.173393529 {pubd_R0-0}{2}: [pubd] [30214]: (debug): add data in progress
2024/05/23 14:40:37.173395693 {pubd_R0-0}{2}: [pubd] [30214]: (debug): GRPC telemetry connector continue data for subscription 101, period 1 (first: true)
2024/05/23 14:40:37.173397974 {pubd_R0-0}{2}: [pubd] [30214]: (debug): (grpc::events) Processing event Q
2024/05/23 14:40:37.173406311 {pubd_R0-0}{2}: [pubd] [30214]: (debug): Dispatching new leaf [name=five-seconds-intr, value=0, parent=cpu-utilization, key=false]
2024/05/23 14:40:37.173408937 {pubd_R0-0}{2}: [pubd] [30214]: (debug): Leaf 'five-seconds-intr' added successfully
2024/05/23 14:40:37.173411575 {pubd_R0-0}{2}: [pubd] [30214]: (debug): add data in progress
[...]
确保指标到达TIG堆栈
从IncusionDB CLI
与其他数据库系统一样,InfluenceDB也随附一个CLI,可用于检查Telegraf是否正确接收并存储在定义的数据库中。InfusionDB将度量值(称为点)组织成测量值,这些测量值本身被组织成系列。此处介绍的一些基本命令可用于验证InfluenceDB端的数据方案,并确保数据到达此应用程序。
首先,您可以检查序列、测量及其结构(键)是否正确生成。它们由Telegraf和InfluenceDB根据使用的RPC结构自动生成。

注意:当然,此结构可以从Telegraf和InfluenceDB配置完全自定义。但是,这已超出本配置指南的范围。
$ influx
Connected to http://localhost:8086 version 1.6.7~rc0
InfluxDB shell version: 1.6.7~rc0
> USE TELEGRAF
Using database TELEGRAF
> SHOW SERIES
key
---
Cisco-IOS-XE-process-cpu-oper:cpu-usage/cpu-utilization,host=ubuntu-virtual-machine,path=Cisco-IOS-XE-process-cpu-oper:cpu-usage/cpu-utilization,source=WLC,subscription=101
> SHOW MEASUREMENTS
name: measurements
name
----
Cisco-IOS-XE-process-cpu-oper:cpu-usage/cpu-utilization
> SHOW FIELD KEYS FROM "Cisco-IOS-XE-process-cpu-oper:cpu-usage/cpu-utilization"
name: Cisco-IOS-XE-process-cpu-oper:cpu-usage/cpu-utilization
fieldKey                                               fieldType
--------                                               ---------
cpu_usage_processes/cpu_usage_process/avg_run_time     integer
cpu_usage_processes/cpu_usage_process/five_minutes     float
cpu_usage_processes/cpu_usage_process/five_seconds     float
cpu_usage_processes/cpu_usage_process/invocation_count integer
cpu_usage_processes/cpu_usage_process/name             string
cpu_usage_processes/cpu_usage_process/one_minute       float
cpu_usage_processes/cpu_usage_process/pid              integer
cpu_usage_processes/cpu_usage_process/total_run_time   integer
cpu_usage_processes/cpu_usage_process/tty              integer
five_minutes                                           integer
five_seconds                                           integer
five_seconds_intr                                      integer
one_minute                                             integer
一旦数据结构明确(整数、字符串、布尔值……),就可以根据特定字段获取在这些测量上存储的数据点的数量。
# Get the number of points from "Cisco-IOS-XE-process-cpu-oper:cpu-usage/cpu-utilization" for the field "five_seconds".
> SELECT COUNT(five_seconds) FROM "Cisco-IOS-XE-process-cpu-oper:cpu-usage/cpu-utilization"
name: Cisco-IOS-XE-process-cpu-oper:cpu-usage/cpu-utilization
time count
---- -----
0    1170
> SELECT COUNT(five_seconds) FROM "Cisco-IOS-XE-process-cpu-oper:cpu-usage/cpu-utilization"
name: Cisco-IOS-XE-process-cpu-oper:cpu-usage/cpu-utilization
time count
---- -----
0    1171

# Fix timestamp display
> precision rfc3339
# Get the last point stored in "Cisco-IOS-XE-process-cpu-oper:cpu-usage/cpu-utilization" for the field "five_seconds".
> SELECT LAST(five_seconds) FROM "Cisco-IOS-XE-process-cpu-oper:cpu-usage/cpu-utilization"
name: Cisco-IOS-XE-process-cpu-oper:cpu-usage/cpu-utilization
time                    last
----                    ----
2024-05-23T13:18:53.51Z 0
> SELECT LAST(five_seconds) FROM "Cisco-IOS-XE-process-cpu-oper:cpu-usage/cpu-utilization"
name: Cisco-IOS-XE-process-cpu-oper:cpu-usage/cpu-utilization
time                     last
----                     ----
2024-05-23T13:19:03.589Z 2
如果特定字段的点数和最后一次出现的时间戳增加,则表示TIG堆栈正确接收和存储WLC发送的数据是个好兆头。
来自电报
要验证电报接收器确实从控制器获取了一些指标并检查其格式,您可以将电报指标重定向到主机上的输出文件。在设备互连故障排除方面,这非常方便。为此,只需使用Telegraf的“file”输出插件(可通过/etc/telegraf/telegraf.conf进行配置)即可。
# Send telegraf metrics to file(s)
[[outputs.file]]
#   ## Files to write to, "stdout" is a specially handled file.
   files = ["stdout", "/tmp/metrics.out", "other/path/to/the/file"]
#
#   ## Use batch serialization format instead of line based delimiting.  The
#   ## batch format allows for the production of non line based output formats and
#   ## may more efficiently encode metric groups.
#   # use_batch_format = false
#
#   ## The file will be rotated after the time interval specified.  When set
#   ## to 0 no time based rotation is performed.
#   # rotation_interval = "0d"
#
#   ## The logfile will be rotated when it becomes larger than the specified
#   ## size.  When set to 0 no size based rotation is performed.
#   # rotation_max_size = "0MB"
#
#   ## Maximum number of rotated archives to keep, any older logs are deleted.
#   ## If set to -1, no archives are removed.
#   # rotation_max_archives = 5
#
#   ## Data format to output.
#   ## Each data format has its own unique set of configuration options, read
#   ## more about them here:
#   ## https://github.com/influxdata/telegraf/blob/master/docs/DATA_FORMATS_OUTPUT.md
   data_format = "influx"
参考
修订历史记录
| 版本 | 发布日期 | 备注 |
|---|---|---|
1.0 |
10-Jun-2024 |
初始版本 |
由思科工程师提供
- 桂莲·德佛安德烈思科TAC
- 拉希德·哈姆丹思科TAC
 反馈
反馈