Person working on laptop and using Nexus dashboard Data broker

Cisco Nexus Dashboard Data Broker

Simplify monitoring your business traffic needs with an easy, scalable, and budget-friendly solution.

Overview Resources Licensing

Benefits of Cisco Nexus Dashboard Data Broker

See how Cisco Nexus Dashboard Data Broker offers a simple, scalable, and cost-effective monitoring solution for high-volume and business-critical traffic.

Extend your visibility

Gain extensive visibility for high-density data center switches with speeds up to 100/400G (Gigabit Ethernet) and analytics. Ideal for increasing traffic volumes and highly complex multipath networks.

Grow at scale with speed

Monitor your network efficiently, no matter how many ports, switches, or taps you have. Scale easily as your network grows.

Cut costs and save more

Cut network monitoring spend with simple, cost-effective, standard Cisco Nexus switches.

Industry-leading features and capabilities

Experience the industry's latest innovations with advanced analytics for even the most complex and busy data center networks.

Monitor, manage, and grow your operations with ease

Flexible deployment

  • Centralized controller for large-scale deployments
  • On-switch embedded controller
  • Granular control in a multiuser environment
  • Operate with web-based NDB UI or automate with NDB REST APIs

TAP/SPAN aggregation

  • Flexible aggregation and replication
  • Versatile filters: L2/L3/L4 header filters, MPLS filter, and user-defined filter (UDF)
  • VLAN strip, MPLS strip, 802.1Q tagging, PTP time stamp insertion, and packet truncation
  • SPAN automation for Cisco ACI and NX-OS mode
  • Visibility into virtual TAP traffic (VM-to-VM traffic) or ACI EPG ERSPAN traffic

Inline monitoring

  • Detection and automatic remediation of service node failures
  • Real-time traffic replication and monitoring scalable service nodes for multiple production paths

Latest innovations

  • Generate NetFlow records at line rate for ingress traffic
  • Send traffic to remote tool over an L3 network
  • Automated upgrades and replacement of hardware
  • Bulk updates of device credentials using credential profile

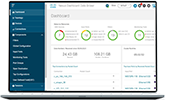
Discover what's inside the Cisco Nexus Dashboard Data Broker

Explore the details of the Cisco Nexus Dashboard Data Broker and find your ideal fit.

Meet your business goals with power and simplicity.

Nexus Dashboard Data Broker screen

Cisco Nexus Dashboard Data Broker

  • A simple and intuitive web-based user interface to manage aggregating, filtering, forwarding, and replicating rules
  • REST APIs to automate and adapt the rules dynamically
  • Runs in a centralized virtual machine or in the guest shell on Nexus NDB switch
Nexus 9000 Series switches

Cisco Nexus 9000 Series switches

  • Proven high performance and density up to 400G, as well as low latency
  • High programmability and exceptional power efficiency in a range of form factors

FAQ

Find frequently asked questions about Nexus Dashboard Data Broker.

Cisco Nexus Dashboard Data Broker (formerly Nexus Data Broker) allows NetOps to programmatically manage aggregating, filtering, and forwarding complete flows to custom analytics tools.

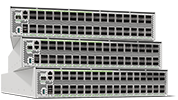
Its functionality can be used on almost any available off-the-shelf data center Cisco Nexus 9000 switches on both fixed and modular switches.

The controller software can run on any bare-metal server or virtual machine, on leaf switches in ACI fabric, and on individual Catalyst switches through Cisco Catalyst center.

For every Data Broker switch purchased/repurposed, an NDB license (Subscription, Perpetual) should be added to the Bill of Materials (BOM). Nexus Dashboard Data Broker controller software is offered for free.


Discover innovations

Watch your favorite cloud and data center videos

Get the latest updates on data center and cloud technology, upcoming features, and more.

Cisco Nexus Dashboard Data Broker

Monitor your critical and high-traffic data with an easy, scalable, and cost-effective solution. Track your business data with simple and flexible monitoring.