Low Latency DOCSIS

This document describes how to configure Low Latency DOCSIS (LLD) on the Cisco cBR Series Converged Broadband Router.

Overview

Cablelabs introduced Low Latency DOCSIS technology (LLD) in DOCSIS 3.1 to further reduce latency for applications that are sensitive to delays. LLD technology uses separate service flows, Classic Service Flow and Low Latency Service Flow (LL SF), for traffic that may cause queue building (QB, for example, TCP CUBIC) and traffic that does not cause queue building (NQB, for example gaming, L4S).

Active Queue Management

Table 1. Feature History

Feature Name

Release Information

Feature Description

Updates for Active Queue Management(AQM)

Cisco IOS XE Dublin 17.12.1

In this release, AQM is updated to include Immediate AQM, where Explicit Congestion Notification can be sent to the sender to control the latency of the queue. Also included in 17.12.1 is queue coupling, which ensures fairness between the classic and low-latency queues in an ASF.

Support for Active Queue Management(AQM)

Cisco IOS XE Cupertino 17.9.1y

Active Queue Management (AQM) is one of the critical components of LLD. AQM allows routers to control the queue length and delay of packets.

Active Queue Management (AQM) is one of the critical components of Low-Latency DOCSIS (LLD). AQM allows routers to control the queue length and delay of packets.

Traditional Queue Management can lead to tail dropping when the queue is full. By dropping packets before buffer overflow, AQM allows routers to control the queue length and delay of packets.

Benefits of AQM

AQM Reduces buffer bloat and traffic latency while also improving the user experience.

cBR-8 implements the PIE algorithm as defined in RFC 8033 as the downstream AQM algorithm.

PIE Algorithm

Proportional Integral Controller Enhanced (PIE) controls latency by randomly dropping packets when latency is approaching or exceeding the latency target. PIE is the AQM algorithm that is implemented on the cBR-8.

Explicit Congestion Notification (ECN) Marking

If packets are classified to Low Latency Service Flow (LL SF) and marked by the sender as ECN Capable Transport (ECT1), The CMTS may mark the Congestion Experienced bit (CE), if the queue starts to build up.

Low Latency Low Loss Scalable Throughput (L4S) is a new technology that relies on ECN to provide high throughput and low latency for IP traffic. Examples of L4S congestion control algorithms are TCP Prague, Google BBR/BBR2, and Apple QUIC.

Immediate AQM (IAQM)

L4S technology requires network equipment to apply ECN marking more frequently than classic ECN marking or dropping Immediate AQM (IAQM) algorithm is used by Low Latency Service Flows (LL SF) to determine the marking probability. IAQM uses a ramp function to calculate marking probability, probNative, based on Minimum threshold, Maximum threshold and current queue delay. The Minimum threshold and Maximum threshold can be configured via TLVs or service classes.

Dual-Queue Coupled AQM

With the coexistence of Queue-Building (QB) traffic (which will be placed on a classic Service Flow) and Non-Queue-Building (NQB) traffic, the Low Latency Service Flow (LL SF) implements Congestion Experienced (CE) marking, while the Classic SF AQM uses packet drops.

The coupling between the AQMs ensures that the capacity of the aggregate service flow is used roughly equally by traffic flows across both LL SF and Classic SF, that is, a traffic flow would get approximately the same bandwidth, regardless of which service flow it is on.

AQM Parameters

Table 2. SF AQM Disable

Type

Length

Value

25.40.1

1

0 = Enable AQM on service flow
1 = Disable AQM on service flow
Table 3. Downstream Classic AQM Latency Target

Type

Length

Value

25.40.2

1

AQM Latency Target (in milliseconds) 

Recommended Latency Target Range: 10ms - 100ms

Configure Latency Target with service class:

cable service class 300 downstream
cable service class 300 aqm-disable 0
cable service class 300 aqm-latency-target 15

IAQM Ramp Function Parameters

Immediate AQM Max Threshold:

Type 		     Length Value
[24/25].40.4 2      Maximum threshold of the ramp function (in us)

Default: 1000 us

Immediate AQM Range Exponent of Ramp Function:

Type           Length Value
[24/25].40.5   1      0-25  Exponent to calculate the range of the ramp function(ns) 

IAQM Range Exponent provides the range of the ramp function (in ns). It is expressed as an exponent of 2. A value of 19 means that the range is 2^19 = 524288 ns (roughly 524 μs). With Max Threshold 1000 us, the Minimum Threshold is:1000–524 = 476 us.

Commands

Check AQM configuration

Router#show cable modem a84e.3f37.1740 verbose sup | i AQM
  AQM Disable                    : 0
  AQM Latency Target             : 12
  AQM Algorithm                  : 0
  AQM Max Threshold              : 2000
  AQM Range Exponent             : 19
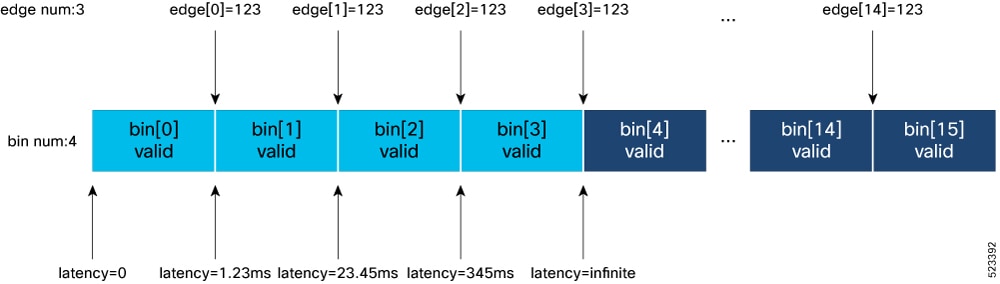
  AQM Histogram Edge Count       : 15
  AQM Histogram Edges            : 0x00C8   2.00(ms)  0x0190   4.00(ms)  0x0258 6.00(ms)

Check AQM statistics

Router#show cable dp aqm wideband-Cable 1/0/1:4
MAC Address     I/F     Sfid class-name Length/Max  Dequeues qDrops  rDrops pDrops Marked Target
                                                                                        Latency(ms)
a84e.3f37.18da  Ca1/0/1  17  6--class-map    0/255   0         0      0       0        0     12
a84e.3f37.1740  Ca1/0/1  27  9--class-map    0/255   227968    0      0       0     4124     12
a84e.3f37.102e  Ca1/0/1  33  12--class-map   0/255   0         0      0       0        0     12

pDrops: policer drops
rDrops: random drops
qDrops: tail-drops + random drops
Marked: CE marked

Queue Protection

Table 4. Feature History

Feature Name

Release Information

Feature Description

Queue protection

Cisco IOS XE Dublin 17.12.1x

In this release, you can configure queue protection for Low Latency Service Flows. Use this feature to identify traffic on low latency flows that does not comply with the non-queue-building behavior and move some of them to classic flows.

The benefit of using Queue protection is that latency is reduced for latency-critical applications that are classified to Low Latency Service Flows, that are well-behaved.

Reducing the latency can provide more responsive gaming, faster and responsive website loads, and also provide a telepresence experience with minimum lag.

When certain traffic is erroneously classified to low latency flows, or certain traffic on low latency flows does not behave as non-queue building, then the queue may start to build up. This causes an increase in latency.

The Queue protection feature identifies traffic on low latency flow that does not comply with the non-queue-building behavior, and move some of traffic to classic flows.

Identifying Misbehaving Microflows

A microflow is identified with 5-tuple values (source/destination address + source/destination ports + protocol) of a packet header. Queue protection identifies the microflows that contribute to queue build up based on queue scores. The queue score is measured with a token bucket that measures the rate that packets are ECN-marked,. At the time of packet arrival, if the service flow queue score exceeds a certain threshold, then the packet moves to classic flow.

Moving Packets to Classic Flow

If latency exceeds the configured threshold, and the microflows have been congested for long enough, Queue protection moves the packets to classic flows. It is expected that queue protection may cause packets to be out-of-order. However, this also gives senders an incentive to mark their packets correctly.

TLV Configuration

Queue Protection Enable

Type             Length    Value 
[70/71].42.7     1         Bit 0 : (0) Queue Protection is disabled 
                           (1) Queue Protection is enabled (default)

QPLatencyThreshold (CRITICALqL_us)

Type             Length    Value
[70/71].42.8     2         μs

QPQueuingScoreThreshold (CRITICALqLSCORE_us)

Type             Length    Value
[70/71].42.9     2         μs

QPDrainRateExponent(LG_AGING)

Type             Length   Value
[70/71].42.10.   1        Exponent to calculate the drain rate.

Configuring Queue Protection via AQP

You can also configure Queue Protection parameters using AQP. Use the following commands to configure Queue Protection via AQP:

cable asf-qos-profile DSASF_AQP ds qp-enable 1
cable asf-qos-profile DSASF_AQP ds qp-latency-threshold 1500
cable asf-qos-profile DSASF_AQP ds qp-score-threshold 32000
cable asf-qos-profile DSASF_AQP ds qp-drain-rate-exp 21

You can use the show cable dp aqm command to view LLD and Queue protection Statistics.

MIBs

The docsQosSfCongestionStatsTable MIB is supported

docsQosSfCongestionSanctionedPkts Counter64
docsQosSfCongestionTotalEct0Pkts Counter64
docsQosSfCongestionTotalEct1Pkts Counter64
docsQosSfCongestionCeMarkedEct1Pkts Counter64

docsQosSfCongestionSanctionedPkts: For a Downstream Low Latency Service Flow in the CCAP, this attribute counts the number of packets redirected from the Low Latency Service Flow to the Classic Service Flow. For other Service Flow types in the CCAP, this counter reports 0. For an Upstream Low Latency Service Flow in the CM, this attribute counts the number of packets redirected from the Low Latency Service Flow to the Classic Service Flow. For other Service Flow types in the CM, this counter reports 0.

See DOCS-QOS3-MIB-2021-06-24.txt.

Aggregate Service Flow

Table 5. Feature History

Feature Name

Release Information

Feature Description

Updates for Aggregate Service Flow (ASF) Provisioning

Cisco IOS XE Dublin 17.12.1

You can also use the AQP Expansion procedure to provision ASFs. There are no ASF TLVs present in the REG-REQ. A constituent SF TLV is present and specifies an AQP in the sub-tlv [24/25].4. The cBR-8 router performs an AQP table lookup based on this AQP name and provisions the ASF and constituent SFs from the AQP table entry.

Aggregate Service Flow (ASF) is a grouping of multiple Service Flows (typically two) which are used to support a hierarchical two-layered subscriber QoS model. The two Service Flows are referred to as the Constituent Service Flows of the ASF. For a Low Latency ASF, one constituent SF is the Low Latency Service Flow, and one is the Classic Service Flow.

ASF can be provisioned statically using three different methods:

  • Method One: All TLVs for the ASF and constituent SFs are explicitly set in the REG-REQ.

  • Method Two: The ASF encoding specifies an Aggregate QoS Profile (AQP) using TLV [70/71].4. The ASF is provisioned using a combination of TLVs explicitly set in the REG-REQ and parameters that are configured in the AQP table entry.

  • Method Three: No ASF TLVs are present in the REG-REQ. A constituent SF TLV is present and specifies an AQP in sub-tlv [24/25].4. The cBR8 router performs an AQP table lookup based on this AQP name and provisions the ASF and constituent SFs from the AQP table entry. This procedure is called AQP Expansion.

ASF QoS Profile (AQP)

SCN is to SF as AQP is to ASF. AQP table entries are configured on the CMTS and referenced by name in the CM config file.

US/DS Primary SF Determination

  • ASF Cannot be Primary.

  • LL Constituent SF Cannot be Primary.

  • REG-RSP Prim SF Indicator (TLV 90)

Simple CM Config File

  • Type [24/25] SF includes SCN TLV [24/25].4

  • Also type [24/25] SF does not include ASF Ref TLV [24/25].36

  • The cBR8 router looks up [24/25].4 string in AQP Table first: If found, perform AQP Expansion.

  • If not found in AQP Table, CMTS looks up [24/25].4 string as SCN.

AQP LL SF Classifiers

The default Classifiers for LL Constituent SF when using AQP:

  • AQP specified in ASF TLV [70/71].4

  • AQP expansion

  • EF marked traffic (IPv4): [22/23](7) [9](5) [1](3) 0xB8,0xB8, 0xFC

  • EF marked traffic (IPv6) : [22/23](7) [12](5) [1](3) 0xB8,0xB8, 0xFC

  • Classifier for all ECT capable traffic(IPv4): [22/23](7) [9](5) [1](3) 0x01, 0x01, 0x01

  • Classifier for all ECT capable traffic(IPv6): [22/23](7) [12](5) [1](3) 0x01, 0x01, 0x01

  • Default value for upstream:

    0x16 0x07 0x09 0x05 0x01 0x03 0xB8 0xB8 0xFC

    0x16 0x07 0x0C 0x05 0x01 0x03 0xB8 0xB8 0xFC

    0x16 0x07 0x09 0x05 0x01 0x03 0x01 0x01 0x01

    0x16 0x07 0x0C 0x05 0x01 0x03 0x01 0x01 0x01

  • Default value for downstream:

    0x17 0x07 0x09 0x05 0x01 0x03 0xB8 0xB8 0xFC

    0x17 0x07 0x0C 0x05 0x01 0x03 0xB8 0xB8 0xFC

    0x17 0x07 0x09 0x05 0x01 0x03 0x01 0x01 0x01

    0x17 0x07 0x0C 0x05 0x01 0x03 0x01 0x01 0x01

Configuring AQP and View Default Classifiers

The following shows how to configure AQP and view Default Classifiers:


Router#configure terminal 
Enter configuration commands, one per line . End with CNTL/Z. 

Router#cable asf-qos -profile AQPcIassifier01 ds 
Router(config)#end 
Router# 

Router#show cable asf-qos-profile name AQPcIassifier01 

Name :                                    AQPcIassifier01 
Direction : 				  Downstream 
Traffic Priority:                         0 
Maximum Sustained Rate: 		    0 bits/ sec
Max Burst: 				   3044 bytes 
Minimum Resemyed Rate: 	            0 bits/ sec
Minimum Packet Size                       0 bytes
Peak Rate 			    	0 bits/ sec
Low Latency ASF: 			    true
classic SF scru 
Low Latency SF SCN: 
AQI•I Coupling Factor: 		     20
Scheduling Weight: 			  230
Queue Protection Enable:    		true
QP Latency Threshold: 		      1000
QP Score Threshold:                       2000
QP Drain Rate Exponent: 		    19
Low Latency Classifiers: 
                                          0x 17070905 0103B8B8 FX17070C 050103B8
                                          0x B8FC1707 09050103 01010117 070C0501
                                          0x 03010101

Sources of SF Classifiers

  • CM Config File: Classifiers can point to an SF (SF Ref) or ASF (ASF Ref)

  • AQP: Classifiers for the Low Latency SF only

cBR-8 router applies Classifiers Pointing to an ASF to a Constituent SF.

  • Redirected to the Low Latency Constituent SF:

    • 22/23].9.1 (ToS low/high/mask)

    • [22/23].12.1 (TC low/high/mask)

  • All other Classifiers Redirected to the Classic Constituent SF.

Classifier Conflict: AQP and CM Cfg File Include Same Classifier for LL SF. cBR-8 router rejects REG-REQ with code reject-invalid-low-latency-config.

DOCSIS DSX Messaging

ASF can also be provisioned dynamically using DOCSIS DSX messaging. ASF DSX Operations NOT Supported by D31 CM Vendors. cBR-8 Supports DSC Operations on Dynamic SFs Only.

ASF DSA-REQ: MULPI Discrepancy

  • DSA-REQ MUST NOT contain multiple SF in one direction.

  • ASF DSA-REQ MUST contain ASF + Classic SF + LL SF.


Note


Starting with Cisco IOS XE Dublin 17.12.1x, aggregate rate shaping for upstream ASF is not supported. US ASF related parameters can be used in the CM configuration file, or in the US AQP, but are not applied by the US scheduler for US ASF.


Latency Histogram

Table 6. Feature History

Feature Name

Release Information

Feature Description

Low Latency DOCSIS Histogram Support

Cisco IOS XE Dublin 17.12.1

Low Latency DOCSIS (LLD) Histograms can now be configured and statistics collected via CLI and new MIBS. This provides visibility into how Active Queue Management (AQM) is managing average latencies on LLD-configured modems.

Active queue management (AQM) estimates SF queueing latency and uses it for packet marking or dropping. Histogram exposes the estimation data to operators. Estimation is done periodically, all packets within the period are marked with the same latency. Histogram can be collected only on AQM flows, it generates stats on AQM flows. Histogram configuration can be specified using a CM configure file, DSX TLV, service class (CLI or SNMP), or SNMP. Histogram stats can be queried via CLI and SNMP. Histogram Configuration and stats are deleted at SF delete. Histogram stats are cleared at histogram Configuration change. Max SF's number is 64K. A configurable limit b/w 0-64K can be set. Limit default is 4K. Dynamic Flows are not supported.

Histogram Data Format

Histogram is represented by consecutive bins. Bin’s latency range is specified by its lower/upper edges. Nth bin’s upper edge is (N+1)th bin’s lower edge. First bin’s lower edge is 0. Last bin’s upper edge is infinite. Edge is u16 with unit in 10us. Up to 15 edges define up to 16 bins. Each bin contains a u64 packet counter for packets whose latency is within the bin’s latency range. Latency stats also include A u64 counter for total number of updates and a u16 for maximum latency. The following example shows a sample histogram data format:

Figure 1. Histogram Data Format
A schematic diagram showing the histogram data format.
  • 4 bins are configured with edge[3]={123, 2345, 34500}.

  • Bin[0] counts packets whose latency is 0-1.23ms.

  • Bin[1] counts packets whose latency is 1.23ms-23.45ms.

  • Bin[2] counts packets whose latency is 23.45ms-345ms.

  • Bin[3] counts packets whose latency is 345ms-infinite.

  • Bin[4-15] are not used.

Unsupported Features

  • Latency reporting MIB OID defined in DOCS-PNM-MIB: docsCmtsLatencyRptCfgTable

  • Histogram Stats Streaming is not supported.

Configuring Latency Histogram

Histogram edges can be configured in several ways.

  • Service class

    • Configuring CLI

    • SNMP

  • TLV

    • CM Configure file

    • DSX TLV

  • SNMP

Configuring Info Source Priorities

During CM registration, if CM configures file uses service class, then edges from service class is used as default. If CM configures file contains edges, then they overwrite edges from service class. After CM is online, edges can be updated by DSX TLV or MIB-SET docsQosSfLatencyHistCfgEntry.

Configuration in SUP IOS

Configuration is stored in 3 places in SUP IOS.

  • DOCSIS SF Instance

  • DP SF Instance

  • DP hist-db

Configuration propagation: docsis sf => dp sf => dp hist-db

The following example shows a sample ShowConfiguration in SUP IOS:

Router#show cable modem 0025.2e2d.7648 service-flow verbose
DS Latency Histogram Info (dp-flow)
 Edge Num: 1
 Edge Val: 4386 (1122) 0    (0000) 0    (0000) 0    (0000) 0    (0000) 
           0    (0000) 0    (0000) 0    (0000) 0    (0000) 0    (0000) 
           0    (0000) 0    (0000) 0    (0000) 0    (0000) 0    (0000) 
DS Latency Histogram DB [slot:1 md:0 sfid:12]
 [CP-KEY] slot:1 md:0 sid:12
 [DP-KEY] slot:1 hwid:2609(0xA31)
 [  CM  ] 0025.2e2d.7648 CM1/0/0:1
 [ HIST ] edge_num:1 bin_num:0
          update num: 0
          latency max:   0.00 msec
            range in msec    |  packets
          -----------------------------
          [  0.00 -  43.86)  |  0
          [ 43.86 - Inf.  )  |  0 
DS Latency Histogram Cfg (docsis-flow-sup)
 Edge Num: 1
 Edge Val: 4386 (1122) 0    (0000) 0    (0000) 0    (0000) 0    (0000) 
           0    (0000) 0    (0000) 0    (0000) 0    (0000) 0    (0000) 
           0    (0000) 0    (0000) 0    (0000) 0    (0000) 0    (0000) 

Configuration via Service Class

New histogram edges field in service class allows all edges for an SF to be specified in one octet string. Each edge corresponds to 2 bytes (4 chars). It must contain even number of bytes. Edge values must be in ascending order.

The following example shows a sample Show Configuration in SUP IOS:

Router#configure terminal
Enter configuration commands, one per line.  End with CNTL/Z.
tb32(config)#cable service class 123 name foo
tb32(config)#cable service class 123 downstream 
tb32(config)#cable service class 123 aqm-histogram-encodings 1122
tb32(config)#end
tb32#
tb32#show cable service-class 123 verbose
Index: 					123
Name: 					foo
Direction: 				Downstream
…
AQM Histogram Num Bin Edges: 	1
AQM Histogram Bin Edge Encodings:
					0x1122   43.86(ms)

Configuration via Service Class SNMP

$ getmany -v2c 8.32.1.1 public docsQos3ServiceClassEntry | grep -i hist
docsQos3ServiceClassLatencyHistBinEdges.3.102.111.111 = 11 22 

$ setany -v2c 8.32.1.1 public docsQos3ServiceClassLatencyHistBinEdges.3.102.111.111 "12 34"
docsQos3ServiceClassLatencyHistBinEdges.3.102.111.111 = 12 34 

$ getone -v2c 8.32.1.1 public docsQos3ServiceClassLatencyHistBinEdges.3.102.111.111
docsQos3ServiceClassLatencyHistBinEdges.3.102.111.111 = 12 34 

# 3.102.111.111 is service class table entry index.
## 3: indicates index has 3 chars
## 102.111.111: index is “foo”

Octet String Output Format

# if output octet string contains non-printable ascii char, like 0x11, 0x12,
# getone will print in byte array format
$ getone -v2c 8.32.1.1 public docsQos3ServiceClassLatencyHistBinEdges.3.102.111.111
docsQos3ServiceClassLatencyHistBinEdges.3.102.111.111 = 12 34  # 0x12 is device ctrl 2

# if all byte values are printable ascii chars, getone will pint as ascii string
$ getone -v2c  8.33.1.1 public docsQos3ServiceClassLatencyHistBinEdges.3.102.111.111
docsQos3ServiceClassLatencyHistBinEdges.3.102.111.111 = 3D  # 0x33 is “3”, 0x44 is “D”

# method to convert it to byte array
$ getone -v2c  8.33.1.1 public docsQos3ServiceClassLatencyHistBinEdges.3.102.111.111 | \
awk -F " = " '{ print $2 }' | tr -d '\n'|od -t x1
0000000 33 44
0000002
$ getone -v2c  8.33.1.1 public docsQos3ServiceClassLatencyHistBinEdges.3.102.111.111 | \
awk -F " = " '{ print $2 }' | tr -d '\n'|od -An -t x1
 33 44

Configuration via CM Configuration File

15 edges: 0xAB01, …, 0xCF0F


Downstream Service Flow Encodings
  Service Flow Reference:2
  Quality of Service Parameter Set:provisioned admitted active
  Traffic Priority:4
  Downstream Maximum Sustained Traffic Rate:2000000000
  Maximum Traffic Burst:3044
  AQM Encodings
    SF AQM Disable:Disabled
    Classic AQM Latency Target:37
    Latency Histogram Encodings:AB01AC02AD03AE04AF05BA
06BC07BD08BE09BF0ACA0BCB0CCD0DCE0ECF0F

Configuration via DSX TLV

Dynamic flows are created by DSA. Dynamic flows are used for voice traffic and use high priority queues. They don't have AQM to collect histogram. Histogram Configuration applied to dynamic flow is ignored. Histogram can be applied to static flows via DSC.

Configuration via MIB Histogram Configuration Table Entry

# change edge while row is active
$ getmany -v2c 8.32.1.1 public docsQos3SfLatencyHistCfgEntry
docsQos3SfLatencyHistCfgStatus.1049.12 = active(1)
docsQos3SfLatencySfLabel.1049.12 = 
docsQos3SfLatencyBin1UpperEdge.1049.12 = 4386
docsQos3SfLatencyBin2UpperEdge.1049.12 = 0
…
docsQos3SfLatencyBin15UpperEdge.1049.12 = 0
docsQos3SfLatencyBinEdgeNum.1049.12 = 1

$ setany -v2c 8.32.1.1 public docsQos3SfLatencyBin1UpperEdge.1049.12 4387
docsQos3SfLatencyBin1UpperEdge.1049.12 = 4387

$ getone -v2c 8.32.1.1 public docsQos3SfLatencyBin1UpperEdge.1049.12
docsQos3SfLatencyBin1UpperEdge.1049.12 = 4387

# sfid can be found in scm <mac> service-flow

# to find snmp ifidx for an MD
$ getmany -v2c 8.33.1.1 public ifDescr | grep  "= Cable1/0/0$"
ifDescr.1049 = Cable1/0/0

# show cable dp ds-lat-hist will also show both snmp ifidx and sfid

Events Affecting docsQos3SfLatencyHistCfgEntry

  • Events from CLC

    • Flows add may carry histogram configuration from cm configuration file and service class.

    • Flow delete

    • Histogram configuration update from dsx

  • Events from SNMP agent

    • Mib-set status: active, destroy, notInService

    • mib-set edges: when row status is active, edges must be in valid ascending order; when row status is notInService, edges don't need to be in ascending order.

Use Cases for Histogram Configuration Entry

  • MIB-GET without MIB-SET can return valid entry that is created by CM registration.

  • You can first set status to notInService (provision), change edges (transit edge values can be invalid), and when ready, set status to active.

  • During provision, mib-get should return transit Configuration.

  • During provision, if CLC sends new Configuration, Mib-get should return Configuration from CLC,

  • You can change edges when status is active (as long as edges are valid).

  • You can delete the entry by SF delete or set entry status to delete.

Histogram Limit

The maximum flows that can have histogram that is configured is 64K. To control histogram scale, a configurable ”limit” can be set between 0-64K. The default is 4K. When limit is crossed, hist-cfg is rejected, and errmsg is generated.

The following example shows a sample configuration:

Router#configure terminal
Router(config)#cable ds-lat-hist limit 1
Router(config)#end

Latency Stats Query

SNMP:

  • docsQos3SfLatencyStatsEntry

CLI:

  • Use the show cable dp ds-lat-hist command to display latency histogram. The following example displays a sample output.

    !!! there are total of 64 downstream flows; 2 have histogram configured.
    !!! Limit is set to 4K. Supported max capacity is 64K.
    !!! ifIndex is snmp_if_index.
    
    Router#show cable dp ds-lat-hist
    
    Total=2 Limit=4096 Capacity=65536 Flows=64
    
    MAC Address    MD-I/F  ifIndex sfid  hwid  upd-num  max(ms) range(ms)       packets
    0025.2eaf.63a2 C1/0/0  1049    12    2665  123.456K 123.45    0.00 -  43.86 123
                                                                 43.86 - Inf.   123456
    0025.2eaf.63a2 C1/0/0  1049    13    2666  123.456M 655.35    0.00 -  43.86 123
                                                                 43.86 - 131.24 123456
                                                                131.24 - Inf.   1234
    
  • Use the show cable dp aqm inf command to display aqm info and latency in hist-db. The following example displays a sample output.

    !!! Histogram stats are set via test command. This is to illustrate the show command output format. The histogram values do not match target latency.
    Router#show cable dp aqm c1/0/0
    MAC Address    I/F      Sfid       class-name        Length/Max     Dequeues   qDrops     rDrops     pDrops     Target        Downstream-Service-Flow-Latency-Stats
                                                                                                                    Latency(ms)  updt_num Max(ms) Range Lo-Hi(ms) packets
    0025.2eaf.63a2 Ca1/0/0  12         class-default          0/511     0          0          0          0          15           123.456K  123.45   0.00 -  43.86 123
                                                                                                                                                   43.86 - Inf.   123456
    0025.2eaf.63a2 Ca1/0/0  13         2--class-map           0/511     0          0          0          0          14           123.456M  655.35   0.00 -  43.86 123
                                                                                                                                                   43.86 - 131.24 123456
                                                                                                                                                  131.24 - Inf.   1234
    0025.2eaf.638e Ca1/0/0  1559       class-default          0/63      0          0          0          0          15         
    0025.2eaf.638e Ca1/0/0  1560       2--class-map           0/63      0          0          0          0          14         
    
  • Use the show cable modem mac verbose command to display histogram info in docsis sf, dp sf, and hist-db. The following example displays a sample output.

    !!! Show hist info in docsis sf, dp sf, dp hist-db
    Router#show cable modem 0025.2e2d.7648 service-flow verbose 
    …
    DS Latency Histogram Info (dp-flow)
     Edge Num: 1
     Edge Val: 4386 (1122) 0    (0000) 0    (0000) 0    (0000) 0    (0000) 
               0    (0000) 0    (0000) 0    (0000) 0    (0000) 0    (0000) 
               0    (0000) 0    (0000) 0    (0000) 0    (0000) 0    (0000) 
    DS Latency Histogram DB [slot:1 md:0 sfid:12]
     [CP-KEY] slot:1 md:0 sid:12
     [DP-KEY] slot:1 hwid:2609(0xA31)
     [  CM  ] 0025.2e2d.7648 CM1/0/0:1
     [ HIST ] edge_num:1 bin_num:0
              update num: 0
              latency max:   0.00 msec
                range in msec    |  packets
              -----------------------------
              [  0.00 -  43.86)  |  0
              [ 43.86 - Inf.  )  |  0 
    DS Latency Histogram Cfg (docsis-flow-sup)
     Edge Num: 1
     Edge Val: 4386 (1122) 0    (0000) 0    (0000) 0    (0000) 0    (0000) 
               0    (0000) 0    (0000) 0    (0000) 0    (0000) 0    (0000) 
               0    (0000) 0    (0000) 0    (0000) 0    (0000) 0    (0000)    
  • Use the show interface md service-flow sfid verbose command to display histogram info in IIOS DP SF instance and hist-db obj. The following example displays a sample output.

    !!! Same print function as that used by show cm sf cli
    Router#show interface c1/0/0 service-flow 12 verbose
     
    Sfid					: 12
    Mac Address				: 0025.2e2d.7648
    …
    DS Latency Histogram Info (dp-flow)
     Edge Num: 2
     Edge Val: 4387 (1123) 4487 (1187) 0    (0000) 0    (0000) 0    (0000) 
               0    (0000) 0    (0000) 0    (0000) 0    (0000) 0    (0000) 
               0    (0000) 0    (0000) 0    (0000) 0    (0000) 0    (0000) 
               
     
    DS Latency Histogram DB [slot:1 md:0 sfid:12]
     [CP-KEY] slot:1 md:0 sid:12
     [DP-KEY] slot:1 hwid:2609(0xA31)
     [  CM  ] 0025.2e2d.7648 CM1/0/0:1
     [ HIST ] edge_num:2 bin_num:3
              update num: 7890000000
              latency max:  45.67 msec
                range in msec    |  packets
              -----------------------------
              [  0.00 -  43.87)  |  567898765
              [ 43.87 -  44.87)  |  123
              [ 44.87 - Inf.  )  |  456
    

SF Latency Stats MIB-GET

$ getmany -v2c 8.32.1.1 public docsQos3SfLatencyStatsEntry
docsQos3SfLatencyMaxLatency.1049.12 = 4567
docsQos3SfLatencyNumHistUpdates.1049.12 = 7890000000
docsQos3SfLatencyBin1Pkts.1049.12 = 567898765
docsQos3SfLatencyBin2Pkts.1049.12 = 123
docsQos3SfLatencyBin3Pkts.1049.12 = 456
docsQos3SfLatencyBin4Pkts.1049.12 = 0
docsQos3SfLatencyBin5Pkts.1049.12 = 0
docsQos3SfLatencyBin6Pkts.1049.12 = 0
docsQos3SfLatencyBin7Pkts.1049.12 = 0
docsQos3SfLatencyBin8Pkts.1049.12 = 0
docsQos3SfLatencyBin9Pkts.1049.12 = 0
docsQos3SfLatencyBin10Pkts.1049.12 = 0
docsQos3SfLatencyBin11Pkts.1049.12 = 0
docsQos3SfLatencyBin12Pkts.1049.12 = 0
docsQos3SfLatencyBin13Pkts.1049.12 = 0
docsQos3SfLatencyBin14Pkts.1049.12 = 0
docsQos3SfLatencyBin15Pkts.1049.12 = 0
docsQos3SfLatencyBin16Pkts.1049.12 = 0

OIDs from DOCS-QOS3-MIB

docsQos3ServiceClassEntry 1.3.6.1.4.1.4491.2.1.21.1.8.1

docsQos3SfLatencyHistCfgEntry 1.3.6.1.4.1.4491.2.1.21.1.29.1.1

docsQos3SfLatencyStatsEntry 1.3.6.1.4.1.4491.2.1.21.1.29.2.1

Error Message

  • CBR_DP_HIST_LIMIT_ERR

    • It is generated when you try to apply histogram Configuration to more SFs than the configured limit.

    • It won’t affect CM online.

    • Increase limit via Configuration command.

  • CBR_DP_HIST_SEARCH_ERR

    • Generated when try to apply histogram Configuration to an SF not found in hist-db.

    • If hist-cfg is entered via mib-set, check ifidx and sfid values.

Clear Command

Use the clear cable ds-lat-hist {cfg-stat|stat-only} [md-if|cm-mac] [sfid] command to clear histogram stats.

Table 7. Clear Command

Clear Command

Description

clear cable
        ds-lat-hist stat-only

Clear histogram stats of all the ds flows

clear cable
        ds-lat-hist stat-only 1111.2222.3333

Clear all histogram stats on given CM

clear cable
        ds-lat-hist cfg-stat C1/0/0 12

Clear histogram Configuration and stat from given md/sfid

clear cable
        ds-lat-hist cfg-stat

Clear everything.

FMAN Show Commands

!!! show fman rp
show platform software object-manager r0 object-type-info | i HIST
show platform software object-manager r0 object-type-count | i HIST
!!! show fman fp
show platform software object-manager f0 object-type-count | i HIST 
!!! show fman-rp/fp db
show platform software cable r0 hist 
show platform software cable f0 hist 
!!! show fman-fp aom
show platform software cable f0 hist aom-stati

CPP-CP QoS Show Commands

Router#show platform hardware qfp active feature qos config output interface CM1/0/0:1 ds-hist-ids
Interface: CM1/0/0:1, QFP if_h: 7019, Num Targets: 1
  Target: Out, Num UIDBs: 1
    UIDB #: 0
    Hierarchy level: 0, Num matching iftgts: 1
    Policy name: 1--policy-map, Policy id: 1699264
    Parent Class Idx: 0, Parent Class ID: 0
      IF Tgt#: 0, ifh: 7019, member_ifh: 0, link_idx: 0
DS Hist IDs Table:
 
Index  CID          Class Name                        Slot_Hwid   Hash        
----------------------------------------------------------------------------
0      1593         class-default                     0x01000a31  0x000001c9  
 
Router#

CPP-CP JIB Show Commands

Router#show platform hardware qfp active cable hist slot 1 hwid 2609 
slot: 1
hwid: 2609
cp_edge_num: 2
cp_edge_val: 4387  4487  0     0     0    <<< from cpp-cp-jib hist-db
             0     0     0     0     0    
             0     0     0     0     0    
dp_ent_idx: 457, hex: 0x1c9
dp_ent_rsrc_h: 0x0111af0009080003
dp_ent_ppe_addr: 0x00000000591af000
dp_ent_slot_hwid: 0x01000a31
dp_ent_edge_num: 2
dp_ent_edge_val: 4387  4487  0     0     0    <<< from cpp exmem
                 0     0     0     0     0    
                 0     0     0     0     0    
dp_sbs_idx: 1
dp_sbs_rsrc_h: 0x0111ad0a00000003
dp_sbs_ppe_addr: 0x00000000591ad0a0
dp_sbs_upd_num: 0
dp_sbs_lat_max: 0
dp_sbs_bin_val: 0          0          0          0          0   <<< from cpp exmem      
                0          0          0          0          0         
                0          0          0          0          0         
                0         

Enabling Packet Classification for DOCSIS Compliance

Table 8. Feature History

Feature

Release Information

Feature Description

Ability to enable packet classifier in compliant with DOCSIS spec.

Cisco IOS XE Dublin 17.12.1

You can now enable the packet classifier that is provisioned already to be compliant with the DOCSIS spec. This helps to match the IPv4 type of service (ToS) or IPv6 Traffic Class (TC) value range as per the DOCSIS spec.

Starting with Cisco IOS XE Dublin 17.12.1, you can enable the packet classifier that is provisioned already to be compliant with the DOCSIS spec. This helps in achieving low-latency and ensures that the cBR-8 is in compliant with the DOCSIS spec to match the ECN bits. Explicit Congestion Notification (ECN) is a TCP or IP extension that can avoid packet loss and thus improve network performance.

The packet now matches the classifier only when the following condition is satisfied as per DOCSIS spec:

  • (low AND mask) <= (ToS/TC value AND mask) <= (high AND mask)

    Low and Mask values are lesser than or equal to the ToS or TC bits in the packet header and Mask that must be lesser than or equal to the High and Mask values.

Prior to Cisco IOS XE Dublin 17.12.1, the cBR-8 was not compliant with the DOCSIS specs.

In earlier releases, the packet matches the classifier based on the following classification condition:

  • (low AND mask) == (ToS/TC value AND mask)

    Low and Mask values are equal to the ToS or TC bits in packet header and Mask values.


Note


Prior to 17.12.1, the lowest two bits are excluded.