- Index
- Preface
- Overview
- Using the Command-Line Interface
- Getting Started with CMS
- Assigning the Switch IP Address and Default Gateway
- Managing Switch Stacks
- Clustering Switches
- Administering the Switch
- Configuring SDM Templates
- Configuring Switch-Based Authentication
- Configuring 802.1X Port-Based Authentication
- Configuring Interface Characteristics
- Configuring VLANs
- Configuring VTP
- Configuring Voice VLAN
- Configuring STP
- Configuring MSTP
- Configuring Optional Spanning-Tree Features
- Configuring IGMP Snooping and MVR
- Configuring Port-Based Traffic Control
- Configuring CDP
- Configuring UDLD
- Configuring SPAN and RSPAN
- Configuring RMON
- Configuring System Message Logging
- Configuring SNMP
- Configuring Network Security with ACLs
- Configuring QoS
- Configuring EtherChannels
- Configuring IP Unicast Routing
- Configuring HSRP
- Configuring IP Multicast Routing
- Configuring MSDP
- Configuring Fallback Bridging
- Troubleshooting
- Supported MIBs
- Working with the Cisco IOS File System, Configuration Files, and Software Images
- Unsupported Commands in Cisco IOS Release 12.1(14)EA1
Getting Started with CMS
This chapter describes the Cluster Management Suite (CMS) on Catalyst 3750 switches. It contains these topics:
•![]() Using Different Versions of CMS
Using Different Versions of CMS
It does not contain:
•![]() Procedures for using the configuration windows in CMS. The online help gives this information.
Procedures for using the configuration windows in CMS. The online help gives this information.
•![]() System requirements and procedures for browser and Java plug-in configuration. The hardware installation guide gives this information.
System requirements and procedures for browser and Java plug-in configuration. The hardware installation guide gives this information.
Refer to the appropriate switch documentation for descriptions of CMS on other Catalyst switches.
Launching CMS
Before you can launch CMS, you need to follow the steps for setting up your switch and assigning it an IP address. These instructions are in the "Quick Setup" chapter of the switch hardware installation guide.
After you complete these steps, you will enter the IP address of your switch and your password (if one has been set) in a browser window. Then the Switch Home Page opens (see Figure 3-1). To launch CMS, click Cluster Management Suite on the left side of the Switch Home Page.
Figure 3-1 Switch Home Page

The Switch Home Page has these tabs:
•![]() Express Setup—Opens the Express Setup page, on which you can configure your switch
Express Setup—Opens the Express Setup page, on which you can configure your switch
•![]() Cluster Management Suite—Launches CMS, through which you can manage the switch
Cluster Management Suite—Launches CMS, through which you can manage the switch
•![]() Tools—Accesses diagnostic and monitoring tools
Tools—Accesses diagnostic and monitoring tools
•![]() Help Resources—Provides links to the Cisco web site, technical documentation, and the Cisco Technical Assistance Center (TAC)
Help Resources—Provides links to the Cisco web site, technical documentation, and the Cisco Technical Assistance Center (TAC)
Refer to your switch hardware installation guide to find instructions for launching the Switch Home Page, including information about the Java plug-in and other requirements for using CMS.
Features
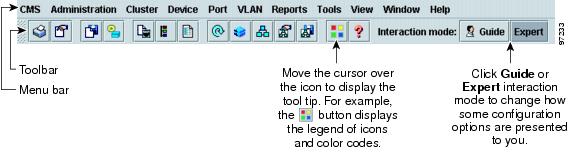
CMS has menus, a toolbar, and network views (Figure 3-2) for managing switch clusters and individual switches from web browsers such as Netscape Communicator or Microsoft Internet Explorer.
Figure 3-2 CMS Features

These network views can be displayed at the same time:
•![]() The Front Panel view, which displays the front-panel image of a specific switch or the front-panel images of all switches in a cluster. From this view, you can select multiple ports or multiple switches and configure them with the same settings.
The Front Panel view, which displays the front-panel image of a specific switch or the front-panel images of all switches in a cluster. From this view, you can select multiple ports or multiple switches and configure them with the same settings.
When CMS is launched from the command switch, the Front Panel view displays the front-panel images of all switches in the cluster. When CMS is launched from a noncommand switch, the Front Panel view displays only the front panel of the specific switch.

Note ![]() CMS from a standalone switch or from a noncommand switch is referred to as the device manager. The device manager is for configuring an individual switch. When you select the device manager, you launch a separate CMS session. The device manager interface can vary from one Catalyst switch to another.
CMS from a standalone switch or from a noncommand switch is referred to as the device manager. The device manager is for configuring an individual switch. When you select the device manager, you launch a separate CMS session. The device manager interface can vary from one Catalyst switch to another.
•![]() The Topology view, which displays a network map. It uses icons to represent switch clusters, cluster members (including switch stacks, each of which functions as a single member), cluster candidates, neighboring devices that are not eligible to join a cluster, and link types. You can select multiple switches and configure them to run with the same settings. You can also display link information in the form of link reports and link graphs.
The Topology view, which displays a network map. It uses icons to represent switch clusters, cluster members (including switch stacks, each of which functions as a single member), cluster candidates, neighboring devices that are not eligible to join a cluster, and link types. You can select multiple switches and configure them to run with the same settings. You can also display link information in the form of link reports and link graphs.
This view is available only when CMS is launched from the command switch.
The menu bar, toolbar, and popup menus give you access to configuration and management options:
•![]() The menubar provides a complete list of options for managing a single switch and switch clusters.
The menubar provides a complete list of options for managing a single switch and switch clusters.
•![]() The toolbar provides buttons for commonly used switch and cluster configuration options, the legend, and online help.
The toolbar provides buttons for commonly used switch and cluster configuration options, the legend, and online help.
•![]() The port popup menu, in the Front Panel view, provides options specific for configuring and monitoring switch ports.
The port popup menu, in the Front Panel view, provides options specific for configuring and monitoring switch ports.
•![]() The device popup menu, in either the Front Panel or the Topology views, provides switch and cluster configuration and monitoring options.
The device popup menu, in either the Front Panel or the Topology views, provides switch and cluster configuration and monitoring options.
•![]() The candidate, member, and link popup menus provide options for configuring and monitoring devices and links in the Topology view.
The candidate, member, and link popup menus provide options for configuring and monitoring devices and links in the Topology view.
CMS includes these features to simplify configuration tasks:
•![]() Interactive modes—guide mode and expert mode—to give you more control over the presentation of complex configuration options
Interactive modes—guide mode and expert mode—to give you more control over the presentation of complex configuration options
•![]() Wizards, which require minimal information from you to configure some complex features
Wizards, which require minimal information from you to configure some complex features
•![]() Comprehensive online help, which provides high-level concepts and procedures for performing tasks from configuration windows
Comprehensive online help, which provides high-level concepts and procedures for performing tasks from configuration windows
•![]() Two levels of access to the configuration options: read-write access for users who are allowed to change switch settings; read-only access for users who are only allowed to view switch settings
Two levels of access to the configuration options: read-write access for users who are allowed to change switch settings; read-only access for users who are only allowed to view switch settings
•![]() A consistent set of GUI components (tabs, buttons, drop-down lists, tables, and so on) for a uniform approach to viewing and for setting configuration parameters
A consistent set of GUI components (tabs, buttons, drop-down lists, tables, and so on) for a uniform approach to viewing and for setting configuration parameters
Front Panel View
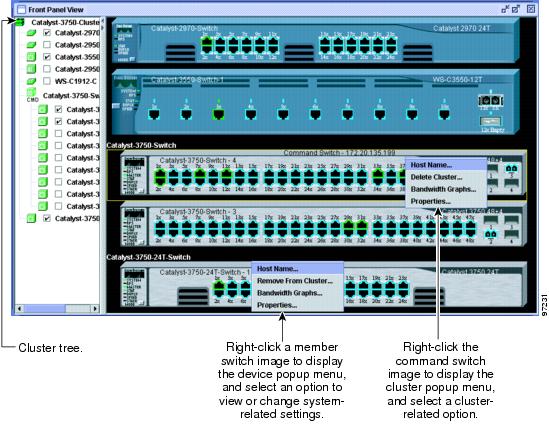
When you launch CMS from a command switch, the Front Panel view displays the front-panel images of all the switches in the cluster (Figure 3-3).
Figure 3-3 Front Panel View from a Command Switch
When you launch CMS from a standalone or noncommand member switch, the Front Panel view displays only the front panel of the specific switch (Figure 3-4).
Figure 3-4 Front Panel View from a Standalone Switch
Cluster Tree
The cluster tree (Figure 3-3) appears in the left frame of the Front Panel view and shows the name of the cluster and a list of members. If a switch stack is a member, you see its name and the stack members in a nested list. A stack member refers to the devices within a stack. The color of a stack member shows its status (Table 3-1).
If the box beside an icon is unchecked, the front-panel image that corresponds with the icon is not displayed. By checking and unchecking the boxes, you control the contents of the view.
The sequence of the icons (Figure 3-5) mirrors the sequence of the front-panel images. You can change the sequence by dragging and dropping icons or by selecting View > Front Panel.
Figure 3-5 Cluster-Tree Icons

If you want to configure switch or cluster settings on one or more switches, select the appropriate front-panel images. To select a front-panel image, click either the cluster-tree icon or the corresponding front-panel image. The front-panel image is then highlighted with a yellow outline. To select multiple front-panel images, press the Ctrl key, and left-click the cluster-tree icons or the front-panel images. To deselect an icon or image, press the Ctrl key, and left-click the icon or image.
If the cluster has many switches, you might need to scroll down the window to display the rest of the front-panel images.
Front-Panel Images
You can manage the switch from a remote station by using the front-panel images. The front-panel images are updated based on the network polling interval that you set from CMS > Preferences.
This section includes descriptions of the LED images. Similar descriptions of the switch LEDs are provided in the switch hardware installation guide.
Note ![]() The Preferences window is available if your switch access level is read-write or read-only, but you cannot change any values in read-only mode.
The Preferences window is available if your switch access level is read-write or read-only, but you cannot change any values in read-only mode.
Note ![]() For more information about the read-only access mode, see the "Access Modes in CMS" section.
For more information about the read-only access mode, see the "Access Modes in CMS" section.
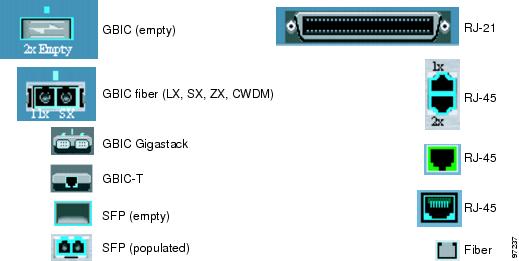
Figure 3-6 shows the port icons as they appear in the front-panel images.
Figure 3-6 Port Icons
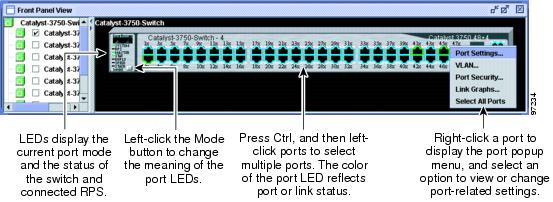
To select a port, click the port on the front-panel image. The port is then highlighted with a yellow outline. To select multiple ports, you can:
•![]() Press the left mouse button, drag the pointer over the group of ports that you want to select, and then release the mouse button.
Press the left mouse button, drag the pointer over the group of ports that you want to select, and then release the mouse button.
•![]() Press the Ctrl key, and click the ports that you want to select.
Press the Ctrl key, and click the ports that you want to select.
•![]() Right-click a port, and select Select All Ports from the port popup menu.
Right-click a port, and select Select All Ports from the port popup menu.
Table 3-2 describes the colors representing the wavelengths on the Coarse Wave Division Multiplexer (CWDM) Gigabit interface converter (GBIC) modules. For port status LED information, see the "Port Modes and LEDs" section.
|
|
|
|---|---|
1470 nanometers (nm) |
Gray |
1490 nm |
Violet |
1510 nm |
Blue |
1530 nm |
Green |
1550 nm |
Yellow |
1570 nm |
Orange |
1590 nm |
Red |
1610 nm |
Brown |
Redundant Power System LED
The redundant power system (RPS) LED shows the RPS status (Table 3-3). Certain switches in the switch cluster use a specific RPS model:
•![]() Cisco RPS 300 (model PWR300-AC-RPS-N1)—Catalyst 2900 LRE XL, Catalyst 2950, Catalyst 3524-PWR XL, and Catalyst 3550 switches
Cisco RPS 300 (model PWR300-AC-RPS-N1)—Catalyst 2900 LRE XL, Catalyst 2950, Catalyst 3524-PWR XL, and Catalyst 3550 switches
•![]() Cisco RPS 600 (model PWR600-AC-RPS)—Catalyst 2900 XL and Catalyst 3500 XL switches, except the Catalyst 2900 LRE XL and Catalyst 3524-PWR XL switches
Cisco RPS 600 (model PWR600-AC-RPS)—Catalyst 2900 XL and Catalyst 3500 XL switches, except the Catalyst 2900 LRE XL and Catalyst 3524-PWR XL switches
•![]() Cisco RPS 675 (model PWR675-AC-RPS-N1)—Catalyst 2950, Catalyst 2970, and Catalyst 3550 switches, and Catalyst 3750 switches.
Cisco RPS 675 (model PWR675-AC-RPS-N1)—Catalyst 2950, Catalyst 2970, and Catalyst 3550 switches, and Catalyst 3750 switches.
Refer to the appropriate switch hardware documentation for RPS descriptions specific for the switch.
Port Modes and LEDs
The port modes (Table 3-4) determine the type of information displayed through the port LEDs. When you change port modes, the meanings of the port LED colors (Table 3-5) also change.
Note ![]() The bandwidth utilization mode (UTIL LED) does not appear on the front-panel images. Select Reports > Bandwidth Graphs to display the total bandwidth in use by the switch. Refer to the switch hardware installation guide for information about using the UTIL LED.
The bandwidth utilization mode (UTIL LED) does not appear on the front-panel images. Select Reports > Bandwidth Graphs to display the total bandwidth in use by the switch. Refer to the switch hardware installation guide for information about using the UTIL LED.
To select or change a mode, click the Mode button until the desired mode LED is green.
You can check the status of ports by using the switch graphic on the Front Panel view. Click the Mode button on the graphic to display the STAT, SPD, FDUP, and LINE PWR settings in sequence. The port LEDs change color to reflect the setting.
If the switches are stacked and if you press the Mode button on any one of the switches in the switch stack graphic, all the switches in the switch stack also change to display the same selected mode. For example, if you press the mode button on the stack master to display SPEED, all the other switches in the switch stack will also display SPEED.
When the switch stack LED is selected, these LEDs are green when the StackWise ports are up and are amber when the ports are down:
•![]() SFP module ports LEDs 1 and 2 on the Catalyst 3750-24TS switch show the status for StackWise ports 1 and 2, respectively.
SFP module ports LEDs 1 and 2 on the Catalyst 3750-24TS switch show the status for StackWise ports 1 and 2, respectively.
•![]() SFP module ports LEDs 3 and 4 on the Catalyst 3750-48TS switch show the status for StackWise ports 1 and 2, respectively.
SFP module ports LEDs 3 and 4 on the Catalyst 3750-48TS switch show the status for StackWise ports 1 and 2, respectively.
•![]() SFP module ports LEDs 27 and 28 on the Catalyst 3750G-24TS switch show the status for StackWise ports 1 and 2, respectively.
SFP module ports LEDs 27 and 28 on the Catalyst 3750G-24TS switch show the status for StackWise ports 1 and 2, respectively.
•![]() The 10/100/1000 port LEDs 23 and 24 on the Catalyst 3750G-24T switch show the status for StackWise ports 1 and 2, respectively.
The 10/100/1000 port LEDs 23 and 24 on the Catalyst 3750G-24T switch show the status for StackWise ports 1 and 2, respectively.
VLAN Membership Modes
Ports in the Front Panel view are outlined by colors (Table 3-6) when you click Highlight VLAN Port Membership Modes on the Configure VLANs tab on the VLAN window (VLAN > VLAN > Configure VLANs). The colors show the VLAN membership mode of each port. The VLAN membership mode determines the kind of traffic the port carries and the number of VLANs it can belong to. For more information about these modes, see the "VLAN Port Membership Modes" section.
Note ![]() This feature is not supported on the Catalyst 1900 and Catalyst 2820 switches.
This feature is not supported on the Catalyst 1900 and Catalyst 2820 switches.
|
|
|
|---|---|
Static access |
Light green |
Dynamic access |
Pink |
ISL trunk |
Orange |
802.1Q trunk |
Peach |
Negotiate trunk |
White |
Topology View
The Topology view shows how the devices within a cluster are connected and how the cluster is connected to other clusters and devices. From this view, you can add and remove cluster members.
This view shows the network topology at different levels of detail:
•![]() When you right-click a cluster icon and select Expand Cluster, the Topology view displays the cluster in detail. You see the command switch, member switches (including switch stacks, each of which functions as a single stack member), and candidate switches that can join the cluster. You cannot see the details of any neighboring switch clusters (Figure 3-7).
When you right-click a cluster icon and select Expand Cluster, the Topology view displays the cluster in detail. You see the command switch, member switches (including switch stacks, each of which functions as a single stack member), and candidate switches that can join the cluster. You cannot see the details of any neighboring switch clusters (Figure 3-7).
Figure 3-7 Expanded Cluster View

•![]() When you right-click a command-switch icon and select Collapse Cluster, the cluster collapses into a single icon. You see how the cluster is connected to other clusters, candidate switches, and devices that are not eligible to join the cluster (such as routers, access points, IP phones, and so on) (Figure 3-8).
When you right-click a command-switch icon and select Collapse Cluster, the cluster collapses into a single icon. You see how the cluster is connected to other clusters, candidate switches, and devices that are not eligible to join the cluster (such as routers, access points, IP phones, and so on) (Figure 3-8).
Figure 3-8 Collapsed Cluster View

•![]() When you right-click a collapsed switch stack icon and select Expand Stack, the switch stack expands to show the links of stack members to cluster member switches and to each other (Figure 3-9).
When you right-click a collapsed switch stack icon and select Expand Stack, the switch stack expands to show the links of stack members to cluster member switches and to each other (Figure 3-9).
Figure 3-9 Expanded Switch Stack View

Note ![]() The Topology view displays only the cluster and network neighborhood of the specific command or member switch that you access. To display a different cluster, you need to access the command switch or member switch of that cluster.
The Topology view displays only the cluster and network neighborhood of the specific command or member switch that you access. To display a different cluster, you need to access the command switch or member switch of that cluster.
You can arrange the device icons in this view. To move a device icon, click and drag the icon. To select multiple device icons, you can either:
•![]() Press the left mouse button, drag the pointer over the group of device icons that you want to select, and then release the mouse button.
Press the left mouse button, drag the pointer over the group of device icons that you want to select, and then release the mouse button.
•![]() Press the Ctrl key, and click the device icons that you want to select.
Press the Ctrl key, and click the device icons that you want to select.
After selecting the icons, drag them to any area in the view.
Topology Icons and Labels
The Topology view and the cluster tree use the same set of device icons to represent clusters, Layer 3 switches, Layer 2 switches, and switch stacks. They also use the same labels to identify the command switch (CMD), the standby command switch (STBY), and the stack master (MASTER).
The Topology view uses additional icons to represent these types of neighboring devices:
•![]() Customer premises equipment (CPE) devices that are connected to Long-Reach Ethernet (LRE) switches
Customer premises equipment (CPE) devices that are connected to Long-Reach Ethernet (LRE) switches
•![]() Devices that are not eligible to join the cluster, such as Cisco IP phones, Cisco access points, and Cisco Discovery Protocol (CDP)-capable hubs and routers
Devices that are not eligible to join the cluster, such as Cisco IP phones, Cisco access points, and Cisco Discovery Protocol (CDP)-capable hubs and routers
Note ![]() The System Switch Processor (SSP) card in the Cisco Integrated Communications System (ICS) 7750 appears as a Layer 2 switch. SSP cards are not eligible to join switch clusters.
The System Switch Processor (SSP) card in the Cisco Integrated Communications System (ICS) 7750 appears as a Layer 2 switch. SSP cards are not eligible to join switch clusters.
•![]() Devices that are unknown, such as some Cisco devices and third-party devices
Devices that are unknown, such as some Cisco devices and third-party devices

Tip ![]() Neighboring devices are only displayed if they are connected to cluster members. To display neighboring devices in the Topology view, either add a switch to which they are connected to the cluster, or enable that switch as a command switch.
Neighboring devices are only displayed if they are connected to cluster members. To display neighboring devices in the Topology view, either add a switch to which they are connected to the cluster, or enable that switch as a command switch.
Note ![]() Candidate switches are distinguished by the color of their device label. Device labels and their colors are described in the "Colors in the Topology View" section.
Candidate switches are distinguished by the color of their device label. Device labels and their colors are described in the "Colors in the Topology View" section.
To select a device, click the icon. The icon is then highlighted. To select multiple devices, you can either:
•![]() Press the left mouse button, drag the pointer over the group of icons that you want to select, and release the mouse button.
Press the left mouse button, drag the pointer over the group of icons that you want to select, and release the mouse button.
•![]() Press the Ctrl key and click the icons that you want to select.
Press the Ctrl key and click the icons that you want to select.
The Topology view also uses a set of link icons to show the link type and status between two devices. To select a link, click it. To select multiple links, press the Ctrl key, and click the links.
Device and Link Information
The Topology view displays this device and link information:
•![]() Cluster and switch names
Cluster and switch names
•![]() Switch MAC and IP addresses
Switch MAC and IP addresses
•![]() Link type between the devices
Link type between the devices
•![]() Link speed and IDs of the interfaces on both ends of the link
Link speed and IDs of the interfaces on both ends of the link
In some cases, there are limitations on what is displayed:
•![]() IP addresses are displayed only for the command switch and member switches.
IP addresses are displayed only for the command switch and member switches.
•![]() For a neighboring cluster, only the IP address of the command switch is displayed.
For a neighboring cluster, only the IP address of the command switch is displayed.
•![]() The displayed link speeds are the actual link speeds except on the LRE links, which display the administratively assigned speed settings.
The displayed link speeds are the actual link speeds except on the LRE links, which display the administratively assigned speed settings.
To choose the information you want to see, use the Topology Options window, which is displayed by selecting View > Topology Options.
Colors in the Topology View
The colors of the Topology view icons show the status of the devices and links (Table 3-7, Table 3-8, and Table 3-9).
|
|
|
|---|---|
Green |
The device is operating. |
Yellow1 |
The internal fan of the switch is not operating, or the switch is receiving power from an RPS. |
Red1 |
The device is not operating. |
1 Available only on the cluster members. |
|
|
|
|---|---|
Green |
Active link |
Red |
Down or blocked link |
The color of a device label shows the cluster membership of the device (Table 3-10).
Topology Display Options
You can set the type of information displayed in the Topology view by changing the settings in the Topology Options window. To display this window, select View > Topology Options. From this window, you can select:
•![]() Device icons (including IP Phones, CPEs, Neighbors, Access Points, and Candidates) that you want displayed in or filtered from the Topology View window
Device icons (including IP Phones, CPEs, Neighbors, Access Points, and Candidates) that you want displayed in or filtered from the Topology View window
•![]() Interface IDs and Actual Speed values that you want displayed in the Link window
Interface IDs and Actual Speed values that you want displayed in the Link window
•![]() Host Names, IP addresses, and MAC address labels that you want displayed in the Node window
Host Names, IP addresses, and MAC address labels that you want displayed in the Node window
Menus and Toolbar
The configuration and monitoring options for configuring switches and switch clusters are available from menus and a toolbar.
Menu Bar
The menu bar provides the complete list of options for managing a cluster. These options can vary:
•![]() A Catalyst 3750 switch can run the standard multilayer software image (SMI) or the enhanced multilayer image (EMI). Table 3-11 identifies the options available if the switch is running the EMI.
A Catalyst 3750 switch can run the standard multilayer software image (SMI) or the enhanced multilayer image (EMI). Table 3-11 identifies the options available if the switch is running the EMI.
•![]() Access modes affect the availability of features on CMS. Table 3-11 identifies which options are affected by your access mode: read-only (access level 1-14) and read-write (access level 15). For more information about access modes, see the "Access Modes in CMS" section.
Access modes affect the availability of features on CMS. Table 3-11 identifies which options are affected by your access mode: read-only (access level 1-14) and read-write (access level 15). For more information about access modes, see the "Access Modes in CMS" section.
•![]() The option for enabling a command switch is only available from a CMS session launched from a command-capable switch.
The option for enabling a command switch is only available from a CMS session launched from a command-capable switch.
•![]() Cluster management tasks, such as upgrading the software of groups of switches, are available only from a CMS session that is launched from a command switch.
Cluster management tasks, such as upgrading the software of groups of switches, are available only from a CMS session that is launched from a command switch.
•![]() If you launch CMS from a specific switch, the menu bar displays the features supported only by that switch.
If you launch CMS from a specific switch, the menu bar displays the features supported only by that switch.
•![]() If you launch CMS from a command switch, the menu bar displays the features supported on all the switches in the cluster. (The "Cluster Command Switch Characteristics" section lists the characteristics that command switches must have. The "Standby Cluster Command Switch Characteristics" section lists the characteristics that standby command switches must have.)
If you launch CMS from a command switch, the menu bar displays the features supported on all the switches in the cluster. (The "Cluster Command Switch Characteristics" section lists the characteristics that command switches must have. The "Standby Cluster Command Switch Characteristics" section lists the characteristics that standby command switches must have.)
Table 3-11 lists the menu-bar options available from a Catalyst 3750 command switch when the cluster contains only Catalyst 3750 member switches.
|
|
|
|
|---|---|---|
|
|
||
Page Setup |
Set default document printer properties to be used when printing from CMS. |
|
Print Preview |
View the way the CMS window or help file will appear when printed. |
|
Print a CMS window or help file. |
||
Guide Mode/Expert Mode1 |
Select which interaction mode to use when you select a configuration option. |
|
Preferences2 |
Set CMS display properties, such as polling intervals, the default views to open at startup, and the color of administratively shutdown ports. |
|
|
|
||
IP Addresses2 |
Configure IP information for a switch. |
|
SNMP2 |
Enable and disable Simple Network Management Protocol (SNMP), enter community strings, and configure end stations as trap managers. |
|
System Time2 |
Configure the system time or configure the Network Time Protocol (NTP). |
|
HTTP Port2 |
Configure the Hypertext Transfer Protocol (HTTP) port number. |
|
Users and Passwords |
Configure usernames and passwords for privilege levels 0 to 15. |
|
Console Baud Rate2 |
Change the baud rate for the switch console port. |
|
MAC Addresses2 |
Enter dynamic, secure, and static addresses in a switch address table. You can also define the forwarding behavior of static addresses. |
|
ARP2 |
Display the device Address Resolution Protocol (ARP) table, and configure the ARP cache timeout setting. |
|
Save Configuration1 |
Save the configuration for the cluster or switch to Flash memory. |
|
Restore Configuration |
Restore the configuration file to one or more switches in the cluster. |
|
Software Upgrade1 |
Upgrade the software for the cluster or a switch. |
|
System Reload1 |
Reboot the switch with the latest installed software. |
|
Event Notification |
Create notification IDs that generate e-mail notifications when system events occur. |
|
|
|
||
Designate a command switch, and name a cluster. |
||
Delete a cluster. |
||
Add a candidate to a cluster. |
||
Remove a member from the cluster. |
||
Create a Hot Standby Router Protocol (HSRP) standby group to provide command-switch redundancy. |
||
Enter the number of hops away that a command switch looks for members and for candidate switches. |
||
|
|
||
Device Manager4 |
Launch Device Manager for a specific switch. |
|
Host Name1 |
Change the host name of a switch. |
|
STP2 |
Display and configure STP parameters for a switch. |
|
IGMP Snooping2 |
Enable and disable Internet Group Management Protocol (IGMP) snooping and IGMP Immediate-Leave processing on the switch. Join or leave multicast groups, and configure multicast routers. |
|
802.1X1 |
Configure 802.1X authentication of devices as they are attached to LAN ports in a point-to-point infrastructure. |
|
Create and maintain access control lists (ACLs), and attach ACLs to specific ports. |
||
Security Wizard1 |
Filter certain traffic, such as HTTP traffic, to certain networks or devices. Restrict access to servers, networks, or application data from certain networks or devices. |
|
Inter-VLAN Routing Wizard1 |
Enable a Catalyst 3550 or 3750 switch to become a router of IP traffic between different VLANs |
|
Display submenu options to enable and disable quality of service (QoS) and to configure or modify these parameters: • • • • • • • • • |
||
Display submenu options to: • • |
||
Provide minimum information to configure IP multicast routing on a device so that it can forward multicast packets as a part of a multicast tree. |
||
Enable and configure multicast routing. |
||
Add a switch to or remove a switch from an HSRP group. |
||
Fallback Bridging2 |
Create a fallback bridging group, modify a group, delete a group, or view its details. |
|
AVVID Wizards1 |
• • • |
|
|
|
||
Port Settings2 |
Display and configure port parameters on a switch. |
|
Port Search |
Search for a port through its description. |
|
Port Security1 |
Enable port security on a port. |
|
EtherChannels2 |
Group ports into logical units for high-speed links between switches. |
|
SPAN2 |
Enable Switch Port Analyzer (SPAN) port monitoring. |
|
Protected Port2 |
Configure a port to prevent it from receiving bridged traffic from another port on the same switch. |
|
Flooding Control2 |
Block the normal flooding of unicast and multicast packets, and enable the switch to block packet storms. |
|
|
|
||
Display VLAN membership, assign ports to VLANs, and configure Inter-Switch Link (ISL) and 802.1Q trunks. Display and configure the VLAN Trunking Protocol (VTP) for interswitch VLAN membership. |
||
Management VLAN2 |
Change the management VLAN on the switch. |
|
VMPS2 |
Configure the VLAN Membership Policy Server (VMPS). |
|
VLAN Maps2 |
Configure VLAN maps. |
|
Voice VLAN2 |
Configure a port to use a voice VLAN for voice traffic, separating it from the VLANs for data traffic. |
|
|
|
||
Inventory |
Display the device type, software version, IP address, and other information about a switch. |
|
Port Statistics |
Display port statistics. |
|
Bandwidth Graphs |
Display graphs that plot the total bandwidth in use by the switch. |
|
Link Graphs |
Display a graph showing the bandwidth being used for the selected link. |
|
Link Reports |
Display the link report for two connected devices. If one device is an unknown device or a candidate, only the cluster-member side of the link displays. |
|
QoS Reports |
Display QoS reports of incoming or outgoing traffic for specific device interfaces. |
|
QoS Graphs |
Display QoS graphs of incoming or outgoing traffic for specific device interfaces. |
|
ACL Reports |
Display a report about ACL statistics. |
|
Router Reports |
Display reports with an excerpt from the routing table on the switch and the attributes of the HSRP group in which the switch participates. |
|
Multicast |
Display reports about multicast or IGMP statistics. |
|
Fallback Bridging |
Display a report of all fallback bridging groups and their attributes. |
|
System Messages |
Display the most recent system messages (Cisco IOS messages and switch-specific messages) sent by the switch software. |
|
|
|
||
Ping and Trace |
Ping a device or trace a Layer 3 route from a source address to a destination address. |
|
|
|
||
Refresh |
Update the views with the latest status. |
|
Front Panel |
Display the Front Panel view. |
|
Topology4 |
Display the Topology view. |
|
Topology Options4 |
Select the information to be displayed in the Topology view. |
|
Automatic Topology Layout4 |
Request CMS to rearrange the topology layout. |
|
Save the presentation of the cluster icons that you arranged in the Topology view to Flash memory. |
||
|
|
List the open windows in your CMS session. |
|
|
|
||
Overview |
Obtain an overview of the CMS interface. |
|
What's New |
Obtain a description of the new CMS features. |
|
Help For Active Window |
Display the help for the active open window. This is the same as clicking Help from the active window. |
|
Contents |
List all of the available online help topics. |
|
Legend |
Display the legend, which describes the icons, labels, and links. |
|
About |
Display the CMS version number. |
|
1 Not available in read-only mode. For more information about the read-only and read-write access modes, see the "Access Modes in CMS" section. 2 Some options from this menu option are not available in read-only mode. 3 Available only from a device manager session on a command-capable switch that is not a cluster member. 4 Available only from a cluster management session. 5 You can configure IGRP, EIGRP, OSPF, and multicast routing only from a switch running the EMI. |
Toolbar
The toolbar icons display commonly used switch and cluster configuration options and information windows such as legends and online help. Hover the cursor over an icon to display its use.
Table 3-12 describes the toolbar options, from left to right on the toolbar.
|
|
|
|
|
|---|---|---|---|

|
Ctrl-P |
Print a CMS window or help file. |
|
Preferences1 |

|
Ctrl-R |
Set CMS display properties, such as polling intervals, the views to open at CMS startup, and the color of administratively shutdown ports. |
Save Configuration2 |

|
Ctrl-S |
Save the configuration for the cluster or switch to Flash memory. |
Software Upgrade2 |

|
Ctrl-U |
Upgrade the software for the cluster or a switch. |
Port Settings1 |

|
- |
Display and configure port parameters on a switch. |
VLAN1 |

|
- |
Display VLAN membership, assign ports to VLANs, and configure ISL and 802.1Q trunks. |
Inventory |

|
- |
Display the device type, the software version, the IP address, and other information about a switch. |
Refresh |

|
- |
Update the views with the latest status. |
Front Panel |

|
- |
Display the Front Panel view. |
Topology3 |

|
- |
Display the Topology view. |
Topology Options3 |

|
- |
Select the information to be displayed in the Topology view. |

|
- |
Save the presentation of the cluster icons that you arranged in the Topology view to Flash memory. |
|
Legend |

|
- |
Display the legend that describes the icons, labels, and links. |
Help For Active Window |

|
F1 key |
Display the help for the active open window. This is the same as clicking Help from the active window. |
1 Not available in read-only mode. For more information about the read-only and read-write access modes, see the "Access Modes in CMS" section. 2 Some options are not available in read-only mode. 3 Available only from a cluster management session. |
Front Panel View Popup Menus
These popup menus are available in the Front Panel view.
Device Popup Menu
You can display all switch and cluster configuration windows from the menu bar, or you can display commonly used configuration windows from the device popup menu (Table 3-13). To display the device popup menu, right-click the front-panel image of a switch.
|
|
|
|---|---|
Device Manager1 |
Launch Device Manager for the switch. |
Host Name2 |
Change the name of the switch. |
Delete a cluster. |
|
Remove a member from the cluster. |
|
Bandwidth Graphs |
Display graphs that plot the total bandwidth in use. |
Properties |
Display information about the device and port on either end of the link and the state of the link. |
1 Available from a cluster member switch but not from the command switch. 2 Not available in read-only mode. For more information about the read-only mode, see the "Access Modes in CMS" section. 3 Available only from the command switch. 4 Available only from a cluster-management session. |
Port Popup Menu
You can display all port configuration windows from the Port menu on the menu bar, or you can display commonly used port configuration windows from the port popup menu (Table 3-14). To display the port popup menu, right-click a port image.
|
|
|
|---|---|
Port Settings1 |
Display and configure port settings. |
VLAN1 |
Define the VLAN mode for a port or ports and add ports to VLANs. |
Port Security1 2 |
Enable port security on a port. |
Link Graphs3 |
Display a graph showing the bandwidth used by the selected link. |
Select All Ports |
Select all ports on the switch for global configuration. |
1 Some options from this menu option are not available in read-only mode. 2 Available on switches that support the Port Security feature. 3 Available only when there is an active link on the port (that is, the port LED is green when in port status mode). |
Topology View Popup Menus
These popup menus are available in the Topology view.
Link Popup Menu
You can display reports and graphs for a specific link displayed in the Topology view (Table 3-15). To display the link popup menu, right-click the link icon.
The Link Report and Link Graph options are not available if these devices are at both ends of the link:
•![]() Candidate switches
Candidate switches
•![]() Catalyst 1900 and Catalyst 2820 switches
Catalyst 1900 and Catalyst 2820 switches
•![]() Devices that are not eligible to join the cluster
Devices that are not eligible to join the cluster
If multiple links connect two devices or if a link connects to a collapsed icon, the Logical Link Content window appears when you right-click the link icon (Figure 3-10). Right-click a link icon in this window to display the link popup menu for the link.
Figure 3-10 Logical Link Content Window

Device Popup Menus
Specific devices in the Topology view display a specific popup menu:
•![]() Cluster (Table 3-16)
Cluster (Table 3-16)
•![]() Command switch (Table 3-17)
Command switch (Table 3-17)
•![]() Member or standby command switch (Table 3-18)
Member or standby command switch (Table 3-18)
•![]() Device member of a switch stack (Table 3-19)
Device member of a switch stack (Table 3-19)
•![]() Candidate switch with an IP address (Table 3-20)
Candidate switch with an IP address (Table 3-20)
•![]() Candidate switch without an IP address (Table 3-21)
Candidate switch without an IP address (Table 3-21)
•![]() Neighboring devices (Table 3-22)
Neighboring devices (Table 3-22)
Note ![]() The device manager option in these popup menus is available in read-only mode on Catalyst 2900 XL and Catalyst 3500 XL switches running Cisco IOS Release 12.0(5)WC2 and later. It is also available on Catalyst 2950 switches running Cisco IOS Release 12.1(6)EA2 and later and on Catalyst 3550 switches running Cisco IOS Release 12.1(8)EA1 or later. It is not available on the Catalyst 1900 and Catalyst 2820 switches.
The device manager option in these popup menus is available in read-only mode on Catalyst 2900 XL and Catalyst 3500 XL switches running Cisco IOS Release 12.0(5)WC2 and later. It is also available on Catalyst 2950 switches running Cisco IOS Release 12.1(6)EA2 and later and on Catalyst 3550 switches running Cisco IOS Release 12.1(8)EA1 or later. It is not available on the Catalyst 1900 and Catalyst 2820 switches.
To display a device popup menu, right-click an icon.
|
|
|
|---|---|
Expand cluster |
View a cluster-specific topology view. |
Properties |
Display information about the device. |
|
|
|
|---|---|
Collapse cluster |
View the neighborhood outside a specific cluster. |
Host Name1 |
Change the host name of a switch. |
Bandwidth Graphs |
Display graphs that plot the total bandwidth in use by the switch. |
Properties |
Display information about the device. |
1 Not available in read-only mode. For more information about the read-only and read-write access modes, see the "Access Modes in CMS" section. |
|
|
|
|---|---|
Remove from Cluster1 |
Remove a member from the cluster. |
Host Name1 |
Change the host name of a switch. |
Device Manager2 |
Launch Device Manager for a switch. |
Bandwidth Graphs |
Display graphs that plot the total bandwidth in use by the switch. |
Properties |
Display information about the device. |
1 Available only from a cluster-management session. 2 Available from a cluster member switch but not from the command switch. |
|
|
|
|---|---|
Expand Stack |
View all the members of a switch stack. |
Host Name1 |
Change the host name of the switch stack. |
Bandwidth Graphs |
Display graphs that plot the total bandwidth in use by the switch stack. |
Properties |
Display information about the switch stack. |
1 Available only from a cluster-management session. |
|
|
|
|---|---|
Add to Cluster1 |
Add a candidate to a cluster. |
Device Manager2 |
Launch Device Manager for a switch. |
Properties |
Display information about the device. |
1 Not available in read-only mode. For more information about the read-only and read-write access modes, see the "Access Modes in CMS" section. 2 Available from a cluster member switch but not from the command switch. |
|
|
|
|---|---|
Add to Cluster1 |
Add a candidate to a cluster. |
Properties |
Display information about the device. |
1 Not available in read-only mode. For more information about the read-only and read-write access modes, see the "Access Modes in CMS" section. |
|
|
|
|---|---|
Device Manager1 |
Access the web management interface of the device. Note |
Disqualification Code |
Display the reason why the device could not join the cluster. |
Properties |
Display information about the device. |
1 Available from a cluster member switch but not from the command switch. |
Interaction Modes
You can change the interaction mode of CMS to either guide or expert mode. Guide mode steps you through each feature option and gives information about it. Expert mode displays a configuration window in which you configure all the feature options together.
Guide Mode
Note ![]() Guide mode is not available if your switch access level is read-only. For more information about the read-only access mode, see the "Access Modes in CMS" section.
Guide mode is not available if your switch access level is read-only. For more information about the read-only access mode, see the "Access Modes in CMS" section.
Guide mode is for users who want a step-by-step approach for completing a specific configuration task. It is not available for all features. A menu-bar option that has a person icon means that guide mode is available for that option.
When you click Guide Mode and then select a menu-bar option that supports guide mode, CMS displays a specific option of the feature with information about it. To configure the feature, you provide the information that CMS requests in each step until you click Finish in the last step. Clicking Cancel at any time closes and ends the configuration task without applying any changes.
If Expert Mode is selected and you want to use guide mode, you must click Guide Mode before selecting an option from the menu bar, tool bar, or popup menu. If you change the interaction mode after selecting a configuration option, the mode change does not take effect until you select another configuration option.
Expert Mode
Expert mode is for users who prefer to display all the options of a feature in a single CMS window. Click the Help button to get information about the options that are available.
Wizards
Note ![]() Wizards are not available if your switch access level is read-only. For more information about the read-only access mode, see the "Access Modes in CMS" section.
Wizards are not available if your switch access level is read-only. For more information about the read-only access mode, see the "Access Modes in CMS" section.
Wizards simplify some configuration tasks on the switch. Similar to the guide mode, wizards take a step-by-step approach to completing a specific configuration task. Unlike guide mode, a wizard does not prompt you to provide information for all of the feature options. Instead, it prompts you for minimal information and then uses the default settings of the remaining options to set up default configurations.
Wizards are not available for all features. A menu-bar option that says Wizard means that it launches the wizard for that feature.
Tool Tips
CMS displays a popup message when you move your mouse over these devices:
•![]() A yellow device icon in the cluster tree or in Topology view
A yellow device icon in the cluster tree or in Topology view
A popup displays a fault message, such as that the RPS is faulty or that the switch is unavailable because you are in read-only mode.
•![]() A red device icon in the cluster tree or in Topology view
A red device icon in the cluster tree or in Topology view
A popup displays a message that the switch is down.
If you move your mouse over a table column heading, a popup displays the full heading.
Online Help
CMS has an online help system with many features to help you perform configuration and monitoring tasks from the CMS windows (Figure 3-11). These features include:
•![]() Background information and concepts, available from the menu bar by selecting Help > Contents
Background information and concepts, available from the menu bar by selecting Help > Contents
•![]() Task steps for configuration windows, available by clicking Help in the window
Task steps for configuration windows, available by clicking Help in the window
•![]() An index of online help topics
An index of online help topics
•![]() A glossary of terms used in the online help
A glossary of terms used in the online help
You can send us feedback about the online help. Click Feedback to display an online form. After completing the form, click Submit to send your comments to Cisco. We appreciate and value your comments.
Figure 3-11 Online Help Features

CMS Window Components
CMS windows present configuration information. Figure 3-12 shows the components of a typical CMS window.
Figure 3-12 CMS Window Components

Host Name List
To display or change the configuration of a cluster member, you need to select the specific switch from the Host Name drop-down list. The list appears in the configuration window of each feature and lists only the cluster members that support that feature. For example, the Host Name list on the VLAN window would not include Catalyst 1900 and Catalyst 2820 switches even if they were part of the cluster. Similarly, the Host Name list on the LRE Profiles window would list only the LRE switches in the cluster.
Tabs, Lists, and Tables
Some CMS windows have tabs that present different sets of information. Tabs are arranged like folder headings across the top of the window. Click the tab to display its information.
Listed information can often be changed by selecting an item from a list. To change the information, select one or more items, and click Modify. Changing multiple items is limited to those items that apply to at least one of the selections.
Some CMS windows present information in a table format. You can edit the information in these tables.
Note ![]() To display an incomplete column heading, you can resize the width of the column or hover your cursor over the heading to display a popup description.
To display an incomplete column heading, you can resize the width of the column or hover your cursor over the heading to display a popup description.
Table Filtering
When you click Filter in a CMS window that contains a table, the Filter Editor window appears. The column names in the table become the field names in this window. You can enter selection criteria in these fields to display only the table rows that interest you. For procedures on using the Filter Editor window, refer to the online help.
Buttons
These are the most common buttons that you use to change the information in a CMS window:
•![]() OK—Save any changes and close the window. If you made no changes, the window closes. If CMS detects errors in your entry, the window remains open. For more information about error detection, see the "Error Checking" section.
OK—Save any changes and close the window. If you made no changes, the window closes. If CMS detects errors in your entry, the window remains open. For more information about error detection, see the "Error Checking" section.
•![]() Apply—Save any changes made in the window and leave the window open. If you made no changes, the Apply button is disabled.
Apply—Save any changes made in the window and leave the window open. If you made no changes, the Apply button is disabled.
•![]() Refresh—Update the CMS window with the latest status of the device. Unsaved changes are lost.
Refresh—Update the CMS window with the latest status of the device. Unsaved changes are lost.
•![]() Cancel—Do not save any changes made in the window and close the window.
Cancel—Do not save any changes made in the window and close the window.
•![]() Help—Display procedures on performing tasks from the window.
Help—Display procedures on performing tasks from the window.
•![]() Modify—Display the secondary window for changing information on the selected item or items. You usually select an item from a list or table and click Modify.
Modify—Display the secondary window for changing information on the selected item or items. You usually select an item from a list or table and click Modify.
Accessing CMS
This section assumes the following:
•![]() You know the IP address and password of the command switch or a specific switch. This information is either:
You know the IP address and password of the command switch or a specific switch. This information is either:
–![]() Assigned to the switch by following the Express Setup program, as described in the hardware installation guide.
Assigned to the switch by following the Express Setup program, as described in the hardware installation guide.
–![]() Changed on the switch by following the information in the "Assigning Switch Information" section and the "Preventing Unauthorized Access to Your Switch" section. Considerations for assigning IP addresses and passwords to a command switch and cluster members are described in the "IP Addresses" section and the "Passwords" section.
Changed on the switch by following the information in the "Assigning Switch Information" section and the "Preventing Unauthorized Access to Your Switch" section. Considerations for assigning IP addresses and passwords to a command switch and cluster members are described in the "IP Addresses" section and the "Passwords" section.
•![]() You know your access privilege level to the switch (see the "Access Modes in CMS" section).
You know your access privilege level to the switch (see the "Access Modes in CMS" section).
•![]() You have referred to the hardware installation guide for system requirements and have followed the procedures in that guide.
You have referred to the hardware installation guide for system requirements and have followed the procedures in that guide.

Note ![]() If you have configured the Terminal Access Controller Access Control System Plus (TACACS+) or Remote Authentication Dial-In User Service (RADIUS) feature on the switch, you can still access the switch through CMS. For information about how inconsistent authentication configurations in switch clusters can affect access through CMS, see the "TACACS+ and RADIUS" section.
If you have configured the Terminal Access Controller Access Control System Plus (TACACS+) or Remote Authentication Dial-In User Service (RADIUS) feature on the switch, you can still access the switch through CMS. For information about how inconsistent authentication configurations in switch clusters can affect access through CMS, see the "TACACS+ and RADIUS" section.
Access Modes in CMS
CMS has two levels of access to the configuration options, read-write access and read-only access, and privilege levels from 0 to 15. This is how access levels and privilege levels are related:
•![]() Privilege level 15 gives you read-write access to CMS.
Privilege level 15 gives you read-write access to CMS.
•![]() Privilege levels 1 to 14 give you read-only access to CMS. Any options in the CMS windows, menu bar, toolbar, and popup menus that change the switch or cluster configuration are not shown.
Privilege levels 1 to 14 give you read-only access to CMS. Any options in the CMS windows, menu bar, toolbar, and popup menus that change the switch or cluster configuration are not shown.
•![]() Privilege level 0 denies access to CMS.
Privilege level 0 denies access to CMS.
If you do not include a privilege level when you access CMS, the switch verifies that you have privilege-level 15. If you do not, you are denied access to CMS. If you do have privilege-level 15, you are granted read-write access. Therefore, you do not need to include the privilege level if it is 15. Entering zero denies access to CMS. For more information about privilege levels, see the "Preventing Unauthorized Access to Your Switch" section.
If your cluster has these member switches running earlier software releases and if you have read-only access to them, some configuration windows for the switches display incomplete information:
•![]() Catalyst 2900 XL or Catalyst 3500 XL member switches running Cisco IOS Release 12.0(5)WC2 or earlier
Catalyst 2900 XL or Catalyst 3500 XL member switches running Cisco IOS Release 12.0(5)WC2 or earlier
•![]() Catalyst 2950 member switches running Cisco IOS Release 12.0(5)WC2 or earlier
Catalyst 2950 member switches running Cisco IOS Release 12.0(5)WC2 or earlier
•![]() Catalyst 3550 member switches running Cisco IOS Release 12.1(6)EA1 or earlier
Catalyst 3550 member switches running Cisco IOS Release 12.1(6)EA1 or earlier
For more information about this limitation, refer to the release notes.
These switches do not support read-only mode on CMS:
•![]() Catalyst 1900 and Catalyst 2820
Catalyst 1900 and Catalyst 2820
•![]() Catalyst 2900 XL switches with 4-MB CPU DRAM
Catalyst 2900 XL switches with 4-MB CPU DRAM
In read-only mode, these switches appear as unavailable devices and cannot be configured from CMS.
HTTP Access to CMS
CMS uses HTTP, an in-band form of communication with the switch through an Ethernet port. HTTP allows switch management from a standard web browser. The default HTTP port is 80.
If you change the HTTP port, you must include the new port number when you enter the IP address in the browser Location or Address field (for example, http://10.1.126.45:184, where 184 is the new HTTP port number).
Do not disable or misconfigure the port through which your management station is communicating with the switch. You might want to write down the port number to which you are connected. Changes to the switch IP information should be done with care.
For information about connecting to a switch port, refer to the switch hardware installation guide.
Verifying Your Changes
CMS provides notification cues to help you track and confirm the changes you make.
Change Notification
A green border around a field or table cell means that you made an unsaved change to the field or table cell. Previous information in that field or table cell is displayed in the window status bar. When you save the changes or if you cancel the change, the green border disappears.
Error Checking
A red border around a field means that you entered invalid data in the field. An error message appears in the window status bar. When you enter valid data in the field, a green border replaces the red border until you either save or cancel the change.
If there is an error in communicating with the switch or if you make an error while performing an action, a message notifies you about the error.
Saving Your Configuration
Note ![]() The Save Configuration option is not available if your switch access level is read-only. For more information about the read-only access mode, see the "Access Modes in CMS" section.
The Save Configuration option is not available if your switch access level is read-only. For more information about the read-only access mode, see the "Access Modes in CMS" section.
Tip ![]() As you make cluster configuration changes (except for changes to the Topology view and in the Preferences window), make sure that you periodically save the configuration from the command switch. The configuration is saved on the command and member switches.
As you make cluster configuration changes (except for changes to the Topology view and in the Preferences window), make sure that you periodically save the configuration from the command switch. The configuration is saved on the command and member switches.
The front-panel images and CMS windows always display the running configuration of the switch. When you make a configuration change to a switch or switch cluster, the change becomes part of the running configuration. The change does not automatically become part of the configuration file, which is the startup configuration used each time the switch restarts. If you do not save your changes, they are lost when the switch restarts.
Note ![]() Catalyst 1900 and Catalyst 2820 switches automatically save configuration changes to Flash memory as they occur.
Catalyst 1900 and Catalyst 2820 switches automatically save configuration changes to Flash memory as they occur.
For CMS procedures for saving your switch configuration, refer to the online help.
Restoring Your Configuration
After you save a switch configuration, you might restore the configuration to one or more switches for these reasons:
•![]() You made an incorrect change to the current running configuration and want to reload a saved configuration.
You made an incorrect change to the current running configuration and want to reload a saved configuration.
•![]() You need to reload a switch after a switch failure or power failure.
You need to reload a switch after a switch failure or power failure.
•![]() You want to copy the configuration of a switch to other switches.
You want to copy the configuration of a switch to other switches.
For CMS procedures for restoring a switch configuration, refer to the online help.
CMS Preferences
When you exit from CMS, your CMS preferences are saved to your PC in a file called .cms_properties. You can copy this file to other PCs. The file is stored in a default configuration directory, such as C:\Documents and Settings\username. If you cannot locate the CMS preferences file, select Start > Search > For Files or Folders, and search for .cms_properties.
Using Different Versions of CMS
When managing switch clusters through CMS, remember:
•![]() Clusters can have a mix of switch models using different Cisco IOS releases.
Clusters can have a mix of switch models using different Cisco IOS releases.
•![]() CMS in earlier Cisco IOS releases and on different switch platforms might look and function differently from CMS in this release.
CMS in earlier Cisco IOS releases and on different switch platforms might look and function differently from CMS in this release.
When you select Device > Device Manager for a cluster member, a new browser session is launched, and the CMS version for that switch appears.
Here are examples of how CMS can differ between Cisco IOS releases and switch platforms:
•![]() On Catalyst switches running Cisco IOS Release 12.0(5)WC2 or earlier or Cisco IOS Release 12.1(6)EA1 or earlier, the CMS versions in those software releases might appear similar but are not the same as this release. For example, the Topology view in this release is not the same as the Topology view or Cluster View in those earlier software releases.
On Catalyst switches running Cisco IOS Release 12.0(5)WC2 or earlier or Cisco IOS Release 12.1(6)EA1 or earlier, the CMS versions in those software releases might appear similar but are not the same as this release. For example, the Topology view in this release is not the same as the Topology view or Cluster View in those earlier software releases.
•![]() CMS on the Catalyst 1900 and Catalyst 2820 switches is referred to as Switch Manager. Cluster management options are not available on these switches. This is the earliest version of CMS.
CMS on the Catalyst 1900 and Catalyst 2820 switches is referred to as Switch Manager. Cluster management options are not available on these switches. This is the earliest version of CMS.
Refer to the documentation specific to the switch and its Cisco IOS release for descriptions of the CMS version that you are using.
Where to Go Next
See "Administering the Switch," for information about administrative tasks.
The rest of this guide provides information about and CLI procedures for the software features supported in this release. For CMS procedures and window descriptions, refer to the online help.
 Feedback