Cisco IPCC Express Support Checklist
Available Languages
Contents
Introduction
Use the Cisco IP Contact Center (IPCC) Express support checklist for problems that relate to Cisco IPCC Express. Complete this checklist and provide the information to the Cisco Technical Assistance Center (TAC).
Prerequisites
Requirements
Cisco recommends that you have knowledge of these topics:
-
Cisco CallManager
-
Cisco IPCC Express
Components Used
The information in this document is based on these software and hardware versions:
-
All Cisco CallManager software releases
-
All Cisco IPCC Express software releases
The information in this document was created from the devices in a specific lab environment. All of the devices used in this document started with a cleared (default) configuration. If your network is live, make sure that you understand the potential impact of any command.
Conventions
Refer to Cisco Technical Tips Conventions for more information on document conventions.
Problem Descriptions
Details
-
What is the problem?
-
When does the problem occur?
-
What is the actual time of the first occurrence?
-
What is the actual time of the last occurrence?
-
-
Is this a new installation?
Yes No -
Is this an upgrade?
Yes No -
How long has the system been up prior to the first occurrence of the issue?
-
What has been changed or updated prior to the first occurrence of the issue?
-
Do you have a screen shot of the error or failure? Attach the screen shot to the case if you answer Yes.
Yes No
Network Topology
-
Do you have a network topology diagram? Attach the diagram to the case if you answer Yes.
Yes No -
Which voice gateways (models) does the network use?
-
Which switches (models) does the network use?
-
What is the VLAN configuration in the network?
-
Has Switched Port Analyzer (SPAN) or Remote SPAN (RSPAN) been implemented in the network?
Yes No -
Where are the agents that are distributed in the network?
Cisco CallManager Configuration
-
Which version of Cisco CallManager do you use?
-
Which service pack (SP) do you use?
-
Which engineering special (ES) do you use?
-
-
Which operating system (OS) version do you use for servers and agents?
-
c:\sti\stiver.exe (for Microsoft Windows 2000.2.3 and earlier)
-
c:\utils\mcsver.exe (for Microsoft Windows 2000.2.4 and later)
-
-
What is the hardware platform?
-
What is the memory?
-
What is the CPU?
-
What is the disk storage?
-
-
How many Cisco CallManagers are within the Cisco CallManager cluster?
-
What is the IP address and host name of the publisher?
-
What is the IP address and host name of the subscriber(s)?
-
Does ping or tracert run successfully from the Cisco CallManager server(s) to the Cisco IPCC Express server(s)?
Yes No -
Which dialed numbers (DNs) are used for route points with Cisco IPCC Express?
-
Which DNs are used for CTI ports with Cisco IPCC Express?
Cisco IPCC Express
-
Which version of Cisco IPCC Express do you use?
-
Which SP do you use?
-
Which ES do you use?
-
-
What is the OS version for the server and the agents?
-
c:\sti\stiver.exe (for Microsoft Windows 2000.2.3 and earlier)
-
c:\utils\mcsver.exe (for Microsoft Windows 2000.2.4 and later)
-
-
What is the hardware platform?
-
What is the memory?
-
What is the CPU?
-
What is the disk storage?
-
-
What is the CLASSPATH of the Cisco IPCC Express server?
-
Does ping or tracert run successfully from Cisco IPCC Express to Cisco CallManager or to agents?
Yes No
Lightweight Directory Access Protocol (LDAP)
-
Which LDAP directory is used?
DCDirectory Active Directory iPlanet -
Is the ccndir.ini soft copy available? Attach the soft copy to the case if you answer Yes.
Yes No Note: ccndir.ini is located in the winnt\system32\ccn\ directory on the Cisco CallManager server.
Script
Do you have all the related script soft copies? Attach the soft copies to the case if you answer Yes.
| Yes | No |
Note: All the scripts are located in the repository from the Cisco IPCC Express server.
JTAPI
What is the result when you run the jview command?
Figure 1 displays the result from the jview command.
Figure 1 — jview Command 
Integrated Voice Response (IVR) Log
Have SS_TEL, SS_RM, SS_CM, SS_RMCM been checked for MIVR log facility under the Active trace level options section in trace configuration?
| Yes | No |
Note: MIVR and Java Telephony Application Programming Interface (JTAPI) logs are located in \\Program Files\wfavvid\log for Cisco IPCC Express Version 3.0 and later.
Figure 2 displays part of the trace configuration.
Figure 2 — Trace Configuration for IVR Log 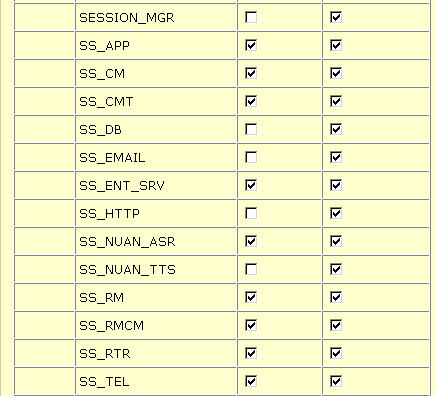
Engine Status
Do you have a screen shot of the Engine Status? Attach the screen shot to the case if you answer Yes.
| Yes | No |
Figure 3 displays the Engine Status screen shot.
Figure 3 — Engine Status 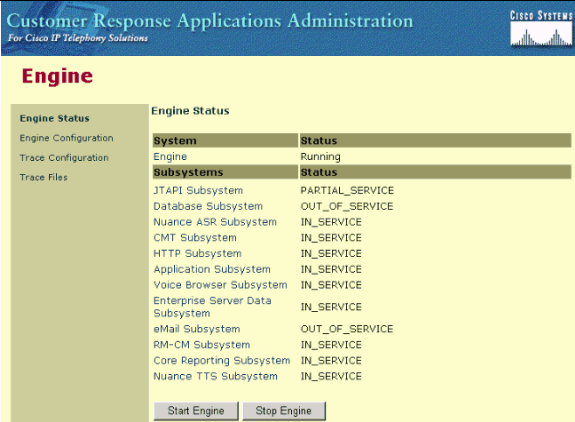
Cisco Agent Desktop Logs
Logs include listings of Cisco Agent Desktop events and errors. These events can represent actions taken by a Desktop application, implications of user-defined configuration settings, or limitations of the hardware. The error codes are brief descriptions of the events.
Cisco Agent Desktop can keep debug logs and is disabled by default. Edit the fastcalllocal.ini and supervisor.ini files to enable this capability. The number represents the highest level. All levels below the level specified are written to the debug files when you set the level. Only the numbers specified are written to the debug files when the range is set. The performance of the application is affected if you do not set the level of the debug to the default level after the information is gathered in the debug files.
Note: Section 4 of Service Information Cisco Desktop Product Suite 4.5.5 (ICD) covers details of logs and error code for Cisco Agent Desktop.
Cisco CallManager Logs
Configure Trace
Refer to Trace Configuration for procedural information about the Trace Configuration tool to configure trace parameters for Cisco CallManager services.
Trace Levels
Have the trace levels for Cisco CallManager and Synchronous Data Link (SDL) been configured, as Table 1 shows?
| Yes | No |
| Configured Service | Parameter Name | Parameter Value | Event |
|---|---|---|---|
| Cisco CallManager | Debug | Detailed | Telephony call events |
| SDL | sdltracetypeflag | CB15 | Telephony call events |
| SDL | sdltracedataflags | 110 | Telephony call events |
| SDL | sdltraceflag | True | Telephony call events |
Complete these steps to configure Cisco CallManager:
-
Select Application > Cisco CallManager Serviceability from the Cisco CallManager Administration Page.
-
Select Trace > Configuration.
-
Select the Cisco CallManager server from the Servers column.
-
Select the Cisco CallManager from the Configured Services box and select the Trace On check box.
-
Cick the down arrow in the Debug Trace Level field.
-
Click Detailed in the Debug Trace Level drop-down menu, as Figure 4 shows.
Figure 4 — Cisco CallManager Trace Configuration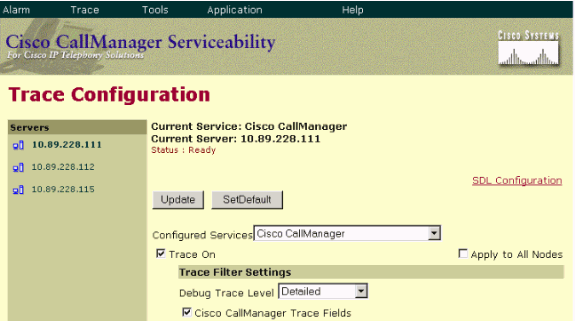
Complete these steps to configure SDL:
-
Select Service > Service Parameters from the Cisco CallManager Administration Page.
-
Click the down arrow in the Server check box and select the Cisco CallManager server.
-
Click the down arrow and select the Cisco CallManager. The Service Parameters Configuration window refreshes with the selected server and service.
-
Click Advanced and scroll down to the SDL Trace section, as Figure 5 shows.
Figure 5 — SDL Configuration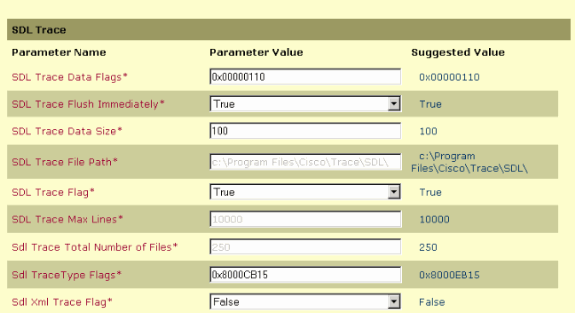
Agent/Client
-
Does ping or tracert run successfully from the agent or client to Cisco CallManager?
-
Does ping or tracert run successfully from the agent or client to Cisco IPCC Express?
Note: Agent and client-related logs are located in the \Program Files\Cisco\Desktop directory.
Remote Access
-
What is the IP address, User Name and Password for remote access to the Cisco CallManager through Microsoft Terminal Services?
-
What is the IP address, User Name and Password for remote access to Cisco IPCC Express through Microsoft Terminal Services?
Related Information
Revision History
| Revision | Publish Date | Comments |
|---|---|---|
1.0 |
22-Apr-2008 |
Initial Release |
Contact Cisco
- Open a Support Case

- (Requires a Cisco Service Contract)


 Feedback