Cisco Employees by the Numbers

Cisco is a multigenerational, multicultural community that extends around the world. There are many ways of looking at Cisco’s employees. Below are some statistical insights.

Cisco’s workforce has a wide variety of skill sets, but it can be divided broadly into engineering, sales, and other business functions.


Workforce by Job Function
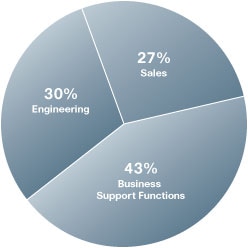
Pie chart illustrating workforce by job function. 30 percent Engineering, 27 percent Sales and 43 percent Business Support Functions.


Cisco has one of the lowest rates of voluntary employee attrition in the IT industry. The table below shows our attrition rate for the last five years.

Voluntary Employee Attrition as a Percentage of Total Employees
FY05 FY06 FY07 FY08 FY09

4.59%

5.45%

4.52%

5.01%

3.22%


During the economic downturn and subsequent slowdown in hiring, we have added new employees selectively to support the investments we are making in market adjacencies. Cisco programs such as Hiring and Interview Training help us apply inclusion and diversity principles when selecting external job candidates. When filling positions from within the company, our Talent Connection program helps us align our internal talent with Cisco’s top priorities.

Inclusion and diversity are an integral part of Cisco’s corporate culture and constitute one of our primary strengths. The following tables characterize the employees we have hired over the past four years in terms of gender and ethnicity.


New Hires by Gender (Non-U.S.)
  FY06 FY07 FY08 FY09

Total Number of Hires

3,120

4,982

4,517

2,536

Number of Female Hires

694

1,029

1,018

484

Percent of Female Hires

22%

21%

23%

19%


New Hires by Gender and Ethnicity (U.S. Only)
  FY06 FY07 FY08 FY09

Total Number of Hires

3,562

5,821

5,441

4,208

Number of Female Hires

1,014

1,712

1,643

1,034

Percent of Female Hires

28%

29%

30%

25%

Number of Non-Caucasian Hires

1,642

3,108

2,838

2,191

Percent of Non-Caucasian Hires

46%

53%

52%

52%

Total Number of Female Hires and Male and Female Non-Caucasian
Hires

2,111

3,858

3,533

1,249

Total Percent of Female Hires and Male and Female Non-Caucasian Hires

59%

66%

65%

57%


Women and Ethnic Minorities as a Percentage of the Workforce
    FY05 FY06 FY07 FY08 FY09

Women

Women as percentage of total global employees 

21.80%

22.10%

23%

23.50%

23.35%

Women in VP positions or above as percentage of global VP and above employees

13.20%

14.00%

12.70%

15.50%

15.47%

Ethnic minorities (U.S. only)

Ethnic minorities as percentage of total U.S. employees

42.30%

42.80%

43.70%

44.70%

45.58%

Ethnic minorities in VP positions or above as percentage of total U.S. VP and above employees

17.60%

17.50%

15.60%

22.20%

20.8%


Recommendations? Thoughts? Concerns? Become an active stakeholder in the Cisco CSR community by joining the conversation at JustMeans.com

  Browse highlights of this year's CSR Report
Downloads View All

Download the entire text of these report sections:

CSR and Our Employees 403 KB PDF icon

Employee Demographics 154 KB PDF icon

Pulse Survey 115 KB PDF icon


Media

Watch videos related to Cisco and our Employees

Related Videos Video icon


Questions and Comments?

Please direct any questions to citizenship@cisco.com


Share & Bookmark

Email Email

Facebook Facebook

Twitter Twitter

Linked In LinkedIn

Google icon Google

Delicious icon Delicious

RSS icon Subscribe to Environment news

RSS icon Subscribe to CSR news