Energy Optimized and Scalable Breakout Architecture for your Data Centers
Available Languages
Bias-Free Language
The documentation set for this product strives to use bias-free language. For the purposes of this documentation set, bias-free is defined as language that does not imply discrimination based on age, disability, gender, racial identity, ethnic identity, sexual orientation, socioeconomic status, and intersectionality. Exceptions may be present in the documentation due to language that is hardcoded in the user interfaces of the product software, language used based on RFP documentation, or language that is used by a referenced third-party product. Learn more about how Cisco is using Inclusive Language.
Introduction: Breakout architectures
In data center operations, the demand for increased compute capabilities and higher network speeds is rapidly escalating, driven by ever-evolving applications, such as Artificial Intelligence (AI). Network throughput at switch ports is surpassing Network Interface Card (NIC) speeds at servers, presenting a significant opportunity to future-proof and maximize the Return on Investment (ROI) of network infrastructure through the use of breakout architectures.
While the practice of leveraging breakouts has been common for years, and many customers continue to utilize these architectures in their data centers, some remain apprehensive. The primary concerns revolve around the increased complexity in operational management and the potential for single points of failure affecting multiple devices. Despite these challenges, the advantages of breakout architectures are compelling. They not only future-proof the network and maximize ROI but also significantly enhance energy efficiency. By utilizing higher network throughput per port and distributing a single high-speed port into multiple lower-speed ports, data center operators can achieve substantial savings in both capital and operational costs.
This white paper presents the results of testing conducted by Cisco®, Panduit, and Keysight. It provides data center operators with concrete data derived from actual network equipment and realistic workloads, demonstrating and benchmarking energy savings achieved through a Cisco and Panduit breakout architecture utilizing a Keysight traffic generator. Additionally, the white paper outlines best practices and solutions to simplify the operational management of breakout architectures, while tracking energy usage, cost, and emissions reduction. By addressing both the opportunities and concerns associated with breakout architectures, this white paper aims to offer a comprehensive understanding of their potential benefits and practical implementations in modern data centers.
Why are breakout architectures becoming more important?
This migration toward network breakout architectures is influenced by a couple of major factors: ASIC Growth, and Switch Port Density. Let's explore each of these factors:
ASIC Growth
Application-Specific Integrated Circuits (ASICs) have experienced significant growth in terms of processing power and efficiency. These specialized chips are designed for specific tasks, such as networking functions. As ASICs become more powerful, they enable the implementation of advanced networking features and functions, in addition to high bandwidth capabilities.
ASICs capabilities are doubling every two years, while electrical lane standards are doubling every four years (Figure 1). This is creating an inflection point in the marketplace. The switch ASICs are capable of operating far more ports than servers and other devices that can be placed within one cabinet. This development introduces an advantage, prompting a reevaluation of network architecture paradigms. Specifically, it fosters a compelling case for greater adoption of End of Row (EoR) and/or Middle of Row (MoR) configurations utilizing breakout architectures over the conventional Top of Rack (ToR) architecture.
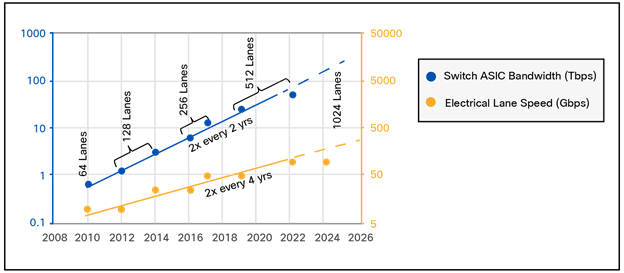
Switch ASIC Bandwidth Growth vs. Electrical Lane Speed Growth
Port density
The demand for higher network speeds and bandwidth has led to the development of high-speed ports, such as 100G and 400G Ethernet. Breakout architectures leverage high-speed ports to efficiently increase port density at the switch, while simultaneously providing multiple lower-speed connections to the servers. As port density increases, breakout architectures provide scalability by allowing organizations to adapt to changing network requirements without a complete overhaul. This adaptability is crucial in dynamic and evolving network environments.
In summary, the combination of advanced ASICs and higher port density has led to the evolution of network architectures toward breakout designs. These architectures leverage specialized processing capabilities and high-speed ports to enhance overall network performance, efficiency, and scalability.
How Cisco, Panduit, and Keysight came together for this testing
Over a year ago, a conversation took place between Cisco and Panduit about how we could show that breakout architectures could save power consumption within the Data Center based off the theoretical scenario that was presented at CiscoLive Las Vegas is 2023. Shortly thereafter, it was suggested that we actually test this theory in a real-world situation. We reached out to Keysight, a leader in network benchmark testing, who provided the 400Gbps traffic generator needed to perform the testing. This effort represents the first three-way collaboration between Cisco, Panduit, and Keysight.
Theoretical scenario and power savings
The theoretical scenario in this paper was created to display how much power an example data center’s switches would consume at a 16-cabinet row level. The server cabinets have 32 servers each and utilize 100G Network Interface Cards (NICs). The scenario was built intentionally with no redundancy for simplicity. If you are looking for the numbers for a redundant setup, just multiply the savings numbers times two.
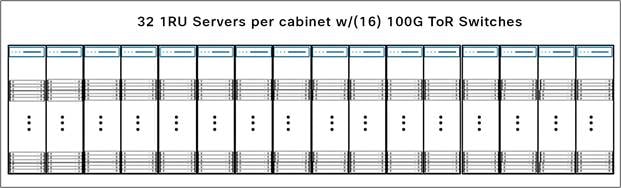
16-Cabinet Row Layout with 32 Servers per Cabinet and 100G ToR Switches (One per Cabinet)
100G ToR setup
In the image above (Figure 2), a theoretical scenario for a row layout is presented. This row has 16 cabinets, with 32 servers per cabinet. Each server has a 100Gbps NIC and the cabinet is deployed in a ToR network architecture. Each cabinet has a 100Gbps switch placed at the top of the rack. This scenario will be utilizing the Cisco Nexus® 9364C-GX switch. This switch has 64 ports of 100G connectivity, but in this scenario we will only be utilizing 48 ports. 32 ports of the 9364C-GX switch will be used for downlinks to the servers, and 16 ports will be utilized for uplinks to the next level within the network. This creates a 2:1 Oversubscription Rate. The transceivers used are the Cisco QSFP100 SR1.2 BiDi transceivers.
Table 1. 100G Theoretical setup details
| Switch |
Cisco Nexus 9364C-GX |
| Total Ports on Switch |
64 Ports |
| Full Line Rate Bandwidth per port |
100Gbps |
| Ports for Downlinks to Servers |
32 Ports |
| Ports for Uplinks to Next Level |
16 Ports |
| Oversubscription Rate |
2:1 |
| Number of Switches per Row |
16 |
Table 2. Theoretical results per switch 100G
| Item |
Power per device |
Quantity |
Total Power |
| Cisco 9364C-GX switch |
811W |
1 |
811W |
| Cisco QSFP100 SR1.2 BiDi Transceivers |
3W |
48 |
206.4W |
|
|
Total Power per Switch |
||
| 1017.4W |
|||
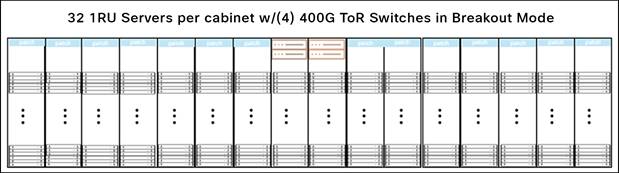
16-Cabinet Row Layout with 32 Servers per Cabinet and 400G Switches (Total of 4 MoR)
400G Breakout setup
In the image above (Figure 3), a theoretical scenario for a row layout is presented. This row has 16 cabinets, with 32 servers per cabinet. Each server has a 100Gbps NIC, but this row is deployed in a MoR network architecture. Two cabinets in the middle of the row have 2 ToR switches per, for a total of (4) 400Gbps switches. This scenario is utilizing the Cisco Nexus 9364D-GX2A switch. This switch has 64 ports of 400G connectivity, but in this scenario we will only be utilizing 48 ports (to keep an apples-to-apples comparison). 32 ports of the 9364D-GX2A switch will be used for downlinks to the servers, and 16 ports will be utilized for uplinks to the next level within the network. This creates a 2:1 Oversubscription Rate. The transceivers used are the Cisco QDD-400G-SR4.2-BD.
Table 3. 400G Theoretical setup details
| Switch |
Cisco Nexus 9364D-GX2A |
| Total Ports on Switch |
64 Ports |
| Full Line Rate Bandwidth per port |
400Gbps |
| Ports for Downlinks to Servers |
32 Ports |
| Ports for Uplinks to Next Level |
16 Ports |
| Oversubscription Rate |
2:1 |
| Number of Switches per Row |
4 |
Table 4. Theoretical results per switch 400G
| Item |
Power per device |
Quantity |
Total Power |
| Cisco 9364D-GX2A switch |
1324W |
1 |
1324W |
| Cisco QDD-400G-SR4.2-BD Transceivers |
9W |
48 |
576W |
|
|
Total Power per Switch |
||
| 1900W |
|||
Table 5. Total Theoretical results per switch 400G with Breakout vs 100G Setup with 1:1 Transceivers per 16 Cabinet Row
| Item |
Power per device |
Quantity |
Total Power per Row |
| Cisco 9364C-GX 100G switch and (48) 100G Transceivers |
1017.4W |
16 |
16.28kW |
| Cisco 9364D-GX2A 400G switch and (48) 400G Transceivers |
1900W |
4 |
7.6kW |
|
|
Total Power Savings per 16 Cabinet Row |
||
| 8.68 kW or 53.3% |
|||
Final theoretical results
The final theoretical results equals a 8.68kW or a 53.3% power savings per 16 cabinet row.
Actual testing
All of the numbers above are derived from theoretical results based on information from the data sheets of the Cisco switches and transceivers. While these theoretical results are promising, we recognized the necessity of validating these findings through real-world testing to ensure their accuracy and reliability. Consequently, we conducted extensive practical tests to corroborate the theoretical data and to gain greater confidence in presenting these numbers to our customers. This hands-on approach ensures that our recommendations are not only based on theoretical models but are also supported by tangible, real-life performance metrics.
Cisco Equipment Used in Testing
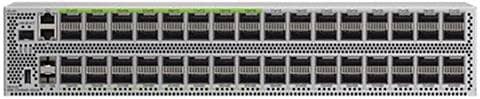
9364D-GX2A Switch
9364D-GX2A information
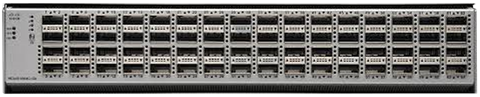
The Cisco Nexus 9364D-GX2A (Figure 4) is a 2-Rack-Unit (2RU) switch that supports 51.2 Tbps of bandwidth and 8.35 bpps across 64 fixed 400G QSFP-DD ports and two fixed 1/10G SFP+ ports. The QSFP-DD ports also support native 200G (QSFP56), 100G (QSFP28), and 40G (QSFP+) transceiver modules. Each port can also support 4x10G, 4x25G, 4x100G, and 2x200G breakouts. The first 16 ports, marked in green on the front panel, are capable of wire-rate MACsec encryption. This switch supports both Cisco ACI® and Cisco NX-OS deployments. It is ideal as a compact, high-port density 400G spine in a scaled-out data center fabric. In AI/ML fabrics, this switch can be used as a leaf to provide high-speed connectivity to 100- or 400G-capable network interface cards and also as a spine to provide scalable fabric bandwidth.
9364C-GX Switch
9364C-GX information
The Cisco Nexus 9364C-GX (Figure 5) is a 2RU switch that supports 12.8 Tbps of bandwidth and over 4.3 bpps across 64 fixed 40/100G QSFP-28 ports. This switch supports both Cisco ACI and Cisco NX-OS deployments. It is best suited as a compact 100G spine for scale-out fabrics. It can also be used as a high- port-density 100G leaf.
Cisco QFP-100G-SR1.2-BiDi Transceiver
Cisco QFP-100G-SR1.2-BiDi Transceiver information
The Cisco QSFP-100G-SR1.2 BiDi (Figure 6) is a parallel Quad Small Form-factor Pluggable (QSFP28) Bi-Direction optical module that supports 100 Gbps bit rates. The module integrates four host electrical data into two optical lanes over a 2-fiber duplex LC optical multi-mode fiber. The QSFP 100G SR1.2 BiDi operates 50Gb PAM4 channels, for a total aggregate bandwidth of 100Gb. PAM4 technology enables 50Gb data rate with signaling at 25Gbaud rates. Reversely, on the receiver side, the module de-multiplexes two sets of optical input signal and converts them to four channels of electrical data. An optical fiber ribbon cable with an LC connector can be plugged into the QSFP28 module. The QSFP 100G SR1.2 BiDi is compliant to IEEE802.3bm 100GBASE-SR4.
Cisco QDD-400G-SR4.2-BD
Cisco QDD-400G-SR4.2-BD Transceiver information
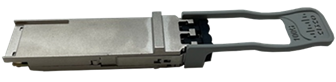
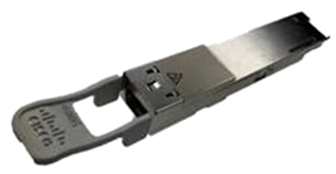
The Cisco QDD-400G-SR4.2-BD Module (Figure 7) supports 400GE links and up to four 100GE breakout link lengths of up to 100m over OM4 Multimode Fiber (MMF). The module has four pairs of MMF with an MPO-12 UPC connector. It is compliant to the IEEE 802.3bm protocol and 400GAUI-8/CEI-56G-VSR-PAM4 standards. The 400 Gigabit Ethernet signal is carried over four parallel pairs of fibers by two 50Gbps bidirectional wavelength per fiber. It can also be used as 4x100GE breakout to QSFP-100G-SR1.2 modules. Forward Error Correction (FEC) is performed on the host platform.
Keysight Equipment Used in testing
Keysight – AresOne – S
Keysight: AresONE-S information
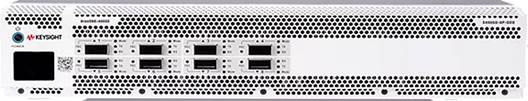
Keysight’s AresONE-S (Figure 8) is an 8- or 16-port 400GE solution capable of generating up to 6.4Tbps of line-rate traffic in a single chassis. The proven AresONE-S fixed-chassis form-factor meets customer requirements for ultra-high-density testing with less rack-space, power, and cooling. AresONE -S validates not just 400GE but also other speeds since each port can be used to test PAM4 speed i.e. 2x200GE, 4x100GE, or 8x50GE as well as Non-Return-to-Zero (NRZ) speeds i.e. 2x100GE, 4x50GE, 2x40GE, 8x25GE, 8x10GE multi-rate Ethernet. This 400GE solution is used by the top Network Equipment Manufacturers (NEMs), switch silicon/optical transceiver/ASIC manufacturers, cloud service providers, and carriers to validate and test their 400GE products and network rollouts.
Panduit Equipment Used in Testing
Panduit PDU
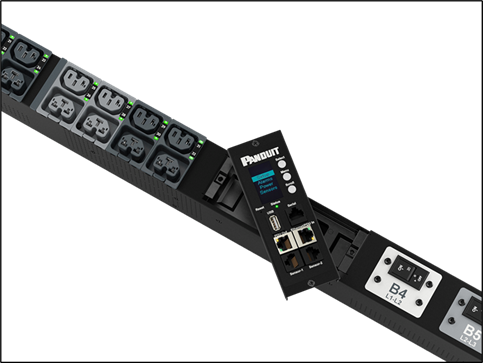
Panduit PDU information
The Panduit PDUs (Figure 9) monitor the data center power and the environment by continuously scanning for electrical circuit overloads and physical environmental conditions that place critical IT equipment at risk. By monitoring physical access points, the PDUs increase cabinet security to protect your systems and data. With some of the highest outlet densities and the smallest form factors available in the market, your cabinets will be functioning at their most resourceful state.
Third-party equipment in testing
A third-party power meter was used to collect additional data points for the power usage.
Below are the list of tests run for both the 100G switch and the 400G switch:
Test 1: Transceivers only unterminated with 64 Transceiver, no traffic
Transceivers only (Unterminated) ports 1‒64
This test was run to get a baseline for how much power the switch used when the transceiver were installed but not terminated (no patch cords installed) and had no traffic running.
Test 2: Transceivers terminated with 64 Transceiver, no traffic
Transceivers only (Terminated) ports 1‒64
This test was run to get a baseline for how much power the switch used when the transceivers were installed and terminated (patch cord to another transceiver), but had no traffic running.
Test 3: Traffic with 64 ports
● All 64 ports are utilized with transceivers
● Traffic testing at 0%, 20%, 40%, 70%, and 100%
● RFC2544 throughput and latency tests
● 1024-bytes fixed frame size
These tests were run to understand how the switches power reacted at different levels of traffic with all 64 ports utilized with transceivers.
Test 4: Traffic with 48 ports
This test was run to demonstrate the apples-apples numbers in the theoretical scenario, since the scenario only used 48 ports of the 64 ports in both the 9364C-GX and 9364D-GX2A switches.
● 48 ports are utilized with 48 transceivers
● Traffic testing at 0%, 20%, 40%, 70%, and 100%
● RFC2544 throughput and latency tests
● 1024-bytes fixed frame size
These tests were run to understand how the switches power reacted at different levels of traffic with all 48 ports utilized with transceivers. These are for the apples-to-apples comparison that was built in the theoretical scenario.
Power readings were taken at three separate locations (Figure 10). Power readings were taken at the Cisco Switch, the Panduit PDU, and a third-party meter.
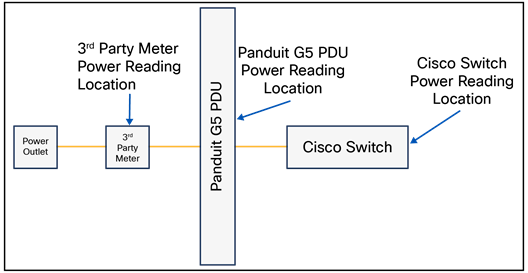
Power Reading Locations for Actual Tests
100G Results
Table 6. Actual 100G Test 1 – Cisco QFP-100G-SR1.2-BiDi – Transceiver only, unterminated (64) transceivers
| Switch Power |
PDU Power |
Meter Power |
Avg. Power |
| 740W |
724W |
722.6W |
728.9W |
Table 7. Actual 100G Test 2 – Cisco QSFP-100G-SR1.2-BiDi - Transceivers only, terminated with (64) transceivers
| Switch Power |
PDU Power |
Meter Power |
Avg. Power |
| 916W |
898W |
900.8W |
904.9W |
Table 8. Actual 100G Test 3 - Cisco QSFP-100G-SR1.2-BiDi – Traffic with 64 ports
| Traffic % |
Switch Power |
PDU Power |
Meter Power |
Avg. Power |
| 0% |
916W |
898W |
900.8W |
904.9W |
| 20% |
952W |
937W |
938.3W |
942.4W |
| 40% |
986W |
969W |
971.9W |
975.6W |
| 70% |
1025W |
1008W |
1010.5W |
1014.5W |
| 100% |
1052Ws |
1034W |
1038.2W |
1041.4W |
Table 9. Actual 100G Test 4 - Cisco QSFP-100G-SR1.2-BiDi – Traffic with 48 ports
| Traffic % |
Switch Power |
PDU Power |
Meter Power |
Avg. Power |
| 0% |
753W |
736W |
737.5W |
742.2W |
| 20% |
782W |
763W |
765.6W |
770.2W |
| 40% |
807W |
789W |
791.5W |
795.8W |
| 70% |
837W |
822W |
820.4W |
826.5W |
| 100% |
899W |
882W |
883.9W |
888.3W |
400G Results
Table 10. Actual 400G Test 1 – Cisco QDD-400G-SR4.2-BD – Transceiver only, unterminated (64) transceivers
| Switch Power |
PDU Power |
Meter Power |
Avg. Power |
| 1406W |
1384W |
1391.9W |
1394.0W |
Table 11. Actual 400G Test 2 – Cisco QDD-400G-SR4.2-BD - Transceivers only, terminated with (64) transceivers
| Switch Power |
PDU Power |
Meter Power |
Avg. Power |
| 1631W |
1594W |
1610.8W |
1611.9W |
Table 12. Actual 400G Test 3 - Cisco QDD-400G-SR4.2-BD – Traffic with 64 ports
| Traffic % |
Switch Power |
PDU Power |
Meter Power |
Avg. Power |
| 0% |
1631W |
1594W |
1610.8W |
1611.9W |
| 20% |
1699W |
1664W |
1678.9W |
1680.6W |
| 40% |
1762W |
1724W |
1741.2W |
1742.4W |
| 70% |
1855W |
1821W |
1836.2W |
1837.4W |
| 100% |
1961W |
1931W |
1943.8W |
1945.3W |
Table 13. Actual 400G Test 4 - Cisco QDD-400G-SR4.2-BD – Traffic with 48 ports
| Traffic % |
Switch Power |
PDU Power |
Meter Power |
Avg. |
| 0% |
1331W |
1296W |
1312.9W |
1313.3W |
| 20% |
1378W |
1344W |
1358.3W |
1360.1W |
| 40% |
1430W |
1398W |
1413.6W |
1413.9W |
| 70% |
1530W |
1496W |
1509.4W |
1511.8W |
| 100% |
1623W |
1585W |
1599.5W |
1602.5W |
Final Results
Table 14. Total Theoretical results per switch 400G with Breakout vs 100G Setup with 1:1 Transceivers per 16 Cabinet Row
| Item |
Power per device |
Quantity |
Total Power per Row |
| Cisco 9364C-GX 100G switch and (48) 100G Transceivers |
1017.4W |
16 |
16.28kW |
| Cisco 9364D-GX2A 400G switch and (48) 400G Transceivers |
1900W |
4 |
7.6kW |
| Theoretical |
Total Power Savings per 16 Cabinet Row |
||
| 8.68 kW or 53.3% |
|||
Table 15. Total Actual results per switch 400G with Breakout vs 100G Setup with 1:1 Transceivers per 16 Cabinet Row
| Item |
Power per device @ 70% Traffic |
Quantity |
Total Power per Row |
| Cisco 9364C-GX 100G switch and (48) 100G Transceivers |
826.5W |
16 |
13.2kW |
| Cisco 9364D-GX2A 400G switch and (48) 400G Transceivers |
1511.8W |
4 |
6.0kW |
| Actual |
Total Power Savings per 16 Cabinet Row |
||
| 7.2kW or 54.5% |
|||
Table 16. Total Theoretical Power Savings vs. Actual Power Savings
| Power Savings |
Percentage |
| Theoretical Power Savings |
53.3% |
| Actual Power Savings |
54.5% |
The theoretical and actual power savings calculated in Table 16 are based on a comparison between a 100G ToR and MoR using 400G ports optically broken out to 100GE per lane setup both using optical transceivers to ensure testing between comparable architectures. However, typically a 100G ToR architecture would likely use DACs (Direct Attach Cable) versus 100G optical transceivers, both enabling 100G connectivity for 512 servers (our benchmark architecture for this white paper). Although a DAC does not use electronics in the data path, there can be some electronics in the DAC for an EEPROM and a processor for some management functions in the cable. Power consumption is usually less than 0.5W. Taking this into account, there is still a 40% savings in network power dissipation moving to a MoR architecture using optical breakouts. Shifting from DAC to optical transceivers will increase power usage at the server NIC, however, this increase is minor when compared to the network power savings from using optical breakouts.
Cisco Nexus Dashboard/Panduit iPDU Integration
The integration of Panduit Intelligent Power Distribution Units (iPDUs) with Cisco Nexus Dashboard (Figure 11) simplifies data-center operations by bringing real-time sustainability insights to operators and unifying IT and facilities data points into a single pane of glass. By leveraging the integration of Panduit iPDUs with Cisco Nexus Dashboard in our test configuration, we were able to track real-time energy usage from the Nexus switches.
By integrating Panduit iPDUs with Cisco Nexus Dashboard, customers gain visibility into real-time and historical energy consumption, energy costs, and Greenhouse Gas (GHG) emissions across all the devices in a data center (Figure 12). They can quickly understand past performance, measure real-time impact from deploying a breakout architecture, forecast future energy requirements, and monitor their progress on net-zero initiatives.
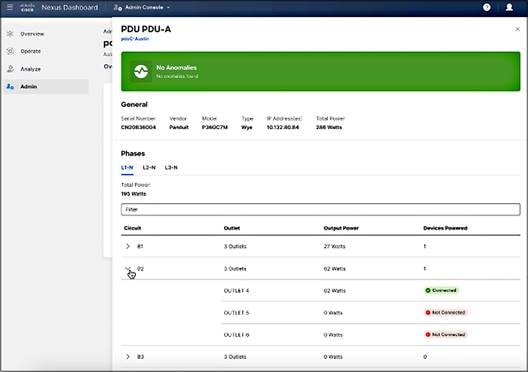
Example of iPDU Outlet level power details.
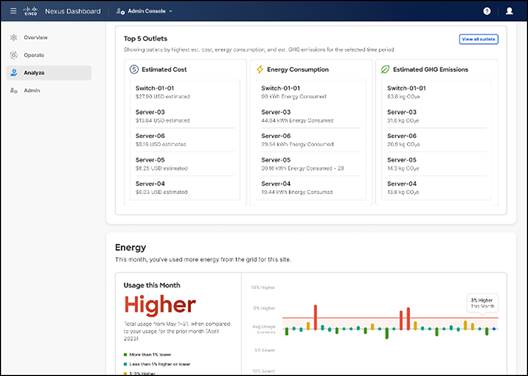
Example of device level energy cost, usage, and GHG emissions for a data center.
Additional links:
● www.cisco.com/go/nexusdashboard
Breakout architecture physical infrastructure best practices
Utilizing the best practices listed below will help ease the management of a breakout architecture from a physical infrastructure standpoint.
Best Practice #1: Use Breakout Cassettes vs. Breakout Harnesses
Breakout cassettes (Figure 13) enable the use of patch cords from a patch panel, eliminating the need for breakout harnesses (Figure 14) that must be custom-ordered to specific lengths. Breakout cassettes simplify the ordering process and enhance cable management. Panduit provides a variety of breakout cassettes, including new universal cassettes that address and eliminate the polarity issues present in previous versions.
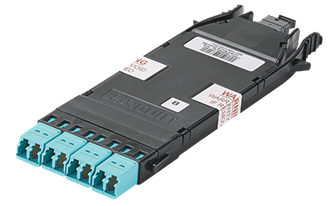
Panduit Breakout Cassette
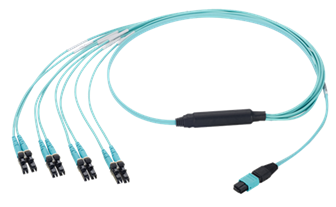
Panduit Breakout Harness
Best Practice #2: Use Panduit RapidID to identify patch cords quickly and accurately in your deployment.
The RapidID Network Mapping System (Figure 15) automates labor-intensive and error-prone cable documentation, resulting in a faster, easier way to place and trace cables and patch cords. It is a practical alternative to traditionally manual approaches that is ideally suited for building a new telecommunications room, locating installed cabling, or replacing a network switch.
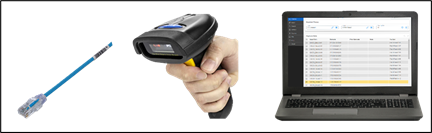
Panduit RapidID Network Mapping System
Reduce the time and cost of patch cord documentation by up to 50%. With RapidID, the painstaking labeling process is already done. Now network engineers can easily, quickly, and accurately place and trace cables to focus on more strategic initiatives.
Minimize the risk of a network outage. Network documentation can drastically reduce downtime during an outage, but documenting physical infrastructure is extremely time-consuming and often overlooked or outdated. RapidID makes the documentation process less painful and reduces human error by eliminating the need for manual data entry.
Best Practice #3: Use a Standardized Layout Methodology
Try to use a standardized layout methodology for your server cabinets as much as possible. The more consistent your server cabinet layouts are, the more success you will have with a breakout architecture. In the cabinet image below (Figure 16), the 32 servers are deployed in sets of 4 servers to align to the same transceiver which is servicing all four servers. Each set of 4 servers is also connected to the same cassette in each cabinet, which ensures that they are connected to the same transceiver. If each cabinet has the same arraignment of connections, a tech working in the cabinet can be confident that they are troubleshooting the correct connections within the cabinet.
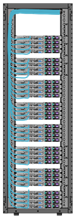
Standardized Breakout Layout Methodology with 32 servers
Best Practice #4: Utilize the Tools Panduit and Cisco Have Created for Breakout Architectures
Panduit and Cisco have created a guide to provide guidance for deploying a breakout architecture. The 10-40-100-400G Breakout guide (Figure 17) is available at the following link : Fiber Optic Transceiver Breakout Cable Ordering Guide FBSG06-WW-ENG (panduit.com).
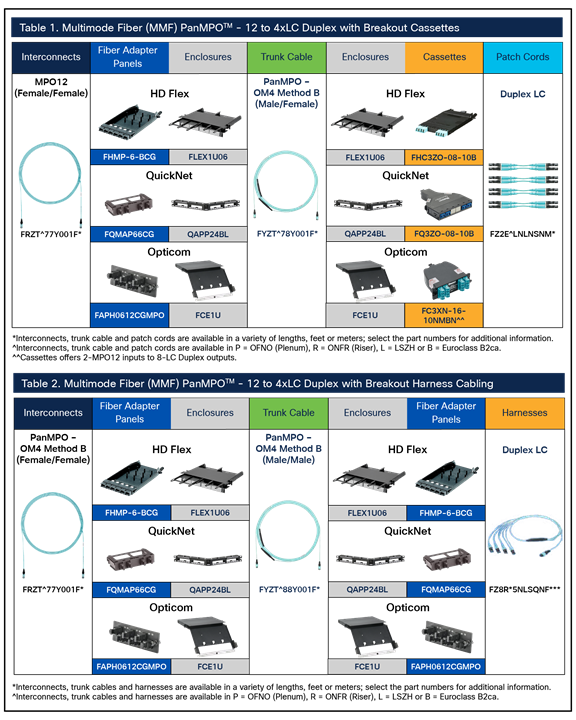
Tables from the Cisco/Panduit Breakout Guide
While breakout architectures can present operational challenges due to their complexity, their benefits cannot be overlooked. This white paper has demonstrated the potential for notable power conservation when these architectures are implemented effectively. By adhering to the best practices outlined, data center operators can mitigate the inherent difficulties and capitalize on the efficiency and scalability that breakout architectures offer. Our hope is that this comprehensive assessment will help organizations leverage the benefits of breakout architectures to enable highly scalable and sustainable network infrastructure for their modern data centers.
Cisco company information
Cisco designs and sells a broad range of technologies that have been powering the Internet since 1984. Across networking, security, collaboration, applications, and the cloud, our evolving intent-based technologies are constantly learning and adapting to provide customers with a highly secure, intelligent platform for their digital business. Our products and technologies are grouped into the following categories: Secure, Agile Networks; Internet for the Future; Collaboration; End-to-End Security; Optimized Application Experiences; Other Products. In addition to our product offerings, we provide a broad range of service offerings, including technical support services and advanced services. Increasingly, we are delivering our technologies through software and services.
Keysight company information
At Keysight (NYSE: KEYS), we inspire and empower innovators to bring world-changing technologies to life. As an S&P 500 company, we're delivering market-leading design, emulation, and test solutions to help engineers develop and deploy faster, with less risk, throughout the entire product lifecycle. We're a global innovation partner, enabling customers in communications, industrial automation, aerospace and defense, automotive, semiconductor, and general electronics markets to accelerate innovation to connect and secure the world. Learn more at Keysight Newsroom and www.keysight.com.
Panduit company information
Since 1955, Panduit’s culture of curiosity and passion for problem solving have enabled more meaningful connections between companies’ business goals and their marketplace success. Panduit creates leading-edge physical, electrical, network infrastructure and AV solutions for enterprise-wide environments, from the data center to the telecom room, from the desktop to the plant floor. Headquartered in Tinley Park, Illinois, U.S. and operating in 112 global locations, Panduit’s proven reputation for quality and technology leadership, coupled with a robust partner ecosystem, help support, sustain, and empower business growth in a connected world.
Learn more at www.panduit.com and www.panduit.com/cisco.