Cisco Catalyst SD-WAN: Microsoft Sentinel Installation, Configuration, and Usage Guide
Available Languages
Bias-Free Language
The documentation set for this product strives to use bias-free language. For the purposes of this documentation set, bias-free is defined as language that does not imply discrimination based on age, disability, gender, racial identity, ethnic identity, sexual orientation, socioeconomic status, and intersectionality. Exceptions may be present in the documentation due to language that is hardcoded in the user interfaces of the product software, language used based on RFP documentation, or language that is used by a referenced third-party product. Learn more about how Cisco is using Inclusive Language.
Cisco Catalyst™ SD-WAN integration with Microsoft Sentinel brings together the capabilities of Cisco Catalyst SD-WAN and Microsoft Sentinel, a cloud-native solution offering Security Information and Event Management (SIEM) along with Security Orchestration, Automation, and Response (SOAR). Microsoft Sentinel empowers organizations with security analytics, attack detection, threat visibility, proactive hunting, and efficient threat response. With this integration, businesses can leverage the combined power of Cisco Catalyst SD-WAN and Microsoft Sentinel to enhance their security posture.
The integration between Cisco Catalyst SD-WAN and Microsoft Sentinel, which is supported starting from Cisco Catalyst SD-WAN release 17.10, enables security analytics and delivers valuable threat intelligence, enabling organizations to effectively detect and respond to security incidents. By leveraging the strengths of both solutions, this integration provides a comprehensive security solution for businesses seeking advanced threat management capabilities.
A) To begin visualizing Catalyst SD-WAN security insights, installation of a netflow collector and syslog collector is required. The following sections will outline the following:
B) Setting up Netflow ingestion using 2 options
a. Option 1: Download and install a docker image
b. Option 2: Installing Filebeat and Logstash manually
C) Setting up an Arc Server for Syslog ingestion
Steps to ingest NetFlow data into Microsoft Sentinel
Ingesting NetFlow data through the Docker image
To ingest NetFlow data into Sentinel through the Docker image, users simply need to download the Docker image from Docker Hub onto their VM and execute it using Docker commands. This process installs Filebeat and Logstash servers on their VM, which are responsible for receiving the NetFlow data and ingesting it into the Sentinel workspace.
Install Docker and Docker Compose
● Install Docker Engine on your preferred operating system. For Windows and Mac OS installations, you can choose between static binary installation or Docker Desktop.
◦ Link: https://docs.docker.com/engine/install/#server
Run the Cisco Catalyst SD-WAN Docker image
● Open the Filebeat input port in the firewall if it is enabled. Filebeat will receive the NetFlow data sent by Cisco, parse the NetFlow fields, and send it to the Logstash server. The Logstash server will then ingest the data into the specified workspace of Sentinel.
Example: firewall-cmd --zone=public --permanent --add-port=2055/udp
● Go to the Cisco_SDWAN_Netflow_Docker folder (shared in the Cisco_SDWAN_Netflow_Docker.zip file).
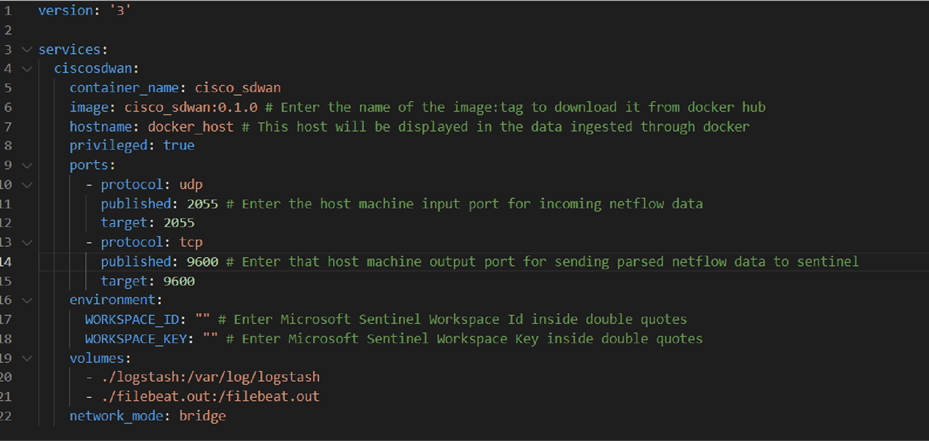
● Update the docker-compose.yml file and provide the following parameter values.
◦ Host machine input and output port
◦ Microsoft Sentinel workspace ID
◦ Microsoft Sentinel workspace key
● Now open the terminal and go to the path where the docker-compose.yml file is located.
● To start Docker and run the application, execute the following command in the terminal:
◦ docker compose up -d
After 5 minutes, run the following command to verify the running state of the Docker container:
◦ docker ps
Stop the Docker execution
● To stop the Docker execution, open the terminal and navigate to the directory where the docker-compose.yml file is located. Then run the following command.
◦ docker compose down
Useful Docker commands
● docker ps: Get a list of all running Docker containers.
● docker ps -a: Get a list of all running and stopped Docker containers.
● docker build -t <image_name> <location of Dockerfile>: Build a Docker image.
● docker system prune: Remove all Docker cache.
● docker exec -it <container_id> /bin/bash: Execute commands inside the container.
Ingesting NetFlow data through Filebeat and Logstash
To ingest NetFlow data into Sentinel using Filebeat and Logstash, you need to install and configure Filebeat and Logstash on the VM. Once properly configured, the VM will be able to receive NetFlow data on the specified port and ingest that data into the Sentinel workspace.
● To install Filebeat and Logstash using APT, refer to the following sections of the Filebeat Reference:
◦ The APT section of Repositories for APT and YUM: https://www.elastic.co/guide/en/beats/filebeat/current/setup-repositories.html
◦ Installing Logstash: https://www.elastic.co/guide/en/logstash/current/installing-logstash.html
● To install Filebeat and Logstash for Red Hat-based Linux (YUM), see the YUM section of Repositories for APT and YUM: https://www.elastic.co/guide/en/beats/filebeat/current/setup-repositories.html#_yum
1. Install Filebeat and Logstash
● Download and install the public signing key. Run the following command anywhere in the VM:
◦ sudo rpm --import https://packages.elastic.co/GPG-KEY-elasticsearch
![]()
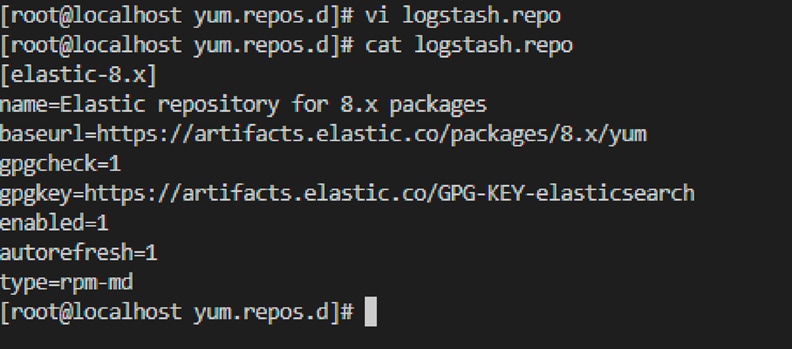
● Add the following in your /etc/yum.repos.d/ directory in a file with a .repo suffix, for example, logstash.repo:
◦ [elastic-8.x]
name=Elastic repository for 8.x packages
baseurl=https://artifacts.elastic.co/packages/8.x/yum
gpgcheck=1
gpgkey=https://artifacts.elastic.co/GPG-KEY-elasticsearch
enabled=1
autorefresh=1
type=rpm-md
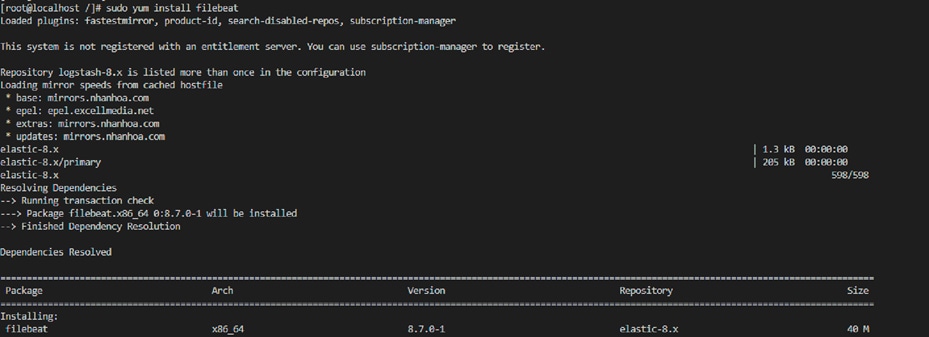
● Install and enable Filebeat:
◦ sudo yum install filebeat
◦ sudo systemctl enable filebeat
![]()
● Note: If your system does not use systemd, run sudo chkconfig --add filebeat
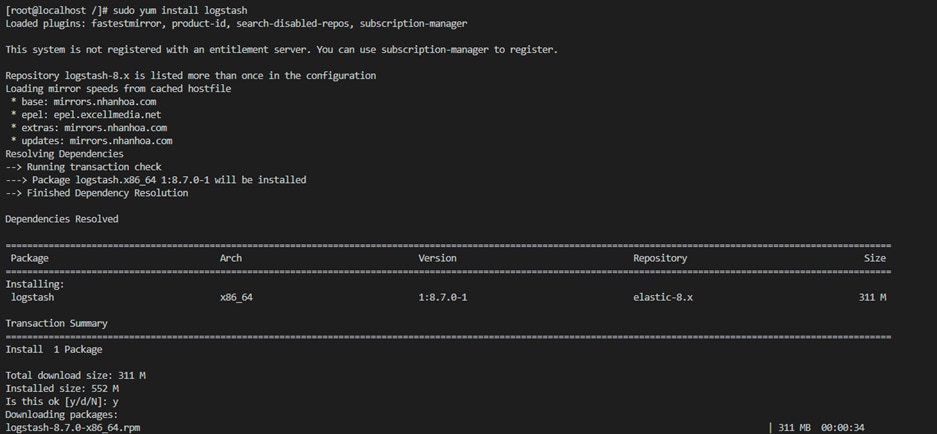
● Install Logstash:
◦ sudo yum install logstash
2. Configure Filebeat to send events to Logstash
● Edit the filebeat.yml file:
◦ vi /etc/filebeat/filebeat.yml
● Comment out the Elasticsearch Output section.
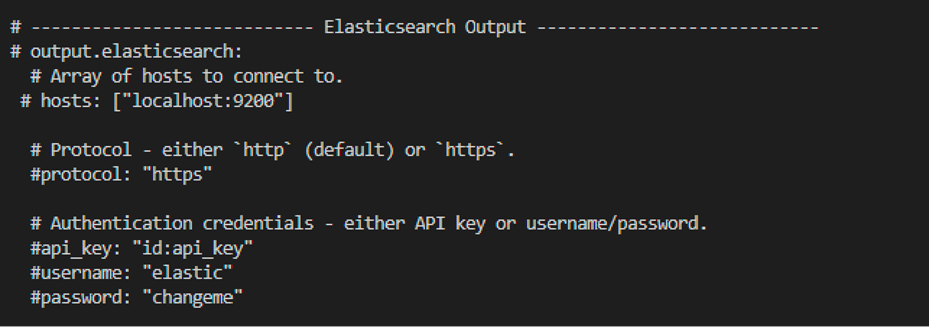
● Uncomment the Logstash Output section (uncomment only these two lines):
◦ output.logstash
hosts: [“localhost:5044”]
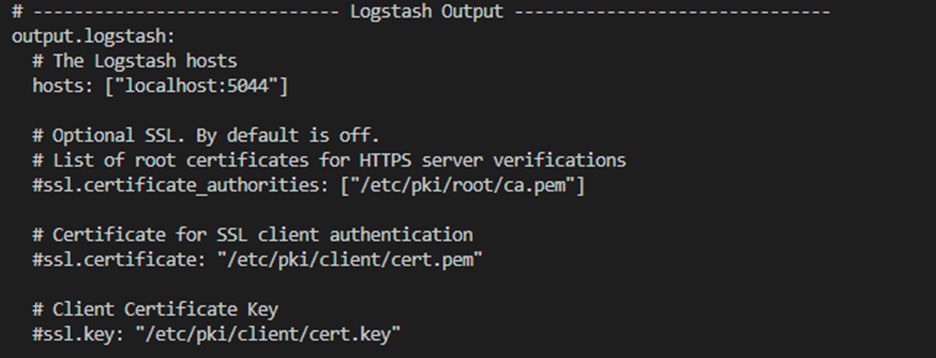
● In the Logstash Output section, if you want to send data to a port other than the default port, that is, port 5044, replace the port number in the hosts field. (Note: When configuring Logstash, make sure to add this port to the configuration file.)
● In the Filebeat inputs section, comment out the existing configuration and add the following configuration:
◦ - type: netflow
max_message_size: 10KiB
host: "0.0.0.0:2055"
protocols: [ v5, v9, ipfix ]
expiration_timeout: 30m
queue_size: 8192
custom_definitions:
- /etc/filebeat/custom.yml
detect_sequence_reset: true
enabled: true
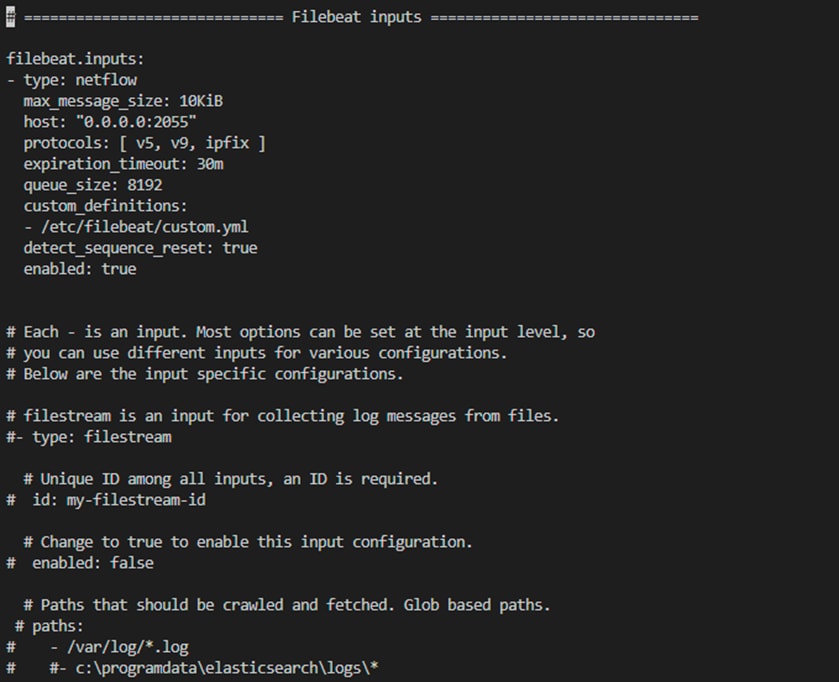
● In the Filebeat inputs section, if you want to receive data from a port other than the default port, that is, port 2055, replace the port number in the host field.
● Add the provided custom.yml file inside the /etc/filebeat/ directory.
● Open the Filebeat input and output ports in the firewall:
◦ firewall-cmd --zone=public --permanent --add-port=2055/udp
◦ firewall-cmd --zone=public --permanent --add-port=5044/udp
● Note: If a custom port is added for Filebeat input or output, open that port in the firewall.
3. Configure Logstash to send events to Microsoft Sentinel
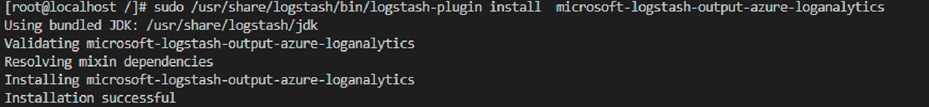
● Install the Azure Log Analytics plug-in:
◦ sudo /usr/share/logstash/bin/logstash-plugin install microsoft-logstash-output-azure-loganalytics
● Store the Log Analytics workspace key in the Logstash key store. The workspace key can be found in Azure portal under Log Analytics workspace > Select workspace. Under Settings, select Agent > Log Analytics agent instructions.
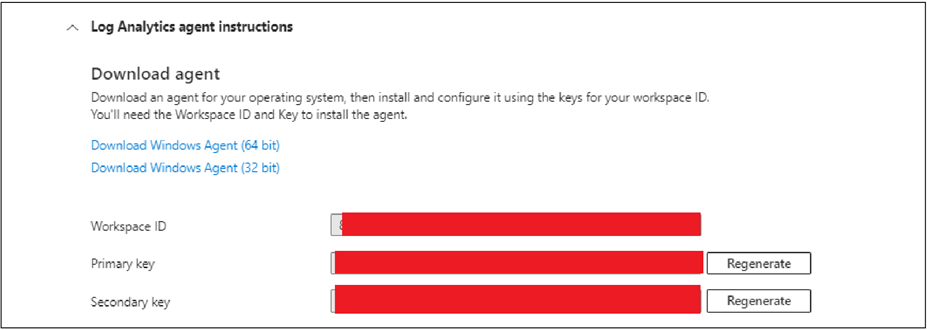
● Copy the primary key and run the following commands:
◦ sudo /usr/share/logstash/bin/logstash-keystore --path.settings /etc/logstash create LogAnalyticsKey
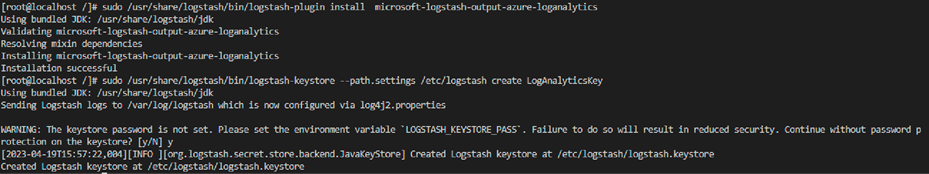
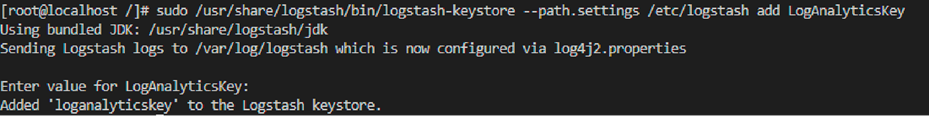
◦ sudo /usr/share/logstash/bin/logstash-keystore --path.settings /etc/logstash add LogAnalyticsKey
● The above command will prompt you for the key. Paste the copied primary key into the prompt.
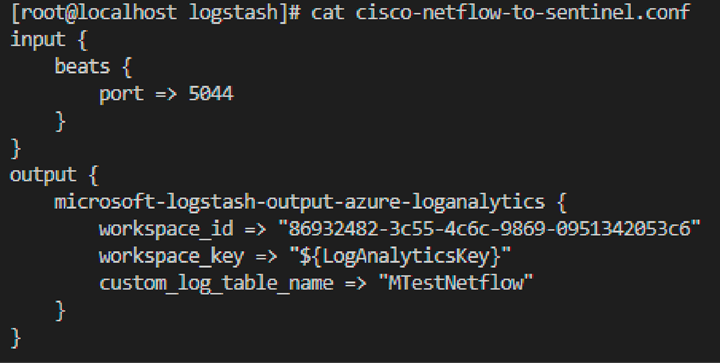
● Create the configuration file /etc/logstash/cisco-netflow-to-sentinel.conf:
input {
beats {
port => <port_number> (Enter the output port number that was configured during Filebeat configuration, for example, filebeat.yml.)
}
}
output {
microsoft-logstash-output-azure-loganalytics {
workspace_id => "<workspace_id>"
workspace_key => "${LogAnalyticsKey}"
custom_log_table_name => "CiscoSDWANNetflow"
}
}
◦ Note: If the table is not present in Sentinel, it will create a new table.
4. Run Filebeat
● Open a terminal and run the following command:
◦ systemctl start filebeat.
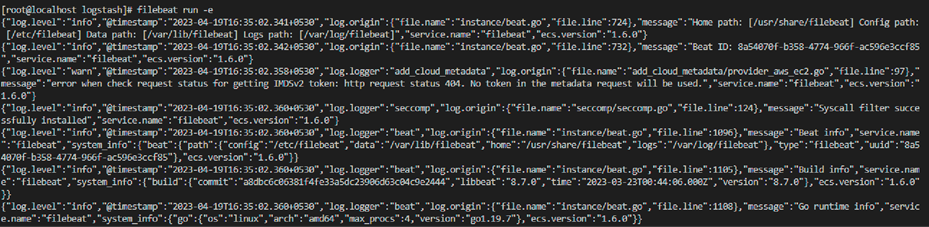
● This command will run Filebeat in the background. To view the logs, stop Filebeat (systemctl stop filebeat) and then run the following command:
◦ filebeat run -e
5. Run Logstash:
● In another terminal window, run the following command:
◦ /usr/share/logstash/bin/logstash --path.settings /etc/logstash -f /etc/logstash/cisco-netflow-to-sentinel.conf &
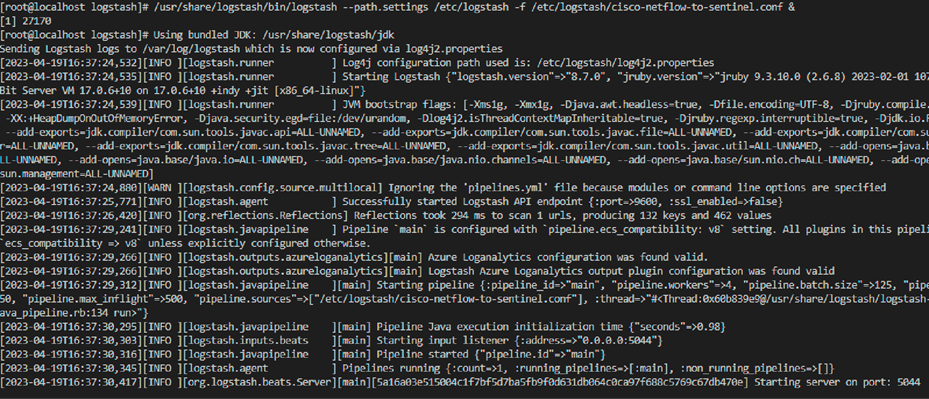
● This command will run Logstash in the background. To view the Logstash logs, terminate the above process and run the following command:
◦ /usr/share/logstash/bin/logstash --path.settings /etc/logstash -f /etc/logstash/cisco-netflow-to-sentinel.conf
Steps to ingest syslog data into Microsoft Sentinel
Azure Monitor Agent will be used to collect the syslog data into Sentinel. To enable this, you first need to create an Azure Arc server for the VM from which the syslog data will be sent.
Add an Azure Arc server
● Log in to the Azure portal.
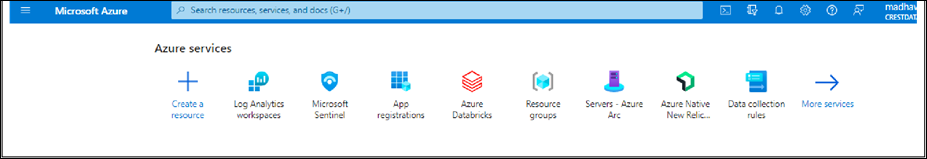
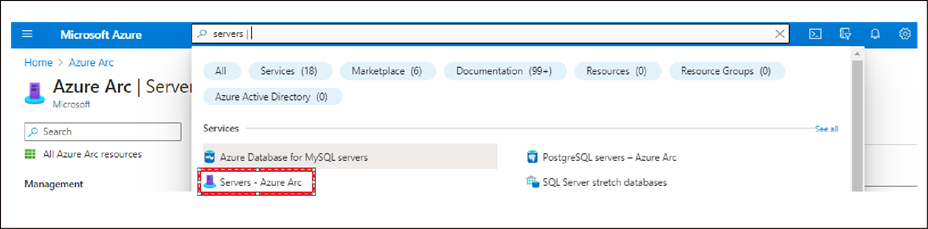
● Go to Servers - Azure Arc and click Add.
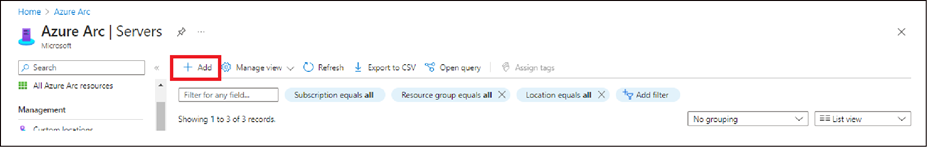
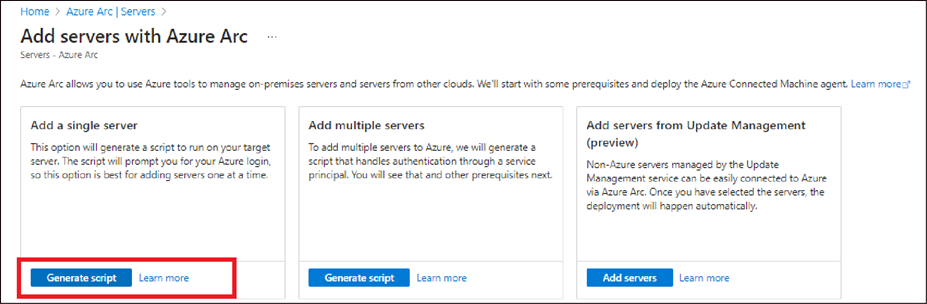
● Under "Add a single server," select Generate Script. Users can also generate scripts for multiple servers.
● Review the information on the Prerequisites page, then select Next.
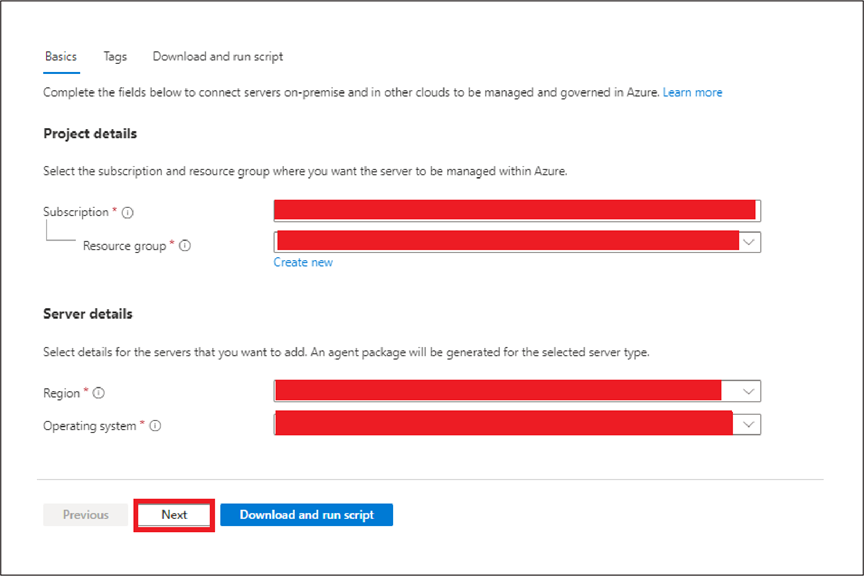
● On the Resource details page, provide the following information:
◦ Select the subscription and resource group where you want the machine to be managed within Azure.
◦ For Region, choose the Azure region in which the server's metadata will be stored.
◦ For Operating system, select the operating system of the server you want to connect.
◦ Choose the connectivity method for the Azure Connected Machine agent to connect to the internet. If you select Proxy server, enter the proxy server IP address or the name and port number that the machine will use in the specified format: http://<proxyURL>:<proxyport>.
◦ Select Next.
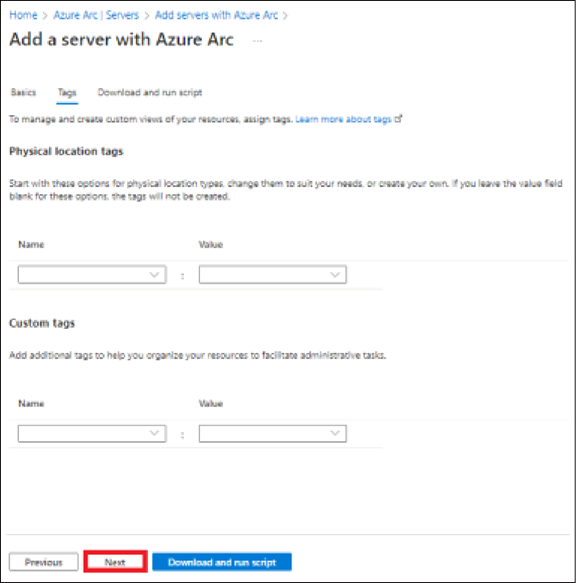
● On the Tags page, review the suggested default physical location tags and enter a value, or specify one or more custom tags to support your standards. Then select Next.
● In the “Download or copy the following script” section, review the script. If you want to make any changes, use the Previous button to go back and update your selections. Otherwise, select Download to save the script file.
● Now that you've generated the script, the next step is to run it on the server that you want to onboard to Azure Arc.
● For Azure VM, follow the steps described in “Evaluate Azure Arc-enabled servers on an Azure virtual machine” (link below) before running the script:
◦ https://learn.microsoft.com/en-us/azure/azure-arc/servers/plan-evaluate-on-azure-virtual-machine
● Run the script using the following command:
◦ /<ScriptName>.sh
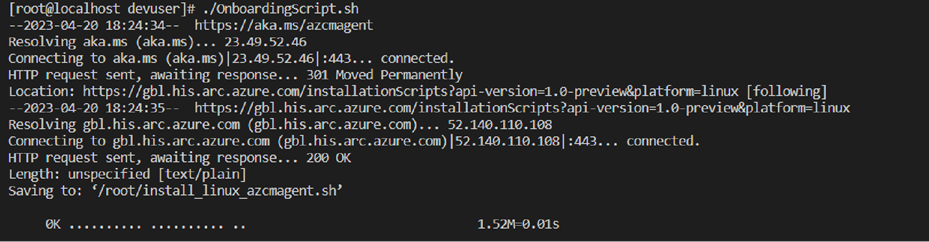
● After the successful installation of the package, you will get the following “INFO” message:
![]()
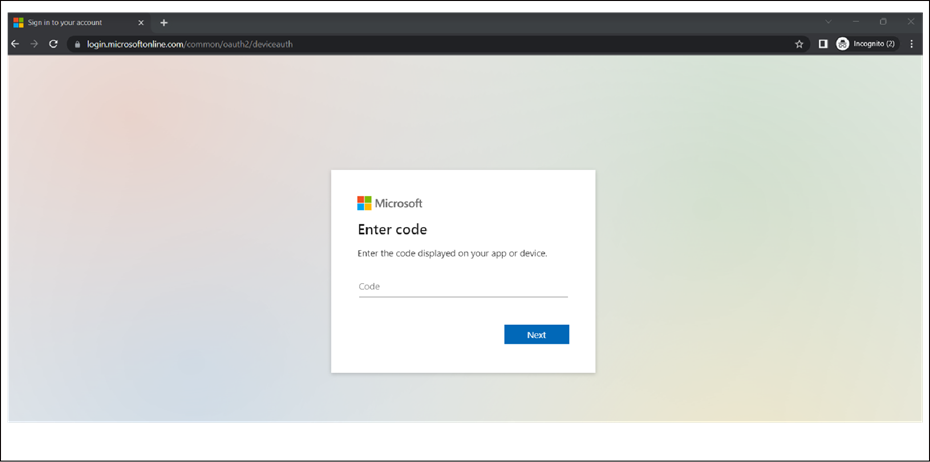
● Open the page https://microsoft.com/devicelogin and enter the code to authenticate.
● After entering the code, you will see a confirmation message like the following:
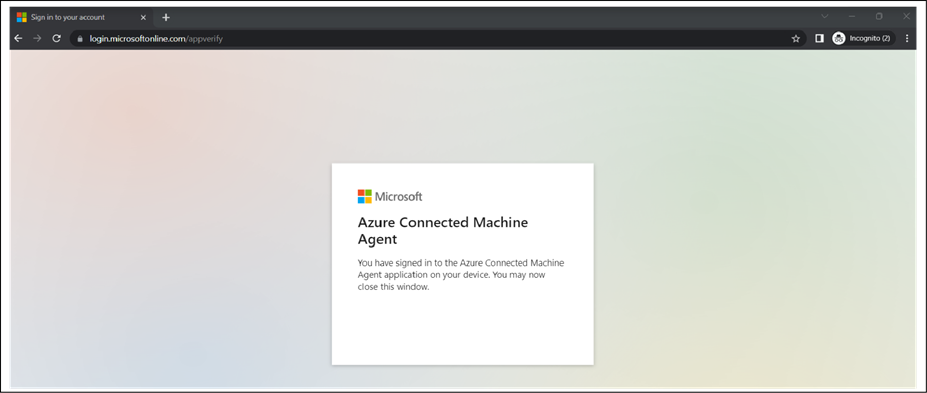
● Your machine will be connected to Azure.
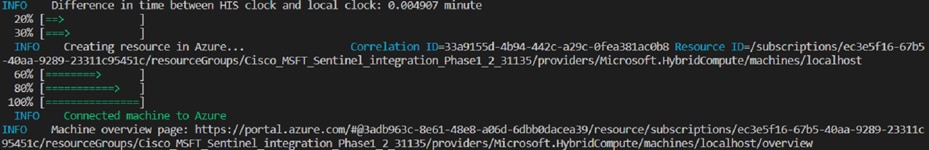
● The script will download the Connected Machine agent from the Microsoft Download Center, install the agent on the server, create the Azure Arc-enabled server resource, and associate it with the agent.
● After you install the agent and configure it to connect to Azure Arc-enabled servers, go to the Azure portal to verify that the server has successfully connected. View your machine in the Azure portal.
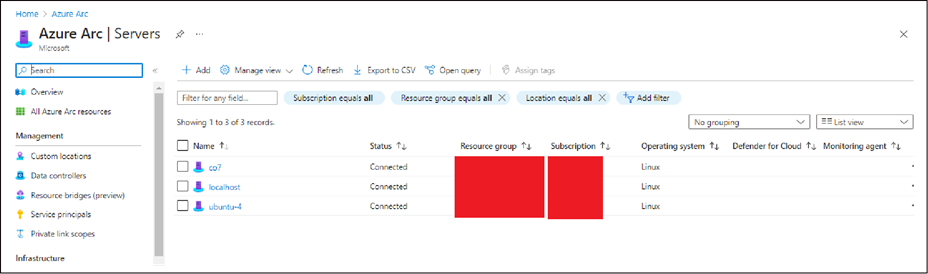
Reference: Quickstart: Connect hybrid machines with Azure Arc-enabled servers (https://learn.microsoft.com/en-us/azure/azure-arc/servers/learn/quick-enable-hybrid-vm)
Now that you've enabled your Linux or Windows hybrid machine and successfully connected to the service, you need to create a Data Collection Rule to collect syslog data.
● Go to the Azure portal.
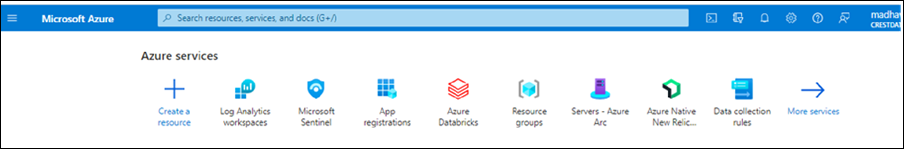
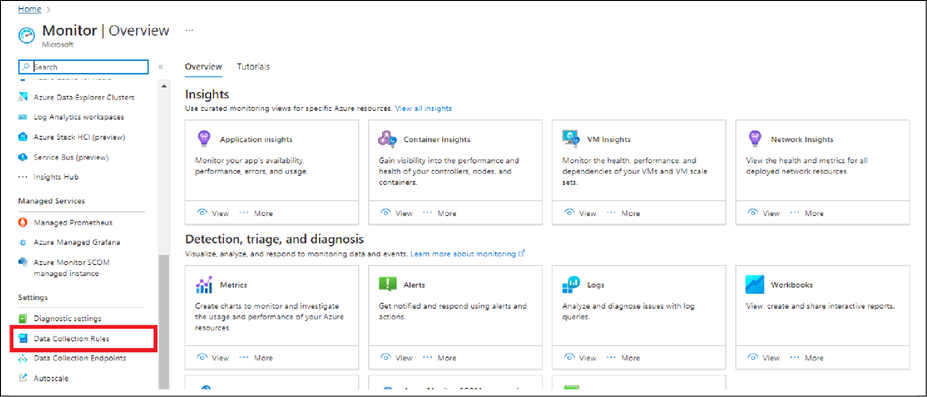
● Search for Monitor. Under Settings, select Data Collection Rules and then select Create.
● On the Basics panel, enter the following information:
Table 1. Mandatory fields for ‘Basics’ panel
| Field |
Value |
| Rule Name |
Enter a name like dcr-syslog |
| Subscription |
Select the appropriate subscription |
| Resource group |
Select the appropriate resource group |
| Region |
Select the region where your Microsoft Sentinel workspace is located |
| Platform Type |
Linux |
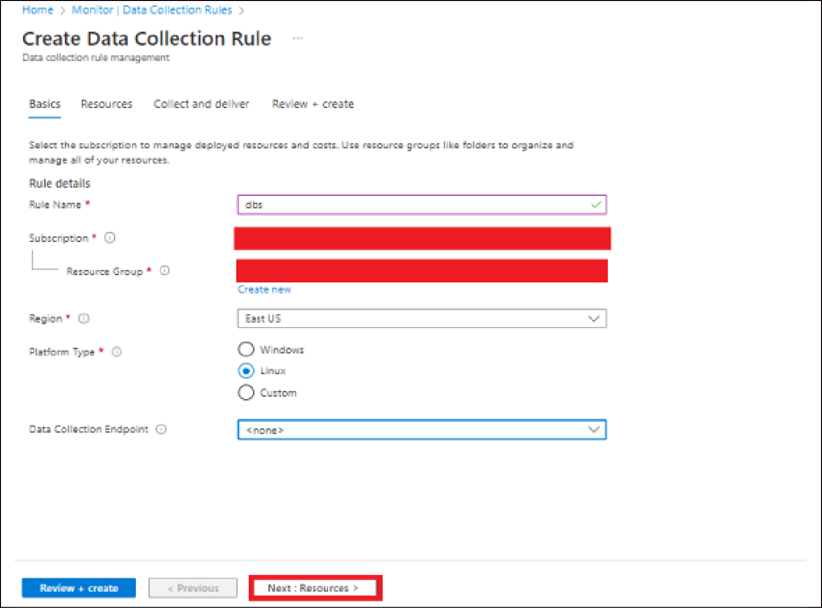
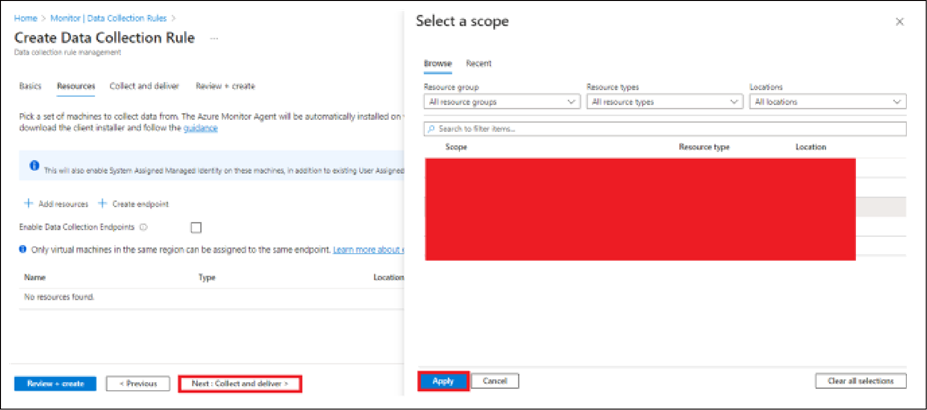
● Select Next: Resources.
● Select Add resources. Use the filters to find the virtual machine you'll use to collect logs.
● Select the virtual machine. Select Apply.
● Select Next: Collect and deliver.
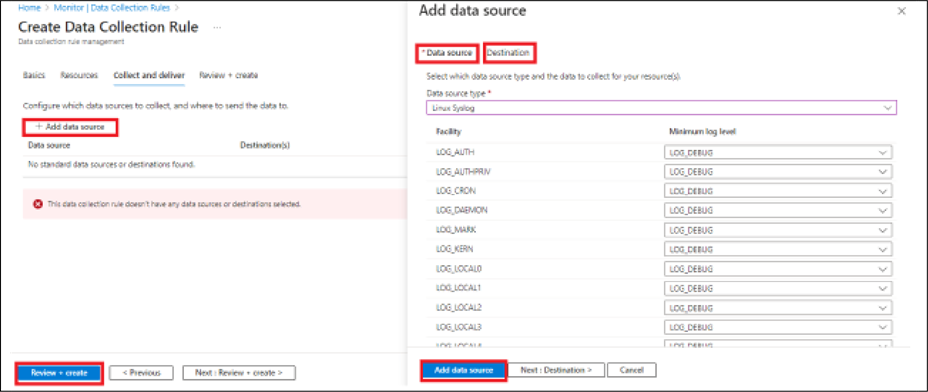
● Select Add data source. For Data source type, select Linux syslog.
● For Minimum log level, leave the default value, LOG_DEBUG.
● Select Next: Destination.
● Select Add destination. Enter the following values:
Table 2. Mandatory fields for the Destination settings
| Field |
Value |
| Destination type |
Azure Monitor Logs |
| Subscription |
Select the appropriate subscription |
| Account or namespace |
Select the appropriate Log Analytics workspace |
● Select Add data source. Select: Review + create.
● Select Create. Wait for 20 minutes.
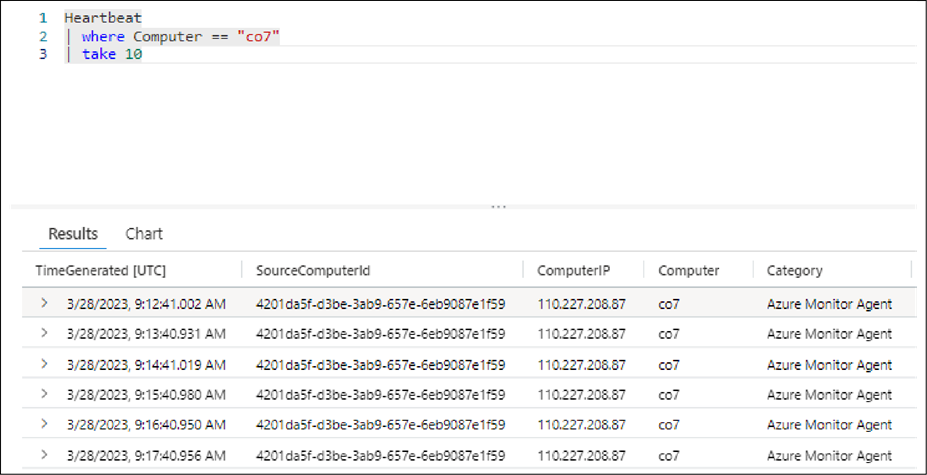
● In Microsoft Sentinel or Azure Monitor, verify that the Azure Monitor agent is running on your VM.
● In the Azure portal, search for and open Microsoft Sentinel or Monitor. If you're using Microsoft Sentinel, select the appropriate workspace. Under General, select Logs. Close the Queries page so that the New Query tab is displayed.
● Run the following query, replacing the Computer value with the name of your Linux virtual machine.
Heartbeat
| where Computer == "vm-ubuntu"
| take 10
Reference: Tutorial: Forward Syslog data to a Log Analytics workspace with Microsoft Sentinel by using Azure Monitor Agent (https://learn.microsoft.com/en-us/azure/sentinel/forward-syslog-monitor-agent)
Deploy a Cisco Catalyst SD-WAN Sentinel Workbook
● Sign in to the Azure portal (https://portal.azure.com/#home).
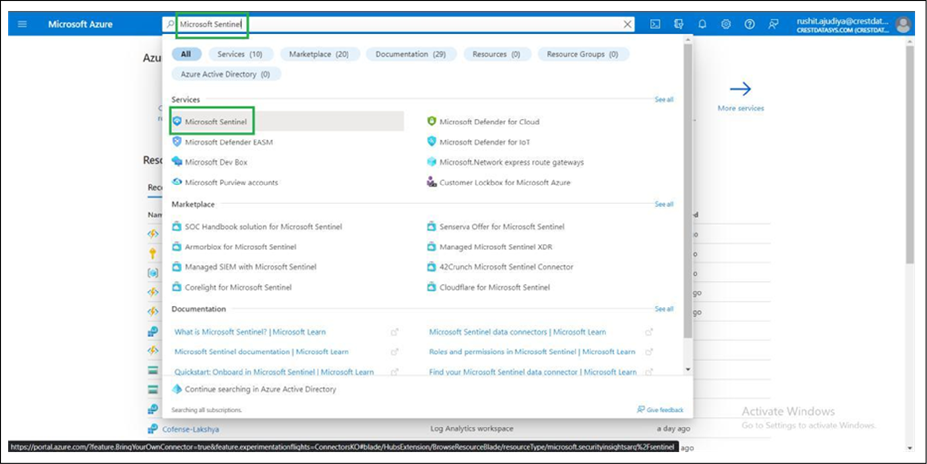
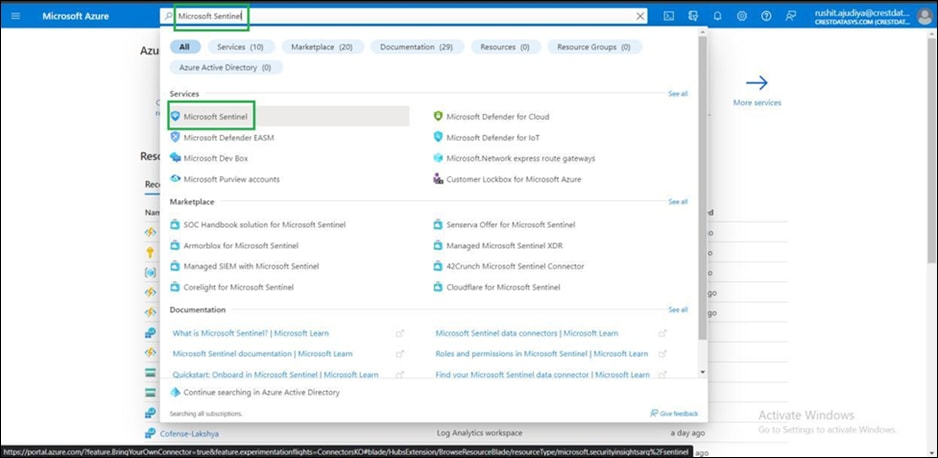
● Search for the Microsoft Sentinel service in the Azure portal search bar, and select it.
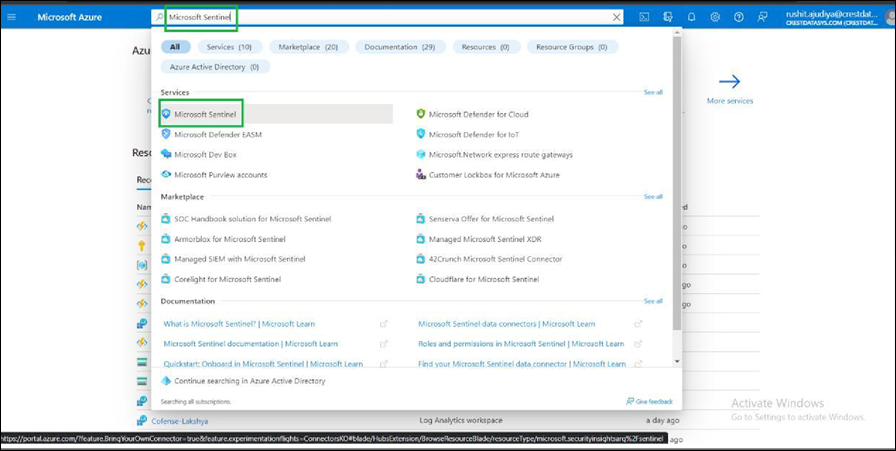
● Select the Microsoft Sentinel workspace in which you want to deploy the workbook.
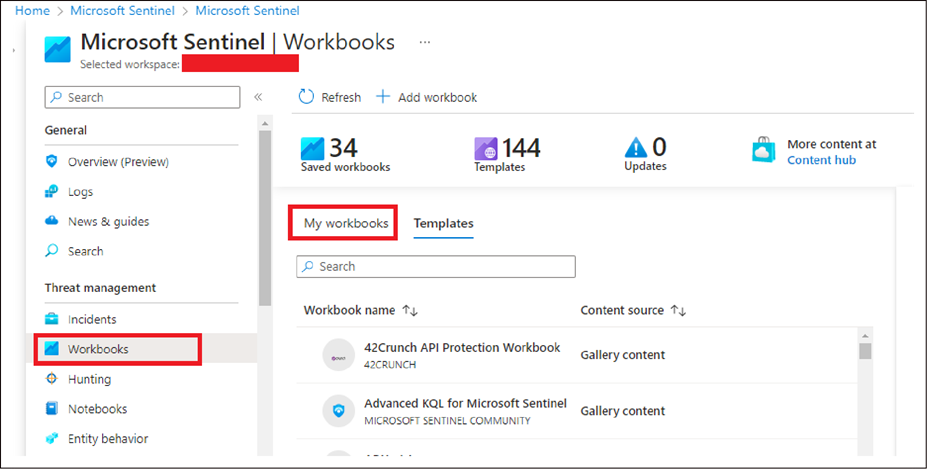
● In the left panel, select Workbooks.
● Click Add Workbook.
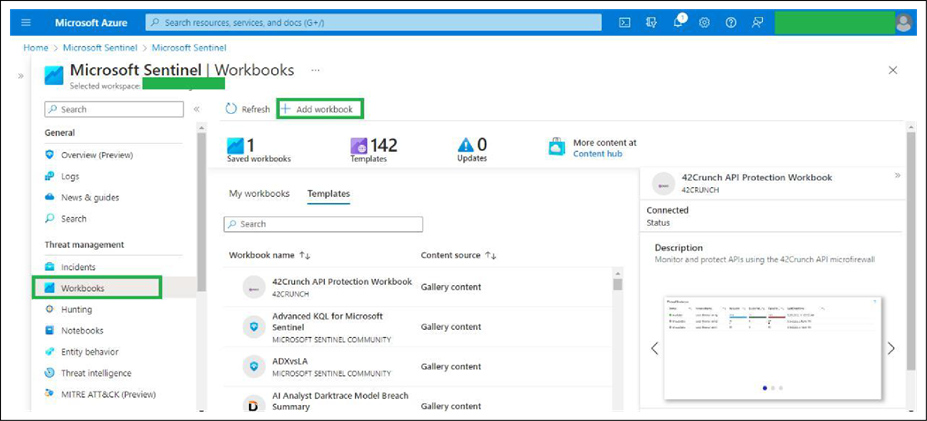
● Click Edit.
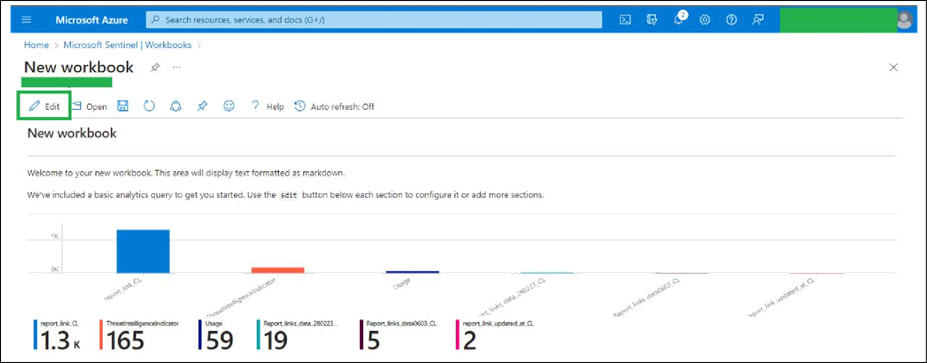
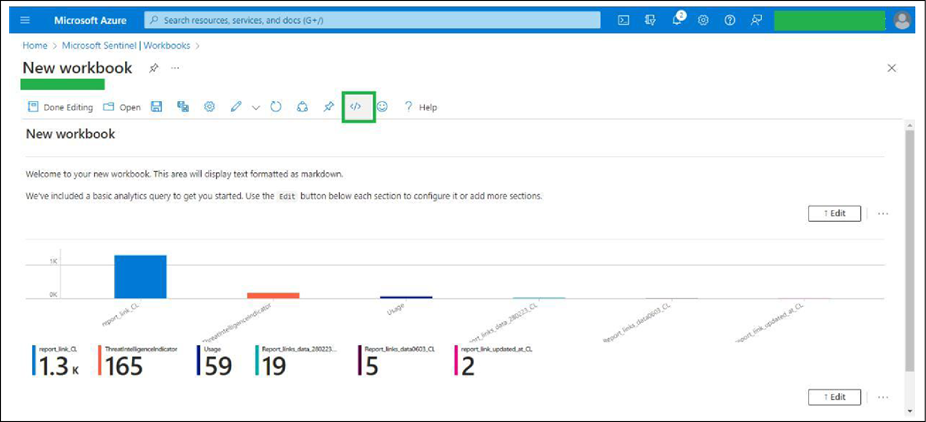
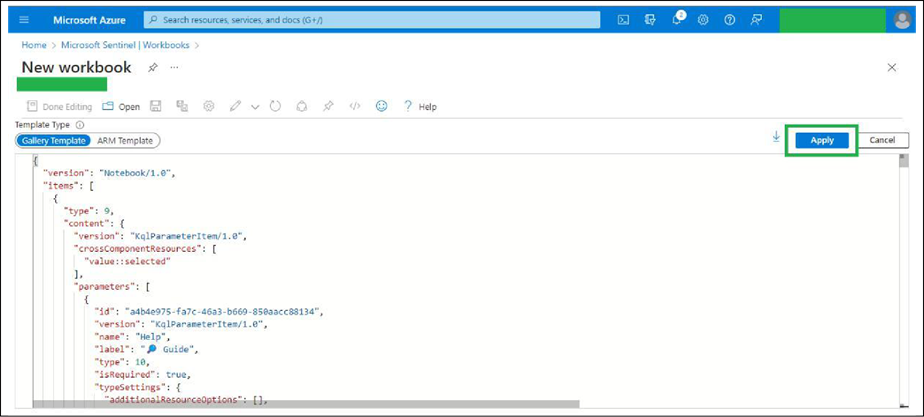
● Click the Advanced Editor button, as shown in the image below.
● For Template Type, choose Gallery Template and remove all the code within the code editor. Then paste the contents of the CiscoSDWAN.json file (provided by us and located in the workbooks directory) into the code editor.
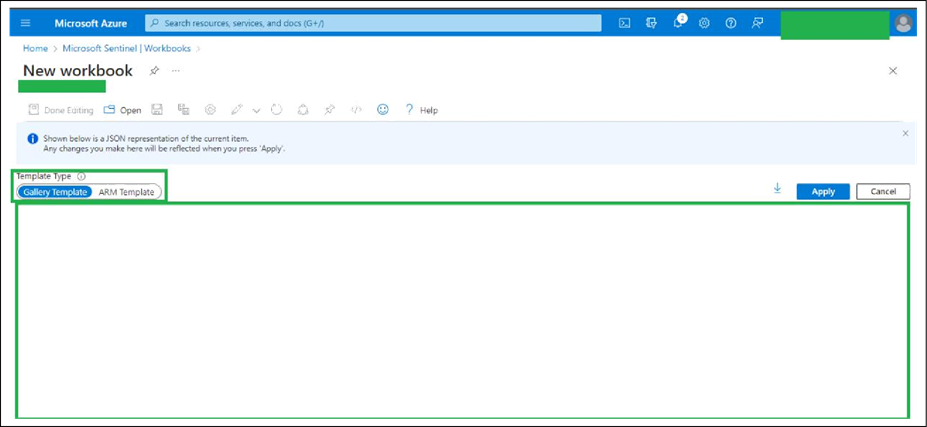
● Click Apply.
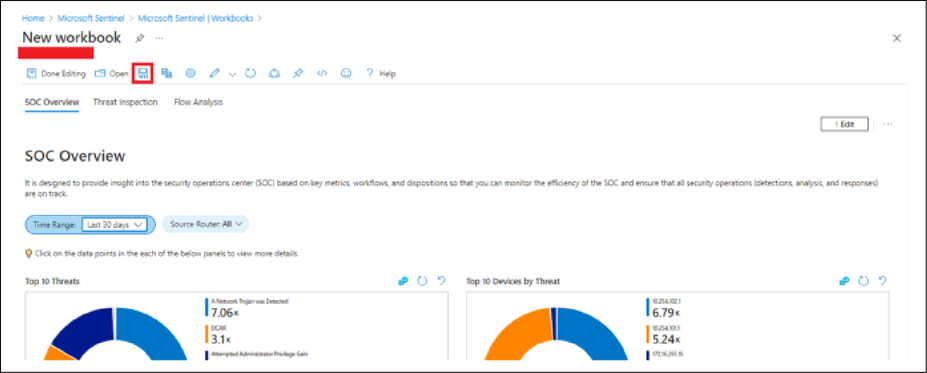
● Click the Save button, as shown in the image below.
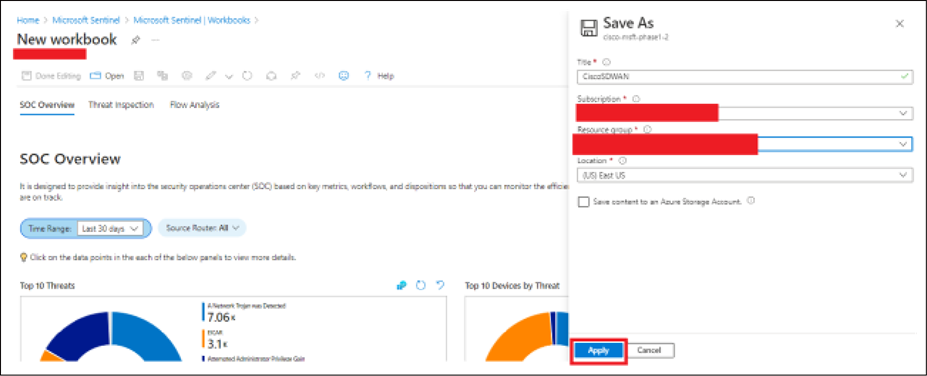
● Add the required data in the fields as shown in the image below (for example, Title: Cisco SD-WAN). Then click Apply.
Steps to deploy the Cisco Catalyst SD-WAN Sentinel parser functions
● Sign in to the Azure portal (https://portal.azure.com/#home).
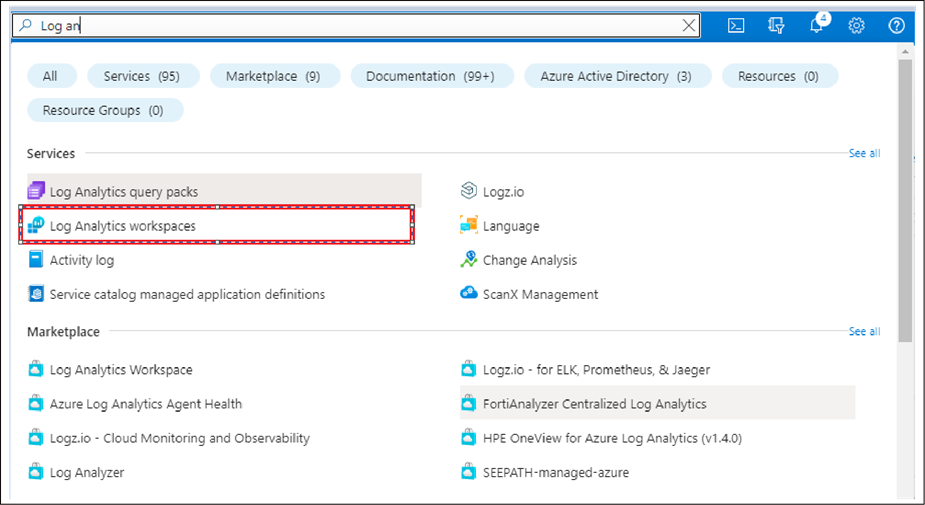
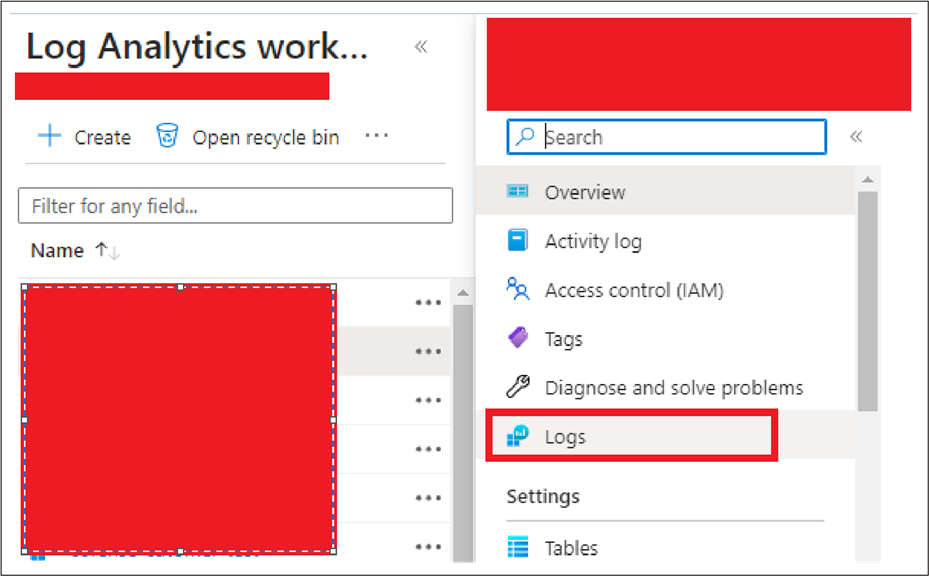
● Search for the Log Analytics workspaces service in the Azure portal search bar, and select it.
● Select the workspace where the NetFlow or syslog data is collected.
● Select the Logs option.
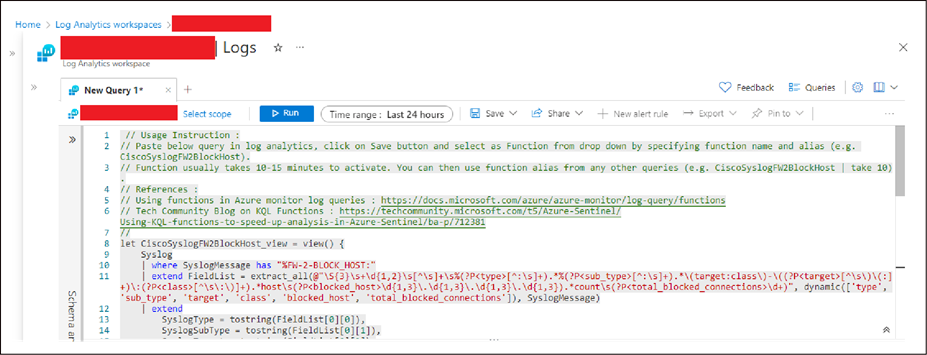
● Copy and paste the parser functions provided by us (in the Parsers directory).
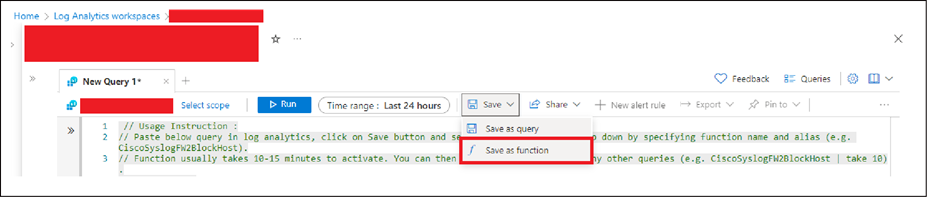
● Click Save as function.
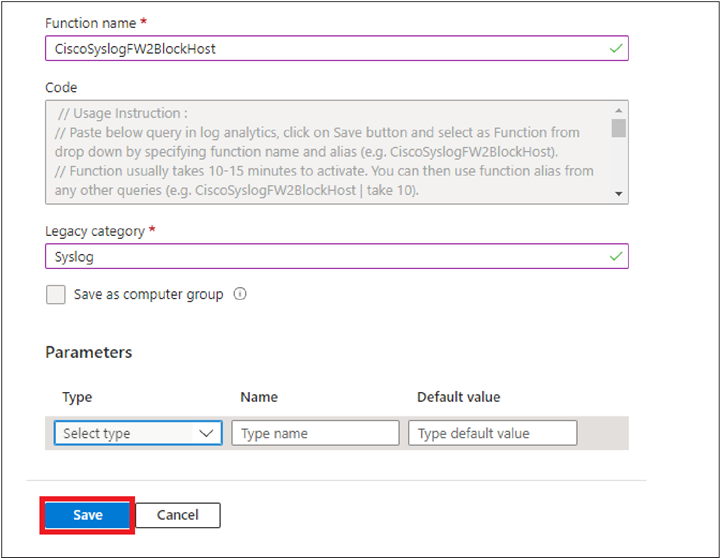
● Enter the function name exactly as provided in the query's function name. Provide any other necessary details and click Save.
Note:
● To add other parsers that are in the Parsers directory, follow the above steps as needed.
Steps to deploy a Cisco Catalyst SD-WAN Sentinel analytic rule
● Log in to the Azure portal (https://portal.azure.com/#home) using the MS Azure credentials.
● Search for the Microsoft Sentinel service in the Azure portal search bar and select it.
● Select the Microsoft Sentinel workspace in which you want to deploy the solution.
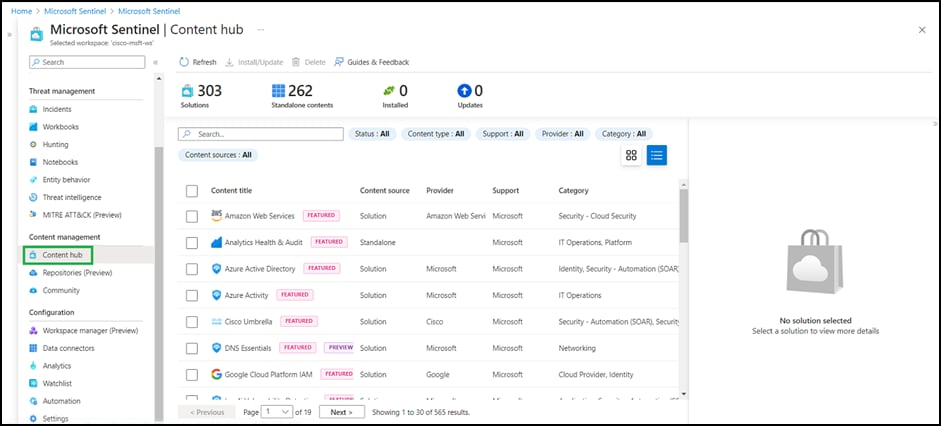
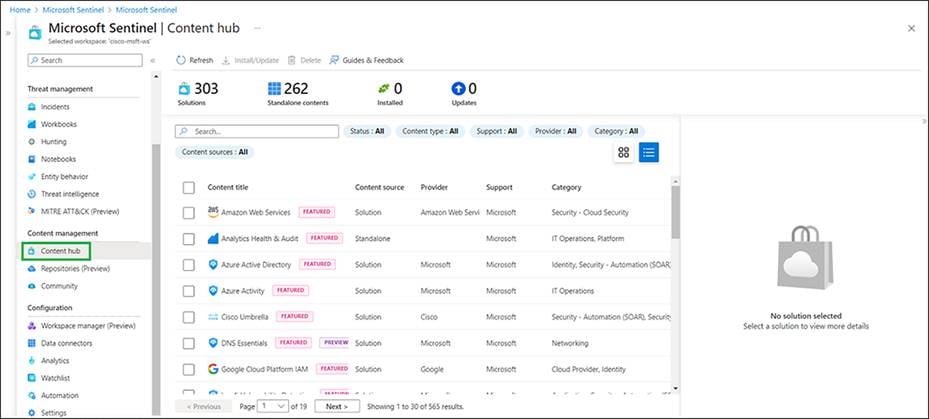
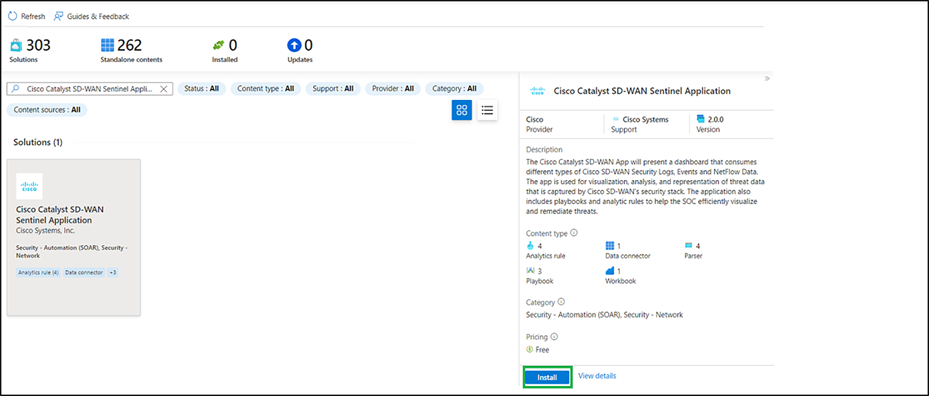
● In the left panel, scroll down and select Content Hub.
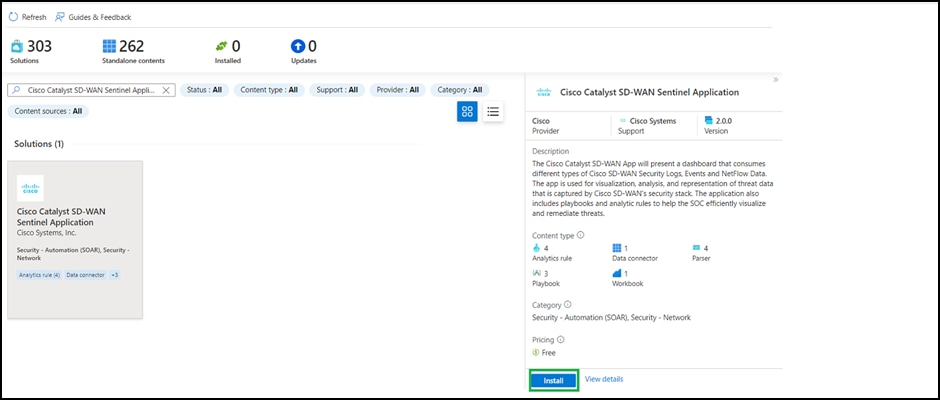
● Use the search bar in Content Hub to look for the solution. Once the solution is certified in GitHub, it will become available in the Content Hub.
● Click on your solution and from the right panel click Install.
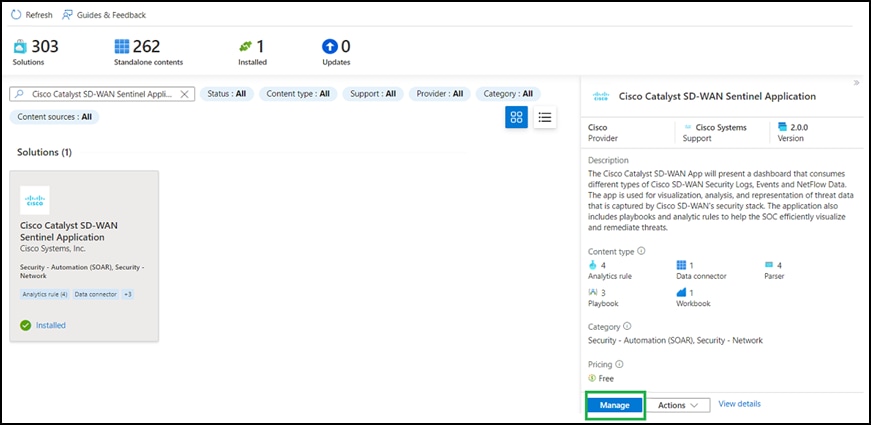
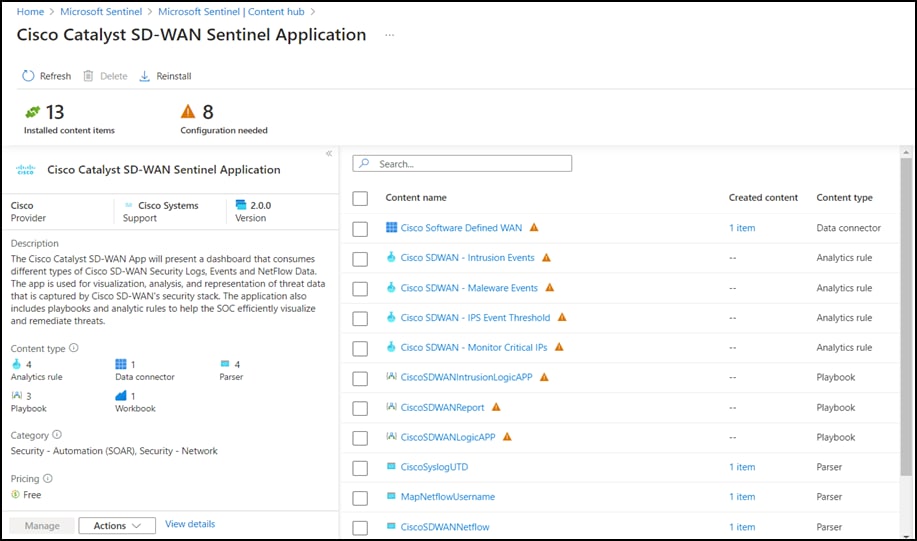
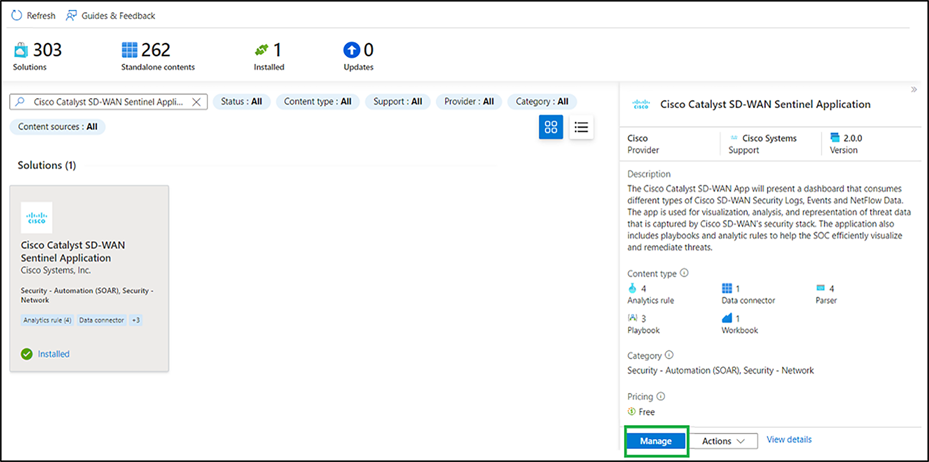
● Now go to Content Hub from the Microsoft Sentinel workspace and search for the solution you have installed. It will show the status as installed; click Manage in the right panel.
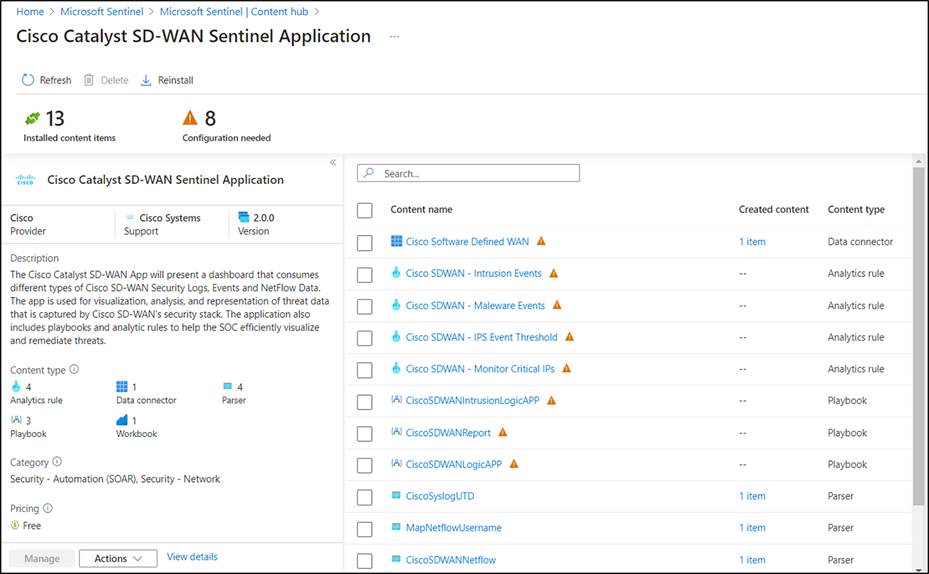
● In the Cisco Catalyst SD-WAN solution, four parsers, one workbook, four analytic rules, and three playbooks will be available.
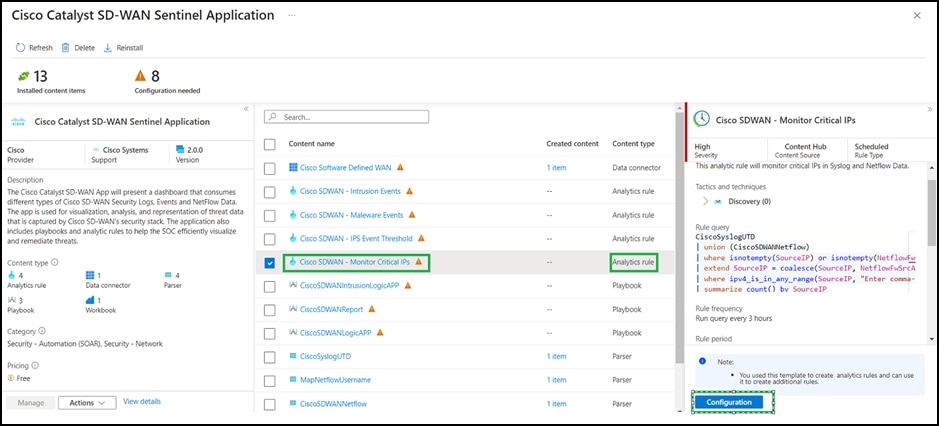
● Click the analytic rule you want to deploy and then click Configure.
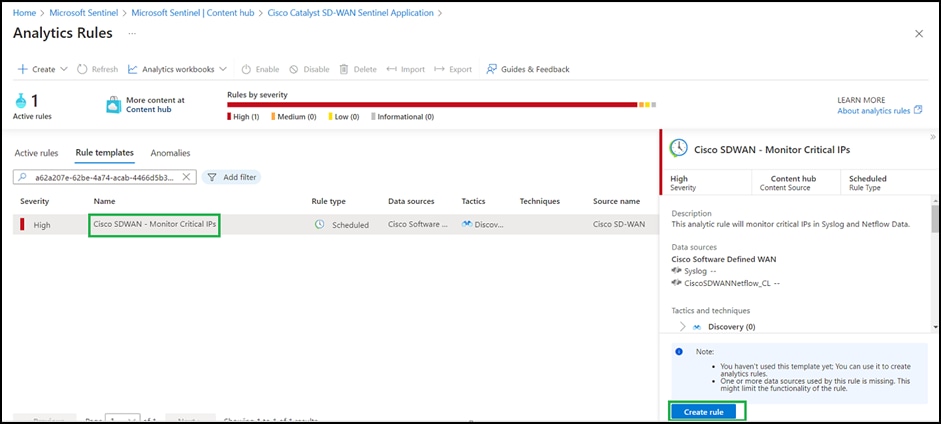
● Click the rule you want to deploy, then click Create rule.
Steps to deploy a Cisco Catalyst SD-WAN Sentinel playbook
● Log in to the Azure portal (https://portal.azure.com/#home) using the MS Azure credentials.
● Search for the Microsoft Sentinel service in the Azure portal search bar and select it .

● Select the Microsoft Sentinel workspace in which you want to deploy the solution.
● In the left panel, scroll down and select Content Hub.
● Use the search bar in Content Hub to look for the solution. Once the solution is certified in GitHub, it will become available in Content Hub.
● Click the solution, and from the right panel click Install.
● Now go to Content Hub from the Microsoft Sentinel workspace and search for the solution that you have installed. It will show the status as installed. Click Manage on the right panel.
● In the Cisco Catalyst SD-WAN solution, four parsers, one workbook, four analytic rules, and three playbooks will be available.
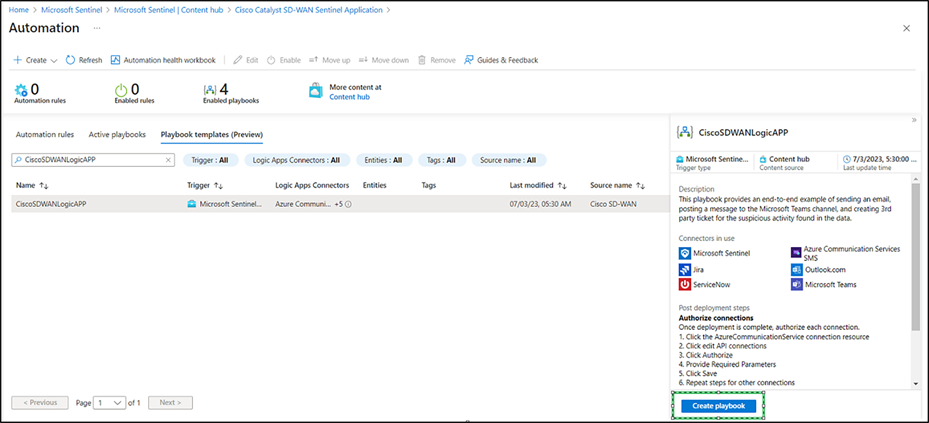
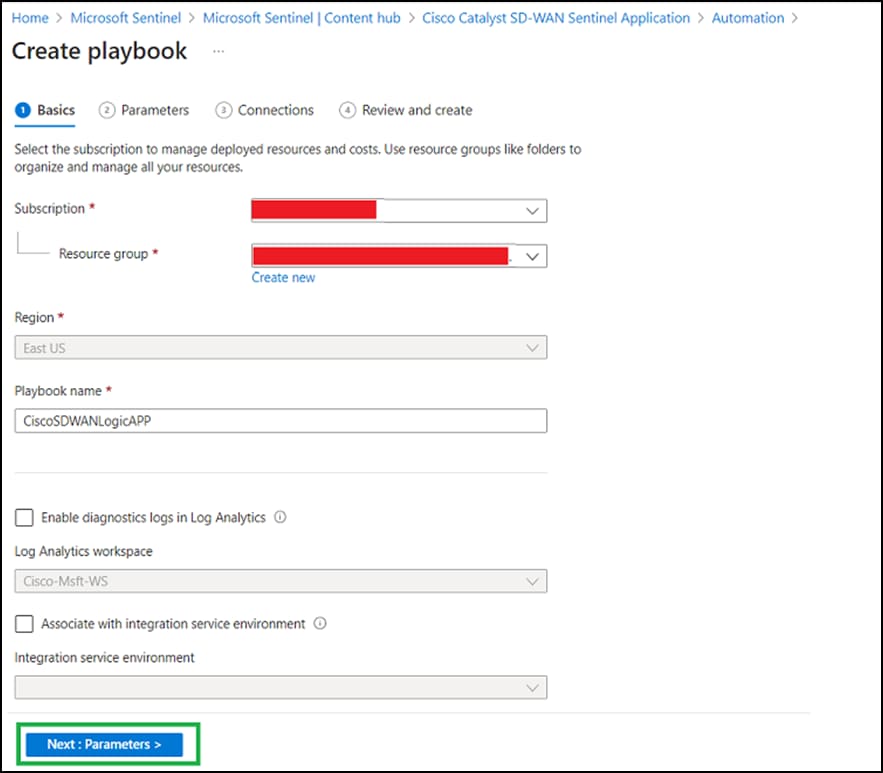
● On the next screen, go to the playbook template (preview) tab, search for the playbook name, select the playbook template, and click Create playbook.
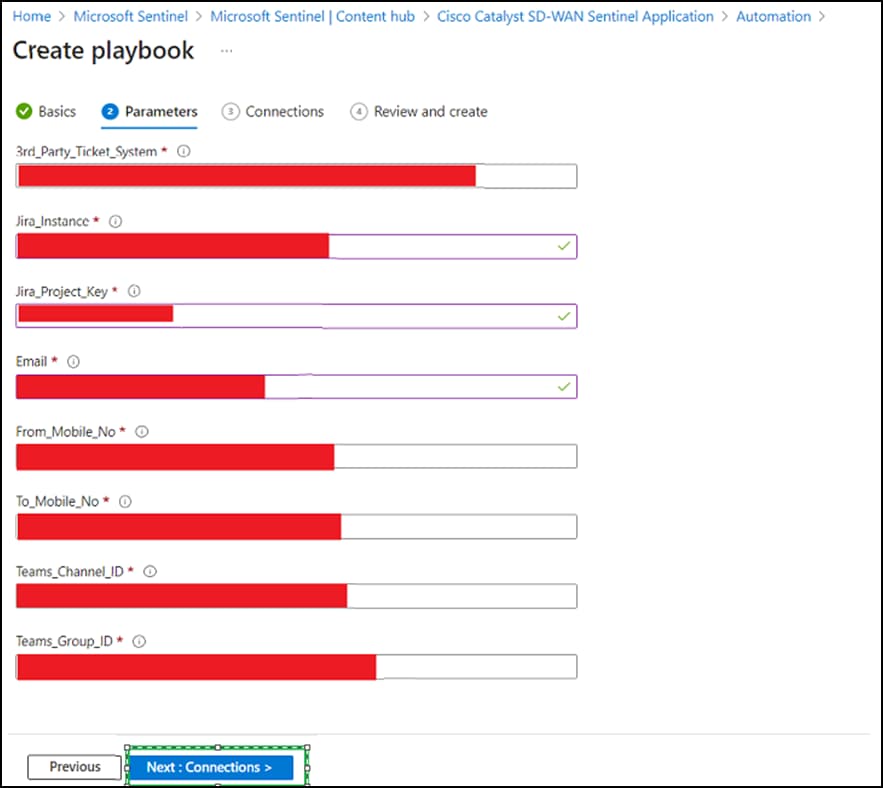
● Select the Subscription and Resource group and click Next: Parameters.
● Click Next: Connections.
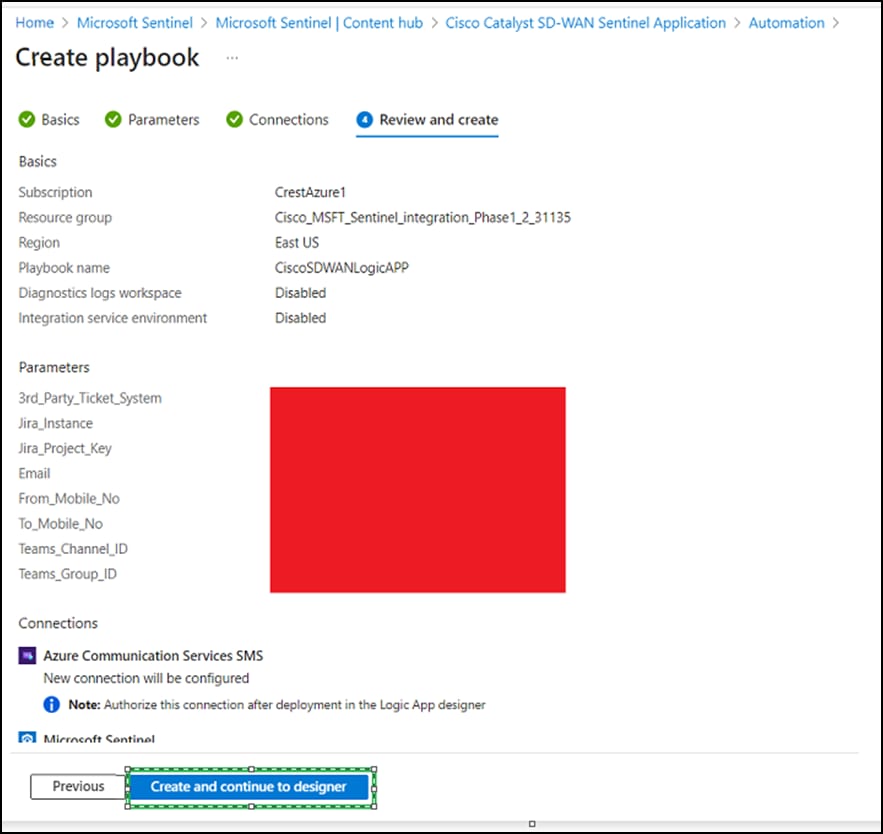
● Keep the Connections tab as is. Click Next: Review.
● Click Create and new to designer.
● Once deployment is complete, authorize each connection:
◦ Click the AzureCommunicationService connection resource.
◦ Click Edit API connections.
◦ Click Authorize.
◦ Provide the required parameters.
◦ Click Save.
◦ Repeat these steps for other connections.
Cisco Catalyst SD-WAN High Speed Logging (HSL) Records
The Sentinel application consumes HSL records (Netflow based) to populate the Zone Based Firewall (ZBFW) charts in the SOC Overview dashboard. To enable HSL, please follow the steps in the following link (step 5 of the link provided) https://www.cisco.com/c/en/us/td/docs/routers/sdwan/configuration/security/ios-xe-17/security-book-xe/m-firewall-17.html#Cisco_Concept.dita_f1b319e6-ec37-49e7-b9ec-9720fa161fa6.

Unified Security Logging
Unified Security Logs (Netflow based) are used to provide Username information and populate the ‘Top Policy Hits’ chart. To activate Unified Security Logging, enable the ‘Log’ flag under the Unified Security Policy summary page (step 7 of the below link) https://www.cisco.com/c/en/us/td/docs/routers/sdwan/configuration/security/ios-xe-17/security-book-xe/m-firewall-17.html#Cisco_Concept.dita_f1b319e6-ec37-49e7-b9ec-9720fa161fa6.
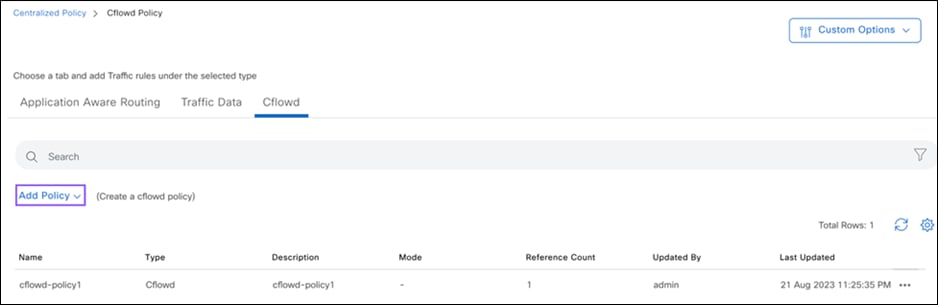
After completing the aforementioned step, proceed to create a Cflowd Monitoring Policy using the below steps https://www.cisco.com/c/en/us/td/docs/routers/sdwan/configuration/policies/ios-xe-17/policies-book-xe/traffic-flow-monitor.html#id_114091
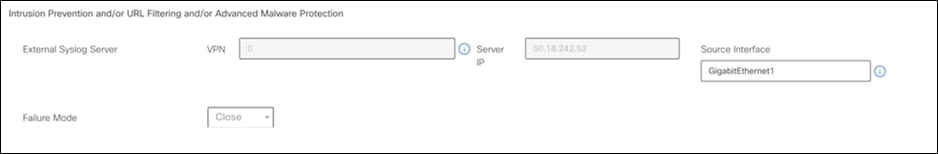
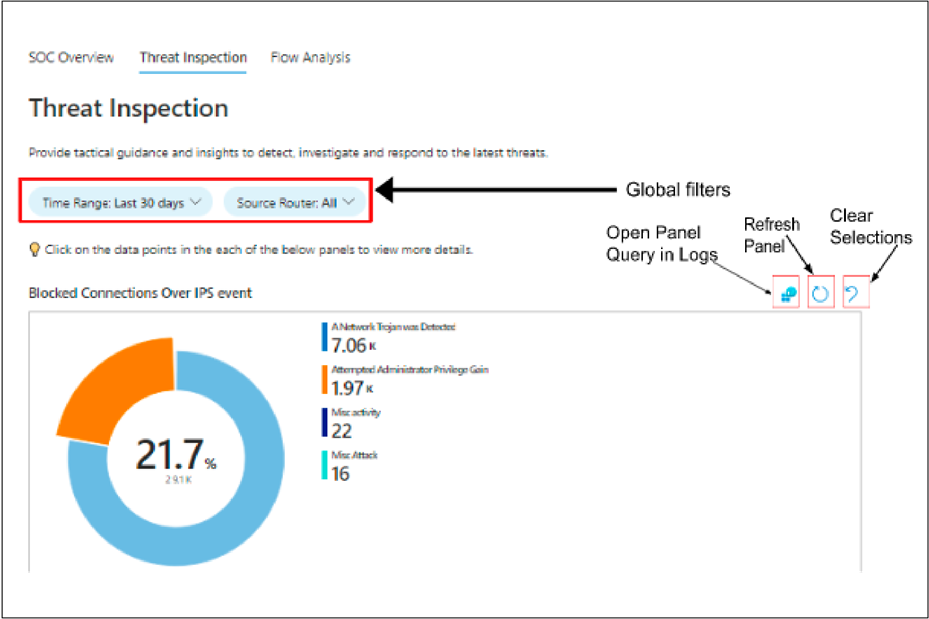
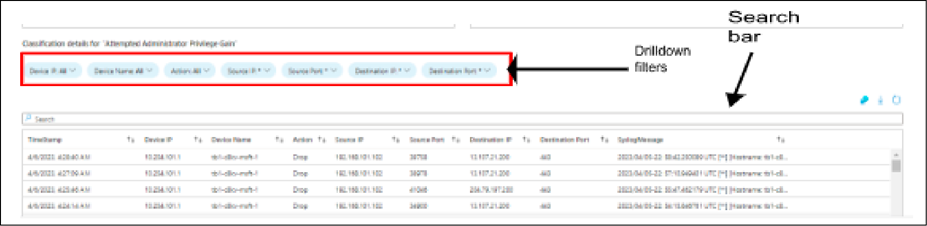
Syslog Configuration
The ‘Threat Inspection’ uses Syslog records to populate the dashboard charts. To configure syslog, follow step 12 of the following link https://www.cisco.com/c/en/us/td/docs/routers/sdwan/configuration/security/ios-xe-17/security-book-xe/m-irewall-17.html#Cisco_Concept.dita_f1b319e6-ec37-49e7-b9ec-9720fa161fa6.
● Sign in to the Azure portal (https://portal.azure.com/#home).
● Search for the Log Analytics workspaces service in the Azure portal search bar and select it.

● Select the workspace where the NetFlow or syslog data is collected.
● Sign in to the Azure portal (https://portal.azure.com/#home).
● Search for the Microsoft Sentinel service in the Azure portal search bar and select it.
● Select the Microsoft Sentinel workspace in which you want to deploy the workbook.
● In the left panel, select Workbooks and then the My Workbooks tab.
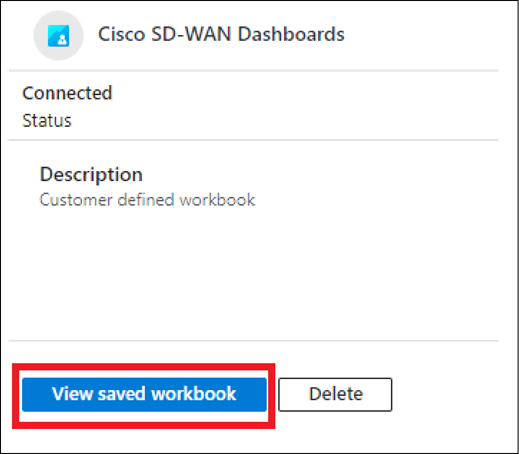
● Select the created workbook and click on the saved workbook.
[SR] > This does make sense as ‘workbooks’ here is located in multiple locations on the app
Workbook
Table 3. Workbook Limitations
| Visualization/parameter |
Limits |
| Grid |
Grids can display a maximum of 10,000 rows. Any further items are ignored, and a warning appears. |
| Charts |
Charts are limited to 100 series. Charts are limited to 10,000 data points. |
| Maps |
Maps are limited to displaying 100 points. Any further items are ignored, and a warning appears. |
| Drop-down |
Drop-down-based parameters are limited to 1000 items. Any items returned by a query after that are ignored. |
| Drop-down |
Drop-down is reset if no results are found in a particular time range, even though the default value is set. |
| Pie chart |
In pie charts, whichever portion has the highest coverage is overridden. If the selected value has the highest coverage, it does not get overridden. |
● Tutorial: Forward Syslog Data to a Log Analytics Workspace with Microsoft Sentinel by Using Azure Monitor Agent: https://learn.microsoft.com/en-us/azure/sentinel/forward-syslog-monitor-agent
● Quickstart: Connect Hybrid Machines with Azure Arc-Enabled Servers:
https://learn.microsoft.com/en-us/azure/azure-arc/servers/learn/quick-enable-hybrid-vm
● Workbooks Result Limits: https://learn.microsoft.com/en-us/azure/azure-monitor/visualize/workbooks-limits