Performance Monitoring of a 5G Hybrid Cloud Network White Paper
Available Languages
Bias-Free Language
The documentation set for this product strives to use bias-free language. For the purposes of this documentation set, bias-free is defined as language that does not imply discrimination based on age, disability, gender, racial identity, ethnic identity, sexual orientation, socioeconomic status, and intersectionality. Exceptions may be present in the documentation due to language that is hardcoded in the user interfaces of the product software, language used based on RFP documentation, or language that is used by a referenced third-party product. Learn more about how Cisco is using Inclusive Language.
1 Network Monitoring Architecture
A networking monitoring solution is a proactive measure undertaken to anticipate potential network outages and address them ahead of time. This type of solution helps to maintain a seamless, congestion-free, and efficient network. A network monitoring solution reports the performance of a network, forecasts key performance indicators, and helps you make architectural decisions to enhance the network in capacity and efficiency. To be able to remotely visualize your network performance is not simply a wish anymore, it is a necessity.
1.1 The Dish Networks Architecture: Overview
Before we dig into the network monitoring strategy, let us briefly examine the architecture of Dish Networks. The network deployment of different flavors of hardware and software is a combination of on-premises (cell site, local and Provider Edge data centers) and Cloud (Breakout Edge, national and regional data centers) architecture, or simplistically called a Hybrid Cloud Model. This makes monitoring the network a greater challenge, wherein your strategy should seamlessly work for both on-premises and Cloud elements of the network. Further details of the Cloud architecture that is an Amazon Web Services (AWS) deployment is captured in this article.
Telemetry (or Model-Driven Telemetry) is the recommended network monitoring strategy for Dish Networks. It is fast, reliable, easy to use, and deterministic. The device (itself) can stream the data of interest in a structured format for a collector/visualization engine to read and interpret. The format (or model) of data supported on a Cisco® router (and XRv or Cisco’s Cloud router on AWS) are:
a) Open Config models
b) Internet Engineering Task Force (IETF) models
c) Native YANG models **
Cisco has recommended using the native Yet Another Next Generation (YANG) model (operational/configuration) to stream the data of interest out of the router to a network monitoring engine, based on the outstanding coverage and support we have with native YANG models compared to Open Config and IETF models.
Here is a snapshot of Cisco IOS XR data models on GitHub.
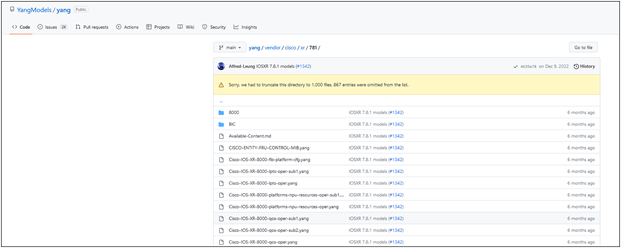
IOS XR 7.8.1 Data Models
The data of interest that we want to stream out of our routers are divided into three layers:
a) Data model layer – The information (raw data) from the router’s database is mapped into a data model (YANG definition) and is ready to be streamed out of a device using an assortment of transport mechanism.
b) Producer layer – There is a cadence definition (or time interval) required to stream your YANG-based data out of the router to a collector. If you don’t specify a cadence (time interval = 0), you are initializing Event-Driven Telemetry. For MDT or Model-Driven Telemetry, we always specify a cadence based on the importance (criticality) of the data being monitored.
c) Exporter Layer – There is an encoding and transport mechanism defined to export this data out of your router to a centralized collector. The mechanism is defined based on several requirements like security, sizing, and granularity of the information.
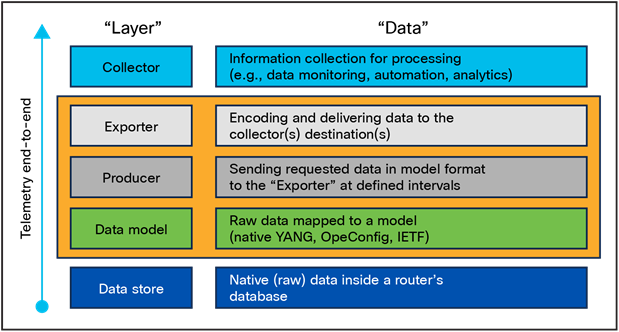
Telemetry Layers
All the three layers defined above are independent of each other; changing one won’t impact the other.
What transport and encoding mechanism is Dish Networks using for their network monitoring?
gNMI (Google Network Management Interface) is the transport mechanism (dial in) used along with gRPC as the protocol (over HTTP/2) and JSON_IETF as the data format. This was defined by the OpenConfig forum (mostly lead by Google, based on the Google Remote Procedure Call [RPC] framework), and the specification is available here. There are other transport, protocol, and encoding mechanisms available as shown in Figure 3, but gNMI is the approach incorporated at Dish Networks.
What is the advantage of using dial-in over the dial-out approach?
Once we had modeled our network on software-defined networking, it was an easy choice to go for the dial-in approach (over dial-out). We wanted a single software-defined controller to manage configuration and monitoring of the entire network. Instead of touching close to 20,000 network elements with configuration, we would define it on the controller and implement the “pull” method to stream data from the network.
What is the advantage of using gNMI or OpenConfig RPC model over the Cisco IOS XR MDT RPC?
In a 5G Open Radio Access Network (oRAN), the ideal approach was to go for a vendor-neutral Model-Driven Telemetry to be in line with the ideology of the customer. Cisco IOS XR supports the Google network management interface framework in combination with the native YANG models supported on the routers. It greatly simplifies telemetry configuration by having to start only the gRPC server on the router.
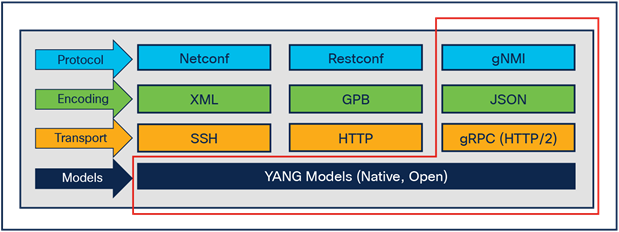
Streaming Methodology - Dish Networks
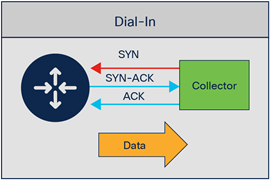
Dial IN with gRPC.
This section outlines the workflow process; every component of this workflow will be explained in subsequent sections of this white paper.
● Define Key Performance Indicators and telemetry sensors for transport network.
● Enable sensors in the form of a collection job on Cisco Crosswork Network Controller
● Collection jobs will contain gNMI subscribe requests of all sensors toward the transport network.
● Crosswork Data Gateway (CDG), an application of Cisco Crosswork Network Controller (CNC), triggers these Subscribe Requests (either per sensor or for all sensors) toward the transport network in the form of collection jobs.
● The transport devices respond back with “raw data” (gNMI response to the CDG)
● The raw data is then published into the Cisco Software-Defined Networking (SDN) Kafka Message Bus (to a specific topic)
● Matrix (Collector) pulls the raw data from Kafka via the topic.
● KPI and analytics logic are applied, and monitoring dashboards are created for end-user consumption.
● Processed KPIs and anomaly detection is pushed to Kafka for consumption of other applications (like Vitria which is our fault management application)
2.2 Software-Defined Networking – Controller
The essential functions of Cisco’s Software-Defined Networking Controller that play a major role in the performance monitoring function are:
1) CNC or Cisco Crosswork Network Controller – It is used to onboard transport elements with respect to topology mapping and inventory management and facilitate data collection in the form of telemetry, logs, and events.
2) CDG or Cisco Crosswork Data Gateway – It is a common collection platform for gathering network data from transport devices that support multiple data collection protocols including MDT, Simple Network Management Protocol (SNMP), Command-Line Interface (CLI), standards-based gNMI (dial-in), and syslog.
3) Matrix is a Cisco Performance Monitoring platform that can compute the health score of network elements, build KPI dashboards for network monitoring, detect threshold violation with the help of anomaly detection, and even assist in event generation (essentially the anomaly detection), which is sent to the fault management platform for further correlation (more details below).
4) Kafka Message Bus is an internal communication framework between the above applications. All data from various devices and applications is published into the Kafka Message Bus for further consumption and processing (more details below).
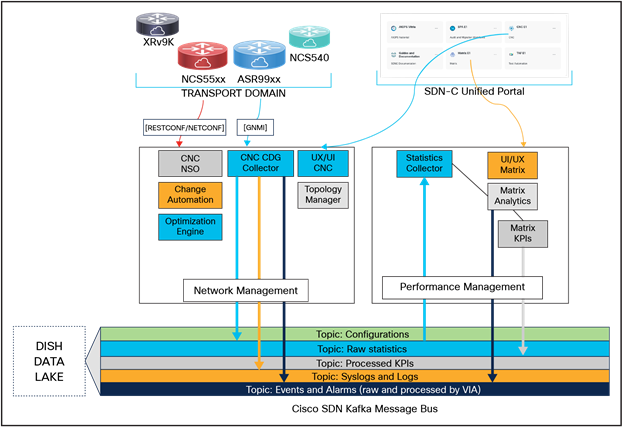
SDN-C Components Workflow
2.3 Matrix – Performance Monitoring with AI/ML
Matrix is a multi-vendor analytics platform that performs anomaly detection, correlation, and forecasting based on infrastructure and application insights and subsequently triggers action with orchestrator tools.
As far as end-to-end network intelligence goes, Matrix can correlate data and logs gathered from numerous network elements and formulate easily consumable reports. Insights that we gain from such reports can be applied to problem solving and operational efficiency of the customer network.
Matrix also has capacity planning capability with the help of forecasting and historical trends developed using telemetry data streamed from network elements.
The tool provides advanced analytics including logic-based health scores and real-time performance view of network applications, and physical and virtual network infrastructure.
The Kafka Message Bus, which is an open-source application from Apache Kafka, is a consumer of telemetry data, alerts, metrics, and events from network elements including routers and monitoring tools. In a Message Bus, we support separate topics and partitions for different categorization of data. One or more producers can write, and one or more consumers can read from a Kafka Message Bus (specifically a topic) at the same time.
In the Figure 5, look at all the topics in the Message Bus and the corresponding consumers and producers of that topic (note the arrows).
It is critical that we identify the Key Performance Indicators that will help us monitor the performance of a network. For the 5G Dish transport network, we have an assortment of network elements, both on physical environment and virtual (cloud) infrastructure. The one size fits all type of KPI definition might not work in such a diverse heterogenous network. There will be KPIs only applicable to cell site routers and not relevant to other edge routers (physical/cloud). There will be KPIs applicable to all physical routers but not relevant to cloud routers (like hardware KPIs). And then there will be KPIs applicable to all routers in the network.
The important KPIs (among many others) defined for dish networks are:
1) System
a. CPU Utilization
b. Network Processing Unit (NPU) Utilization
c. Memory Utilization
2) Routing
a. Intermediate System to Intermediate System (ISIS) Route Counts
b. Border Gateway Protocol (BGP) Route Counts
c. ISIS/BGP Neighbor States
3) Services
a. Interface Bandwidth Utilization
b. Generic Routing Encapsulation (GRE) Tunnel Bandwidth Utilization
c. Interface Ingress/Egress Throughput
d. GRE Tunnel Ingress/Egress Throughput
e. Quality of Service (QoS) Packets Transmitted/Drops
f. Interface State
g. Interface Errors
h. Path Latency
4) Hardware
a. Environment Temperature
b. Optics Health
c. Chassis Status
d. Media Storage Status
5) Timing
a. PTP Interface State
b. PTP Interface Status
c. SyncE Status
d. Grand Master (GM) Status
e. Global Navigation Satellite System (GNSS) Status
Identifying a KPI is the first step of the streaming puzzle, the second step is figuring out how to stream that data out of the device. To be able to stream a data we need a transport and a data modeling mechanism.

gNMI (Transport) & YANG (Data Modeling)
Once you have identified the KPI, you need to verify if your device has a data model for the corresponding KPI. Let us look at a few examples.
CPU
| <router>#show processes cpu thread location 0/rp0/CPU0 Thu Feb 2 16:30:05.504 UTC ---- node0_RP0_CPU0 ---- CPU utilization for one minute: 6%; five minutes: 5%; fifteen minutes: 6% |
| <router>#yang-describe operational show processes cpu thread location 0/rp0/CPU0 Thu Feb 2 16:31:14.362 UTC YANG Paths: Cisco-IOS-XR-wdsysmon-fd-oper:system-monitoring/cpu-utilization |
So, do we have the YANG capability (or the corresponding data model) to be able to stream this data out of the device?
| <router>show netconf-yang capabilities | inc wdsysmon-fd-ope Thu Feb 2 16:32:57.226 UTC http://cisco.com/ns/yang/Cisco-IOS-XR-wdsysmon-fd-oper |2019-07-05| |
Looks like we do. Let us look at another data.
Memory
| <router>#show memory summary Thu Feb 2 16:34:08.880 UTC
node: node0_RP0_CPU0 ----------------------------------------------------------------
Physical Memory: 26292M total (26272M available) Application Memory : 26292M (26272M available) Image: 4M (bootram: 0M) Reserved: 0M, IOMem: 0M, flashfsys: 0M Total shared window: 969M
<router>#yang-describe operational show memory summary Thu Feb 2 16:34:29.320 UTC YANG Paths: Cisco-IOS-XR-nto-misc-oper:memory-summary/nodes/node/detail
<router>#show netconf-yang capabilities | inc nto-misc-oper Thu Feb 2 16:35:16.422 UTC http://cisco.com/ns/yang/Cisco-IOS-XR-nto-misc-oper |2022-01-25| |
If you want to look at the structure and content of the operational data model, this is how you do it on the device itself:
| <router>#show yang operational nto-misc-oper:memory-summary JSON Tue Jun 20 16:29:56.055 UTC { "Cisco-IOS-XR-nto-misc-oper:memory-summary": { "nodes": { "node": [ { "node-name": "0/RP0/CPU0", "summary": { "page-size": 4096, "ram-memory": "8061009920", "free-physical-memory": "2902458368", "system-ram-memory": "8061009920", "free-application-memory": "2902458368", "image-memory": "4194304", "boot-ram-size": "0", "reserved-memory": "0", "io-memory": "0", "flash-system": "0" }, "detail": { "page-size": 4096, "ram-memory": "8061009920", "free-physical-memory": "2902458368", "private-physical-memory": "0", "system-ram-memory": "8061009920", "free-application-memory": "2902458368", "image-memory": "4194304", "boot-ram-size": "0", "reserved-memory": "0", "io-memory": "0", "flash-system": "0", "shared-window": [ { "shared-window": "ptp", "window-size": "36904" }, { "shared-window": "soasync-app-1", "window-size": "249168" },
… … … … // truncated from snippet // … … … ], "total-shared-window": "536998660", "allocated-memory": "0", "program-text": "140721518205504", "program-data": "1", "program-stack": "0", "total-used": "5158551552" } } ] } } } |
3.3 Defining telemetry sensors
We have managed to take a sneak peek at two telemetry sensor definitions in the last section. So, how do we arrive at a telemetry sensor from the KPI definition? Thankfully, with Cisco’s latest IOS XR releases, we have that option available readily at our fingertips using the “yang-describe” command. You can now fetch the YANG model (both operational and configuration) and the path for that specific command/CLI.
| <router>#yang-describe ? configuration Describe configuration commands(cisco-support) operational Describe operational commands(cisco-support) |
Here is an example of deriving Bidirectional Forwarding Detection (BFD) session sensor directly from the BFD session “show” CLI command.
| <router>#yang-describe operational show bfd session Thu Feb 16 04:17:15.867 UTC YANG Paths: Cisco-IOS-XR-ip-bfd-oper:bfd/session-briefs/session-brief |
Here is another example of deriving a sensor directly from the “show” CLI command.
| <router>#yang-describe operational show memory summary Thu Feb 16 04:21:11.361 UTC YANG Paths: Cisco-IOS-XR-nto-misc-oper:memory-summary/nodes/node/detail |
A few more examples of arriving at the exact sensor path for the corresponding command that you are running on the router.
| <router>#yang-describe operational show interfaces HundredGigE 0/0/0/1 Tue Jun 20 16:41:18.805 UTC YANG Paths: Cisco-IOS-XR-pfi-im-cmd-oper:interfaces/interface-xr/interface
<router>#yang-describe operational show cef summary Tue Jun 20 16:41:27.680 UTC YANG Paths: Cisco-IOS-XR-fib-common-oper:fib/nodes/node/protocols/protocol/fib-summaries/fib-summary |
Now, deriving all telemetry sensors may not be this straightforward. There are scenarios in which you will have to pull data from the router by looking at a combination of data models; we call them augmented sensors. Here is an example of an augmented sensor: if you explore the Cisco-IOS-XR-NCS-BDplatforms-npu-resources-oper.yang data model, you will notice that to fetch specific data via this model, you will need to augment data from another data model, which is Cisco-IOS-XR-platforms-ofa-oper.yang.
| <server># pyang -f tree Cisco-IOS-XR-NCS-BDplatforms-npu-resources-oper.yang --tree-depth 4
module: Cisco-IOS-XR-NCS-BDplatforms-npu-resources-oper augment /a1:ofa/a1:stats/a1:nodes/a1:node: +--ro hw-resources-datas +--ro hw-resources-data* [resource] +--ro resource +--ro resource-id? uint32 +--ro num-npus? uint32 +--ro cmd-invalid? boolean +--ro asic-type? uint32 +--ro asic-name? string +--ro npu-hwr* [] +--ro npu-id? uint32 +--ro red-oor-threshold-percent? uint32 +--ro yellow-oor-threshold-percent? uint32 +--ro num-bank? int32 +--ro bank* [] ...
<server># pyang -f tree Cisco-IOS-XR-platforms-ofa-oper.yang --tree-depth 5 module: Cisco-IOS-XR-platforms-ofa-oper +--ro ofa +--ro stats +--ro nodes +--ro node* [node-name] +--ro node-name xr:Node-id |
After augmentation, the final sensor path to fetch hardware resources data for each NPU will look something like this:
| Cisco-IOS-XR-platforms-ofa-oper:ofa/stats/nodes/node/Cisco-IOS-XR-NCS-BDplatforms-npu-resources-oper:hw-resources-datas/hw-resources-data/npu-hwr/bank |
For older IOS XR releases where you don’t have support for the yang-describe command, we can look at the schema and arrive at the corresponding sensor (with a bit of digging and experience with platform-specific telemetry sensors).
| <router>#schema-describe show processes cpu thread location 0/rp0/CPU0 Thu Feb 2 17:05:15.854 UTC Action: get Path: RootOper.SystemMonitoring.CPUUtilization({'NodeName': '0/RP0/CPU0'}) |
As mentioned in Section 1.1, we have all the YANG models available publicly for specific Cisco releases, so you can look at it to arrive at a specific container/leaf of a YANG model.
| <server># pyang -f tree Cisco-IOS-XR-wdsysmon-fd-oper.yang --tree-path system-monitoring/cpu-utilization --tree-depth 3 module: Cisco-IOS-XR-wdsysmon-fd-oper +--ro system-monitoring +--ro cpu-utilization* [node-name] +--ro node-name xr:Node-id +--ro total-cpu-one-minute? uint32 +--ro total-cpu-five-minute? uint32 +--ro total-cpu-fifteen-minute? uint32 +--ro process-cpu* [] ... |
From the above YANG tree display, if your KPI is “total-cpu-five-minute,” then the telemetry sensor will be:
| Cisco-IOS-XR-wdsysmon-fd-oper:system-monitoring/cpu-utilization/total-cpu-five-minute |
If you want to define the sensor for a specific location or node name, you can substitute the variable and define the telemetry sensor as below:
| module: Cisco-IOS-XR-wdsysmon-fd-oper +--ro system-monitoring +--ro cpu-utilization* [node-name] +--ro node-name xr:Node-id +--ro total-cpu-one-minute? uint32 +--ro total-cpu-five-minute? uint32 +--ro total-cpu-fifteen-minute? uint32 +--ro process-cpu* [] ...
Cisco-IOS-XR-wdsysmon-fd-oper:system-monitoring/cpu-utilization |
You can also use regular expression instead of the variable name inside a sensor. Let us take an example of interface statistics. If you want to fetch the statistics for all interfaces from the router, you can use this sensor:
| Cisco-IOS-XR-drivers-media-eth-oper:ethernet-interface/statistics/statistic |
If you want to fetch the statistics for a specific interface from the device, refer to the data model, pick the variable-name, and use it to construct your sensor:
| module: Cisco-IOS-XR-drivers-media-eth-oper +--ro ethernet-interface +--ro statistics +--ro statistic* [interface-name] +--ro interface-name xr:Interface-name +--ro received-total-bytes? uint64 +--ro received-good-bytes? uint64 +--ro received-total-frames? uint64 +--ro received8021q-frames? uint64
Cisco-IOS-XR-drivers-media-eth-oper:ethernet-interface/statistics/statistic |
Now, if you want to fetch the statistics for all hundred gigabit interfaces, you can use the following sensor path with a regular expression:
| Cisco-IOS-XR-drivers-media-eth-oper:ethernet-interface/statistics/statistic |
Also, note that there is a possibility of different sensors for different platforms for the same KPI. In the case of hardware-specific environment sensors, there will be different sensors for different platforms as the platforms are built differently.
The environmental sensor for a cell site router is defined below:
| Cisco-IOS-XR-envmon-oper:environmental-monitoring/rack/nodes/node/sensor-types/sensor-type/sensor-names/sensor-name |
The environmental sensor for a NCS5504 (Provider Edge Router) is defined below:
| Cisco-IOS-XR-sysadmin-fretta-envmon-ui:environment/oper/temperatures/location/sensor_attributes |
The environmental sensor for a ASR9903 (Provider Edge Router) is defined below:
| Cisco-IOS-XR-sysadmin-asr9k-envmon-ui:environment/oper/temperatures/location/sensor_attributes |
If you want to verify the JavaScript Object Notation (JSON) formatted data that will be streamed out of the router for a specific data model/container/leaf structure, the router has the capability to do it on the device itself.
| <router>#show telemetry internal json Cisco-IOS-XR-nto-misc-oper:memory-summary/nodes/node/summary Tue Jun 20 16:26:55.005 UTC { "encoding_path": "Cisco-IOS-XR-nto-misc-oper:memory-summary/nodes/node/summary", "subscription_id_str": "app_TEST_200000001", "collection_start_time": "1687278415456", "msg_timestamp": "1687278415465", "collection_end_time": "1687278415465", "node_id_str": "<router-hostname>", "data_json": [ { "keys": [ { "node-name": "0/RP0/CPU0" } ], "timestamp": "1687278415464", "content": { "page-size": 4096, "reserved-memory": "0", "boot-ram-size": "0", "flash-system": "0", "io-memory": "0", "free-physical-memory": "2994733056", "ram-memory": "8061009920", "system-ram-memory": "8061009920", "free-application-memory": "2994733056", "image-memory": "4194304" } } ], "collection_id": "437184" }, |
You can also verify the data streamed out of the router in an external JSON Coding Viewer available on the internet. Here, we are using mdt_exec to look at a sample JSON being streamed out of the router and then verifying the data on an online JSON Coding Viewer.
| <router>#run mdt_exec -s Cisco-IOS-XR-wdsysmon-fd-oper:system-monitoring/cpu-utilization[node-name=0/RP0/CPU0]/total-cpu-five-minute -c 10000 Thu Feb 2 17:33:26.563 UTC Enter any key to exit... -------- {"node_id_str":"router","subscription_id_str":"app_TEST_200000001","encoding_path":"Cisco-IOS-XR-wdsysmon-fd-oper:system-monitoring/cpu-utilization","collection_id":"114230","collection_start_time":"1675359206702","msg_timestamp":"1675359206774","data_json":[{"timestamp":"1675359206770","keys":[{"node-name":"0/RP0/CPU0"}],"content":{"total-cpu-five-minute":7}}],"collection_end_time":"1675359206775"} -------- |
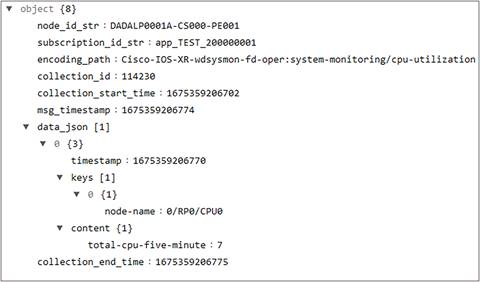
JSON streamed for your KPI
| <router>#show processes cpu thread location 0/rp0/cpu0 Thu Feb 2 17:36:36.478 UTC ---- node0_RP0_CPU0 ----
CPU utilization for one minute: 6%; five minutes: 7%; fifteen minutes: 7% |
Is that it? Is the device stream-ready already? Unfortunately, no, there is that one last step. We need to enable the gRPC port (Start the gRPC Server) on the router for it to listen to a gRPC request (gNMI Subscribe Request) and respond to that (gNMI Response).
| <router>#show running-config grpc Thu Feb 2 17:56:15.583 UTC grpc dscp cs2 port 57400 no-tls address-family ipv4 ! |
To verify your device is streaming data (and/or is responding to the gRPC request for data), run the following command:
| <router>#show grpc streams Fri Feb 3 18:39:18.106 UTC
Streaming gRPCs: 10
10.226.140.133:53820 User : svc_WDNCiscoSDNCp Request-ID : 230 Type : gNMI Created : 2023-01-23T17:15:06.771191Z Duration : 955452s
10.226.140.133:53820 User : svc_WDNCiscoSDNCp Request-ID : 231 Type : gNMI Created : 2023-01-23T17:15:06.778634Z Duration : 955452s
10.226.140.133:53820 User : svc_WDNCiscoSDNCp Request-ID : 226 Type : gNMI Created : 2023-01-23T17:15:06.77888Z Duration : 955452s
10.226.140.133:53820 User : svc_WDNCiscoSDNCp Request-ID : 269 Type : gNMI Created : 2023-01-24T16:26:13.939525Z Duration : 871985s
10.226.140.133:53820 User : svc_WDNCiscoSDNCp Request-ID : 275 Type : gNMI Created : 2023-01-24T16:26:14.159797Z Duration : 871984s
10.226.140.133:53820 User : svc_WDNCiscoSDNCp Request-ID : 276 Type : gNMI Created : 2023-01-24T16:26:18.59124Z Duration : 871980s
10.226.140.133:53820 User : svc_WDNCiscoSDNCp Request-ID : 277 Type : gNMI Created : 2023-01-24T16:26:18.594697Z Duration : 871980s
10.226.140.133:53820 User : svc_WDNCiscoSDNCp Request-ID : 278 Type : gNMI Created : 2023-01-24T16:26:18.599124Z Duration : 871980s
10.226.140.133:53820 User : svc_WDNCiscoSDNCp Request-ID : 279 Type : gNMI Created : 2023-01-24T16:26:18.602972Z Duration : 871980s
10.226.140.133:53820 User : svc_WDNCiscoSDNCp Request-ID : 280 Type : gNMI Created : 2023-01-24T16:26:18.606819Z Duration : 871980s |
3.5 Sensor Definition – Transport and Encoding
As discussed earlier, there is a transport method, protocol, encoding, and sample intervals defined for every telemetry sensor.
Let us try to understand a few subscriptions and clarify the above information:
a) Encoding for all the streams is JSON (specifically JSON_IETF)
b) Transport method is “dial in” from the Network Controller
c) TLS or Transport Layer Certificate for data encryption is “FALSE” or not enabled.
d) State is “Active,” which means the subscription is actively sending data for the specified sample interval.
e) The sample intervals (we will discuss this in detail in the next section) will vary based on the subscriptions; the example below shows 5 minutes, 60 minutes, 5 minutes, and 60 minutes for the four data streams respectively.
| <router>#show telemetry model-driven subscription Tue Apr 18 17:41:36.712 UTC Subscription: GNMI__7083707911975322971 State: ACTIVE ------------- Sensor groups: Id Interval(ms) State GNMI__7083707911975322971_0 300000 Resolved
Destination Groups: Id Encoding Transport State Port Vrf IP GNMI_1001 gnmi-json dialin Active 48828 10.226.140.133 TLS : False
Subscription: GNMI__12328441295892632155 State: ACTIVE ------------- Sensor groups: Id Interval(ms) State GNMI__12328441295892632155_0 3600000 Resolved
Destination Groups: Id Encoding Transport State Port Vrf IP GNMI_1002 gnmi-json dialin Active 48828 10.226.140.133 TLS : False
Subscription: GNMI__864269735462518853 State: ACTIVE ------------- Sensor groups: Id Interval(ms) State GNMI__864269735462518853_0 300000 Resolved
Destination Groups: Id Encoding Transport State Port Vrf IP GNMI_1003 gnmi-json dialin Active 48828 10.226.140.133 TLS : False
Subscription: GNMI__1575747990938550928 State: ACTIVE ------------- Sensor groups: Id Interval(ms) State GNMI__1575747990938550928_0 3600000 Resolved
Destination Groups: Id Encoding Transport State Port Vrf IP GNMI_1004 gnmi-json dialin Active 48828 10.226.140.133 TLS : False |
If you want to explore the properties of a specific gNMI subscription, you can run this command:
| <router>#show telemetry model-driven subscription GNMI__17743548769788099304 Tue Jun 20 16:45:18.706 UTC Subscription: GNMI__17743548769788099304 ------------- State: ACTIVE Sensor groups: Id: GNMI__17743548769788099304_0 Sample Interval: 3600000 ms Heartbeat Interval: NA Sensor Path: Cisco-IOS-XR-ip-bfd-oper:bfd/summary Sensor Path State: Resolved
Destination Groups: Group Id: GNMI_1196 Destination IP: 10.226.140.133 Destination Port: 59026 DSCP/Qos setting: CS2 Compression: gzip Encoding: gnmi-json Transport: dialin State: Active TLS : False Total bytes sent: 450 Total packets sent: 4 Last Sent time: 2023-06-20 15:45:38.2331421186 +0000
Collection Groups: ------------------ Id: 195 Sample Interval: 3600000 ms Heartbeat Interval: NA Heartbeat always: False Encoding: gnmi-json Num of collection: 3 Incremental updates: 0 Collection time: Min: 2 ms Max: 2 ms Total time: Min: 2 ms Avg: 2 ms Max: 3 ms Total Deferred: 0 Total Send Errors: 0 Total Send Drops: 0 Total Other Errors: 0 No data Instances: 0 Last Collection Start:2023-06-20 15:45:38.2331419186 +0000 Last Collection End: 2023-06-20 15:45:38.2331421186 +0000 Sensor Path: Cisco-IOS-XR-ip-bfd-oper:bfd/summary
|
3.6 Sensor Definition – Sample Intervals
We have the capability of defining different sample intervals for different telemetry sensors. A sample interval is the interval at which the device streams data responding to the gNMI requests defined in the Network Controller. The basic difference between Model-Driven (MDT) and Event-Driven Telemetry (EDT) is the definition of this sample interval. In EDT, we don’t define any sample interval; the device sends data when an event is triggered (for example, interface goes down). Contrastingly for MDT, we periodically stream data based on the defined interval. The interval definition is based on the importance and magnitude of the data. For example, for critical components like CPU or timing, we have defined stringent sample intervals like 300 seconds while for non-critical components like environment temperature we have defined the interval at 1800 seconds.
Let us try to understand a few subscriptions (as seen on the router below):
a) There are two gNMI requests below, both using JSON as the encoding for the response.
b) The subscriptions are for NPU resources and interfaces data.
c) The defined sample interval (at CNC) is 60 minutes for NPU resources and 5 minutes for interfaces data.
d) The destination of this data is 10.226.140.133 which is a Crosswork Data Gateway, and supports collection protocols including gNMI, MDT, SNMP, CLI, Syslog, and Network Configuration Protocol (NETCONF).
e) List, Datalist, and Finddata are different access methods to get statistics from internal database. You can see the method used here is “DATALIST.”
| <router>#show telemetry model-driven internal subscription
Subscription: GNMI__8703499362854295784 ------------- State: ACTIVE Sensor groups: Id: GNMI__8703499362854295784_0 Sample Interval: 3600000 ms Heartbeat Interval: NA Sensor Path: Cisco-IOS-XR-platforms-ofa-oper:ofa/stats/nodes/node/Cisco-IOS-XR-NCS-BDplatforms-npu-resources-oper:hw-resources-datas Sensor Path State: Resolved
Destination Groups: Group Id: GNMI_1232 Destination IP: 10.226.140.133 Destination Port: 58036 DSCP/Qos setting: CS2 Compression: gzip Encoding: gnmi-json Transport: dialin State: Active TLS : False Total bytes sent: 5327398 Total packets sent: 1612 Last Sent time: 2023-04-18 16:43:33.34335699 +0000
Collection Groups: ------------------ Id: 226 Sample Interval: 3600000 ms Heartbeat Interval: NA Heartbeat always: False Encoding: gnmi-json Num of collection: 179 Collection time: Min: 10 ms Max: 141 ms Total time: Min: 12 ms Avg: 14 ms Max: 143 ms Total Deferred: 0 Total Send Errors: 0 Total Send Drops: 0 Total Other Errors: 0 No data Instances: 0 Last Collection Start:2023-04-18 16:43:32.34320996 +0000 Last Collection End: 2023-04-18 16:43:33.34335738 +0000 Sensor Path: Cisco-IOS-XR-platforms-ofa-oper:ofa/stats/nodes/node/Cisco-IOS-XR-NCS-BDplatforms-npu-resources-oper:hw-resources-datas/hw-resources-data
Sysdb Path: /oper/ofa/stats/node/*/hw_resources/* Count: 179 Method: DATALIST Min: 10 ms Avg: 12 ms Max: 141 ms Item Count: 1611 Status: Active Missed Collections:0 send bytes: 5327398 packets: 1611 dropped bytes: 0 Missed Heartbeats:0 success errors deferred/drops Gets 0 0 List 179 0 Datalist 179 0 Finddata 179 0 GetBulk 0 0 Encode 0 0 Send 0 0
Subscription: GNMI__864269735462518853 ------------- State: ACTIVE Sensor groups: Id: GNMI__864269735462518853_0 Sample Interval: 300000 ms Heartbeat Interval: NA Sensor Path: Cisco-IOS-XR-ifmgr-oper:interface-properties/data-nodes/data-node/system-view/interfaces/interface Sensor Path State: Resolved
Destination Groups: Group Id: GNMI_1233 Destination IP: 10.226.140.133 Destination Port: 58036 DSCP/Qos setting: CS2 Compression: gzip Encoding: gnmi-json Transport: dialin State: Active TLS : False Total bytes sent: 126051260 Total packets sent: 220730 Last Sent time: 2023-04-18 17:13:33.1834844422 +0000
Collection Groups: ------------------ Id: 227 Sample Interval: 300000 ms Heartbeat Interval: NA Heartbeat always: False Encoding: gnmi-json Num of collection: 2143 Collection time: Min: 12 ms Max: 44 ms Total time: Min: 19 ms Avg: 21 ms Max: 51 ms Total Deferred: 0 Total Send Errors: 0 Total Send Drops: 0 Total Other Errors: 0 No data Instances: 0 Last Collection Start:2023-04-18 17:13:33.1834820318 +0000 Last Collection End: 2023-04-18 17:13:33.1834844502 +0000 Sensor Path: Cisco-IOS-XR-ifmgr-oper:interface-properties/data-nodes/data-node/system-view/interfaces/interface
Sysdb Path: /oper/im/3pg/node/*/sys/all/* Count: 2143 Method: DATALIST Min: 12 ms Avg: 14 ms Max: 44 ms Item Count: 220729 Status: Active Missed Collections:0 send bytes: 126051260 packets: 220729 dropped bytes: 0 Missed Heartbeats:0 success errors deferred/drops Gets 0 0 List 2143 0 Datalist 2143 0 Finddata 2143 0 GetBulk 0 0 Encode 0 0 Send |
3.7 Defining GNMI Collection on Crosswork Network Controller
Before defining the gNMI Subscribe Requests on Crosswork Network Controller (CNC), let us look at the expectations/format of the request and response (some of which might not be applicable as per latest protocol/controller version).
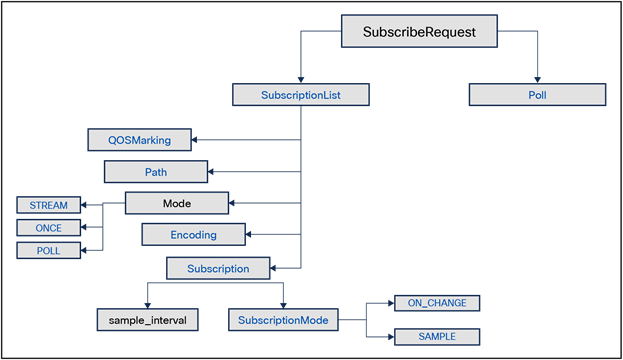
gNMI Subscribe Request Message
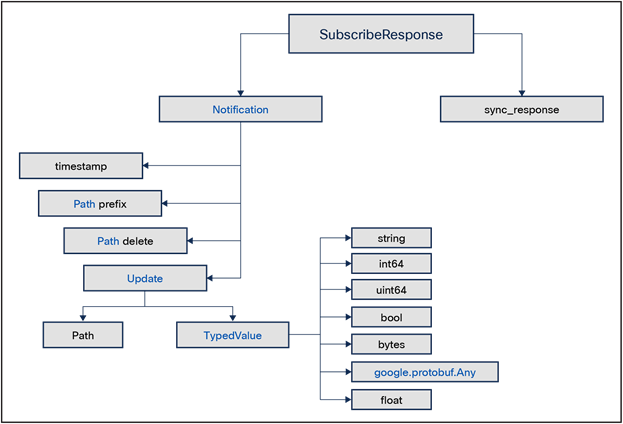
gNMI Subscribe Response Message
Once you are aware of the message format, you need to define the collection job (a collection of subscriptions) with the telemetry sensors and router name/s (that you want to respond to the gNMI request). You also need to define the cadence or time interval for each subscription. If you have defined a cadence of 300 seconds, the device will respond with the requested data every 5 minutes.
“Mode” is an important parameter of the subscribe request; the example below shows SAMPLE as the value, which means data is streamed every sample interval. Further explanation of the different modes is mentioned below:
● ONCE – The data is streamed only once and never repeated over sample intervals.
● POLL – The data is streamed only when subscribed with the current values for all specified paths.
● STREAM – As mentioned earlier, this can be “SAMPLE” where data is streamed every sample interval or “ON_CHANGE” where data is streamed if there is a change in value. The ON_CHANGE option can be explored if you don’t want to stream continuous data to the consumer without any need of action (or remediation). The downside of that is, of course, you will lose the trending and forecasting capability of a KPI if you decide to switch to ON_CHANGE.
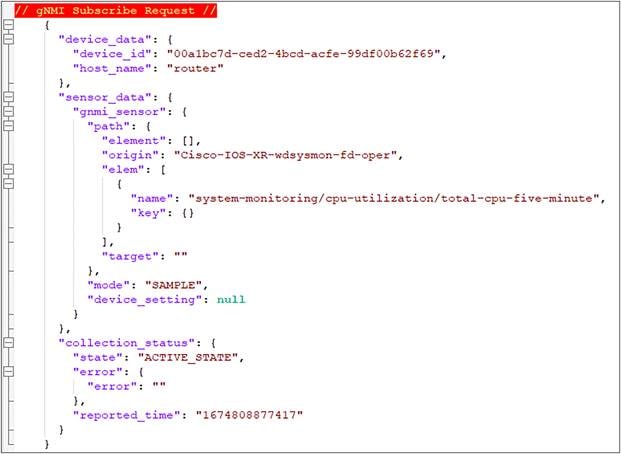
gNMI Subscribe Request for CPU KPI
If the collection is a success, you get a response in the form of “Distribution,” which is destined to the Kafka Message Bus (mentioned in Section 2.4). The response contains the data in raw format that can be read from the Message Bus.
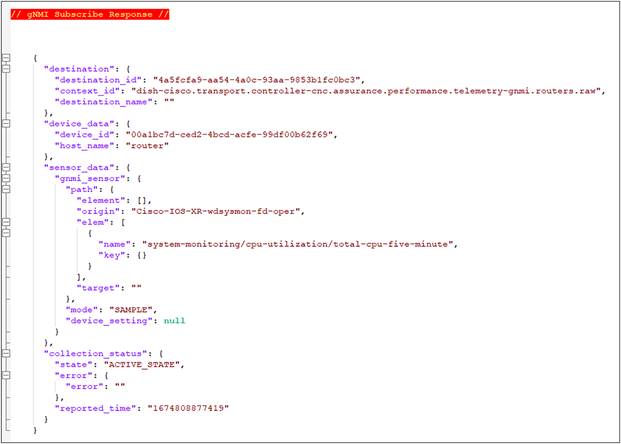
gNMI Subscribe Response for CPU KPI

Data streamed toward CDG
3.8 Reading GNMI Response on Kafka Bus
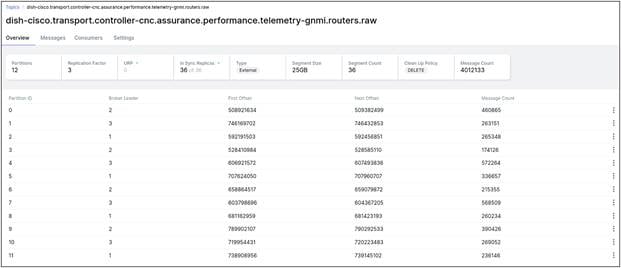
Topic on Kafka Message Bus
Now that you have plugged onto the same topic as mentioned in the gNMI Distribution in CNC, you will be able to parse the raw data from the Kafka Message Bus. Let us try to read that data in the Message Bus and then decode it.
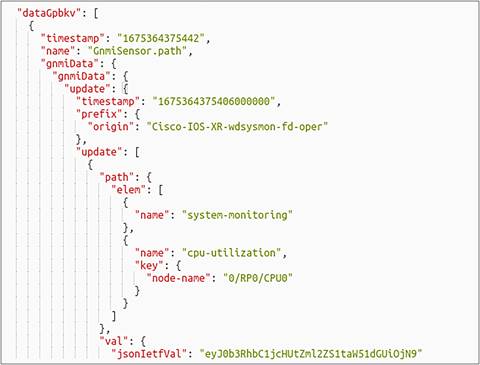
Raw Data of CPU KPI on Message Bus
Let us use a Base64 Decoder to decode this JSON_IETF value.

JSON decoded from BASE64 Value
Now that we have got our data that needs to be printed in Matrix, we can process this data and build Matrix Panels based on customized logic. As JSON data is a (key, value) pair, you can process the data based on certain keys. For example, in the case of CPU utilization of a fixed chassis physical router like ASR9902, there will be three key values in the form of “node-name”:
1) 0/RP0/CPU0
2) 0/RP1/CPU0
3) 0/0/CPU0
You can use any of these keys to fetch the data (cpu-utilization) specific to that node-name. For a cell site router, you will have just one key (node-name = 0/RP0/CPU0), and it is not mandatory for you to specify a key to fetch the value (content) of that KPI.
To verify the gNMI-based subscriptions on your router (that is defined in the collection job on CNC), you need to run the following command:
| <router>#show telemetry model-driven sensor-group Fri Feb 3 18:41:59.772 UTC Sensor Group Id:GNMI__8703499362854295784_0 Sensor Path: Cisco-IOS-XR-platforms-ofa-oper:ofa/stats/nodes/node/Cisco-IOS-XR-NCS-BDplatforms-npu-resources-oper:hw-resources-datas Sensor Path State: Resolved
Sensor Group Id:GNMI__147082646091452568_0 Sensor Path: Cisco-IOS-XR-qos-ma-oper:qos/interface-table/interface/output/service-policy-names/service-policy-instance/statistics Sensor Path State: Resolved
Sensor Group Id:GNMI__2203298433605397407_0 Sensor Path: Cisco-IOS-XR-mediasvr-linux-oper:media-svr/nodes/node/partition Sensor Path State: Resolved
Sensor Group Id:GNMI__7083707911975322971_0 Sensor Path: Cisco-IOS-XR-fib-common-oper:fib-statistics/nodes/node/drops Sensor Path State: Resolved
Sensor Group Id:GNMI__10442864159394791983_0 Sensor Path: Cisco-IOS-XR-drivers-media-eth-oper:ethernet-interface/statistics/statistic Sensor Path State: Resolved
Sensor Group Id:GNMI__864269735462518853_0 Sensor Path: Cisco-IOS-XR-ifmgr-oper:interface-properties/data-nodes/data-node/system-view/interfaces/interface Sensor Path State: Resolved
Sensor Group Id:GNMI__9422764881658769044_0 Sensor Path: Cisco-IOS-XR-infra-statsd-oper:infra-statistics/interfaces/interface/latest/data-rate Sensor Path State: Resolved
Sensor Group Id:GNMI__5396827438168630175_0 Sensor Path: Cisco-IOS-XR-nto-misc-oper:memory-summary/nodes/node/summary Sensor Path State: Resolved
Sensor Group Id:GNMI__18328265757967605119_0 Sensor Path: Cisco-IOS-XR-pfi-im-cmd-oper:interfaces/interface-xr/interface Sensor Path State: Resolved
Sensor Group Id:GNMI__12761477014645305428_0 Sensor Path: Cisco-IOS-XR-wdsysmon-fd-oper:system-monitoring/cpu-utilization/total-cpu-five-minute Sensor Path State: Resolved |
It is important to verify this output to make sure your sensor definition is correct in the collector. If the sensor doesn’t get resolved on the router, you will get an error response. There are multiple reasons for a sensor to not get resolved.
1) The sensor hasn’t been defined yet.
2) The sensor definition is incorrect.
3) The sensor is not applicable to the platform.
Here is an example of that last point (3), where the sensor was not applicable to this platform:
| Sensor Group Id:GNMI__2772047299061468887_0 Sensor Path: Cisco-IOS-XR-envmon-oper:environmental-monitoring/rack/nodes/node/sensor-types/sensor-type[type='temperature']/sensor-names/sensor-name[name='MB-Inlet Temp Sensor'] Sensor Path State: Not Resolved Status: Module 'Cisco-IOS-XR-envmon-oper' not recognized or supported for the specified operation |
Here is an example of (2), where the sensor was defined incorrectly.
| <<router>>#show telemetry model-driven sensor-group
Sensor Group Id:GNMI__5957134147446068896_0 Sensor Path: Cisco-IOS-XR-pfi-im-cmd-oper:interfaces/interface-xr/interface/ Sensor Path State: Not Resolved Status: Invalid sensor path
Sensor Group Id:GNMI__16416561783471716548_0 Sensor Path: Cisco-IOS-XR-ip-bfd-oper:bfd/summary Sensor Path State: Resolved
Sensor Group Id:GNMI__16950133171544085696_0 Sensor Path: Cisco-IOS-XR-nto-misc-oper:memory-summary/nodes/node/summary/ Sensor Path State: Not Resolved Status: Invalid sensor path |
3.9 Defining Matrix Panels Based on Query Logic (SQL)
The final piece (and the most important) of the monitoring puzzle is building the panel for the KPI defined at the beginning of this process. Let us summarize what we have done so far (Reference Section 2.1).
1) Enabled plumbing on the routers to get ready to stream data (gRPC configuration)
2) Defined the Key Performance Indicators for all routers.
3) Defined the corresponding Telemetry Sensor on CNC with proper cadence.
4) Enabled subscription toward the routers in the form of collection jobs from CNC
5) Enabled the mechanism of gNMI response to a Kafka Message Bus (Topic/Partition)
6) Read and parsed that message from the Message Bus and verified its accuracy.
Now, we need to build our query logic to showcase the KPI in the form of a Matrix Panel. You may have your customized logic to display the data. Instead of displaying it as a number, you may display it as percentage and thereby modify the KPI value as streamed from the device. Here is a sample SQL code for CPU Utilization KPI.
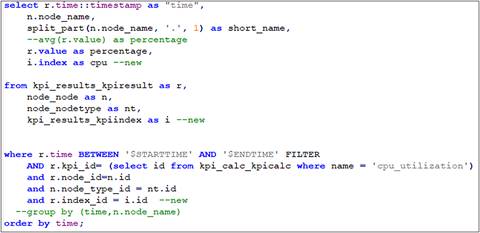
SQL for CPU Utilization
Here we are reporting CPU utilization of all cell site routers in a specific region of the network for the last 12 hours of the day.

CPU Utilization of CSRs
Here we are reporting NPU utilization of a specific NPU Bank (FEC) for all Provider Edge Data Center edge routers in a specific region of the network for the last two hours of the day.

NPU Utilization of PEDC PEs
Here we are reporting memory utilization of a specific Local Data Center Edge Router. We are looking at trends over a period of 24 hours for two KPIs: one being the memory utilization of all processes specific to 0/RP0/CPU0, the other being the Memory Utilization of all processes specific to 0/0/CPU0.

Memory Utilization of one LDC PE
Here we are looking at a non-graphical panel of the “top N” routers of a specific region in a network with the highest number of ISIS routes
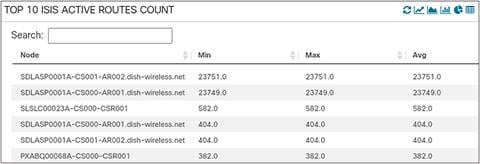
Top N ISIS Routes
Here we are looking at a non-graphical panel of the “top N” routers of a specific region in a network with the highest number of BGP routes.

Top N BGP Routes
Here we are looking at BGP Neighbors on all PEDCs over the last two hours. Different Area of Interest (AOIs) will have different scale, and that is why you are seeing different numbers in the graph below. The important takeaway is that the neighbors scale is not changing over time.

BGP neighbor Count for PEDCs
Another KPI Panel is snapped below; it is showing ISIS neighbors across all routers in the network over the last two hours.

ISIS Neighbor Count
Here we are looking at Interface Bandwidth Utilization (for both Ingress and Egress) for all XRv routers in a specific region of the network. Bandwidth Utilization trends greatly helps with capacity planning of networks once it goes live.

Interface Bandwidth Utilization for all XRv
Here we are looking at GRE Tunnel Bandwidth Utilization (for both Ingress and Egress) for all XRv routers in a specific region of the network. These are Cisco GRE tunnels running on top of a cloud underlay in the network.

Tunnel Bandwidth Utilization for all XRv
Here we are looking at Interface Throughput (Ingress/Egress) for one specific XRv in a region of the network. We are measuring it in Gbps, and it shows us a trend of the last two hours.

Interface Throughput on one XRv
This is Transport QoS Drops (and Rate of Drops) for all Provider Edge Routers (NCS55xx) in a region of the network. This is a trend for the present day. We did see a spike in QoS Interface Drops, but it went back to normalcy very soon.

Interface QoS Drops | Drop Rate
We are monitoring Interface Flaps and Interface Flap Rate by looking at the Carrier Transitions KPI for every interface. The Carrier Transition of an interface is essentially the change in Operational Status of an interface caused by flaps or micro-flaps. The following table is looking at a “suspected” cell site router over the last two hours. We can see there is a specific interface that is flapping on the router and the operations team needs to troubleshoot this.

Interface Flaps | Flap Rate
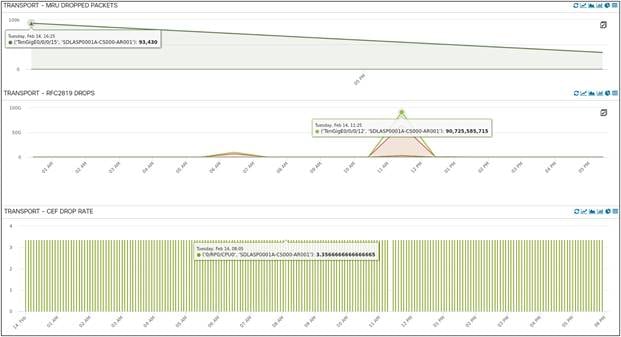
Interface | CEF Errors
Latency is another important KPI we are monitoring at Dish Networks. The three panels listed below show us the latency incurred on the odd path, even path, and between the Cell Site Router (CSR) and the BEDC XRv router (Midhaul: DU to CU). We can see an average latency of 4 milliseconds (ms) on both the odd and even paths here. The Midhaul latency has a lot of spikes, but it averages around 5 ms over time.
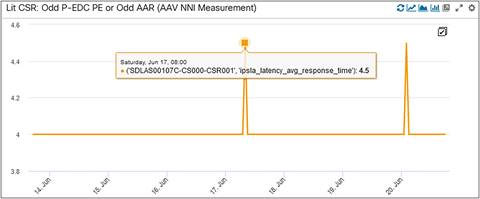
LIT CSR Odd Path Latency
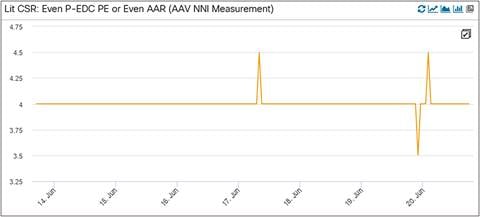
LIT CSR Even Path Latency
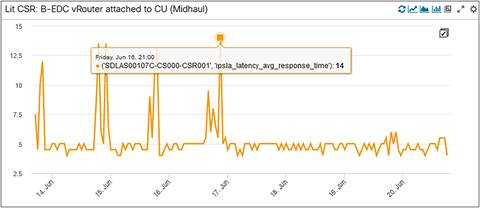
CSR to BEDC Midhaul Latency
Inlet temperature for CSRs is an important environmental KPI as these devices are deployed outdoor at a cell site (albeit inside a cabinet). Here are two CSRs with inlet temperature KPI implemented, we can see the trending values over a period of 24 hours.

Inlet Temperature of 2 CSRs
Another environmental KPI is CPU temperature, which is being monitored in this panel below. You can see the sharp spike of a CPU temperature on a CSR increasing possibly because of a power/environmental event at that cell site.
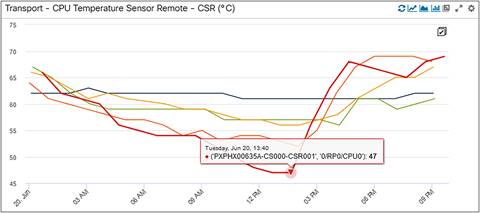
CPU Temperature of 5 CSRs
Another important hardware KPI is the Transmit (Tx) and Receive (Rx) power drawn by the optical transceiver connected to the routers. The power value shown here is in dBm (decibel-milliwatts). These indicate the “light” on the wire. If the power levels are very low, it means there is no light/traffic on the wire.

Total Rx Power

Total Tx Power
The final hardware KPI captured here is media storage utilization. There are different flavors of media types based on the device types in the network. It is important to monitor media storage, as the lack of storage space can lead to low memory which can impact certain processes running in the router.

Media Storage (Log) Utilization of LDCs

Media Storage (Hard disk) Utilization of LDCs

Media Storage (Apphost) Utilization of LDCs
Another extremely important KPI at a cell site is timing (a combination of phase, frequency, and time of day) and it helps to synchronize data between end systems. If all devices (RU, CSR, LDC PE, and DU) are synchronized (in phase/frequency/time of day) to each other with respect to a single clocking source like the GNSS (Global Navigation Satellite System), our Mobile Fronthaul timing solution is working fine. (also means there is no out-of-sync communication in the mobile fronthaul network). We need to monitor these KPIs and report an anomaly if there is any.
Below you can see PTP Port and Line State being monitored for the interfaces distributing clock from the CSR to the slave nodes (for ex: RU & DU are slave nodes while CSR is a master node with respect to distributing and receiving clock in the network). If these interface flaps or encounter errors, these KPIs might get impacted.

PTP Port State of One CSR

PTP Line State of One CSR
Similarly, we are looking at the Grandmaster State of all CSRs, this should ideally be true as all CSRs are acting as T-GMs in the network (Telecom-Grandmaster)

GNSS Grandmaster State of All CSRs
For frequency, time of day, and phase, we are monitoring these two KPIs – SyncE Frequency Status and GNSS Receiver Status. If we are synchronized to the centralized clocking source or GNSS, the KPIs will show as “locked”; if we are disconnected or drifting, we will show different states of these KPIs like “holdover,” and “free running.” Some of the state mapping is captured in the snapshots below as per definition of the corresponding YANG models (and data being streamed from the network).

SyncE Frequency Status of all CSRs

GNSS Receiver Lock Status of all CSRs
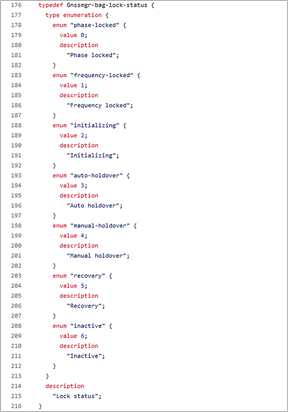
YANG Definition of GNSS Lock Status
There are Composite KPIs in the network that are either a combination of two or more KPIs or a mathematic derivative of a single KPI. Let us look at the composite KPIs deployed at Dish Network:
1) GRE Tunnel Bundle Interface Ingress Bandwidth Utilization / GRE Tunnel Bundle Interface Egress Bandwidth Utilization
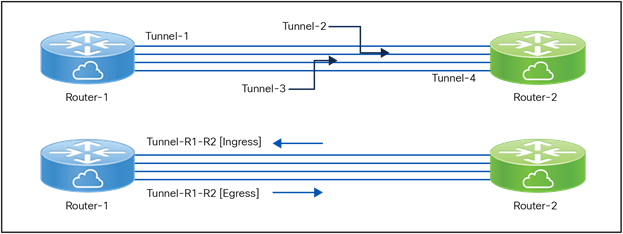
Tunnel Bundle Interface BW Utilization
As we had a tunnel bandwidth defined between a pair of XRv Cloud Routers, it made more sense to create and monitor a bundled Tunnel Bandwidth Interface Utilization. So, as you can see in the snapshot above, we are monitoring Tunnel-R1-R2 Interface Bandwidth Utilization for both ingress and egress directions instead of individual tunnels (like Tunnel-1, Tunnel-2 etc.). The Tunnel Bundle Interface Bandwidth Utilization is a logical composite KPI created as a mathematic derivative of the tunnels between two routers (which can be between two and eight in number). The below panel is GRE Tunnel Bundle Egress Utilization for all Tunnel Bundles from a cloud router.
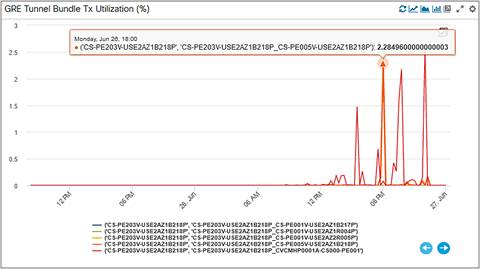
Tunnel Bundle Egress Utilization
2) Total Interface Error Count is a total of all ingress and egress interface errors and interface packet drops. There can be drops because of MTUs, CRCs, underruns, overruns etc. We are looking at the composite of all those KPIs to derive the health of the Interface Errors on the router.
3) Interface Flaps is another composite KPI defined from the carrier transition data streamed from the router. We subtract the value of the last carrier transition KPI data from the present carrier transition KPI data to arrive at the Interface Flaps Composite KPI.
Interface Flaps = Present Carrier Transition Data Value (streamed at time T) – Previous Carrier Transition Data Value (streamed at time [T – 5] mins).
5 Anomaly Detection – Closed Loop Automation
The detection of an anomaly in the network and taking a suitable action is the most critical piece of the entire monitoring puzzle. To be able to detect an anomaly in the network, we need to define thresholds for all the Key Performance Indicators. We can either reuse the thresholds defined in IOS XR code for every KPI, or manually define thresholds based on network objective (role of that KPI in the network) and experience (based on similar KPIs deployed at other service provider networks), or machine learn the thresholds and implement it in our anomaly detection process.
5.1 Threshold Defined in IOS XR Code
This snippet is from a cell site router where we look at thresholds of environmental temperature KPIs defined in IOS XR code. For example, we are using MB-Inlet Temp Sensor as one of our KPIs at Dish Network. We can define (in Matrix) four values of threshold for Major Low, Critical Low, Major High, and Critical High. If the data streamed from the router cross this threshold defined in Matrix, we generate alerts (Warning, Critical). An alert is cleared when the KPI values drop down/move up from these thresholds.
| <router>#show environment temperature Tue Jun 20 22:51:06.338 UTC |
|||||||||
| Location |
TEMPERATURE |
Value |
Crit |
Major |
Minor |
Major |
Crit |
||
|
|
Sensor |
(deg C) |
(Lo) |
(Lo) |
(Lo) |
(Lo) |
(Hi) |
(Hi) |
|
| 0/RP0/CPU0 |
|
||||||||
|
|
X86_PACKAGE_TEMP_SENSOR |
33 |
-40 |
-25 |
-10 |
85 |
89 |
91 |
|
| X86_CORE_0_TEMP_SENSOR |
31 |
-40 |
-25 |
-10 |
85 |
89 |
91 |
||
| X86_CORE_1_TEMP_SENSOR |
33 |
-40 |
-25 |
-10 |
85 |
89 |
91 |
||
| X86_CORE_2_TEMP_SENSOR |
31 |
-40 |
-25 |
-10 |
85 |
89 |
91 |
||
| X86_CORE_3_TEMP_SENSOR |
30 |
-40 |
-25 |
-10 |
85 |
89 |
91 |
||
| X86_CORE_4_TEMP_SENSOR |
29 |
-40 |
-25 |
-10 |
85 |
89 |
91 |
||
| X86_CORE_5_TEMP_SENSOR |
29 |
-40 |
-25 |
-10 |
85 |
89 |
91 |
||
| X86_CORE_6_TEMP_SENSOR |
31 |
-40 |
-25 |
-10 |
85 |
89 |
91 |
||
| X86_CORE_7_TEMP_SENSOR |
31 |
-40 |
-25 |
-10 |
85 |
89 |
91 |
||
| MB-Inlet Temp Sensor |
26 |
-40 |
-25 |
-10 |
65 |
70 |
75 |
||
| P1V15_CPU_CORE_TEMP1 |
29 |
-40 |
-25 |
-10 |
85 |
89 |
91 |
||
| P1V0_CPU_UNCORE_TEMP1 |
32 |
-40 |
-25 |
-10 |
85 |
89 |
91 |
||
| P1V15_CPU_VCCRAM_TEMP1 |
31 |
-40 |
-25 |
-10 |
85 |
89 |
91 |
||
| P1V2A_CPUDDR_TEMP1 |
30 |
-40 |
-25 |
-10 |
85 |
89 |
91 |
||
| VP1P0_TEMP1 |
33 |
-40 |
-25 |
-10 |
85 |
89 |
91 |
||
| P1V05_CPU_SRDS_TEMP1 |
34 |
-40 |
-25 |
-10 |
85 |
89 |
91 |
||
| P3_3V_TEMP1 |
39 |
-40 |
-25 |
-10 |
85 |
89 |
91 |
||
| P1V0B_QAX_TEMP1 |
41 |
-40 |
-25 |
-10 |
97 |
103 |
108 |
||
| P1V0_QAX_CORE_TEMP1 |
38 |
-40 |
-25 |
-10 |
97 |
103 |
108 |
||
| P1V2B_QAX_TEMP1 |
34 |
-40 |
-25 |
-10 |
97 |
103 |
108 |
||
| MB-Outlet Temp Sensor |
28 |
-40 |
-25 |
-10 |
68 |
73 |
78 |
||
| MB-CPU Temp Sensor Local |
34 |
-40 |
-25 |
-10 |
85 |
89 |
91 |
||
| MB-CPU Temp Sensor Remote |
33 |
-40 |
-25 |
-10 |
85 |
89 |
91 |
||
| MB-QAX Temp Sensor Local |
37 |
-40 |
-25 |
-10 |
97 |
103 |
108 |
||
| MB-QAX Temp Sensor Remote |
44 |
-40 |
-25 |
-10 |
97 |
103 |
108 |
||
| MB-QAX In-Die Temp Sensor |
41 |
-40 |
-25 |
-10 |
97 |
103 |
108 |
||
Another example of a KPI threshold defined in IOS XR code is NPU resources. This snapshot is from a cell site router for the NPU Resource FEC (Forwarding Equivalence Class) KPI. The “warning” (80%) and “critical” (95%) thresholds are defined in code. The “OOR” (Out of Resource) flag turns YELLOW or RED based on the type of threshold alert. It is GREEN in this snapshot. We re-use the same thresholds and define our anomalies in Matrix. If our NPU Resource Utilization cross these thresholds, we trigger an alert.
| RP/0/RP0/CPU0:DADAL00241A-CS000-CSR001#show controllers npu resources fec location 0/RP0/CPU0 Wed Jun 21 16:34:32.478 UTC HW Resource Information Name : fec Asic Type : QAX
NPU-0 OOR Summary Estimated Max Entries : 61440 Red Threshold : 95 % Yellow Threshold : 80 % OOR State : Green Bank Info : FEC
OFA Table Information (May not match HW usage) ipnhgroup : 1414 ip6nhgroup : 50 edpl : 0 limd : 0 punt : 19 iptunneldecap : 0 ipmcroute : 1 ip6mcroute : 0 ipnh : 0 ip6nh : 0 mplsmdtbud : 0 ipvrf : 6 ippbr : 0 redirectvrf : 0 l2protect : 0 l2bridgeport : 25
Current Hardware Usage Name: fec Estimated Max Entries : 61440 Total In-Use : 1515 (2 %) OOR State : Green Bank Info : FEC
Name: hier_0 Estimated Max Entries : 61440 Total In-Use : 1515 (2 %) OOR State : Green Bank Info : FEC |
5.2 Manual Threshold Definition
We have manually defined thresholds for several KPIs based on the overall impact of the KPI on the network (when the values hit threshold). These are defined in Matrix – Our Network Performance Management System. Some examples are mentioned below:
1) CPU Utilization (Critical: 90%, Warning: 75%)
2) Memory Utilization (Critical: 90%, Warning: 75%)
3) Interface Operational Status (NOT Up)
4) Interface Admin Status (NOT Up)
5) Interface Transmit Link Utilization (Critical: 90%, Warning: 75%)
6) Interface Receive Link Utilization (Critical: 90%, Warning: 75%)
7) PTP Interface Line State (NOT Up)
8) PTP Interface Port State (NOT Master)
5.3 AI/ML‒Based Threshold Definition
Inbuilt Machine Learning (ML) framework of Matrix with integrated ML algorithms enables you to build Machine Learning capabilities for anomaly detection, predictive analytics, forecasting, and pattern mining. Now why do we need machine learning when we can manually define thresholds? Unfortunately, there are certain KPIs for which we can’t define manual thresholds. The thresholds differ between devices and services within the network.
For example, the ISIS routes count is a KPI for all routers in the network. We can’t define manual thresholds as the count differ per ISIS process and per router type (CSR/PEs). The only way around this problem is to machine learn the routes over a period for a process for a router type and machine define the thresholds or outliers using the most suitable algorithm.
Another example is average latency. We are using the Internet Protocol Service Level Agreement User Datagram Protocol IP SLA UDP Jitter application to measure average latency from source to destination and vice-versa. We can only define the end-to-end midhaul latency based on the oRAN latency budget and/or latency budget agreed upon with the RAN vendor. What about the latency between the CSR and the PEDC Provider Edge router? For such scenarios, we need to rely on machine learning algorithms to give us the following information:
1) Mean of average latency incurred between CSR and PEDC PE over a period.
2) Outlier or threshold (critical and warning) values for average latency over the same period
5.3.1 ML-Based Use Cases: IP SLA
We have implemented the second use case in Matrix. The algorithms available to us to implement this KPI were:
1) K-Means,
2) K-Means 24
3) DBScan
4) OneClass
5) Percentage Change
6) Standard Deviation
We initially started with K-Means, which is an unsupervised clustering algorithm that would divide the data values into clusters of similar values and arrive at a centroid from all clusters (in a simplistic world, it is an educated “mean”). The algorithm also sets thresholds (warning, critical) based on intelligent learning of spikes and troughs on the entire data set used for training.
But, upon days of training our data, we realized there aren’t enough clusters to create effective centroids/means for IP SLA average latency. We eventually switched our algorithm to standard deviation, which seemed like a more realistic match based on the data that was being streamed.
Here is a snapshot of the IPSLA maximum latency detailed KPI alerts (we haven’t hit any alerts for average latency). The threshold for the alert’s detection were set by the K-Means algorithm. For different elements (10, 20, 30 – which are essentially different links in the network between the CSR and PEs, captured in figs. 47, 48, and 49) you can see alerts getting triggered (critical, warning) and cleared when values go below the machine-defined thresholds.

Detailed IPSLA KPI Alerts
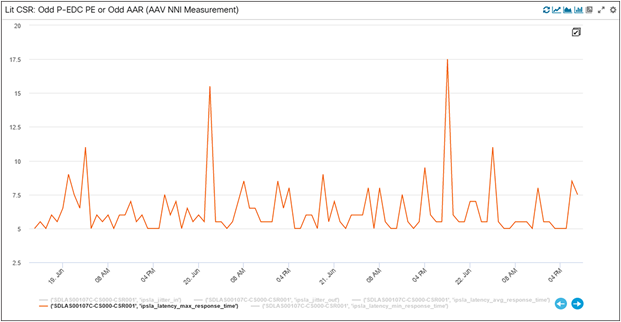
Element 10 Max Latency
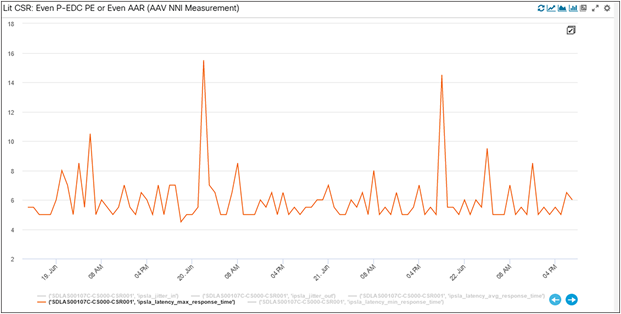
Element 20 Max Latency
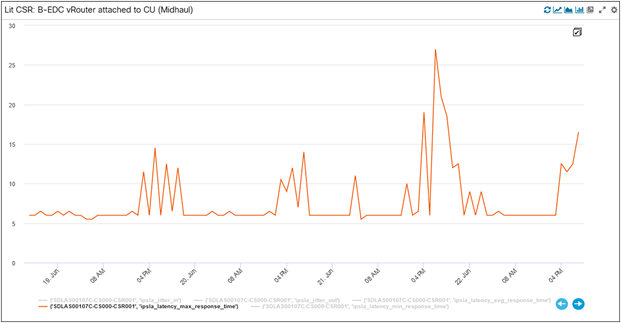
Element 30 Max Latency
We have a KPI Alert Workbench in Matrix where you can track alerts and data over time. Here is a snapshot with the KPI trending along with machine learned warning, critical, and “good” values using the K-Means clustering algorithm.
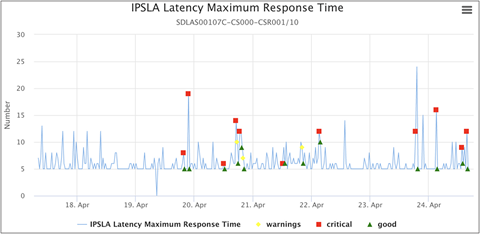
KPI Alert Workbench for IP SLA
5.4 Exporting Anomaly Detection to Fault Management Application
We have incorporated fault management with the VIA-AIOPS platform. Detecting faults or anomalies is not the end of the monitoring solution; we need to alert stakeholders who will act on such faults in the network.
These alerts or anomaly detection is published back to the Kafka Message Bus for VIA to ingest them. The below shows the alerts in the Message Bus for consumers to ingest.
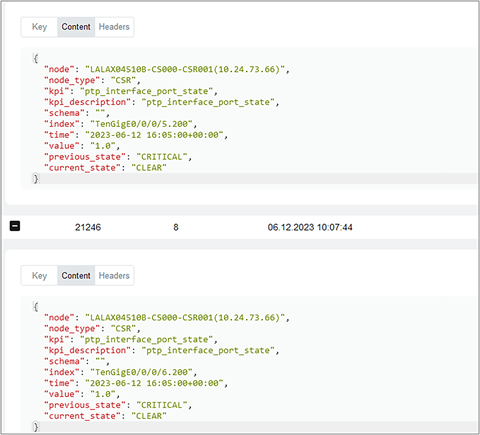
PTP Alerts in Kafka Message Bus
Once the alerts are processed and correlated in VIA (with other similar alerts from the same router), incidents can be created and assigned to a Network Operations Engineer for the purpose of remediation. Figure 54 shows the above PTP Alerts ingested by VIA from the Message Bus.

KPI Alerts Events in VIA
5.5 Remediation Using Closed Loop Automation
Finally, here we are, at the last stop, the final piece of the monitoring puzzle. We are creating alerts for any critical deviation from the expected values for a KPI, but we are not (yet) remediating the problem through automation. We are publishing that information to network operations and waiting for them to take manual action. Now, to close the loop through automation, we need to take this solution a step further, and take automated remediation actions.
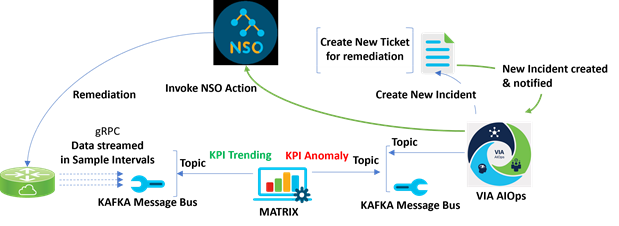
Closed Loop Automation Life Cycle
Let us consider an example to understand the closed loop automaton life cycle demonstrated above:
1) The router is streaming data for Timing KPI to the Message Bus (via CDG).
2) Matrix is pulling that data from the concerned topic and observing/trending it.
3) Matrix has also defined alerts for this KPI (Warning/Critical) based on manually defined thresholds.
4) Once the KPI value crosses a threshold (for example: GNSS KPI Alert is triggered because of an anomaly), it creates an alert in Matrix.
5) The alert is published into a Kafka Topic, which gets pulled by VIA to create an incident.
6) The incident results in a ticket for the purpose of remediation.
7) It also triggers a Closed Loop Automation workflow wherein it invokes an NSO action to remediate the problem on the router.
8) NSO (for this example) restarts the GNSS Survey on the cell site router (or reboots the router) by running specific commands on the router.
9) Once the problem is remediated, the new data (at the defined sample interval) streamed towards Matrix shows that the KPI Value has come back to the “expected” one.
10) The associated applications now close the alert and the corresponding incident.
6 Conclusion – What is the future of observability on a Hybrid Cloud?
The goal of every network operator is to build a utopic network which is low touch, seamlessly running, self-detecting (problems), and self-healing. Have we arrived there yet? I don’t think so, we have a mountain to climb but we have embarked on that journey already.
If we can build the intelligence to run a closed loop automated network that can self-detect and self-remediate for at least half the problems, we have done a fairly good job. But is that the end goal? Which KPIs do we need to define for our network? What data do we need to stream for specific device types? Do we stream data all the time or only when there is a significant change? Who defines that change (thresholds)?
Maybe we don’t have the answers to every question there, but AI-Driven Telemetry being deployed on Cisco routers is a great starting point. ADT (as it is called) leverages Machine Learning and Artificial Intelligence to detect and describe important state changes on the router, and export only the relevant data using telemetry. You can find more information in this article.
Your AI journey starts today.
KPI – Key Performance Indicator
CSR – Cell Site Router
LIT CSR – LIT CSRs use fiber optics that are already in use by other fiber vendors.
Dark CSR – Dark CSRs use fiber optics that were currently not in use.
LDC – Local Data Center
BEDC – Breakout Edge Data Center
PEDC – Provider Edge Data Center
AI - Artificial Intelligence
NPU – Network Processing Unit
CPU – Central Processing Unit
BGP – Border Gateway Protocol
AWS - Amazon Web Services
IEFT - Internet Engineering Task Force
MDT - Model-Driven Telemetry
RPC - Remote Procedure Call
RAN - Radio Access Network
oRAN - Open RAN
CLI – Command-Line Interface
SDN – Software-Defined Networking
SNMP - Simple Network Management Protocol
ISIS - Intermediate System to Intermediate System
GRE - Generic Routing Encapsulation
QoS - Quality of Service
PTP - Precision Timing Protocol
SyncE - Synchronous Ethernet
GM / T-GM - Telecom Grand Master
GNSS - Global Navigation Satellite System
BFD - Bidirectional Forwarding Detection
RU - gNB Radio Unit
CU - gNB Control Unit
DU - gNB Distributed Unit
IP SLA - Internet Protocol Service Level Agreement
UDP - User Datagram Protocol
● gNMI Specification defined in OpenConfig Forum
● ADT, as implemented on ASR9K
● VIA Platform for Cisco Network Automation
● DISH Networks Deployment Architecture on AWS Cloud
Sounak Mukherjee
Customer Delivery Architect
Thank you for the contribution:
Asifiqbal Pathan – Principal Architect
Vipul Aggarwal – Customer Delivery Architect
Ariel Maceo – Customer Delivery Software Architect