Monitor Network Health and KPIs

This section contains the following topics:

Health Insights Overview

Health Insights is a network health application that performs real-time key performance indicator (KPI) monitoring, analytics, alerting, and troubleshooting.

It builds dynamic detection and analytics modules that allow operators to monitor and alert network events with user-defined logic.

It also provides prebuilt KPIs that are based on model-driven and SNMP-based telemetry. The Health Insights Recommendation Engine uses data mining to analyze your network and then recommends which telemetry paths you should enable and monitor.


Important

There must be an extended Cisco Crosswork Data Gateway that is configured if you plan to gather telemetry using KPIs and Health Insights.


Note

For the recommendation engine to work in Health Insights, you must ensure that connectivity is established between Cisco Crosswork Health Insights and the device. Enable the NETCONF protocol on the device itself, in the device configuration in Crosswork and in the credential profile for the device in Crosswork.


Health Insights is configured to gather the link bandwidth usage data for device links. After a time period, it establishes a performance baseline for each link. If a link deviates from its baseline causing an alert to be generated, Health Insights detects it and you can then go and run the Playbook to reconfigure the network to resolve the issue.

The following high-level example gives a basic view of how Health Insights interacts with the other Cisco Crosswork Network Controller components:

  1. Health Insights detects an anomaly: The optical bit error rate that you are monitoring on each of the links in your network suddenly increases.

  2. Change Automation Playbooks automate remediation: Switch to the backup link immediately. Restore service. Open a ticket (manually initiated by the user). Alert the network engineer.

The complexity of the interaction will depend on the type of anomaly, how it is detected, and the Playbooks you choose to use to remediate it. You can orchestrate any form of network remediation using Change Automation Playbooks, helping you to close the loop on problem resolution and minimize network downtime.

Health Insights Alert Dashboard

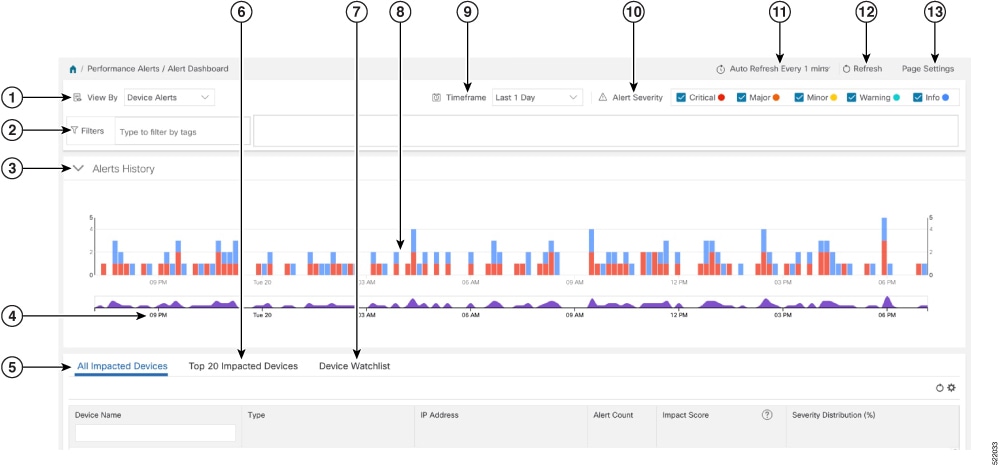
The Health Insights alert dashboard provides device health summary information that is based on real-time network state events. The dashboard displays a network view of KPI sensors that are paired to specific device groups. Health Insights raises customizable events and alerts that are based on user-defined logic.


Note

Alert dashboard displays individual KPI alerts, although the mechanism of enabling KPI on a device is done through a KPI profile.

To display the Health Insights dashboard, choose Performance Alerts > Alert Dashboard from the main menu.

Health Insights Alert Dashboard
Item Description

1

Device/KPI Alert Selector: Click here to toggle between device alert and KPI alert information.

2

Filters: This field lets you filter the alert dashboard information by associated tag names. To select a tag, do one of the following:

  • If you know the tag that you want to use, enter it in the Type to filter by Tags field and then check its check box. Repeat this step to select more tags.

  • If you want to select a tag from the tags that are currently available:

    1. In the Type to filter by Tags field, type any character to open the results list.

    2. Click the View All Tags link at the bottom of the list.

    3. Check the check box for each tag that you want to use and then click Apply Filters.

    4. Delete the character that you typed in Step 1 to clear the results list.

Tag filters you create are not saved. If you open another window and then return to the alert dashboard, you need to re-create tag filters.

3

Alerts History: This dashlet shows the total number of device alerts or KPI alerts that have been raised during the chosen time period, with detailed time lines showing both individual sets of alerts and the overall alert trend.

4

Alerts Trend Line: This line shows the overall trend in alerts for the chosen time period. You can use the Alerts Trend Line to select and zoom in on a specific time period within the Alerts History Line, as follows:

  1. Click the time-period starting point in the Alerts Trend Line and hold down the mouse.

  2. Drag the cursor to the endpoint and then release the mouse.

To restore the full view of the Alerts History Line, click on any point outside of the light gray shading on the Alerts Trend Line.

5

All Impacted Devices/All Impacted KPIs: When selected, this dashlet provides a complete list of all devices or KPIs affected by alerts. The information for each affected device or KPI includes:

  • Device Name or KPI Name

  • Device or KPI Type

  • IP address: The IP address of the impacted device. This column is only displayed for devices.

  • Alert count: The total number of alerts for that device or KPI during the selected period.

  • Impact score—This value is determined using the following formula: (5 x number of critical alerts) + (4 x number of major alerts) + (3 x number of minor alerts) + (2 x number of warning alerts) + (1 x number of info). These are the default values. You can change the weightage in the Page Settings option. When monitoring the health of your network, focus on devices or KPIs with a higher impact score.

  • Severity distribution—Provides a visual breakdown of the severity that is associated with a device or KPI's alerts. To view a tooltip that indicates the number of raised alarms (by severity and in total), place your cursor over the appropriate bar segment.

6

Top 20 Impacted Devices/ Top 20 Impacted KPIs: When selected, this dashlet displays a map of tiles, each tile representing one of the 20 devices or KPIs with the most alerts during the selected time period. The amount of space that each tile occupies in the map corresponds to the number of alerts raised: the more alerts, the bigger the tile. Also, the tiles are color coded. The colors correspond to the Alert Severity.

To view more detailed information for a particular device or KPI, click the device or KPI name link in the center of the tile.

7

Device/KPI Watchlist: When selected, this dashlet provides a list of all devices or KPIs, that you had selected from + Manage Deveice/KPI Watchlist, which are affected by alerts. The information for each affected device or KPI includes:

  • Device Name or KPI Name

  • Device or KPI Type

  • IP address: The IP address of the impacted device. This column is only displayed for devices.

  • Alert count: The total number of alerts for that device or KPI during the selected period.

  • Impact score—This value is determined using the following formula: (4 x number of critical alerts) + (3 x number of major alerts) + (2 x number of minor alerts) + number of warning alerts. When monitoring the health of your network, focus on devices or KPIs with a higher impact score.

  • Severity distribution—Provides a visual breakdown of the severity that is associated with a device or KPI's alerts. To view a tooltip that indicates the number of raised alarms (by severity and in total), place your cursor over the appropriate bar segment.

8

Alerts History: The Alerts History line shows alerts as discrete bar indicators whose height represents the total number of alerts gathered at each point in time. To see the total for each type of alert, hover your mouse cursor over the bar indicator. You can also use the Alerts Trend line to zoom in on particular portions of the alert history.

9

Timeframe: Specifies the time period for which the dashboard provides alert information: The past one hour, past day, past week, and so on. Please note that the dashboard provides alert information only, not telemetry information.

10

Alert Severity: Maps the bar indicator colors that are used in the Alert History dashlet to the corresponding alert severity. To display or hide the alerts for a particular severity, click the check box for that severity. An enabled check box indicates that alerts of that severity have been raised and are being displayed. A clear check box indicates that the alerts of that severity are either not being displayed or have not been raised during the displayed time period.

11

Auto Refresh: Specifies how often the dashboard is automatically refreshed.

12

Refresh Icon: Refreshes the dashboard.

13

Page Settings: Provides the default page settings for that particular session. You can customize the page display based on Alert Type, Timeframe, Auto Refresh, Detail Display, and Alert Severity. You can also change the weightage here for the impact score calculation.


Note

The individual alerts for any specific KPI are shown in the dashboard. Alerts resulting from the alert group logic are not shown in the dashboard. Only the API shows the impacted results.

View Alerts for Network Devices

After enabling KPIs on a device, you can view alerts for that device and get data for each performance indicator being monitored.


Note

The KPIs shown in the following steps are examples. There are many more KPIs available in Health Insights. For the complete list, see List of Health Insights KPIs.

Procedure


Step 1

From the main menu, choose Performance Alerts > Alert Dashboard. The Health Insights Alert dashboard is displayed.

Step 2

Make sure that the Device Alerts view is displayed (select the Device Alerts toggle, if needed). Then scroll down below the Alert History panel and click the All Impacted Devices tab. The dashboard displays a list of devices with alerts.

Step 3

Click the Device Name for the device whose details that you want to view. Health Insights displays the device's basic Overview information, Alert History, a Topology map, and the list of the device's currently Enabled KPIs.

The Topology map is a version of the map that you see when you select Topology from the main menu.

Step 4

Under Enabled KPIs, click View Telemetry Data on the desired KPI to view the detailed KPI information. A graphical representation of that KPIs data, along with a list of alert messages and other information, is displayed on the right.

A graphical time-series representation of the selected KPI is displayed for a 72-hour window with hourly slots.

Step 5

Click and move the brush on the timeline to select the desired time slot (selects up to 6 hours) to view the corresponding Raw or Summary graphical data. Move the mouse cursor over any data point in the graph to view additional pop-up information for that data point.

A red line or tag represents a point at which the KPI was triggered. This can occur on any subscribed statistic the KPI is monitoring. Health Insights collects and identifies the time points and frequency, which help determine when these events become an operational concern.

Note 
Graphical data is only visible for time slots that have alerts that are triggered. To view the alerts for the last 72 hours, go to the grafana dashboard (https://<IPaddress:port>/robot-grafana/), and select the desired KPI from the dashboard or from the drop-down list. By default, the KPI display is set for last 1 hour. You can change the duration (maximum up to last 72 hours) by selecting the desired option from the drop-down.

Telemetry Data Retention

Telemetry data is collected from devices and stored in the time-series database. This data is retained for the last 72 hours, and is used in the Health Insights Alert dashboard to identify alerts using a process that is known as stream based alerting. The resulting 'alerts'; if any, are stored in the same time-series database. The alerts are retained for 30 days, and the messages showing the duration of alerts are displayed in the top-right corner of the Device/KPI view in the Alert dashboard. For more information, see View Alerts for Network Devices. The alerts can also be queried using REST APIs.

Manage KPIs

The Health Insights Key Performance Indicators (KPI) window gives you complete access to Cisco-supplied and user-created KPIs. You can add, edit, delete, import, and export your KPIs. You can also link your KPIs to the Change Automation application's Playbooks.

To display the Health Insights Manage KPIs window, choose Performance Alerts > Key Performance Indicators (KPI) from the main menu.

Item Description

1

Add KPIs: Click Add icon to add a new, user-created KPI. For help with this task, see Create a New KPI.

2

Delete KPIs: Select one or more existing user-created KPIs in the list and then click Delete icon. You will be prompted to confirm that you want to delete the KPIs. Click Delete to confirm.

Note 

You can delete user-created KPIs only. You cannot delete Cisco-supplied KPIs.

3

Import KPIs: Click Import icon to import new user-written or Cisco-supplied KPIs.

You will be prompted to browse to the gzipped tar archive containing the KPIs to be imported. When you have selected the archive, click OK to begin importing it. Once imported, the new KPIs appear in the list of KPIs, with each KPI name and category assigned based on the definition in the KPI itself.

In order for Cisco Crosswork Health Insights to import them, KPI files must:

  • Be packaged as a gzip tar archive. You can include more than one KPI in a single archive; each will be imported as a separate KPI.

  • Have unique names and descriptions. These must not match the name or description of any Cisco-supplied KPI. If the name or description of the KPI matches an existing user-created KPI, the import will overwrite the existing KPI.

  • Meet other minimum requirements for Health Insights KPIs, as explained in the Cisco Crosswork Network Automation Custom KPI Tutorial Documentation on Cisco DevNet.

4

Export KPIs: Select one or more existing KPIs in the list and then click Export icon to export them. Health Insights will package the exported KPIs as a single TGZ archive with a unique name. Your browser will then prompt you to save the archive to a name and location in your local file system that you select.

5

Link Playbooks: Select a KPI and then click Link Playbook icon to link it to a Playbook. Linking a Playbook streamlines the remediation process by importing data from the alert and using it to pre-populate the parameters the Playbooks needs (such as device, interface names, and so on) to run in order when you attempt to remediate the issue. For help with this task, see Link KPIs to Playbooks.

6

Unlink Playbooks: Select a KPI with a linked Playbook and then click Unlink Playbook icon to unlink the Playbook. You will be prompted to confirm that you want to unlink the Playbook. Click Unlink to confirm.

7

Clear Filters: Click Clear All Filters to clear any filters you have set.

8

Filter KPI Categories: To find a KPI category, enter all or part of the KPI Category name in this field. Then click Set Filter icon to filter the list below.

9

Filter KPIs: To find a KPI, enter all or part of the KPI Name, Category, Description, or Linked Playbook in the fields provided. The list below is automatically filtered to match your typed entry.

Create a New KPI

You can create a custom KPI and enable it on the desired devices. The workflow is as follows:

  1. Supply basic information, such as the KPI name and a summary description.

  2. Set the KPI cadence.

  3. Select a YANG module and choose sensor paths.

  4. Select an alert template and set its parameters.

  5. Enable the KPI on the devices.


Note

Health Insights supports creating and using KPIs that use GNMI as the transport and use sensors that are based on Open Config (OC) YANG modules for collecting telemetry data (with GNMI transport). The requirements for this feature are:

  • GRPC must be configured in your device.

  • The device properties, while onboarding, must mention GNMI under the Capability field, and the GNMI protocol details must be provided under the Connectivity Details field.

  • While creating a KPI, choosing an OC YANG module supports the KPI affinity for GNMI transport, while choosing Cisco-provided YANG models provides the KPI affinity for both MDT and GNMI transports.

The GNMI transport capability is determined at runtime which is based on the following factors such as GNMI capability of the device, GNMI affinity of the KPI, and the combined capability as a set of devices in a KPI Profile.


The following steps explain how to create a KPI:

Before you begin

Make sure that the device packages for the devices are available in Crosswork. If they are not available, perform Add a Custom Software Package procedure from Cisco Crosswork Infrastructure 4.3 and Applications Administration Guide and then continue with the steps in this procedure.

Procedure


Step 1

From the main menu, choose Performance Alerts > Key Performance Indicators (KPI). The Key Performance Indicators (KPI) window is displayed.

Step 2

Click the Add icon. The Create KPI window opens.

Step 3

In the text fields provided, enter a unique KPI Name, a short KPI Summary description, and KPI details. The KPI Group is preset to User Created.

Step 4

The Cadence field sets the number of seconds between data collections . Leave it at the default or use the numerical selector to choose a different value.

Step 5

In the YANG Modules area, choose one module and one or more sensor paths from which to stream data:

  1. Use the Module field to filter and choose the desired Cisco IOS XR YANG module.

  2. Use the table fields to filter and choose the desired sensor path. When you choose a path, the leaf node gets resolved to the base encoding path. If the YANG module is hierarchical, the field names are concatenated down from the base path. Only one gather path is supported for user-created KPIs.

    Note 
    If the devices are not listed in the default YANG modules, you can expand the device coverage. For more information, see the section Manage Custom Software Packages and Add a Custom Software Package in the Cisco Crosswork Infrastructure 4.3 and Applications Administration Guide and then continue with the subsequent steps in this procedure.

Click Next to display the Select Alert Templates window.

Note 
To build a KPI that uses data from more than one module, you can do this with KPI profiles and alert groups. For more information, see Create a New KPI Profile.
Step 6

Choose the alert template that you want to use with your new KPI: No Alert, Standard Deviation, Two-Level Threshold or Rate Change. Then click Next to display the Alert Parameters window appropriate for the type of alert template you chose.

Step 7

Edit the alert template parameter values as appropriate for the template and the purpose of your KPI, as follows:

  • Use the Basic and Advanced Parameters dropdowns to view and edit the parameter sets you need.
  • Change alert parameter numerical values using the selectors or by editing the field contents
  • Change alert parameters with discrete choices using parameter field dropdowns and select each choice as needed.
  • Learn more about an alert parameter: Hover your mouse cursor over the Reachability Unknown icon shown next to the parameter name.
  • Click the View Tick Script link to view the tick script code you are generating with your changes. The tick script code updates as you make your edits. At any time, click the Hide Tick Script to close the tick script code window.
Step 8

When you are finished making changes, click Finish to save the new KPI and display the Key Performance Indicators (KPI) window.


Link KPIs to Playbooks

You can link any Health Insights KPI to one Change Automation Playbook of your choice. You can run the linked Playbook whenever the linked KPI raises an alert in response to the event associated with the performance indicator the KPI is monitoring. The KPI alert can be raised in response to a threshold crossing, topology changes, flapping conditions, and other parameters. These parameters vary, as appropriate, for each KPI.


Note

This procedure is not applicable if the Change Automation application is not installed in your device. In this case, the UI features that link Health Insights and Change Automation (For example, Link Playbook) are not displayed in the UI.


You can specify the Source of the parameter values the linked Playbook uses when you run it. You can select these sources:

  • Playbook: Use default values coded into the Playbook itself

  • KPI Alert: Use values that are taken from the alert that is raised by the linked KPI.

  • Run-time Input: Use values that you enter only at the moment you run the Playbook.

The ability to set the source of these Playbook parameter values gives you flexibility in how you use the linked Playbook. For example: Link the KPI Interface flap detection, which detects interface flapping, to the Playbook Interface state change on XR, which can be used to set the interface up or down. Depending on circumstances, you can want to set the Playbook parameters as follows:

  • Playbook: You want to run the Playbook as it normally does, so you would set the Source as Playbook for the provider, collection_type and mop_timeout parameters. In the case of the collection_type, you can still choose between telemetry and snmp, depending on whether you want to use MDT or SNMP to gather device data.

  • KPI Alert: You want the Playbook to run only on the host device and interface affected by the flapping, which are identified in the flap-detection Alert. So set the Source of the Playbook's hosts and if_names parameters to KPI Alert. You can then use the alert's data about the Producer device and the interface_name of the flapping interface on that device.

  • Run-time Input: You want the freedom to decide at runtime whether to bring the flapping interface up or down. So set the Source of the Playbook parameter admin_state to Runtime Input. The Playbook will prompt you for an up or down choice when you initiate the run.

The following figure shows what this set of choices will look like:

Figure 1. Example: Specifying Parameter Value Sources for a Linked Playbook
Example: Specifying Parameter Value Sources for a Linked Playbook

Procedure


Step 1

From the main menu, choose Performance Alerts > Key Performance Indicators (KPI). The Key Performance Indicators (KPI) window opens, displaying lists of the KPI categories and the KPIs available in each category.

Step 2

Select the KPI you want to link to a Playbook. You can use filters to find the KPI you want, as explained in Manage KPIs.

Step 3

Click Link Playbook icon. The Link Playbook to KPI window opens.

Step 4

The left side of the window lists the name of the selected KPI and the Playbooks appropriate for linking to it. Scroll through the list, or use the Playbook Name field to restrict the list to just the Playbooks you want.

Step 5

When you have found the Playbook that you want to link, click the name. The right side of the window will then list the Playbook Details for the selected Playbook, including:

  • The hardware and software platforms with which it is compatible.

  • The minimum software version requirement

  • The Source and default values that will be used when the Playbook runs. In many cases, you can select from a range of default values, or enter your own.

Step 6

Verify or modify the Source and parameter values as needed.

Step 7

When you are finished making changes, click Link to KPI. The Key Performance Indicators (KPI) window is displayed again, this time with the linked Playbook shown next to name of the KPI in the Key Performance Indicators (KPIs) list.

Step 8

To change the Playbook linked to a given KPI, repeat steps 3 through 7 for that KPI, this time choosing the Playbook that you want. To unlink a Playbook entirely, select the KPI and click Unlink Playbook icon.


Verify the Deployment Status of Enabled KPIs

After you enable a KPI Profile, you can verify the deployment status.

Procedure


Step 1

From the main menu, choose Performance Alerts > KPI Job History The KPI Job History window lists the jobs that have been run most recently, indicating whether they succeeded or failed, when they ran, and on what devices.

Step 2

Click the transaction ID in the job listing to view detailed KPI job information, including the device on which the KPI Profile was enabled and the KPI ID.


List of Health Insights KPIs

The following table lists the prebuilt Health Insights KPIs supplied with Cisco Crosswork Health Insights.

Alerting types in the table that you can select when you create a new KPI through the UI. See Create a New KPI:

  • No Alert: The KPI gathers, tracks, and reports performance data without triggering alerts.

  • Standard Deviation: The KPI detects spikes or drops in measured values and alerts when these values deviate some number of standard deviations away from their normal values.

  • Two-Level Threshold: The KPI detects abnormal measured values using two custom thresholds and the ability to provide dampening intervals on the thresholds.

  • Rate Change: The KPI detects abnormal rates of change in measured values to detect rising or falling values.

Additional alerting types that you can use when you export and modify a prebuilt KPI to create KPI with custom parameters are:

  • Standard Deviation of Rate Change: The KPI alerts on standard deviations of the rate of change.

  • Low Single Threshold: The KPI alerts on a single threshold when the value falls below that threshold.

  • Direct Alarm Forwarding: The KPI uses the alarm from the device directly, as a Health Insights KPI alert.

  • Major/Minor/Low/High Thresholds: The KPI alerts on Major high, Minor high, Minor low, and Major low values.

  • Line State Changes: The KPI alerts on shutdowns and flapping in line states.

For more on creating KPIs with custom parameters from exported KPIs, see the Cisco Crosswork Network Automation Custom KPI Tutorial Documentation on Cisco DevNet.

Table 1. Health Insights KPIs

Category

KPI Name Description Alerting Protocol(1)

Dataplane-Counters

CEF drops

Monitors CEF drop counters and baseline. Generates an alert for an unusual number of drops.

Rate Change

MDT, gNMI(2)

CPU

CPU threshold

Monitors CPU usage across route policies and line cards on routers. Generates an alert when CPU utilization exceeds the configured threshold

Two-Level Threshold

MDT, gNMI(2)

CPU

CPU utilization

Monitors CPU usage across route policies and line cards on routers. Generates an alert when CPU utilization is unusual.

Standard Deviation

MDT, gNMI(2)

Basics

Device uptime

Monitors device uptime.

Low Single Threshold

MDT, gNMI(2)

Layer 1-Traffic

Ethernet port error counters

Monitors port transmit and receive error counters.

Rate Change

MDT, gNMI(2)

Layer 1-Traffic

Ethernet port packet size distribution

Monitors port transmit and receive packet size distributions.

No Alert

MDT, gNMI(2)

Layer 1-Traffic

Ethernet port packet statistics

Monitors port transmit and receive packet statistics.

Standard Deviation of Rate Change

MDT, gNMI(2)

Layer 2-Traffic

Interface bandwidth monitor

Monitors bandwidth utilization across all interfaces on a router. Generates an alert when bandwidth exceeds the configured threshold.

Two-Level Threshold

MDT, gNMI(2)

Layer 3-Traffic

Interface counters by protocol

Monitors interface statistics (such as incoming and outgoing packets or byte counters) organized by protocol.

Standard Deviation

MDT, gNMI(2)

Layer2-Interface

Interface flap detection

Monitors interface flaps and alerts when flap count reaches set threshold.

Two-Level Threshold

MDT, gNMI(2)

Layer 2-Traffic

Interface packet counters

Monitors interface transmit and receive counters. Generates an alert when unusual traffic rates occur.

No Alert

MDT, gNMI(2)

Layer 2-Traffic

Interface packet error counters

Monitors interface transmit and receive error counters. Generates an alert when unusual error rates occur.

Rate Change

MDT, gNMI(2)

QOS

Interface QoS (egress)

Monitors interface QoS on the egress direction for queue statistics, queue depth, and so on.

No Alert

MDT, gNMI(2)

QOS

Interface QoS (ingress)

Monitors interface QoS on the ingress direction for queue statistics, queue depth, and so on.

No Alert

MDT, gNMI(2)

Layer 2-Traffic

Interface rate counters

Monitors interface statistics as rate counters. Generates an alert when unusual traffic rates occur.

Standard Deviation

MDT, gNMI(2)

IPSLA

IP SLA UDP echo RTT

Monitors IP SLA UDP echo RTT. Generates an alert when unusual RTT values occur.

Standard Deviation

MDT, gNMI(2)

IPSLA

IP SLA UDP jitter monitoring

Monitors IP SLA UDP jitter. Generates an alert when an abnormal UDP jitter occurs.

Standard Deviation

MDT, gNMI(2)

Layer 3-Routing

IPv6 RIB BGP route count

Monitors IPv6 RIB for route count and memory used by BGP. Generates an alert when an anomaly is detected (such as significant increase or decrease in route counts).

Standard Deviation

MDT, gNMI(2)

Layer 3-Routing

RIB IS-IS route count

Monitors RIB for route count and memory used by IS-IS. Generates an alert when an anomaly is detected (such as significant increase or decrease in route counts).

Standard Deviation

MDT, gNMI(2)

Layer 3-Routing

IPv6 RIB IS-IS route count

Monitors IPv6 RIB for route count and memory used by IS-IS. Generates an alert when an anomaly is detected (such as significant increase or decrease in route counts).

Standard Deviation

MDT, gNMI(2)

Layer 3-Routing

IPv6 RIB OSPF route count

Monitors IPv6 RIB for route count and memory used by OSPF. Generates an alert when an anomaly is detected (such as significant increase or decrease in route counts).

Standard Deviation

MDT, gNMI(2)

Protocol-ISIS

ISIS neighbor summary

Monitors ISIS neighbor summaries for changes in neighbor status. Generates an alert when an anomaly is detected (such as neighbors down or flapping).

Standard Deviation

MDT, gNMI(2)

Layer 1-Optics

Layer 1 optical alarms

Monitors per-port optical alarms (current and past).

Direct Alarm Forwarding

MDT, gNMI(2)

Layer 1-Optics

Layer 1 optical errors

Monitors per-port Layer 1 errors. Generates an alert when error rates exceed the configured threshold.

Rate Change

MDT, gNMI(2)

Layer 1-Optics

Layer 1 optical FEC errors

Monitors per-port optical FEC errors. Generates an alert when FEC errors exceed the configured threshold.

Rate Change

MDT, gNMI(2)

Layer 1-Optics

Layer 1 optical power

Monitors per-port optical power. Generates an alert when power levels exceed the configured threshold.

Major/Minor/Low/High Thresholds

MDT, gNMI(2)

Layer 1-Optics

Layer 1 optical temperature

Monitors per-port optical temperature. Generates an alert when temperature exceeds the configured threshold.

Major/Minor/Low/High Thresholds

MDT, gNMI(2)

Layer 1-Optics

Layer 1 optical voltage

Monitors per-port optical voltage. Generates an alert when voltages exceed the configured threshold.

Major/Minor/Low/High Thresholds

MDT, gNMI(2)

Layer 2-Interface

Line state

Monitors interface line states. Generates an alert when link states change.

Line State Changes

MDT, gNMI(2)

LLDP

LLDP neighbors

Monitors LLDP neighbors. Generates an alert when any sudden changes are detected.

Standard Deviation

MDT, gNMI(2)

Memory

Memory utilization

Monitors memory usage across route processor and line cards on routers. Generates an alert when memory utilization is unusual.

Standard Deviation

MDT, gNMI(2)

Memory

Memory utilization (cXR)

Monitors memory usage across route processor and line cards on classic XR devices. Generates an alert when memory utilization is unusual.

Standard Deviation

MDT, gNMI(2)

Layer 3-Routing

RIB BGP route count

Monitors RIB for route count and memory used by BGP. Generates an alert when an anomaly is detected (such as significant increase or decrease in route counts).

Standard Deviation

MDT, gNMI(2)

Layer 3-Routing

RIB connected route count

Monitors RIB for route count and memory used by connected. Generates an alert when an anomaly is detected (such as significant increase or decrease in route counts).

Standard Deviation

MDT, gNMI(2)

Layer 3-Routing

RIB IS-IS route count

Monitors RIB for route count and memory used by IS-IS. Generates an alert when an anomaly is detected (such as significant increase or decrease in route counts)

Standard Deviation

MDT, gNMI(2)

Layer 3-Routing

RIB local route count

Monitors RIB for route count and memory used by local. Generates an alert when an anomaly is detected (such as significant increase or decrease in route counts).

Standard Deviation

MDT, gNMI(2)

Layer 3-Routing

RIB OSPF route count

Monitors RIB for route count and memory used by OSPF. Generates an alert when an anomaly is detected (such as significant increase or decrease in route counts).

Standard Deviation

MDT, gNMI(2)

Layer 3-Routing

RIB static route count

Monitors RIB for route count and memory used by static. Generates an alert when an anomaly is detected (such as significant increase or decrease in route counts).

Standard Deviation

MDT, gNMI(2)

Layer 3-Routing

RIBv6 connected route count

Monitors RIBv6 for route count and memory used by connected. Generates an alert when an anomaly is detected (such as significant increase or decrease in route counts).

Standard Deviation

MDT, gNMI(2)

Layer 3-Routing

RIBv6 local route count

Monitors RIBv6 for route count and memory used by local. Generates an alert when an anomaly is detected (such as significant increase or decrease in route counts).

Standard Deviation

MDT, gNMI(2)

Layer 3-Routing

RIBv6 static route count

Monitors RIBv6 for route count and memory used by static. Generates an alert when an anomaly is detected (such as significant increase or decrease in route counts).

Standard Deviation

MDT, gNMI(2)

Layer 3-Routing

RIBv6 subscriber route count

Monitors RIBv6 for route count and memory used by subscriber. Generates an alert when an anomaly is detected (such as significant increase or decrease in route counts).

Standard Deviation

MDT, gNMI(2)

Layer 2-Traffic

SNMP interface packet error counters

Monitors interface transmit and receive error counters. Generates an alert when unusual error rates occur.

No Alert

SNMP

Layer 2-Traffic

SNMP interface packet counters

Monitors interface transmit and receive counters. Generates an alert when unusual traffic rates occur.

Rate Change

SNMP

Layer 2-Traffic

SNMP interface rate counters

Monitors interface statistics as rate counters. Generates an alert when unusual traffic rates occur.

Standard Deviation Rate of Change

SNMP

Layer 2-Traffic

SNMP traffic black hole

Monitors input and output data rates for black hole behavior.

Checks the ratio of output data rate to input data rate and verifies that the ratio is within acceptable ranges, otherwise a black hole is occurring.

Two-Level Threshold

SNMP

Layer 2-Traffic

Traffic black hole

Monitors input and output data rates for black hole behavior.

Checks the ratio of output data rate to input data rate and verifies that the ratio is within acceptable ranges, otherwise black hole.

Two-Level Threshold

MDT, gNMI(2)

Layer 2-Traffic

Interface packet error counters (Openconfig)

Monitors interface error counters; generates an alert when unusual error rates occur. This KPI uses openconfig-interfaces YANG model.

Rate Change

gNMI

Layer 2-Traffic

Interface rate counters (Openconfig)

Monitors interface statistics (such as rate counters), and generates an alert when unusual traffic rates occur.

Rate Change

gNMI

File System

Filesystem Utilization

Monitors filesystem usage on active route processor and generates an alert when filesystem utilization exceeds the configured threshold.

Two-Level Threshold

CLI


Note

The target device(s) must support the form of telemetry used by the KPI either SNMP, GNMI, or MDT. The application validates for a match between KPI and device telemetry capabilities.

(1): Definition of the protocols:

  • Model-Driven Telemetry (MDT): Model-driven telemetry provides a mechanism to stream operational data from device as defined in the YANG model(s) to a data collector.

  • gRPC Network Management Interface (gNMI): gNMI provides the mechanism to install, manipulate, and delete the configuration of network devices, and also to view operational data.

  • Simple Network Management Protocol (SNMP): SNMP is an IP protocol for collecting and organizing information about managed devices on IP networks and for modifying that information to change device behavior.

  • Command Line Interface (CLI): CLI is used in network device management.

(2): Health Insights uses either MDT or gNMI protocols but the device supports both. gNMI is a preferred default. Selection of the protocol also depends on the capability of the other device, part of the KPI enable operation or job.


Manage KPI Profiles

The Health Insights KPI Profiles window allows you to create, edit, and delete KPI Profiles.

A KPI Profile is a collection of KPIs and their corresponding parameters such as alert frequency, alert type, cadence, and more. You can group relevant KPIs into a KPI Profile, give it meaningful name that is based on the purpose (for example, environmental or health check), and configure parameters that are relevant to monitoring a specific type of devices (for example, edge routers). Once the KPI profiles are created and validated by the system, they are ready to be used. You can select the device(s) in Health Insights, select appropriate KPI Profiles, and enable them. This action enables all the KPIs in the selected KPI Profile. Similarly, you can select the device(s) and choose to disable the KPI Profiles. This removes all the collection jobs on the Crosswork Data Gateway for all the KPIs and for MDT-based KPIs, this removes the configuration in the device(s).

To display the Health Insights KPI Profiles window, choose Performance Alerts > KPI Profiles from the main menu.

Manage KPI Profiles
Item Description

1

Create KPI Profile: Click Add icon to create a new, user-created KPI Profile. For help with this task, see Create a New KPI Profile.

2

Edit KPI Profile: Select a user-created KPI Profile in the list and then click Edit icon to edit it. For help with this task, see Create a New KPI Profile.

3

Delete KPI Profile: Select a user-created KPI Profile in the list and then click Delete icon to delete it. You cannot delete a KPI Profile that has been enabled on any device(s).

4

Filter KPI Profile: To find a KPI category, enter all or part of the KPI Profile name in this field, and the list is automatically filtered based on your input. Click Set Filter icon to clear any filters you have set.

5

KPI On Profile: The KPI(s) added on the selected KPI Profile and the associated parameters are displayed here. You can edit the KPI parameters, or remove a KPI from the selected KPI Profile using the appropriate options here.

6

#KPIs on Profile: This is the number of KPIs added on the selected KPI Profile.

7

Enabled Devices: This is the number of devices on which the selected KPI Profile is enabled.

8

+Alert Group: Click this option to create Alert Group for the selected KPI Profile. For help with this task, see Create a New KPI Profile

9

Alert All: Click this option to turn off or turn on the alerts for all KPIs in the profile.

Create a New KPI Profile

You can create a KPI Profile and enable it on the desired devices. The workflow is as follows:

  1. Supply basic information, such as the Profile name and a description.

  2. Add KPI(s) and save the profile.

  3. Edit KPI parameters and create alert groups.

  4. Enable the KPI Profile on the devices.

The following steps explain how to perform these tasks.

Procedure


Step 1

From the main menu, choose Performance Alerts > KPI Profiles. The KPI Profiles window is displayed.

Step 2

Click the Add icon. The Create New Profile window is displayed.

Step 3

In the text fields provided, enter a unique Profile Name, a short Description. The Profile Name can contain a maximum of 32 alphanumeric characters, plus underscores ("_"). No other special characters are allowed.

Step 4

(Optional) You can specify an external destination to send the data collected by KPIs. To create an external data destination, go to Administration > Data Gateway Global Settings Provide relevant values for the following fields:

  • Server Type: Select either KAFKA or GRPC.

  • Name: Select the name of the external destination.

  • Topic: Enter a topic to provide context for the data being sent. This field is applicable only for KAFKA.

Note 

You need to create a new data destination to export the KPI data. The predefined data destinations cannot be used for this activity. For more information about creating a data destination, see Cisco Crosswork Infrastructure 4.3 and Applications Administration Guide.

Step 5

Add KPI to the profile, using the following filter options:

  1. All KPIs: By default, this option is selected and the list of all KPIs are displayed in the list. You can select the required KPI by checking the relevant check box.

  2. Recommended KPIs: You can select KPIs based on the KPIs recommended for a specific device. Click Recommended KPIs and the device list is displayed. You can filter the device list by entering relevant values in the Name field, or by using tags. Select a device from the list and the recommended KPI list is displayed on the right side. Select the required KPI by checking the relevant check box.

    Note 

    Selecting KPIs from the recommended KPI list of a selected device does not automatically enable the KPI Profile in the selected device. The KPI Profile can be enabled after it is created. For more information, see Enable KPI Profile on Devices

Step 6

Click Save save the new KPI Profile and display the KPI Profiles window.

Step 7

In the KPI Profiles area on the left side, choose the KPI Profile that you created, and the individual KPI details are displayed on the right side.

Note 
For the Interface KPIs, you can gather the data for all the interfaces or selected interfaces. If you opt to gather the information for all the interfaces, a warning symbol appears on the KPI Profile name on the left side and on the individual KPI details on the right side, indicating that the monitoring interfaces are not customized.
Important 
Gathering telemetry data for all the interfaces can be resource-intensive and may require additional worker nodes and/or CDG resources to be deployed.
Step 8

You can leave the KPI parameters at the default or choose a different value. To edit the KPI parameters and preferences, click Edit Details, and the KPI Details window is displayed. Edit the values as appropriate for the purpose of your KPI. The details are:

  • Common Parameters

    • Alert: This is an on/off toggle switch for alerting. Based on the Alert parameter value, the corresponding alerting logic is deployed. Alerting can be enabled even after the KPI Profile has been applied to the devices.

      Note 
      Any KPI using the group alerting logic need to have the alerting flag set to ON.
    • Cadence (sec): Set the frequency of sensor data. Set the frequency (in seconds) in which the KPI will gather sensor data from the devices on which the KPI Profile is enabled.

    • Alerting Down Sample Rate: Alert frequency rate. It determines how often KPI data will be evaluated for any alert conditions, and is relative to the Cadence. For example, if Cadence is 60 seconds and you want to do an alerting evaluation every 300 sec, then specify Alerting Down Sample Rate as "5".

  • KPI Monitoring Preferences: Applicable only for Interface KPIs.
    • Customer Selected Interfaces: You can define the interface criteria.

      • Regex: You can define a rule using regex expression.

      • Add Manual Query: You can add different sets of rules.

    • All Interfaces: The selected KPI is applied to all the interfaces.

Step 9

You can also edit the alert logic parameters of the selected KPI. To learn more about a parameter, hover your mouse cursor over the Reachability Unknown icon shown next to the parameter name.

Note 

When different thresholds are desired for different types of devices in the network, it is advisable to create multiple profiles and split the KPIs across them to meet the needs of different device types.

Step 10

When you are finished making changes, click Save to save the new KPI Profile. Health Insights validates your input parameters and displays the KPI Profiles window.

Note 

You can create up to 50 KPI profiles, and an individual KPI Profile can consist up to 50 KPIs. KPI profile creation can fail if the total number is exceeded, or if Health Insights could not create the required tags in Inventory manager. This status is reflected in the profile state. Once profile is ready, it can be applied on devices.

With the KPI Profiles window displayed, you can enable the new KPI Profiles on one or more devices immediately, following the steps given in Enable KPI Profile on Devices.

See Disable KPI Profile on Devices or Device Groups for instructions to disable KPI Profiles.

Step 11

(Optional) You can also create alert groups for a KPI Profile. Alert groups use boolean logic (cascaded OR and AND) to combine alert outputs from primary KPIs in your KPI profile and create a group logic query. To create an alert group, click + Alert Group. The Create Alert Group window is displayed.

Note 

Configuring an alert provider enables the alerts from the group alert to be sent to a REST endpoint using Webhook registered in the alert provider.

Step 12

Provide a relevant entry in the Name field. Summary and Details are optional fields.

Step 13

The Alert Group Conditions area on the right side lets you select a logic gate (AND/OR) and add a KPI on which the logic is applied. Your alert group can be based on the alert criteria of a single KPI, or it can be a combination of mutliple KPI outputs. Click the desired logic (AND gate is selected by default), and click the + ADD dropdown list to add an Item or a Group.

Item allows you to add individual KPI items and set the corresponding alert level, and Group allows you to add a nested alert group.

Step 14

Choose the desired KPI from the Select KPI dropdown, and select the desired level(s) for which the alerts need to be set for the chosen KPI. The alert levels are CRITICAL, MAJOR, MINOR, WARNING and INFO. Based on the logic gate and alert criteria you select, the output of the KPIs are evaluated and the alert is generated.

In the example shown above, the alert is set based on the output of two logic gates. The first logic gate is the output of an OR operation between the Memory Utilization and Interface Bandwidth monitor KPIs. If the set alert levels are met for either of the KPIs, the output of the first logic gate is set as true. This output is considered as the input for the second logic gate, which is an AND operation with the CPU Utilization KPI. If the alert levels of both the KPIs are met, the output of the second logic gate is set as true.

Step 15

Click Save to save the new alert group and display the KPI Profiles window. Click Edit Details or Delete icon to edit or delete an existing alert group respectively.


Enable KPI Profile on Devices

With Health Insights, you can enable and monitor the KPI Profiles in which you are interested. Instead of sifting through all the data that a given device can supply, you choose to monitor only the information relevant to the role the device plays in your network. Your network devices operate most efficiently when configured to only report data that specifically relates to the performance of its role in the network.

Some KPIs trigger alerts based on deviation from an established level of performance. For these types of KPIs, it is necessary to allow the system some annealing time in order to establish normal performance levels.


Important

You can only enable KPI Profiles with MDT-based KPIs on a device that has been mapped to a Cisco Network Services Orchestrator (Cisco NSO) provider and attached to a Crosswork Data Gateway.


Note

Do not enable KPI Profiles on devices that are not reachable.


Warning

The load that is created on Cisco Crosswork Data Gateway and Crosswork Infrastructure caused by enabling KPI profiles on many devices or KPI profiles that gather a lot of data is hard to estimate. Crosswork provides a UI and API that allows you to see the current load and provides general guidelines for determining when you must refrain from enabling more collections until either other collections are disabled or more resources (CDG or worker nodes) are added. To check Cisco Crosswork Data Gateway load, see Monitor Crosswork Data Gateway Health at Cisco Crosswork Infrastructure 4.3 and Applications Administration Guide.


To enable KPI Profile on devices:

Procedure


Step 1

From the main menu, choose Performance Alerts > Enable/Disable KPI Profiles. The Devices window is displayed.

Step 2

Select the devices for which you want to enable KPI Profiles. You can click the Device or Device Tags buttons above the table on the left to toggle between selecting the devices by name or by tagged device group membership. Depending on your selection, the device list or the device tag list is displayed on the left.

If you choose to select by Device:

  • Click Set Filter icon in the table on the right. Type a Name or Device Type in the filter fields. As you type, the table displays only the devices whose name or type match the text that you typed.

  • Click the check box next to the device(s) you want. You can select multiple devices at the same time.

If you choose to select by Device Tags:

  • Type a tag name in the Name field to find a Device Group in the table. As you type, the table displays only the tag names that match the text you typed.

  • Click the check box next to the group that you want. The names of all the devices in that group appear in the devices table on the right.

Note 

You cannot enable a KPI on the device that is attached to a standard Crosswork Data Gateway. It will show an error pop-up. Also, you cannot move a KPI-enabled device from extended Crosswork Data Gateway to standard Crosswork Data Gateway. It shows an error pop-up.

Step 3

Click Enable KPI Profiles to continue. Health Insights detects the selected devices, their types and models, and retrieves and analyzes their running configurations. The KPI Profiles window presents the KPI Profiles available for your selected devices.

Step 4

Choose the KPI Profiles that you want to enable by clicking the check box next to the KPI Profile name, and click Next.

The Verify Details window appears, listing all the KPI Profiles you have chosen to be enabled on the selected devices.

Step 5

(Optional) To get information about the KPIs included in the KPI Profile. Click the KPI Profile in the Selected Profile(s) table, and the content of the selected KPI Profile is displayed on the right side. Click View More Details to view the parameters of a specific KPI. A pop-up window provides the details of the KPI. Click the Close icon to close the pop-up window.

Step 6

To enable the selected KPI Profiles on the selected devices, click Enable. Health Insights schedules the KPI Profile(s) as a series of job sets.

Note 

The Alert flag for the KPI profile (click Edit Details on the relevant KPI) must be turned ON in order to trigger an alert when the data is collected.

Note 

Enabling a KPI results in configuring a collection job on the Crosswork Data Gateway. For GNMI-based and SNMP-based KPIs, the Crosswork Data Gateway polls the desired data and forwards it to Health Insights for processing and evaluation. For MDT-based KPIs, the devices (through NSO) are configured to push the data to the Crosswork Data Gateway which then forwards it to Health Insights for processing and evaluation.

Note 

In the Device table, in the Enabled Profiles column, you can click the number to see the status of the KPI collection job (for example to see if the KPI Profile ID is active or not).

Step 7

From the main menu, choose Performance Alerts > KPI Job History to watch the progress of each job set, as shown below. You should see job sets completing with a status of "Success". If job sets complete with a "Partial" or "Failed" status, be sure to read the job completion messages, and check that the selected devices are still reachable.

When the job sets complete successfully, the KPIs are now associated to the devices and the platform begins the process of enabling the relevant collection procedures for those network elements. In making these changes, you are automating the configuration of both the platform and the devices themselves to collect only the information required.

Step 8

From the main menu, choose Administration > Collection Jobs to look at the collection jobs and to make sure that they are created and the incoming data is collected.

Step 9

From the main menu, choose Performance Alerts > Alert Dashboard. The dashboard shows the alert status for the devices on which you have enabled KPI monitoring.


Note

  • SNMP/MDT jobs may take more time than expected to reach the completed state when there is an increase in the number of devices, interfaces and KPIs.

  • Enabling KPI profile per device takes around 3-5 seconds (but the time varies based on the number of KPIs being enabled). If the device is not reachable, it keeps trying until it is timed out. This may result in the job taking more time to reach the completed state.


Disable KPI Profile on Devices or Device Groups

You can use the Enable/Disable KPI Profiles window to disable the KPI Profiles running on device(s) or device groups.

Procedure


Step 1

From the main menu, choose Performance Alerts > Enable/Disable KPI Profiles. The Enable/Disable KPI Profiles window is displayed.

Step 2

To disable KPIs enabled on one or more devices:

  1. Click the Device button above the table on the left. The Devices table displays all the devices, with the total number of KPIs enabled on each device.

  2. Click the check box next to the devices on which you want to disable KPIs.

    If you select one device, you can disable all KPI Profiles for the device or just some of the KPI Profiles. If you select more than one device, you can only disable all KPIs for them.

  3. Click Disable KPI Profiles. You will be prompted to confirm that you want to disable the KPIs running on all the selected devices. If you selected only one device, click the checkboxes next to the KPI Profiles you want to disable on that device, or click the checkbox at the top of the column to disable all the KPI Profiles running on that device. Click Disable to confirm.

Step 3

To disable all KPI Profiles enabled on all the devices within a device group:

  1. Click the Device Tags button above the table on the left. The table displays the list of device tags.

  2. Click the checkbox next to the device tag(s) used on the devices from which you no longer want to collect the KPI data.

    When you select a device tag, the Devices table on the right shows all the devices that are associated with that tag. All of the devices are preselected.

  3. Click Disable KPI Profiles. You will be prompted to confirm that you want to disable all the KPIs running on all the devices in the group. Click Disable to confirm.


Troubleshoot Health Insights

The following table describes issues that you may encounter when using the Health Insights application, and their solutions or workarounds.

Table 2. Health Insights Troubleshooting

Issue

Solution

Apply a KPI to a device fails with messages indicating that Cisco Network Services Orchestrator (Cisco NSO) and the target device are out of sync or otherwise out of communication. Message text will vary, but may include "device out of sync," "NC client timeout," and other text indicating that there are connectivity or sync issues between NSO and the device.

  1. Go to Performance Alerts > KPI Job History and check the Message column for an error message.

  2. Go to Device Management > Network Devices.

  3. For the failed device, in the NSO state column, click Details icon.

  4. From the Check Sync drop-down list, click Sync From.

  5. Confirm that the device is in sync now.

Health Insights not receiving data.

  1. Confirm that the KPI configuration job completed without error: Go to Performance Alerts > KPI Job History

  2. Check the Collection/distribution status: Go to Administration > Collection Jobs.

  3. Check for the collection job to see if the table (accessed by clicking the graph icon for the job) indicates that data collections are processing.