View RSVP-TE Tunnels on the Topology Map
To get to the Traffic Engineering topology map for RSVP-TE visualization, choose tab.
 Note |
Throughout this section, the navigation is documented as . However, when using the Crosswork Network Controller solution, the navigation is . |
| Callout No. | Description | |||
|---|---|---|---|---|
|
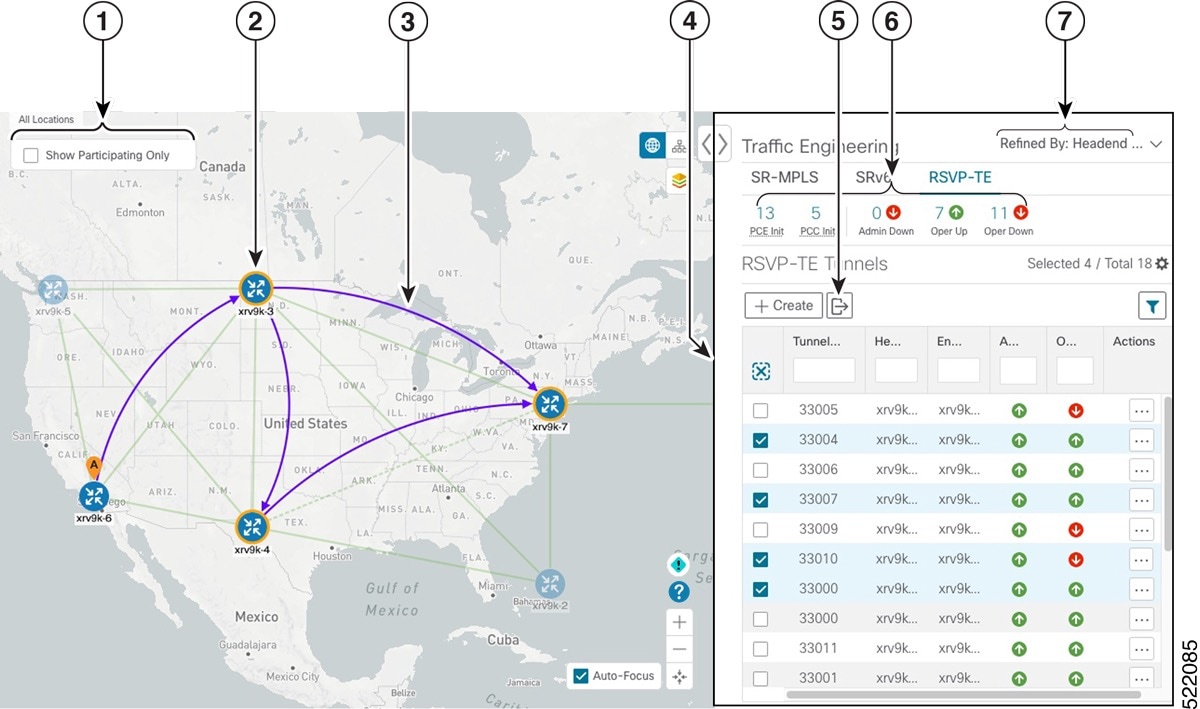
1 |
Click Show Participating Only to display links that only belong to the selected RSVP-TE tunnels. All other links and devices disappear. |
|||
|
2 |
A device with a solid orange outline (
|
|||
|
3 |
When RSVP-TE tunnels are selected in the RSVP-TE Tunnel table, they show as purple directional lines on the map indicating source and destination.
If both A and Z are displayed in a device cluster, at least one node in the cluster is a source and another is a destination. The A+ denotes that there is more than one RSVP-TE tunnel that originates from a node. The Z+ denotes that the node is a destination for more than one RSVP-TE tunnel. |
|||
|
4 |
The content of this window depends on what has been selected or filtered. In this example, the RSVP-TE tab is selected and the RSVP-TE Tunnels table is displayed. Depending on what is selected on the topology map, or whether you are in the process of viewing and managing RSVP-TE tunnels, you can do the following: |
|||
|
5 |
Exports all data into a CSV file. You cannot export selected or filtered data. |
|||
|
6 |
The Mini Dashboard provides a summary of the operational RSVP-TE tunnel status and the number of PCC and PCE initiated tunnels that are currently listed in the RSVP-TE tables. If filters are applied, the Mini Dashboard is updated to reflect what is displayed in the RSVP-TE table. |
|||
|
7 |
This option allows you to choose how the group filter (when in use) should be applied on the table data. For example, if Headend only was selected, then it would only display policies where the headend device of the policy is in the selected group. This filter allows you to see specific configurations and is useful when you have a large network. Filter options:
|
|||


 Feedback