Setup and Monitor Your Network

Get a Quick View in the Dashboard

The Home page displays a customizable collection of dashlets which provide an at-a-glance operational summary of the network being managed, including reachability and operational status of devices. The Dashboard is made up of a series of dashlets, and each dashlet represents different types of data belonging to the same category.

Figure 1. Crosswork Home page
Dashboard with Callouts
Callout No. Description

1

Main Menu: The main menu allows you to navigate to installed Cisco Crosswork applications and device management and administrative tasks. Menu options may look slightly different depending on which Cisco Crosswork applications are installed.

2

Dashlets: Information varies depending on which Cisco Crosswork applications are installed.

  • To drill down for more information within a dashlet, click on a value. A window appears displaying only the filtered data you clicked on.

  • To add or change the layout of dashlets, click Customize View. Move the dashlets to your desired layout and click Save.

  • You can duplicate or remove TE dashlets using the trash or pencil icons within the top-right corner of the dashlet.

3

Settings icons:

Notifications icon The Alerts icon notifies you of any current error conditions related to the system operations which require attention, and provides a link to detailed information about those conditions.

Show Events icon The Events icon notifies you of new events related to system operation, and also provides access to the history of all system events.

About Crosswork iconThe About icon displays the current version of the Cisco Crosswork product.

User Account icon The User Account icon lets you view your username, change your password, and log out.

View Devices and Links on the Topology Map

To view your devices on the topology map, they must be onboarded. For more information refer to the Cisco Crosswork Network Controller Administration Guide. To view the network topology map, from the main menu choose Topology.


Note


If you are viewing the HTML version of this guide, click on the image to view it in full-size.


Figure 2. Cisco Crosswork UI and Topology Map
Crosswork UI and Topology Map with Callouts - Outside IMG
Callout No. Description

1

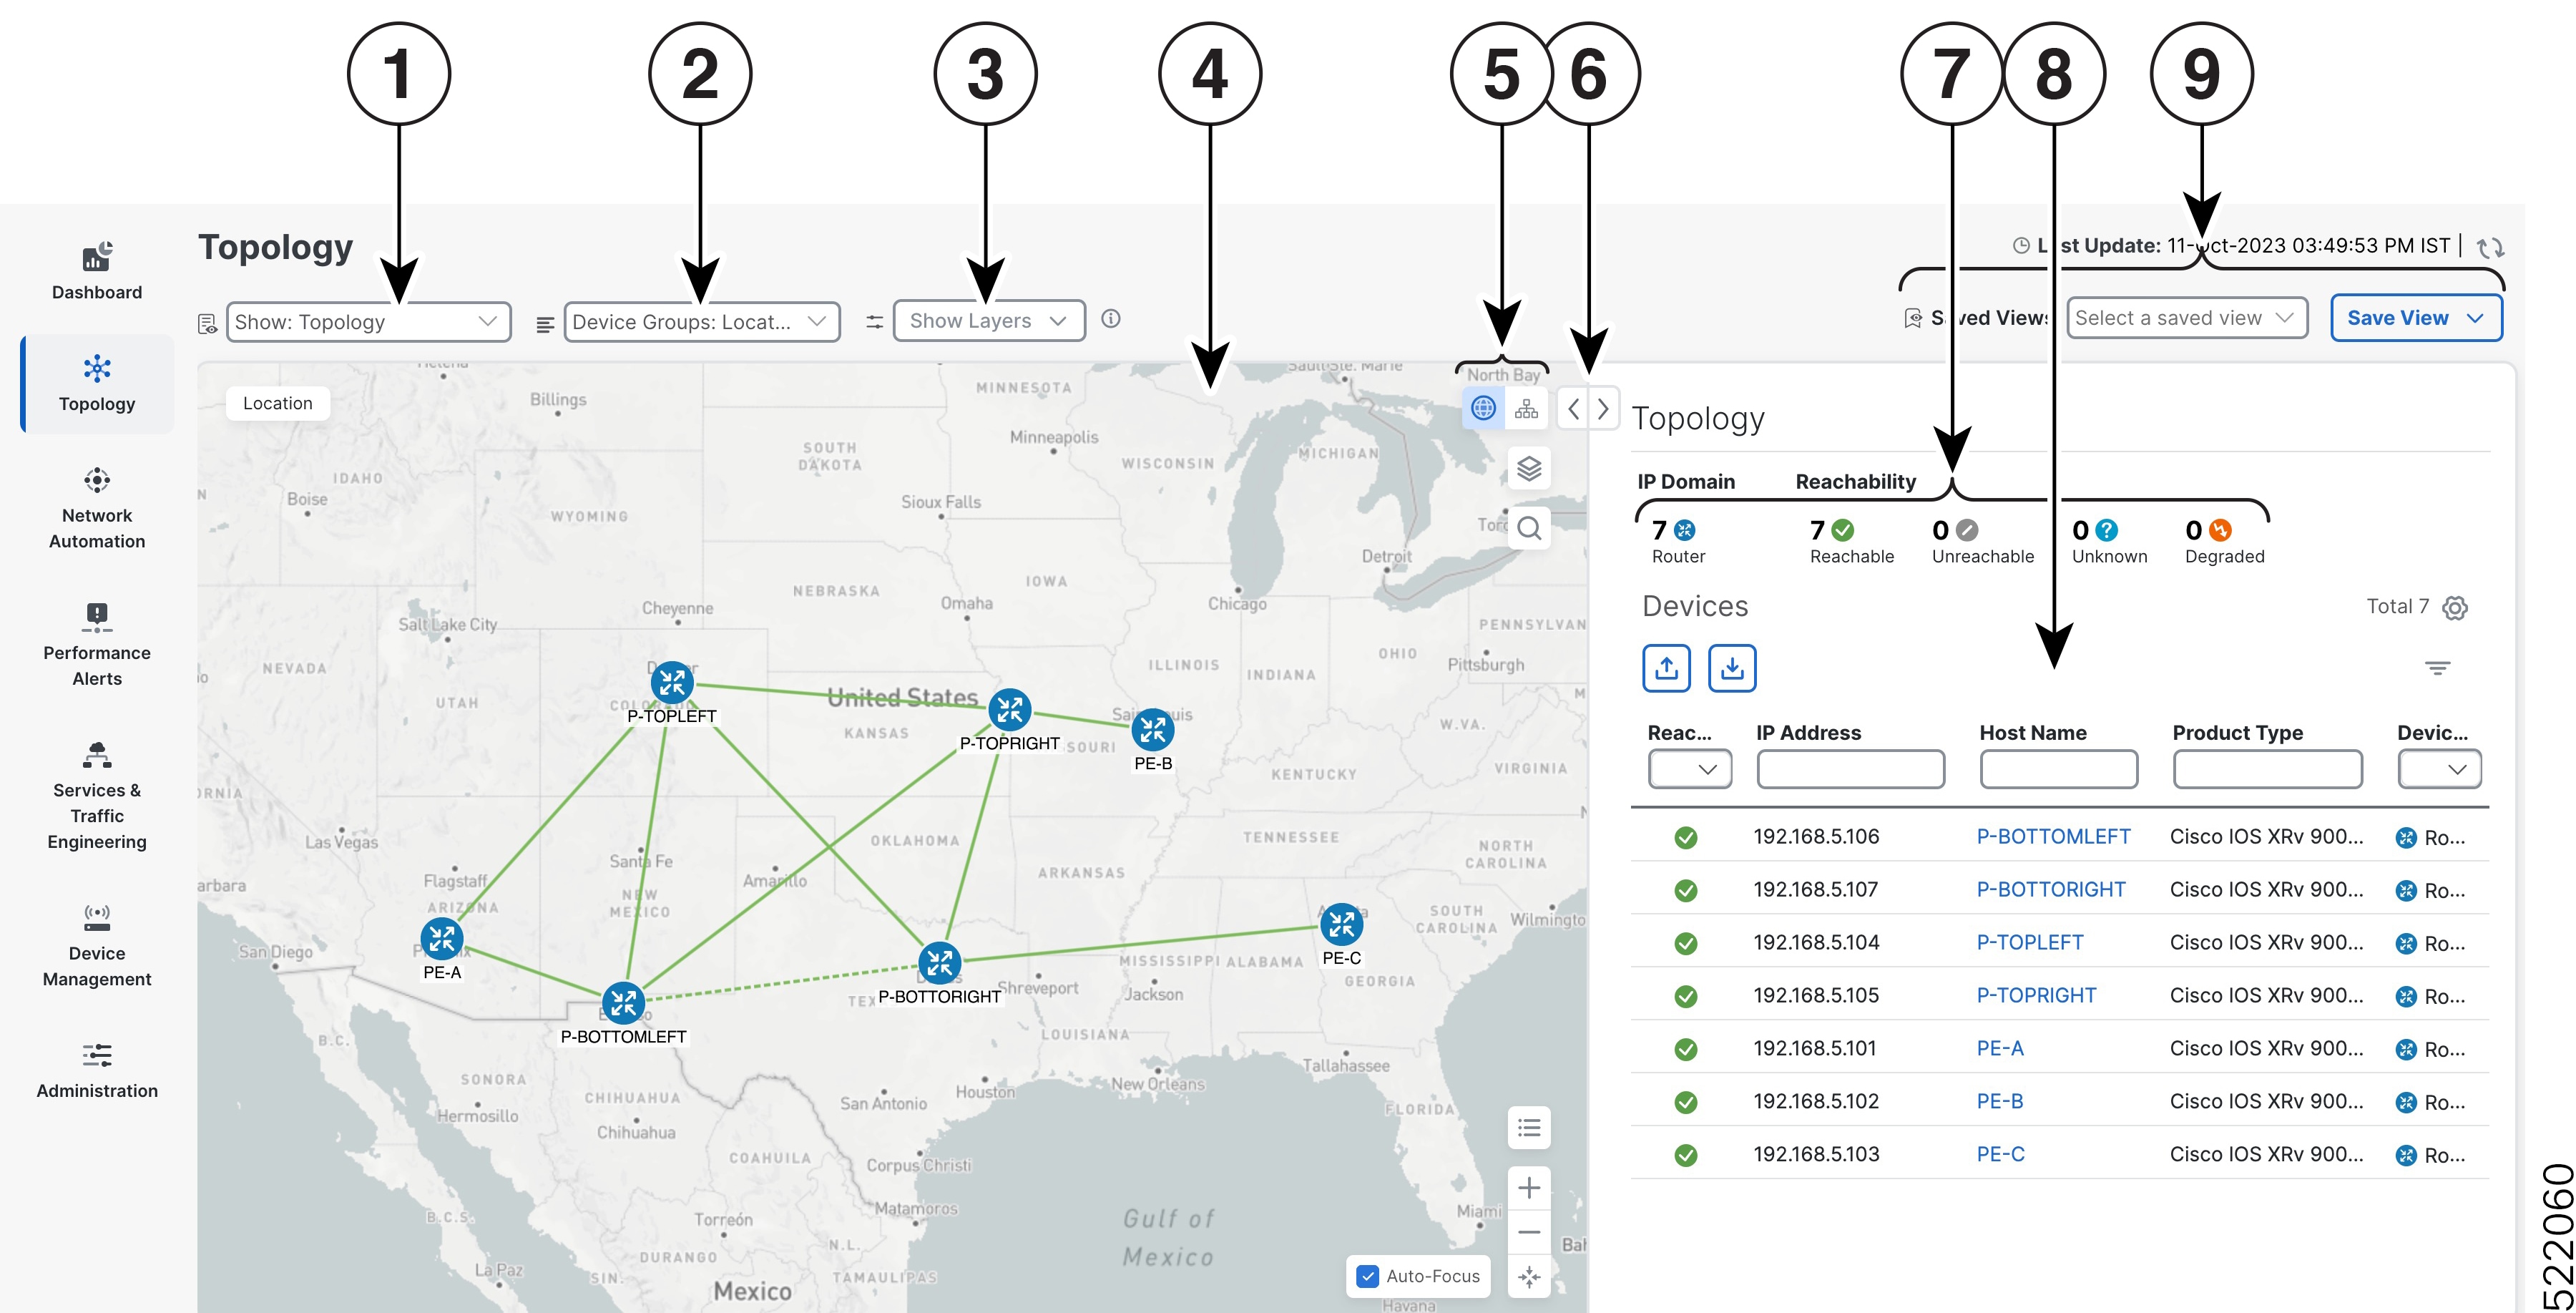
Topology Map View: From the Show drop-down list, click the option that displays the data that you would like to see on the map.

If Topology is selected, devices and links in the network are displayed.

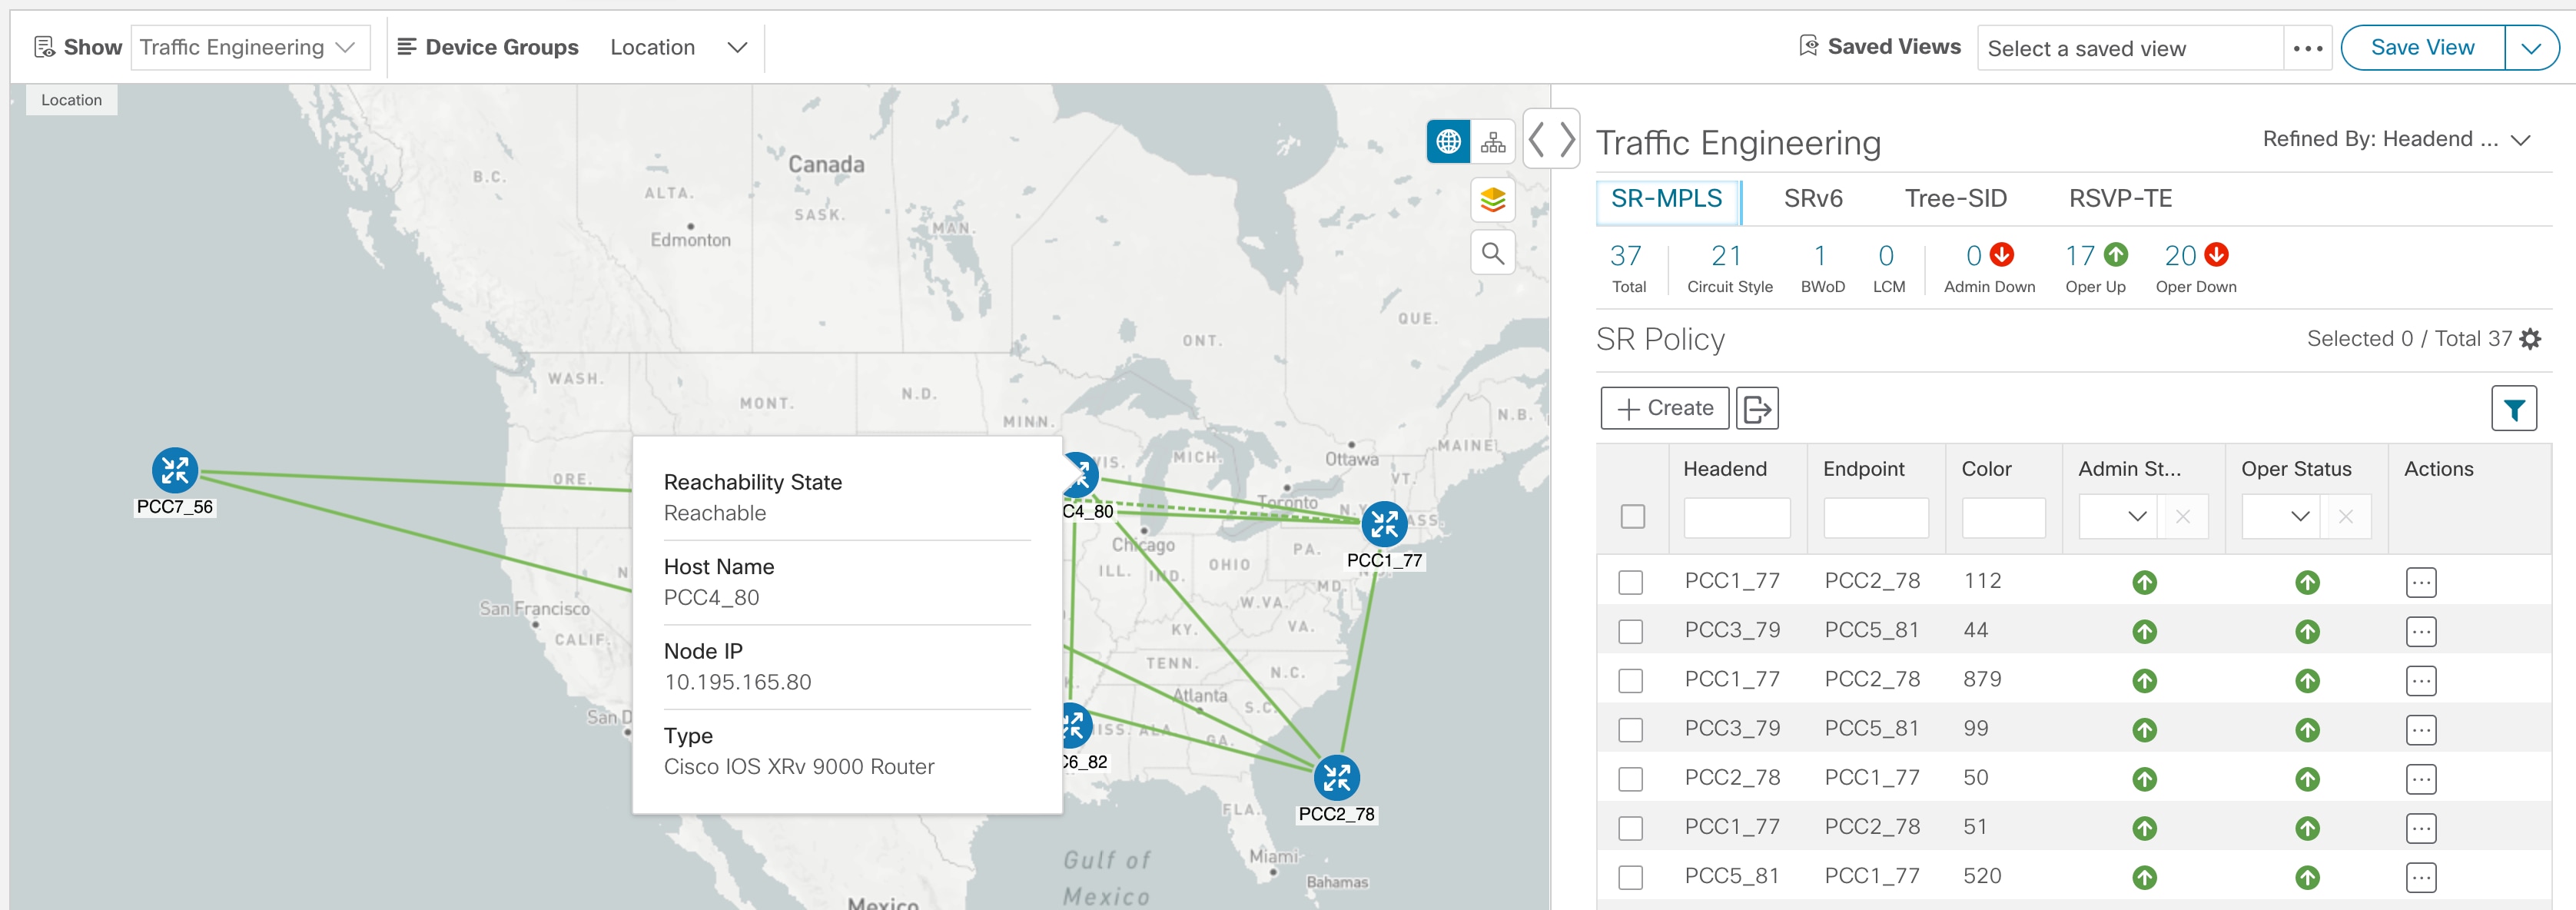
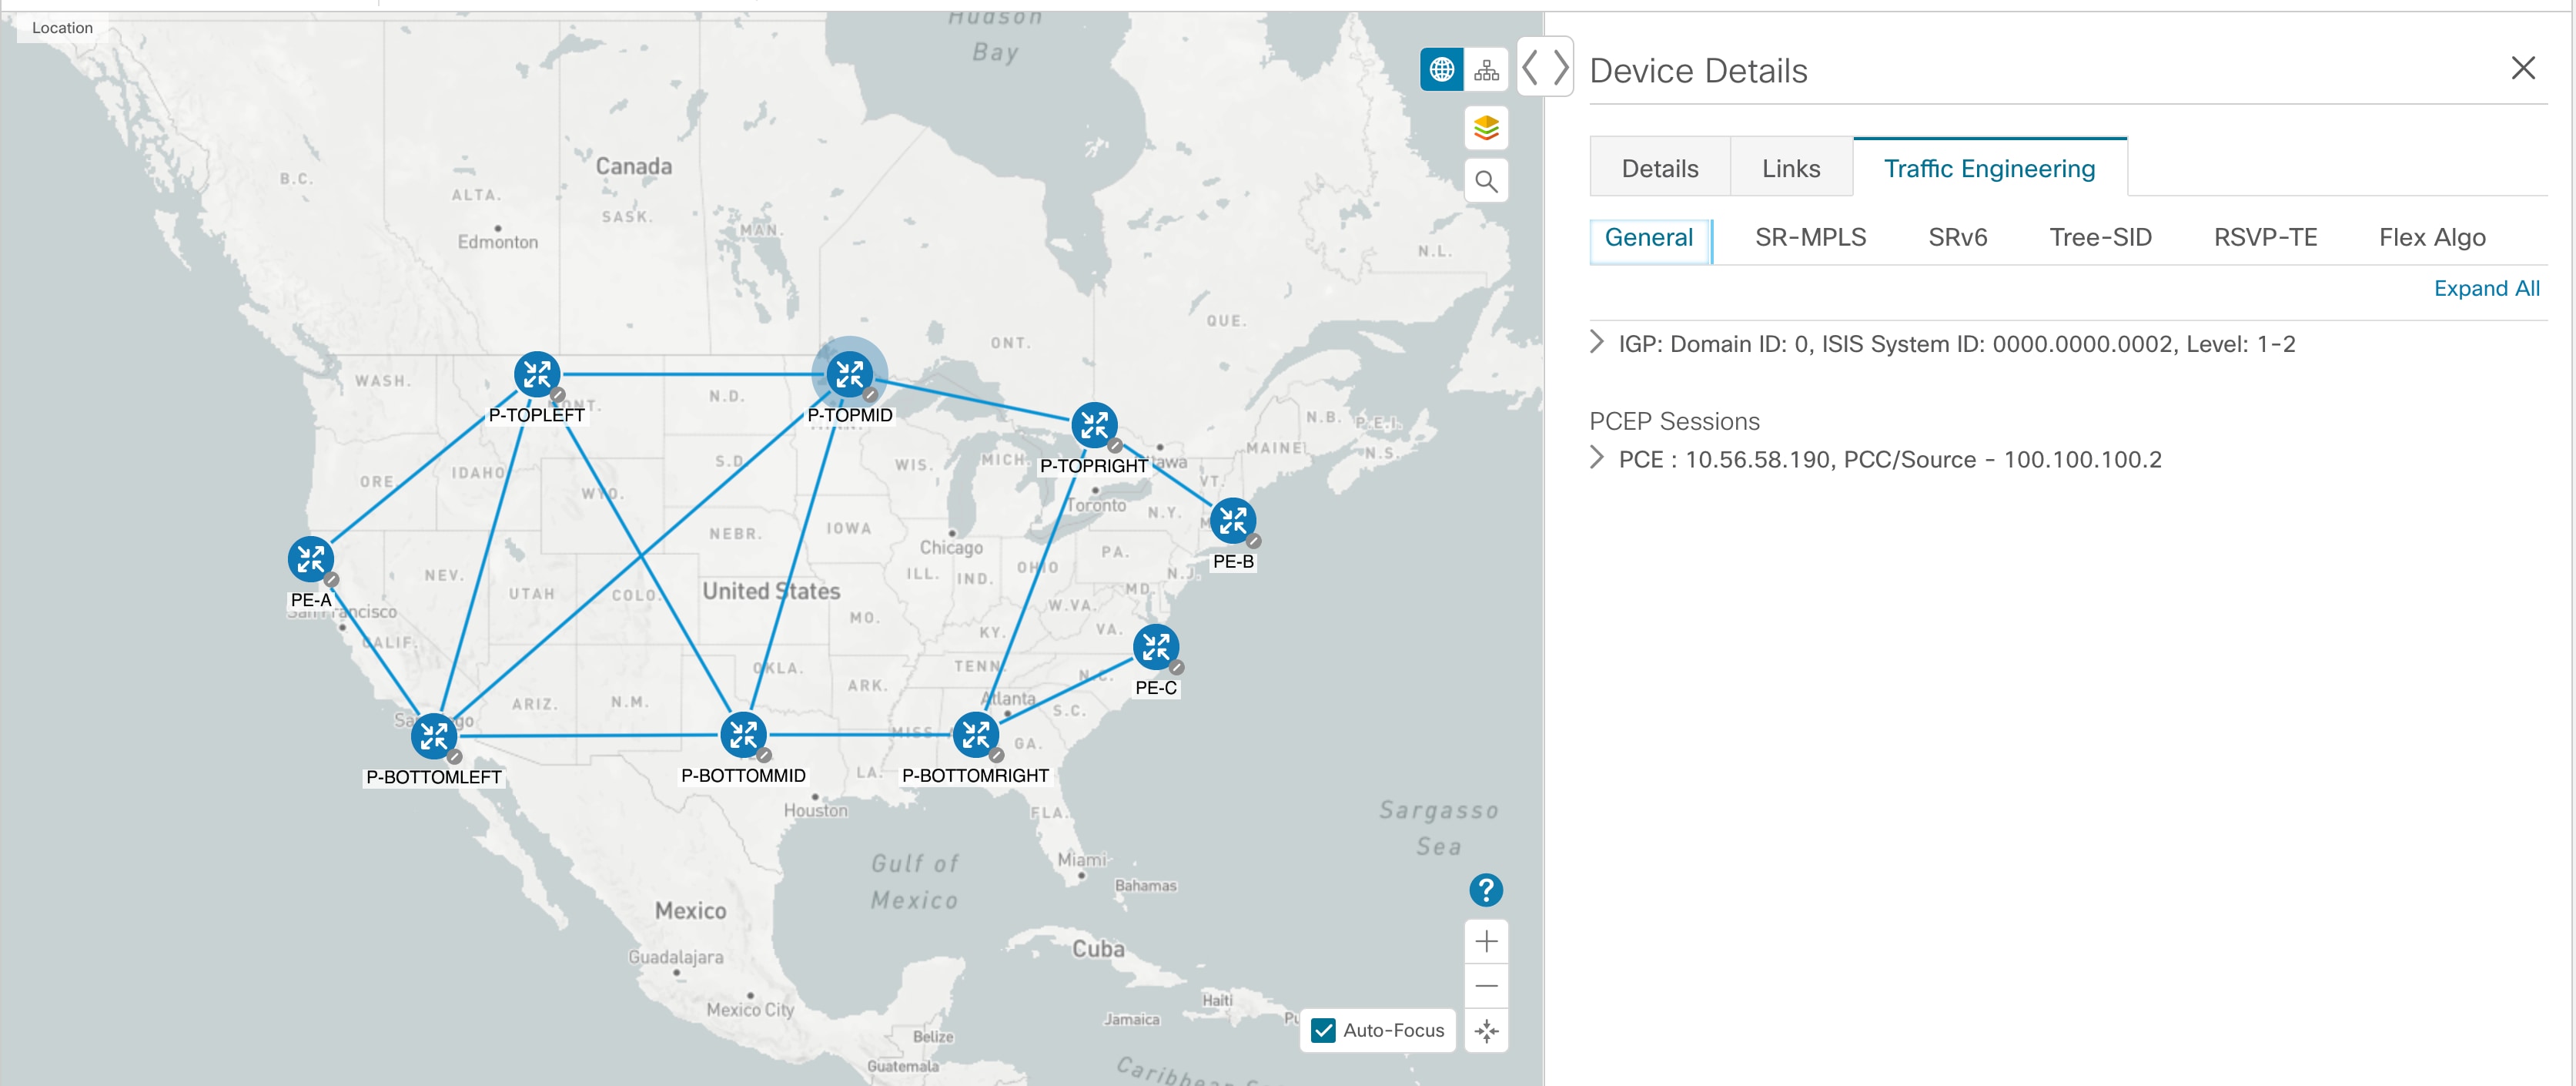
If Traffic Engineering is selected, TE tunnel information is displayed. For more information on the Traffic Engineering topology map, see View SR-MPLS and SRv6 Policies on the Topology Map and View RSVP-TE Tunnels on the Topology Map.

2

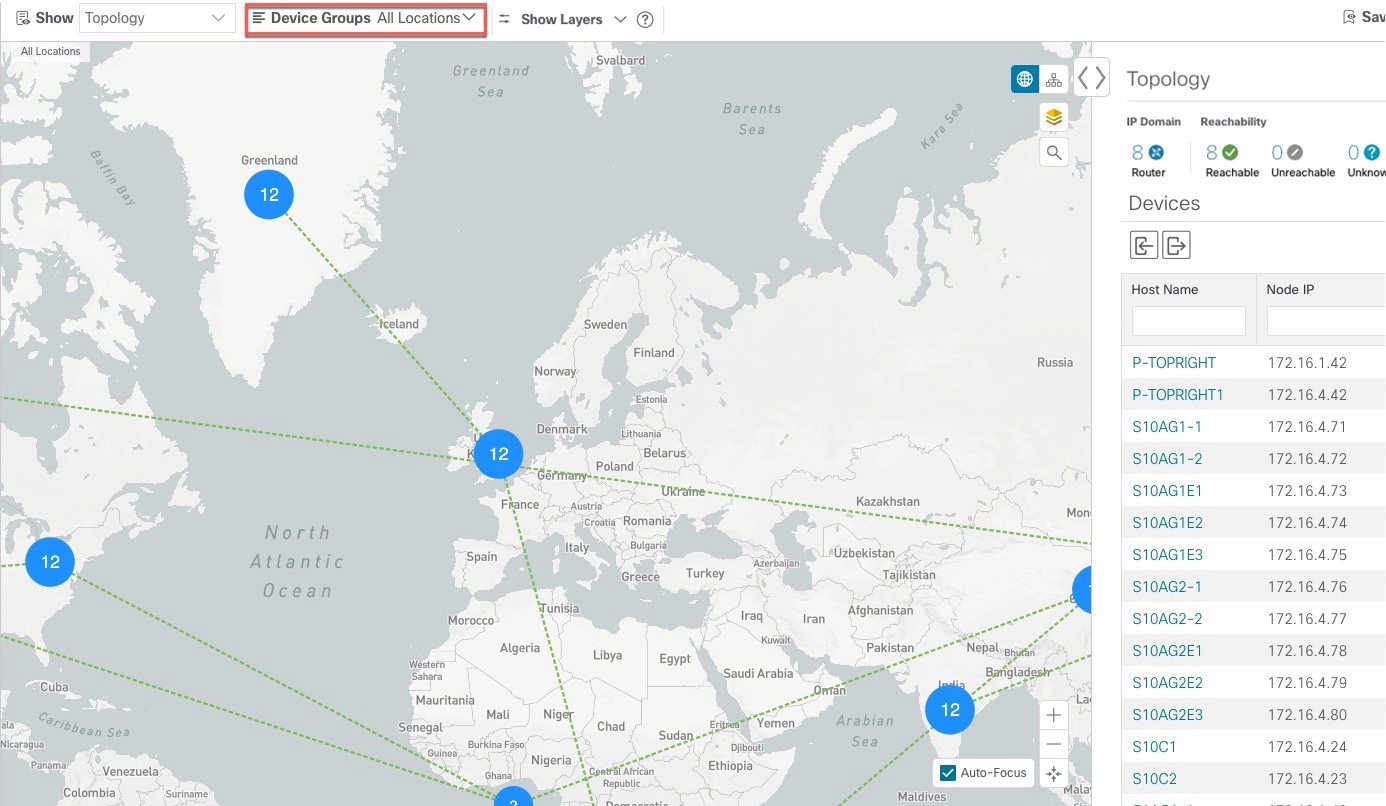
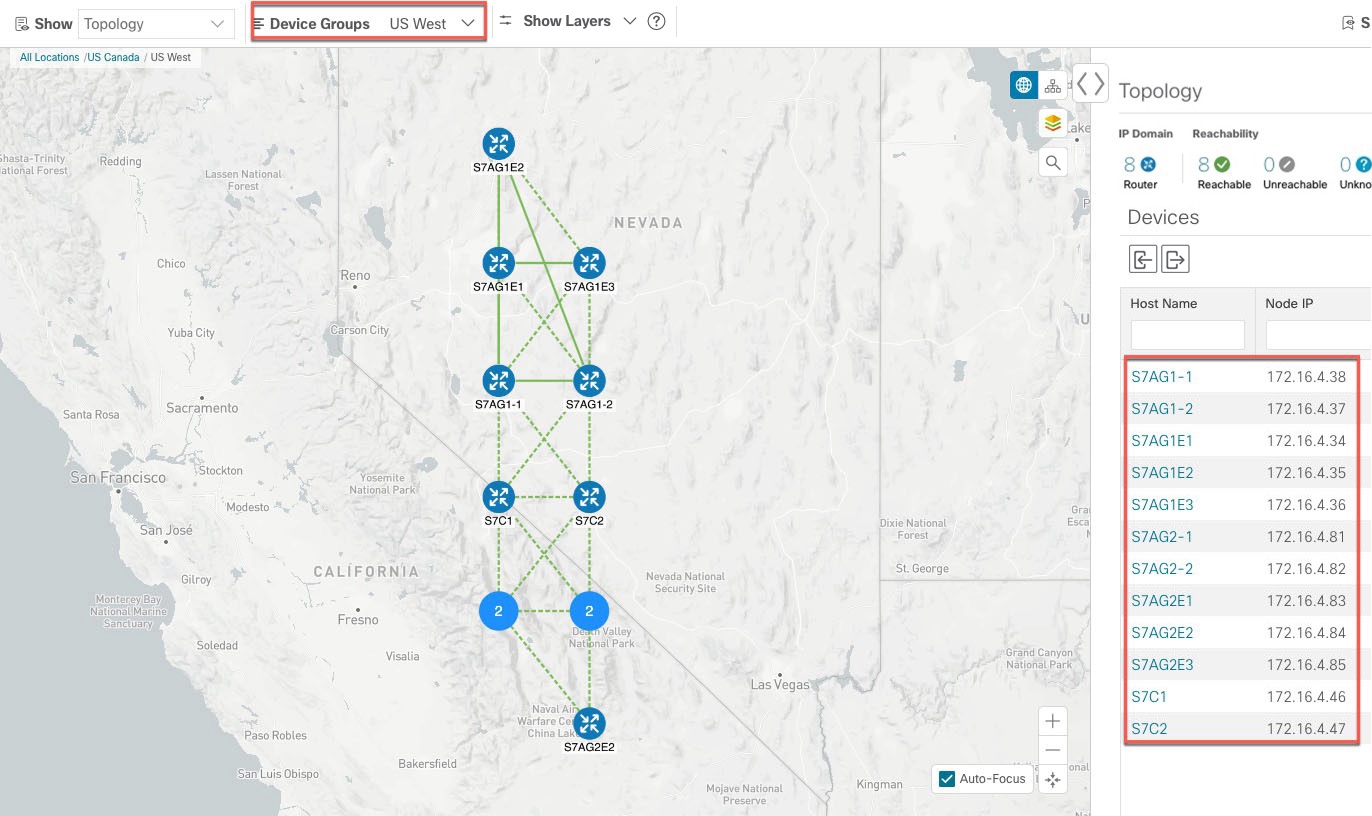
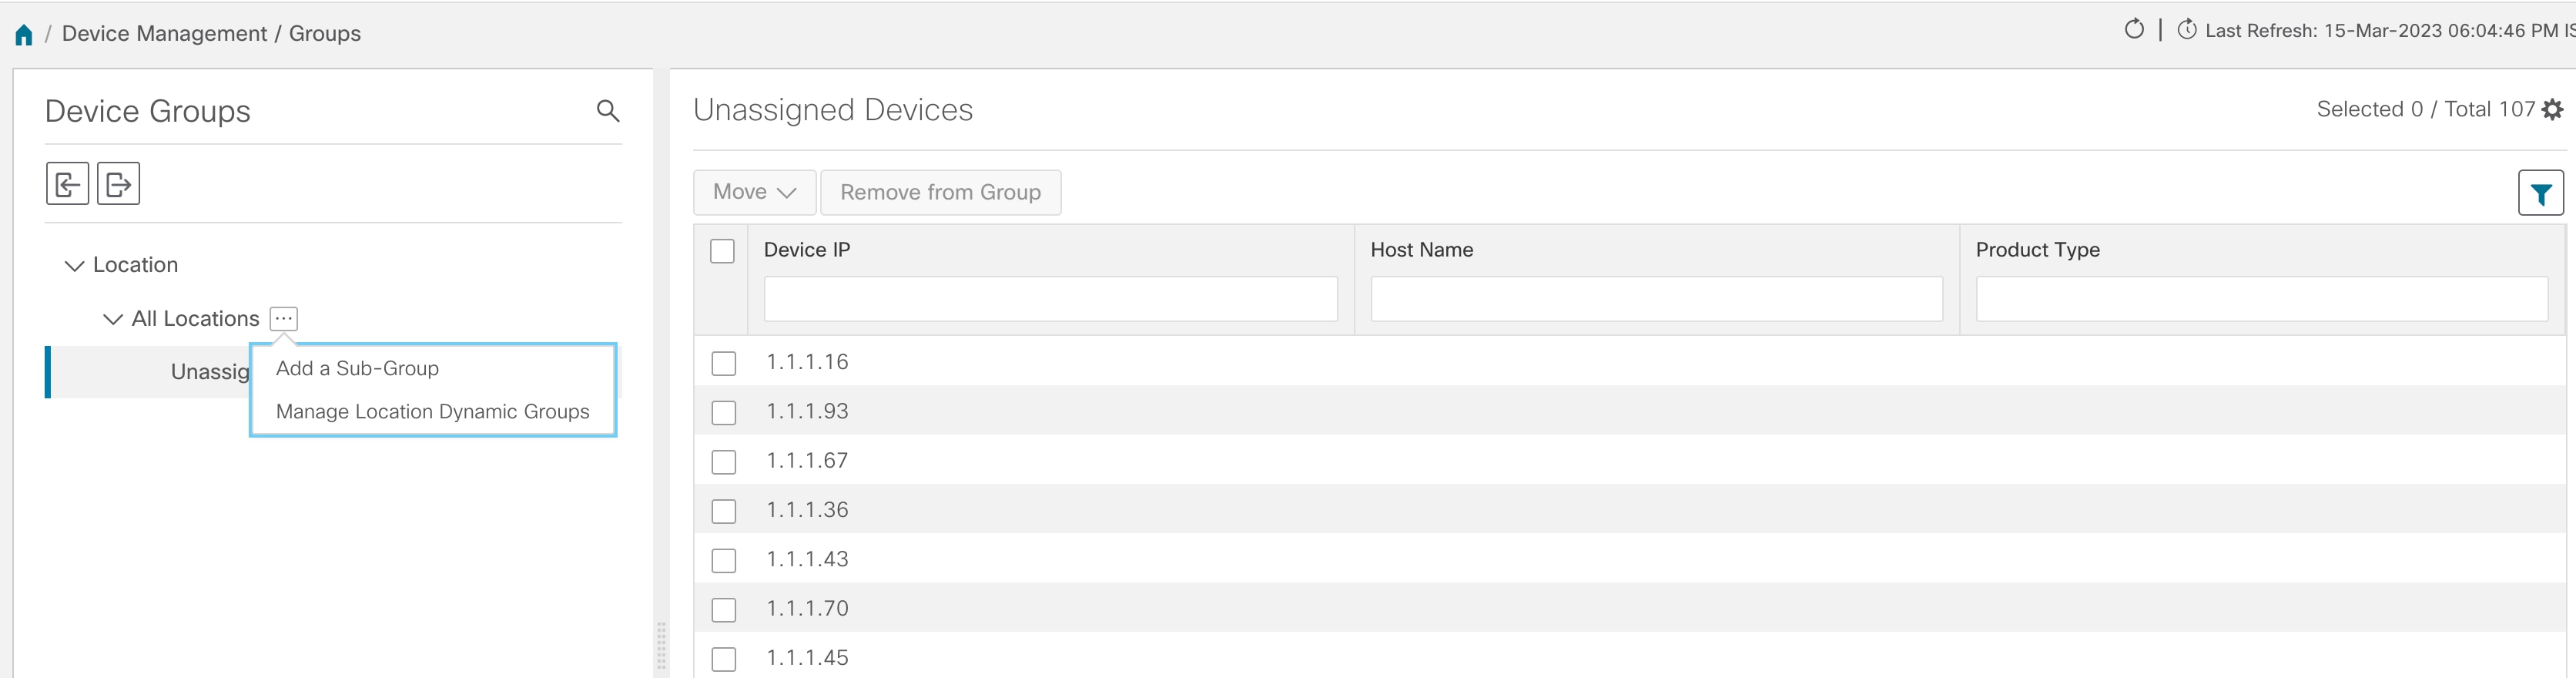
Device Groups: From the drop-down list, click the group of devices you want displayed on the map. All other device groups will be hidden.

3

Show Hide: From the drop-down list, click the network layers you want displayed on the map. All devices and links that belong to the selected layers are then displayed. By default, all layers are displayed.

4

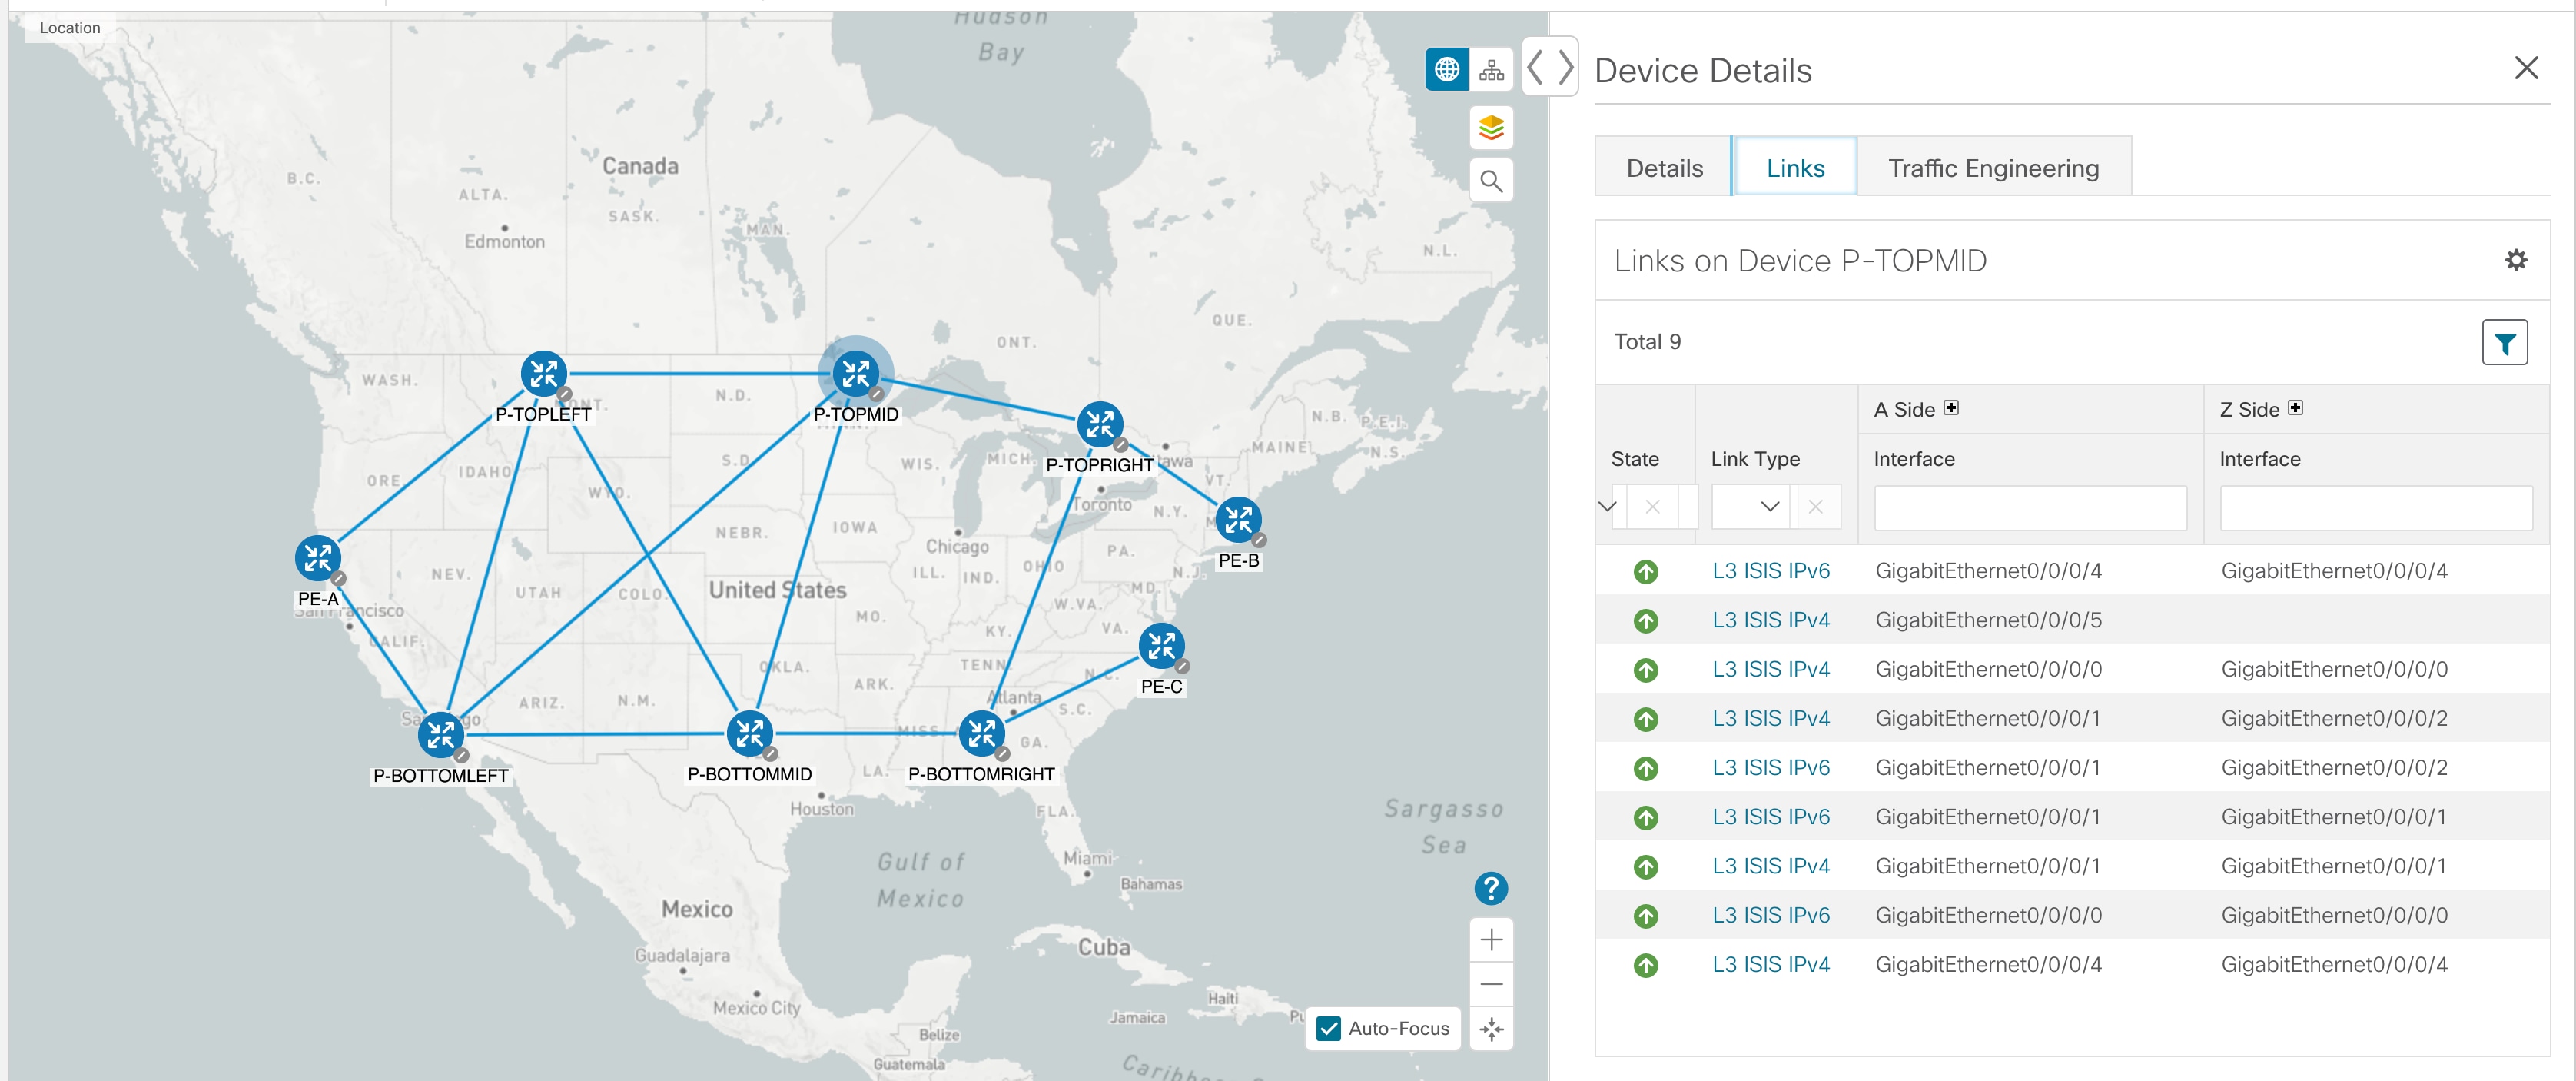
Topology Map: The network topology can be displayed on a logical map or a geographical map, where the devices and links are shown in their geographic context. From the map, you can drill down to get detailed information about devices and links.

Devices:

  • To view a device configuration summary, hover the mouse pointer over the device icon. A pop up window displaying the host name, state, node ID, and device type appears.

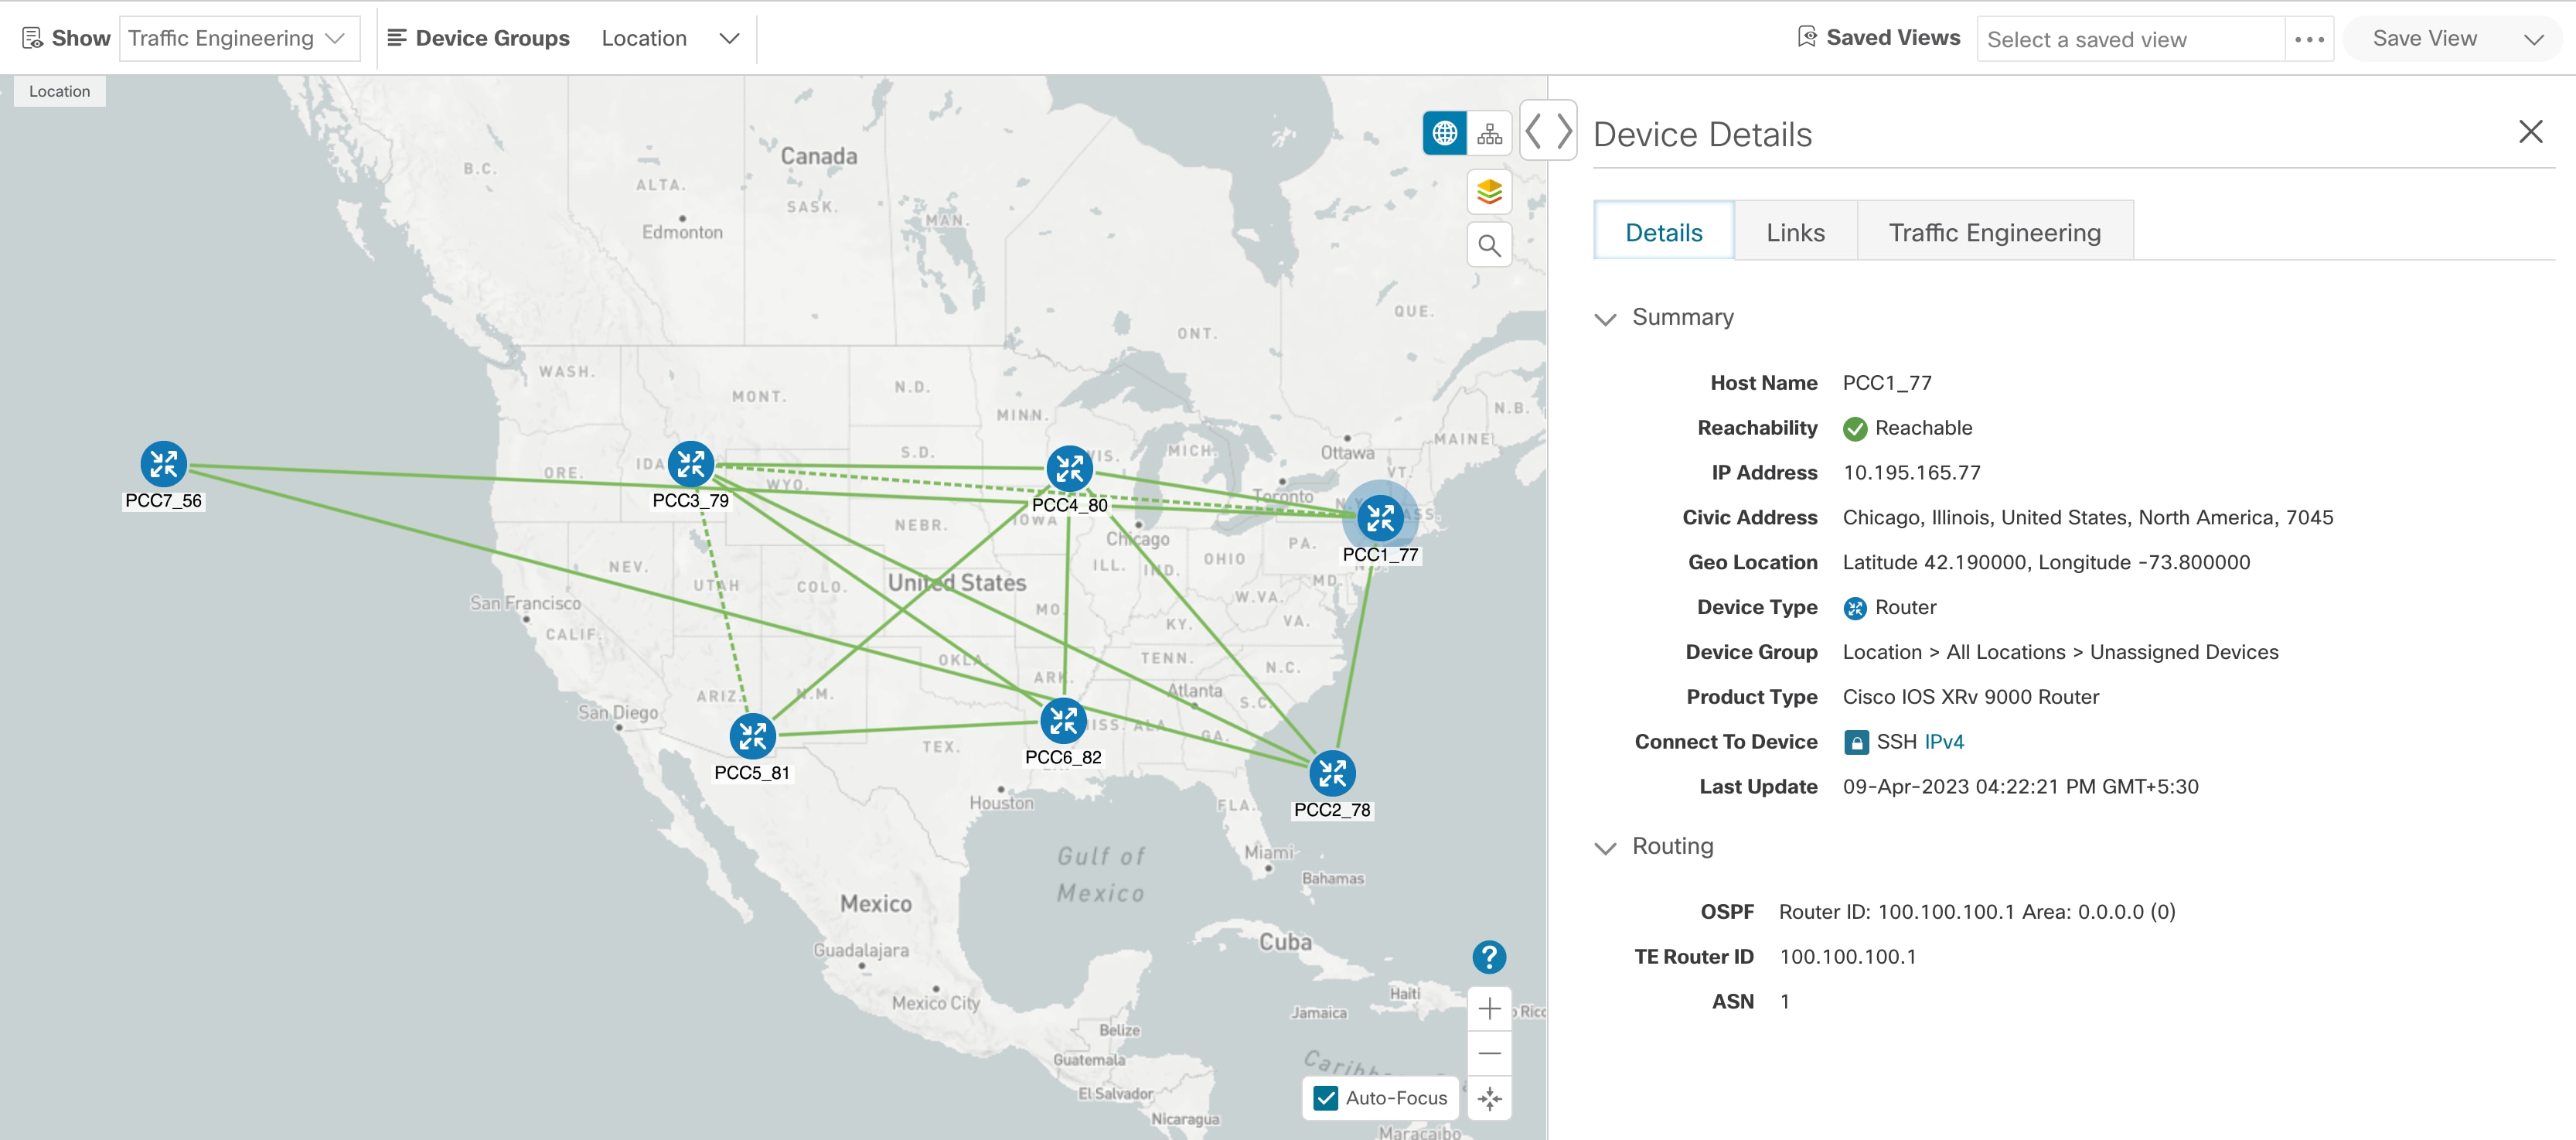
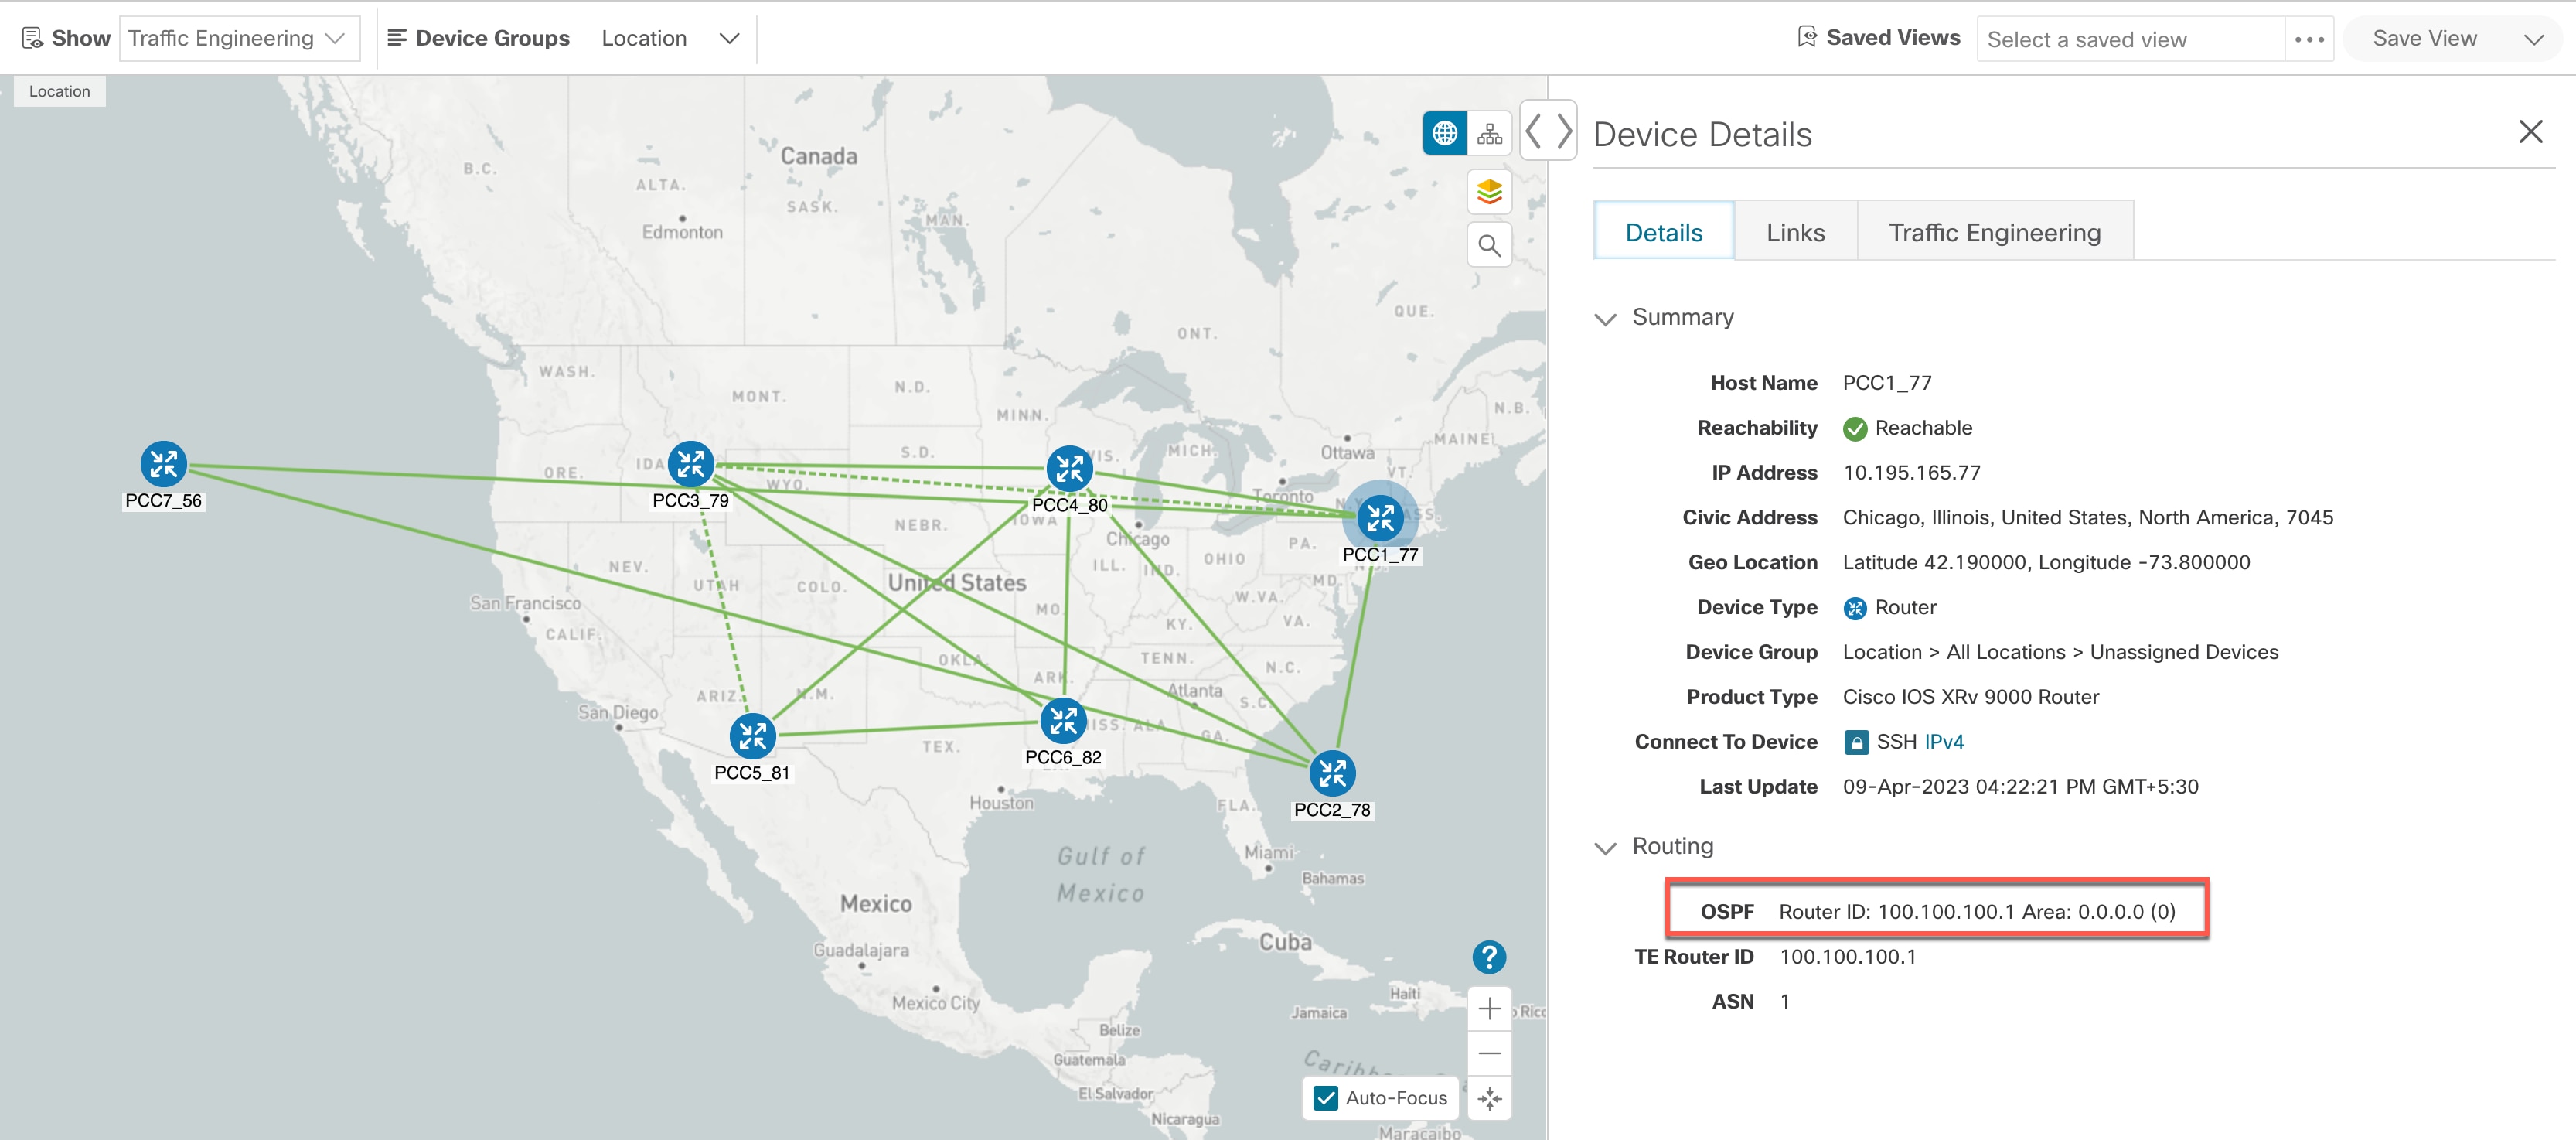
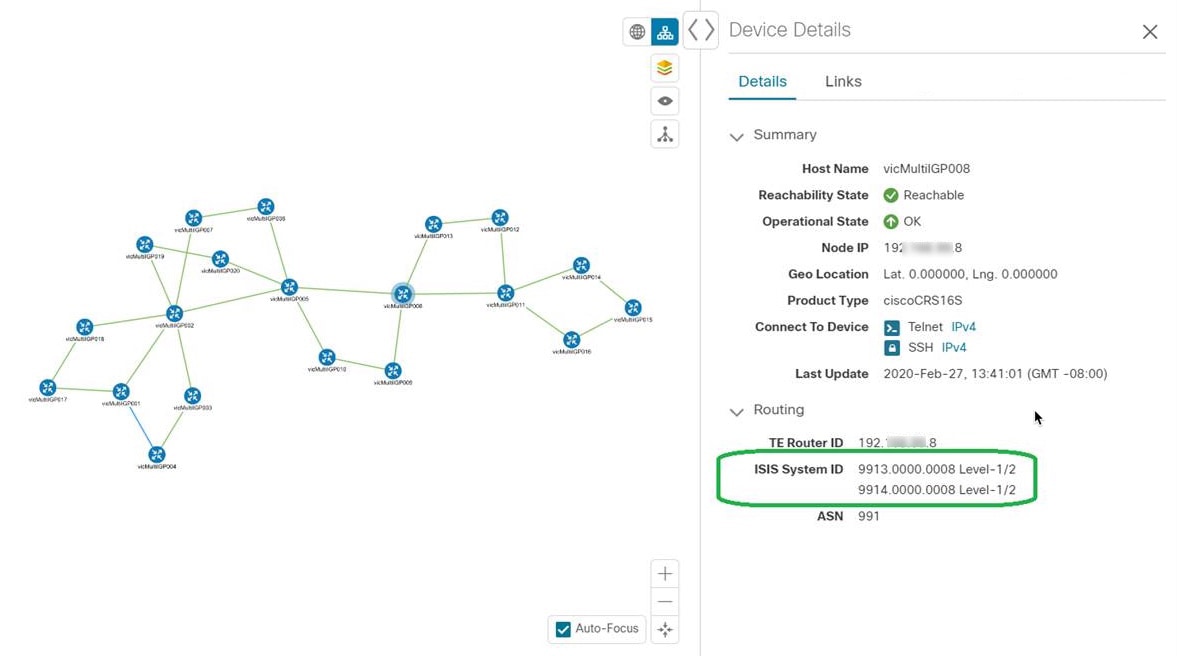
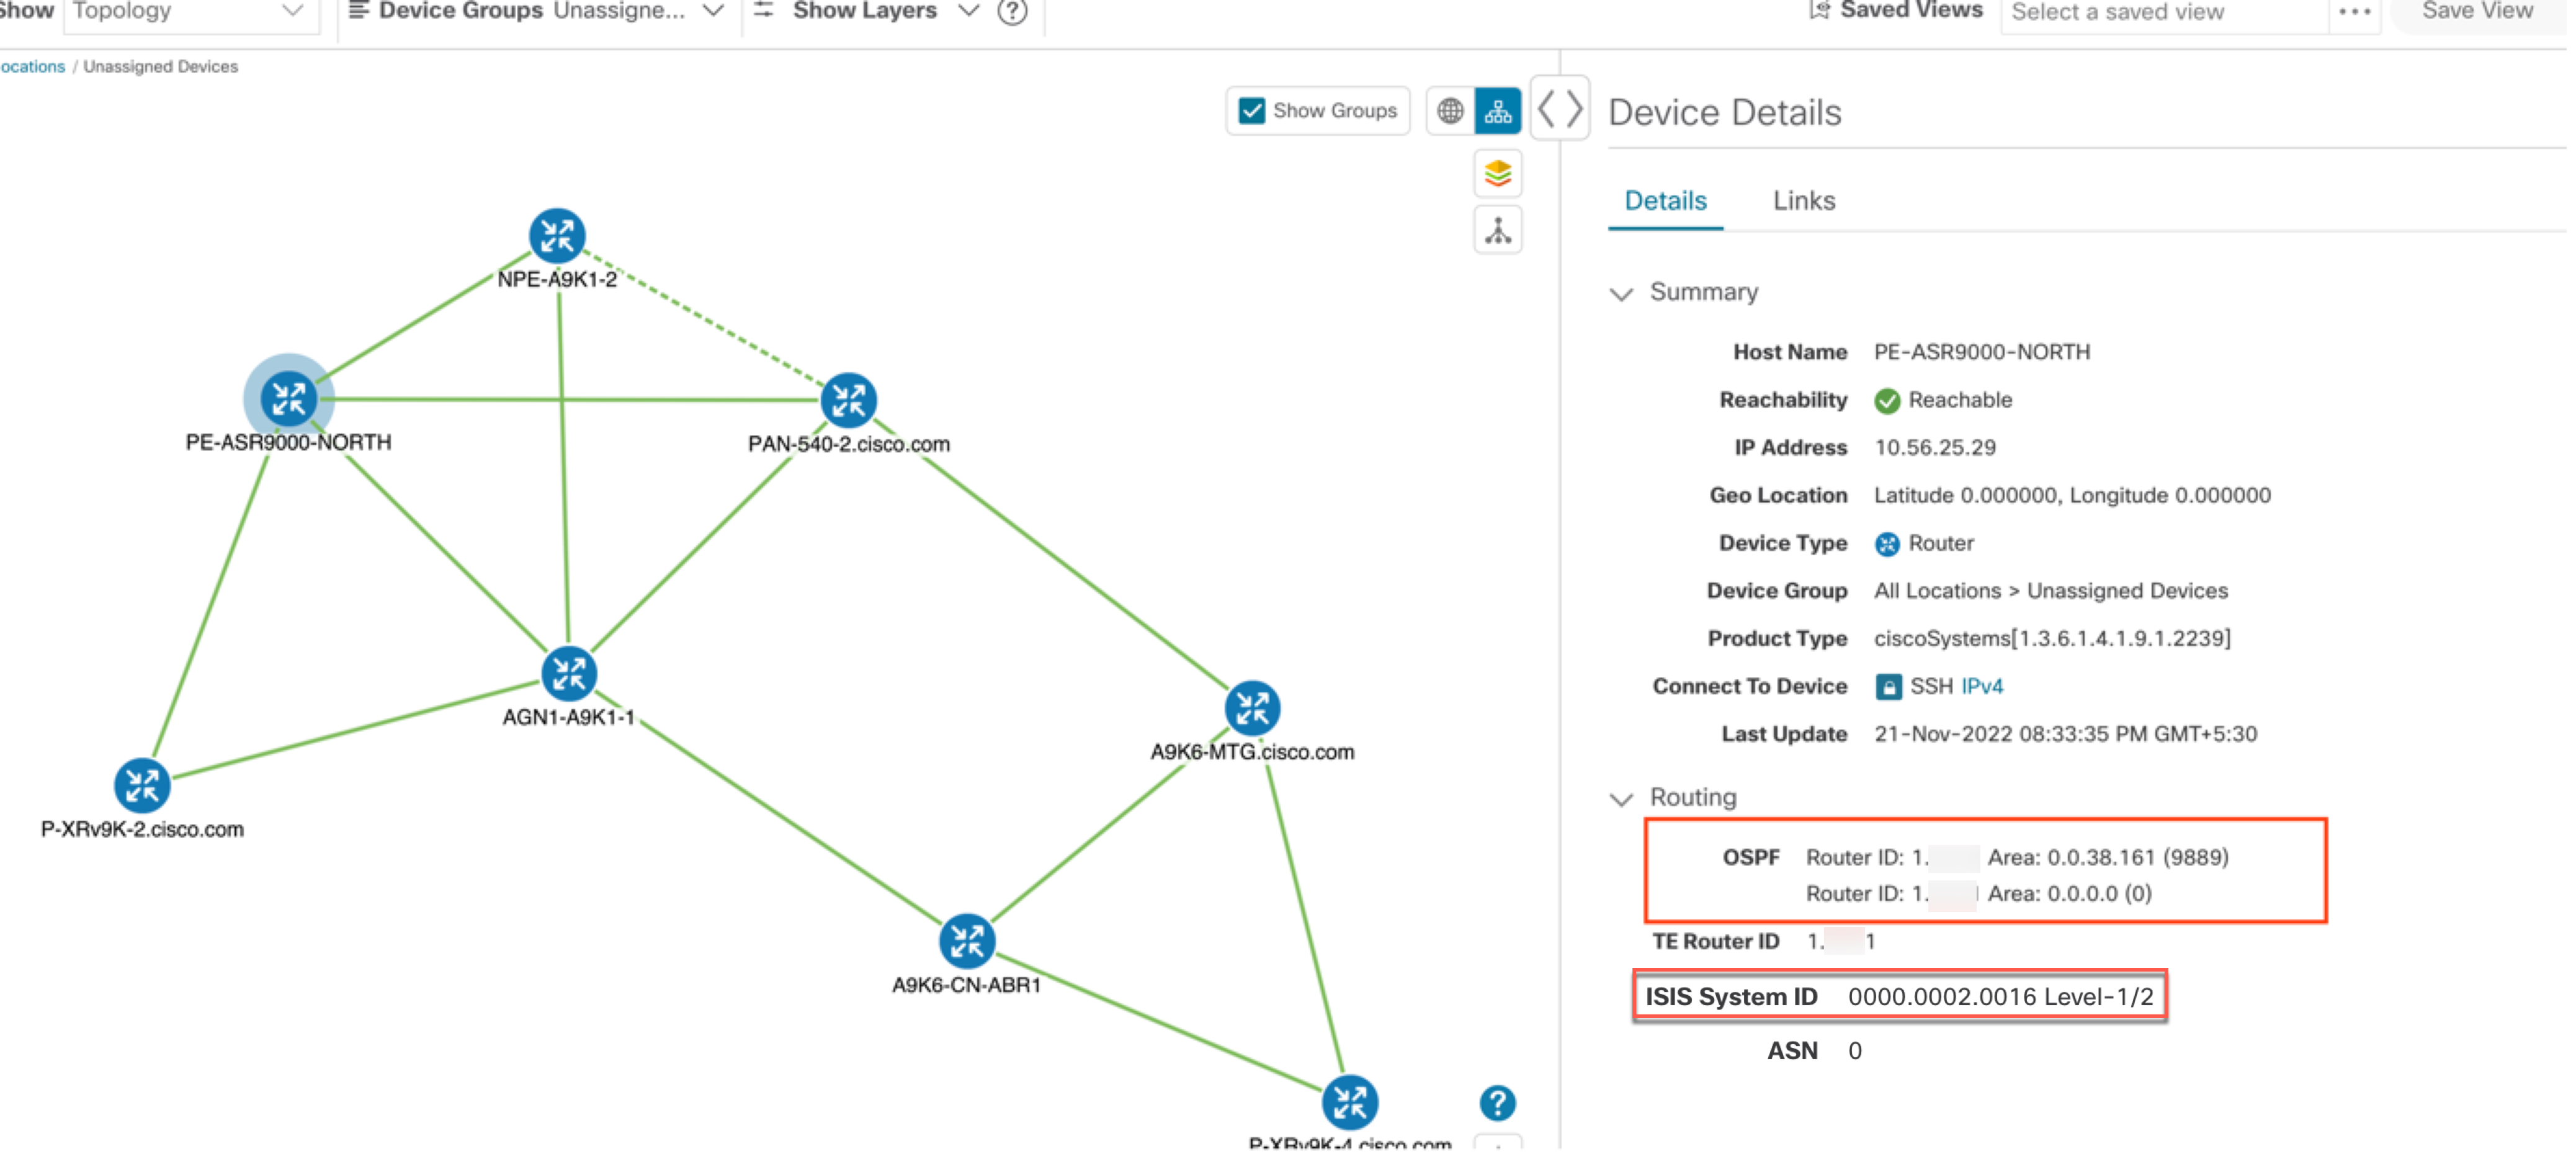
  • To view device details, click on the device icon.

  • If devices are in close physical proximity, the geographical map shows them as a cluster. The number in a blue circle (Node ID) indicates the number of devices in the cluster. Displaying devices in this manner helps prevent overlap and clutter on the map.

Links:

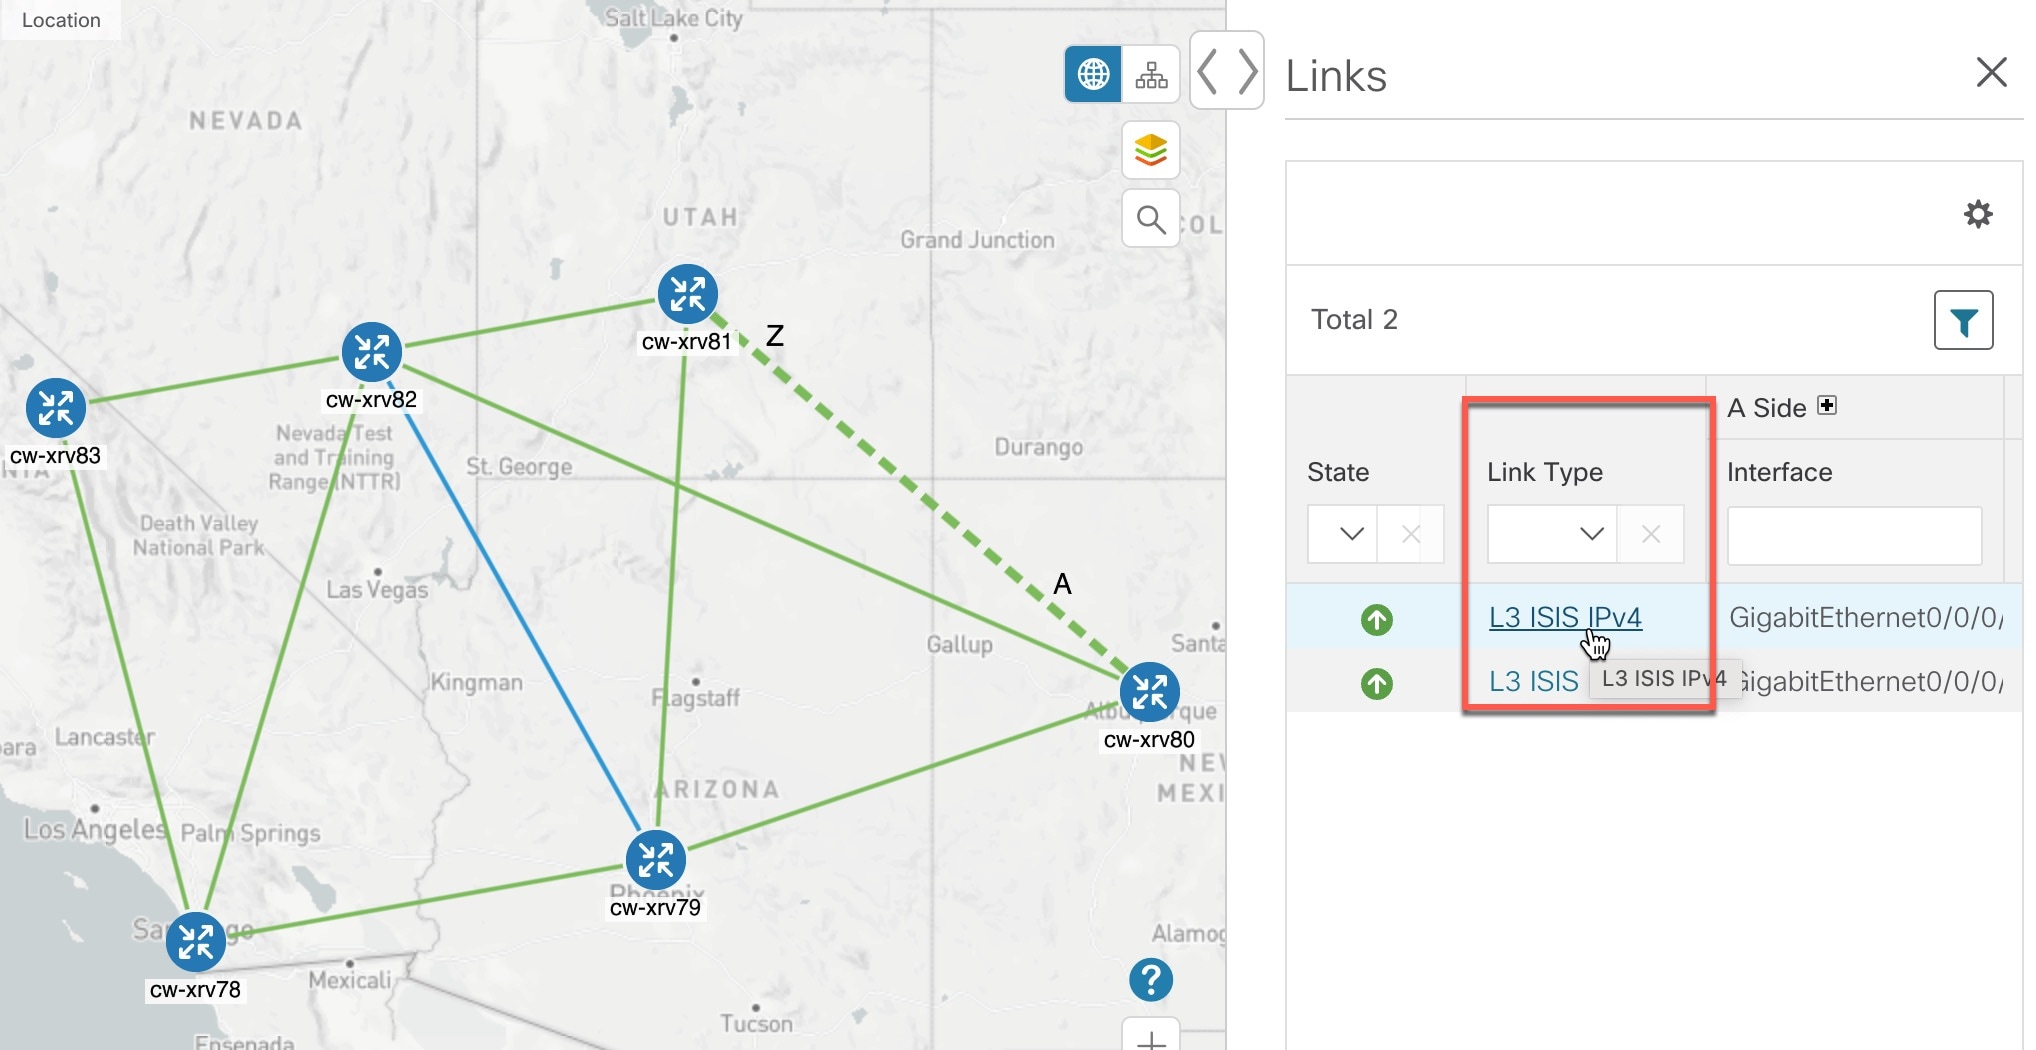
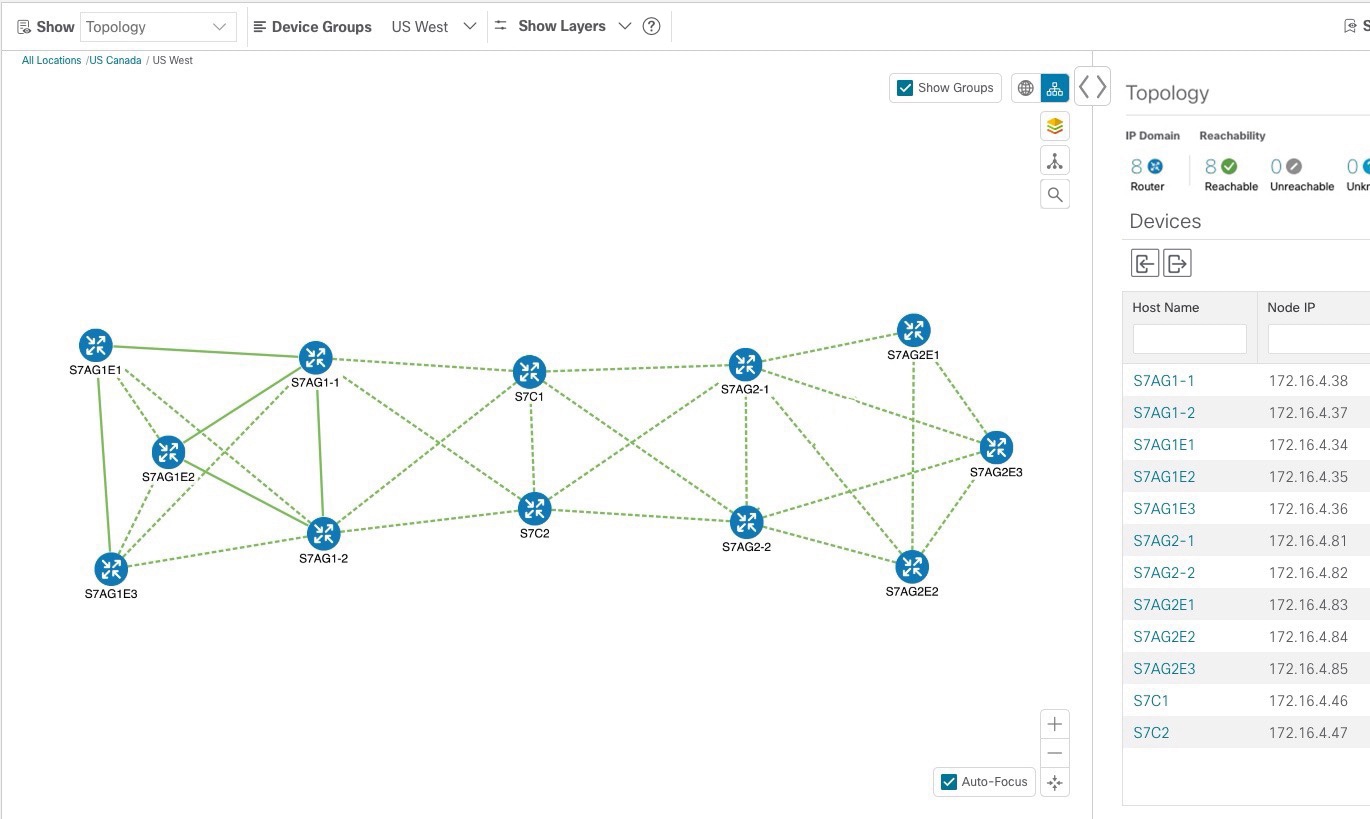
  • A solid line indicates a single link between two devices. If there is more than one link between two devices, or between a device and a cluster of devices, the line is shown dashed instead. A dashed line indicates an aggregated link that represents more than one link, or the use of multiple protocols (for example, IPv4 and IPv6) on the same physical link.

  • A and Z indicates headend and endpoint, respectively.

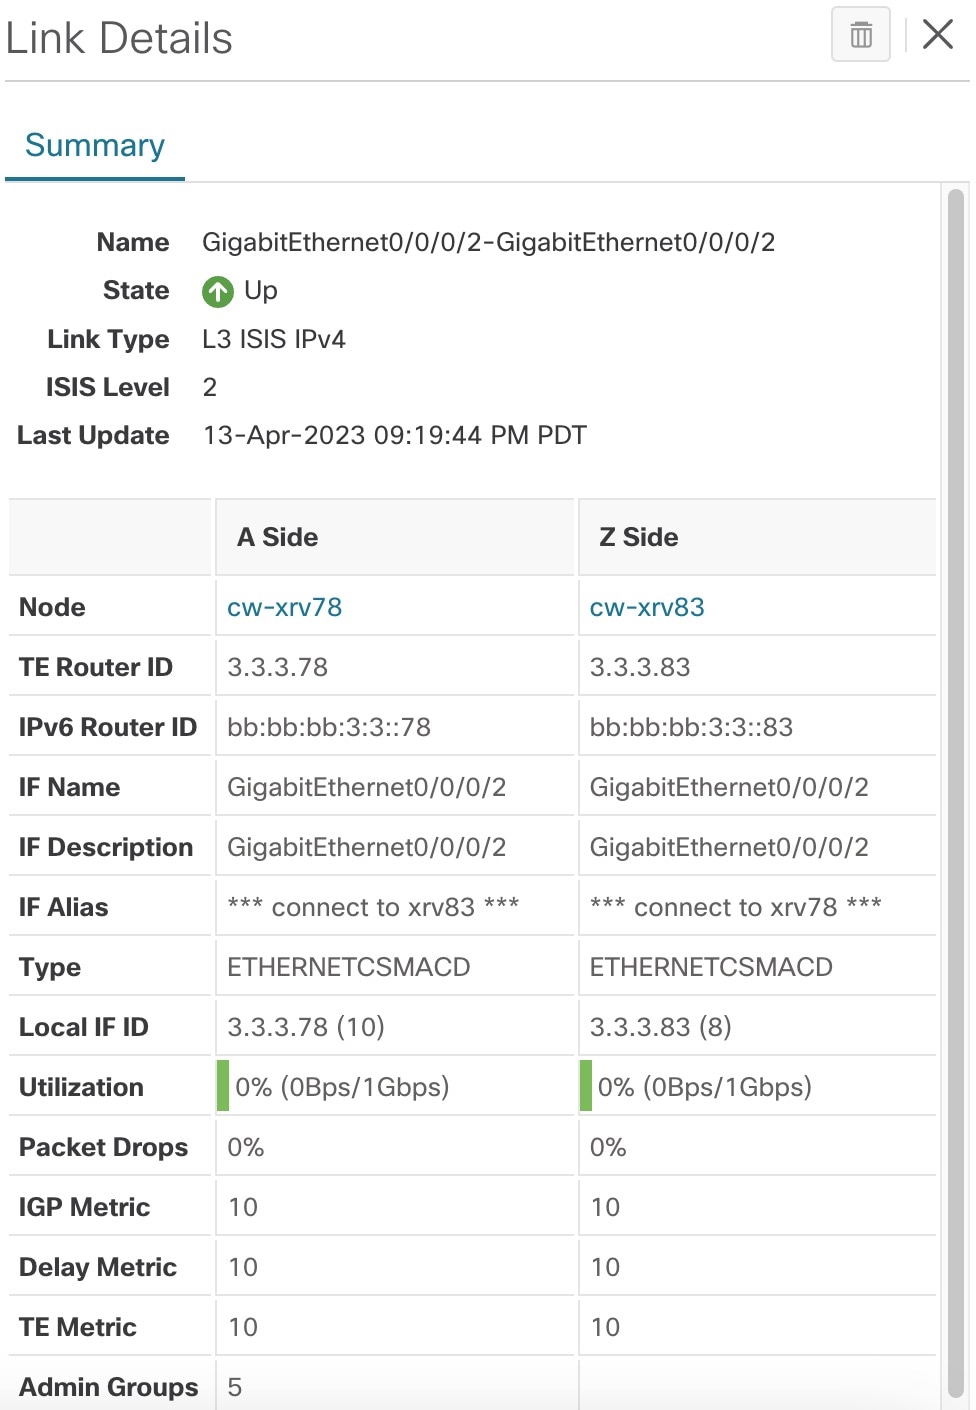
  • To view link information details, click on the link.

Note


Although aggregated, dual stack links show as one single line.

5

Logical View icon
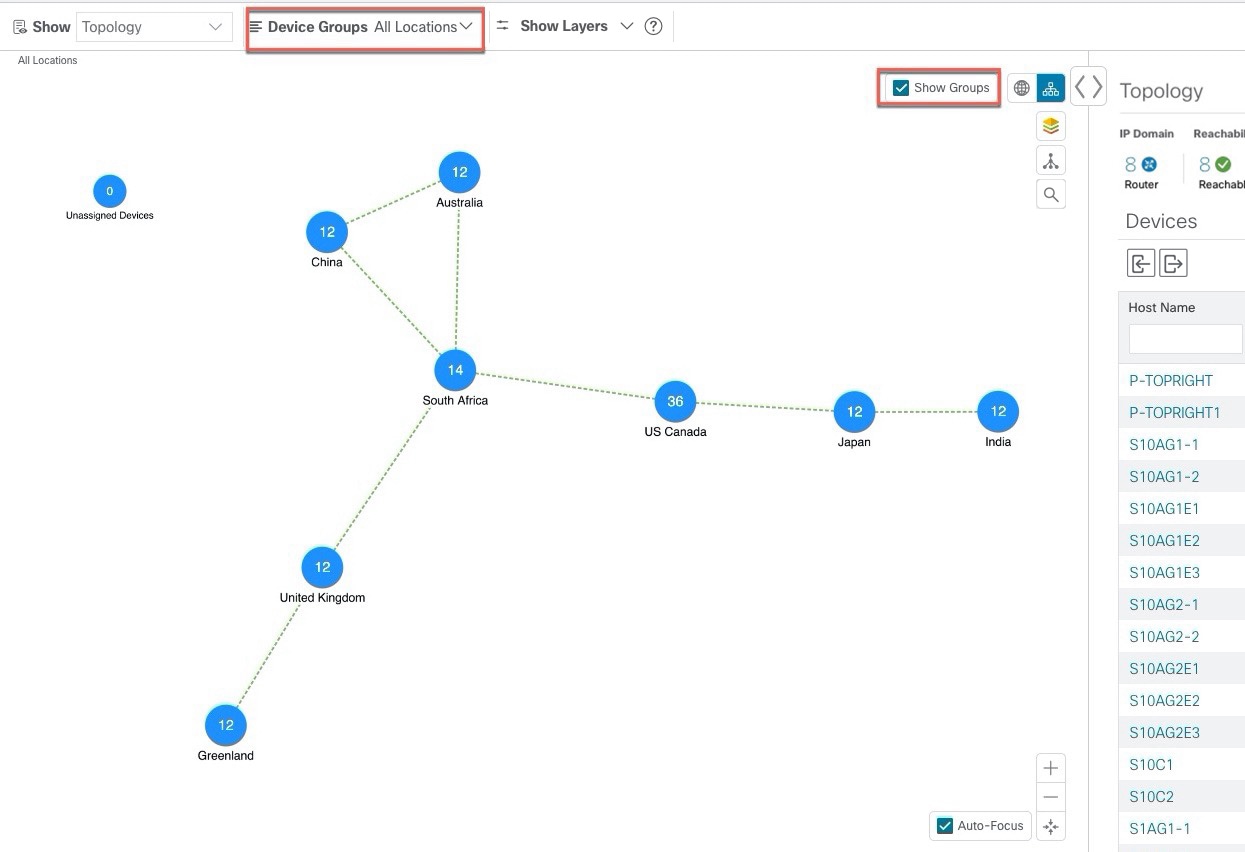
: The logical map shows devices and their links, positioned according to an automatic layout algorithm, ignoring their geographical location. You can change the layout algorithm.

Geographical View icon: The geographical map shows single devices, device clusters, links, and tunnels, superimposed on a map of the world. Each device location on the map reflects the device's GPS coordinates (longitude and latitude) as defined in the device inventory.

Display Preferences icon
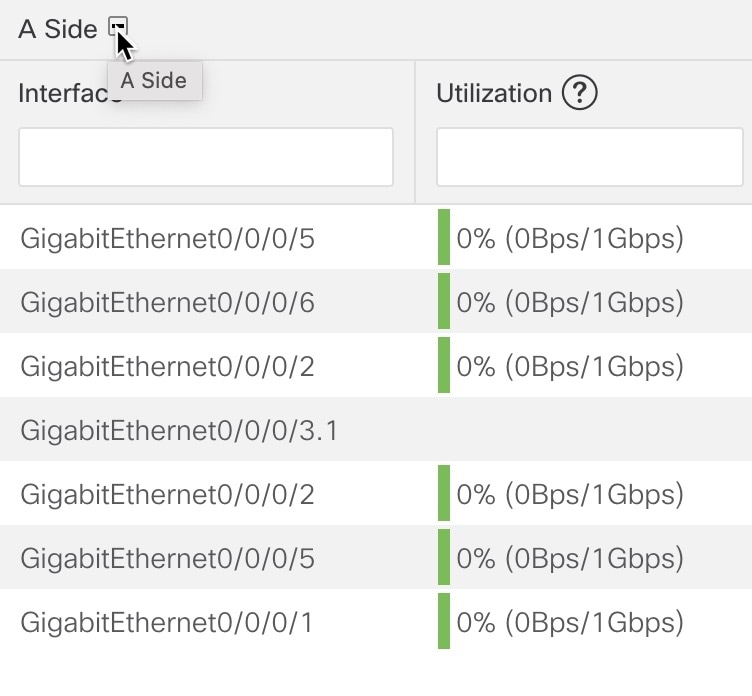
: The Display Preferences window allows you to change display settings for devices, links, utilization, Flexible Algorithms, and TE tunnel metrics.

Search Icon: The global search allows you to search the topology using device names, location or the device civic location.

Export icon: Export to KML allows you to export the geo localised objects using a KML format. KML is an XML base file format used to display information in a geographic context, such as Google Earth.

6

Expand/Collapse/Hide Side Panel: Expand or collapse the contents of the side panel. Close the side panel to get a larger view of the topology map.

7

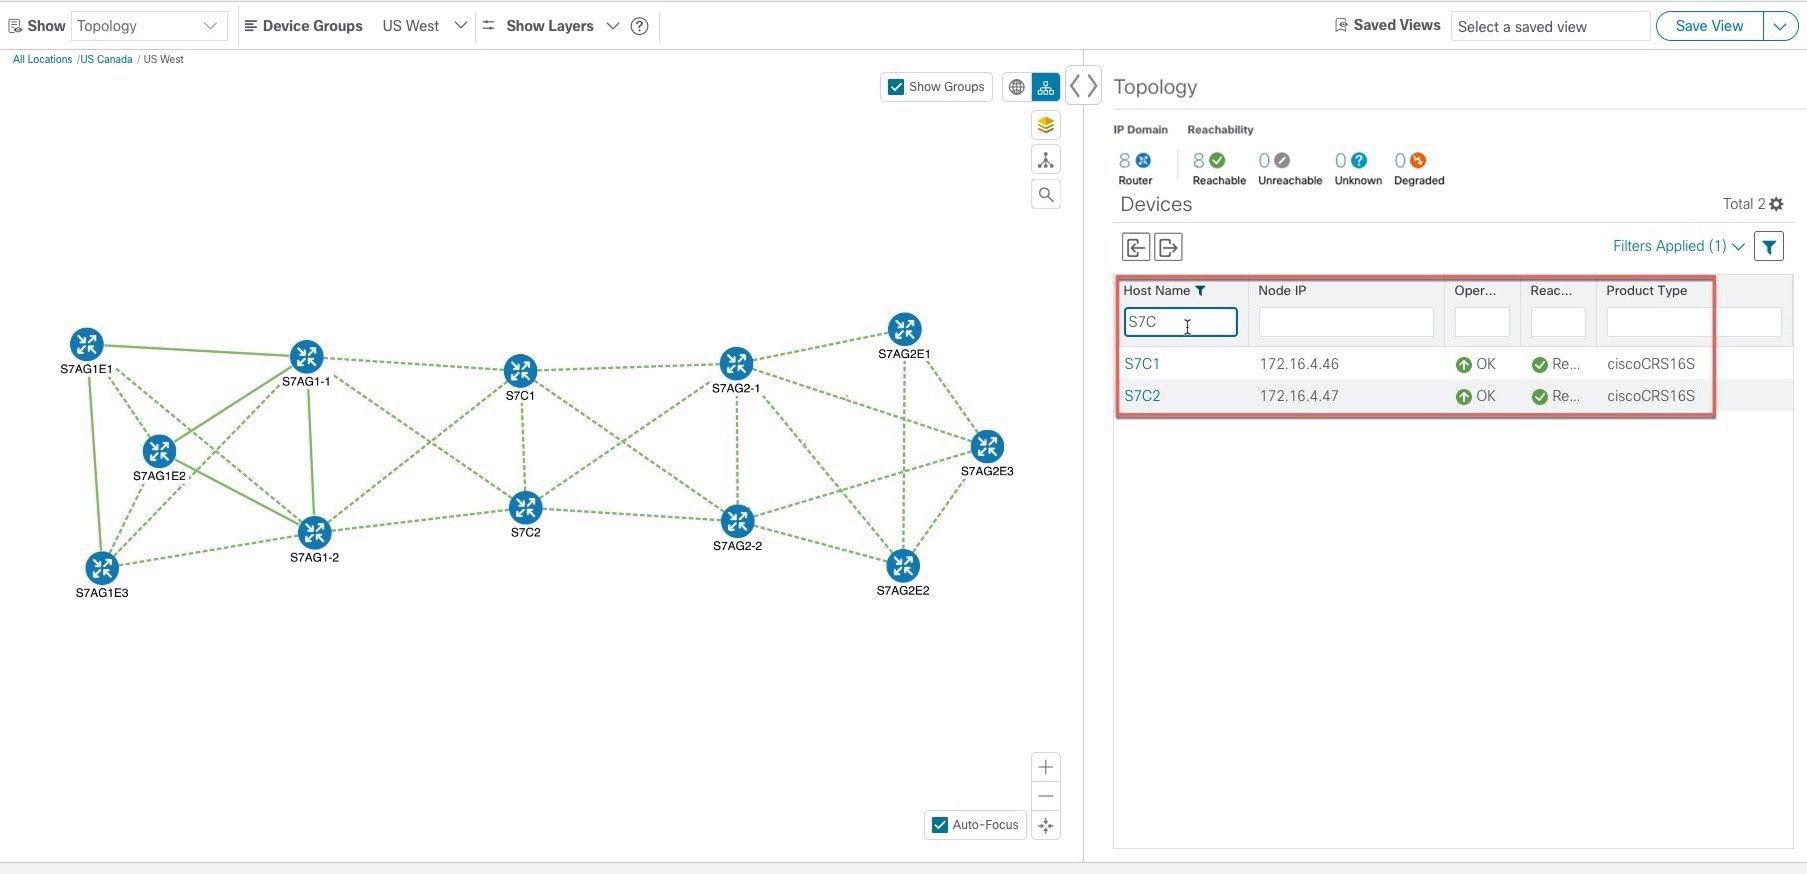
The Mini Dashboard provides a summary of the IP Domain and device reachability status. If filters are applied, the Mini Dashboard is updated to reflect what is displayed in the Devices table.

Note


If the Alarm Status feature is enabled, you will also see Alarm information here. To view the Alarm Status, you must install Element Management Functions (part of the Crosswork Network Controller Essentials package) and configure host information for Syslog and SNMP traps on the devices you want to view alarms for. For more information, see the Cisco Crosswork Network Controller Installation Guide and the Cisco Crosswork Network Controller Administration Guide. The Alarm Status feature is available for select licensing packages.

8

The content of this window changes depending on what applications you have installed, what Show is set to for the Topology Map and if you have selected to view more information on the device, link, SR-MPLS policy, SRv6 policy, or RSVP-TE tunnel..

9

Saved Custom Map Views: Lets you create a named custom view using the settings and layout for your current map, settings of the tables saved in the saved views, or display a custom view you have created previously. It also saves any filters applied to the Devices and Traffic Engineering tables.

View Device Details

This example shows how you can view device using the topology map.


Note


If you are viewing the HTML version of this guide, click on the images to view them in full-size.


Procedure


Step 1

From the main menu choose Topology or Traffic Engineering > Traffic Engineering.

Step 2

To quickly view the host name, reachability state, IP address and type of device, hover the mouse over the device icon.

More Device Details

Step 3

To view more device details, click on the device icon.

  1. The following examples show the Device details from the Topology map.

    More Device Details

    Note


    If the Alarm Status feature is enabled, you will also see Alarm information here. To view the Alarm Status, you must install Element Management Functions (part of the Crosswork Network Controller Essentials package) and configure host information for Syslog and SNMP traps on the devices you want to view alarms for. For more information, see the Cisco Crosswork Network Controller Installation Guide and the Cisco Crosswork Network Controller Administration Guide. The Alarm Status feature is available for select licensing packages.

    In a multiple IGP setup, you can also view all the IGP, IS-IS, and OSPF processes in the Routing details. See the following examples:

    Figure 3. Multiple IGP: OSPF Processes
    More Device Details
    Figure 4. Multiple IGP: ISIS Processes
    Multiple IGP: ISIS Processes
    Figure 5. Multiple IGP: OSPF and ISIS Processes
    Multiple IGP: OSPF and ISIS Processes
  2. The following example shows additional Traffic Engineering Device details (SR-MPLS, SRv6, RSVP-TE, and Flexible Algorithm tabs) from the Traffic Engineering map. In this particular example, SRv6 Locators are listed for two domains.

    More Device Details

Step 4

To view links on the device, click the Links tab and expand the right panel to see all the link details.

Traffic Engineering Details

Step 5

To view interface utilization, expand A side or Z side.

The utilization shown on IPv4 and IPv6 links represents the aggregate traffic on the interface, not specific to each address family. Sub-interfaces will not show a utilization since they do not have a bandwidth like a physical interface. Traffic measurements will still be collected and displayed.


Interface Utilization

View Link Details

This example describes how you can view the following information:

  • Link details (name, state, type, and endpoint interface information)

  • Members of an aggregate link

  • IPv4 unnumbered interfaces information (when available) is now displayed as either an index or a combination of the TE Router ID and the index in device, link, and topology details.

  • Link Aggregation Group (LAG) details

Procedure


Step 1

From the main menu choose Topology or Traffic Engineering > Traffic Engineering.

Step 2

View link details.

Click a link on the topology map.


Link Details

Step 3

View aggregate link details.

Click on a dashed line. A dashed line indicates an aggregated link that represents more than one link.

Note


Dual stack links (although aggregate) are shown as one single line.

  1. Under the Link Type column, click the link entry to see the link's details.


    Aggregate Links

Step 4

View IPv4 unnumbered interface information (if available).

IPv4 unnumbered interfaces information is displayed as either an index or a combination of the TE Router ID and the index.


IPv4 unnumbered interface

Step 5

View LAG details

To view different bundle members and member details in a Link Aggregation Group (LAG), confirm that LAG discovery is enabled (Administration > Settings > System Settings tab > Discovery > LAG checkbox):

Note


It takes a few minutes for LAG collection to complete after LAG discovery is enabled.

  1. Click on a LAG link. For example:

  2. Click the Members tab. In this example, only one link is displayed.

  3. Click the LAG member link.


Protocols Used for Topology Services

The following table lists the protocols and methods used for obtaining information.

Protocol/Method Provides Use Cases

IGP/ BGP-LS (via SR-PCE)

Real time topology (Nodes, links, link metrics, and so on.)

L3 topology visualization

PCEP(via SR-PCE)

Real time LSP status and CRUD of SR-PCE initiated LSPs

  • SR/SRv6, RSVP-TE LSP visualization

  • SR-PCE initiated LSP Create/Update/Delete

SNMP(SNMPv2-MIB, IP-MIB, IF-MIB, LLDP-MIB, (CISCO CDB-MIB)(via CDG)

System info, Interface Table (interface and SR-TE/RSVP-TE traffic Utilization) IP Address Table, L2 adjacency information

Device management and details and Crosswork Optimization Engine model building:

  • L2/L3 Topology

  • Interface name, Admin/Oper Status

  • Interface and SR policy and RSVP-TE tunnel utilization

Crosswork Optimization Engine model simulation:

  • IGP/LSP path simulation

  • Bandwidth use cases (for feature packs)

CLI (via CDG) -'show mpls

TE Router ID and so on.

To match the DLM node with the same TE Router ID that is learned from the SR-PCE

Customize Map Display Settings

You can configure visual settings on the topology map based on your needs and preferences. You can do the following:

Customize the Display of Links and Devices

To set device and link map display preferences, choose Topology and click Display Preferences icon on the topology map.

  • Click Links to show aggregated links and how links should be colored so that you can easily see their state and utilization status. By default, aggregated links will be differentiated from single links on the map and links will be colored based on link utilization thresholds. Administrators can change the utilization thresholds and their corresponding colors.

  • Click Devices to show the device state and how the devices should be labeled. By default, the device state is shown on the map and the host name is used to label devices.

Use Device Groups to Filter Your Topology View

To help you identify, find, and group devices for a variety of purposes, you can create device groups. The device group window (Device Management > Groups) displays all devices and the device groups to which they belong. By default, all devices initially appear in the Unassigned Devices group.

To demonstrate the grouping and filtering functions, we have built an environment with devices distributed globally. You can sub-group the devices based on regions. For this example, we have a sub-group called US West.

Procedure


Step 1

View devices on the geographical map:

  1. From the main menu, choose Topology.

    Note

     
    Devices without a geo-location appear in the Devices table only. To display these devices on the map, provide their geographical coordinates in the Geo Location column.
    All Devices
  2. From the Device Group drop-down list, select a group (US West). Only the devices in that group and related links are displayed on the geographical map. The Devices table has also been filtered to list only those devices in the group.

    Device Group Devices

Step 2

View devices on the logical map:

  1. From the main menu, choose Topology.

  2. Click Logical View icon.

  3. From the Device Group drop-down list, select All Locations and check Show Groups if it is not already checked. You can see all device groups in this view. Device groups can be seen in this way only within the logical map.

    Logical Map All Location
  4. From the Device Group drop-down list, select a group (US West). Devices that belong to this group are shown in the topology map and the Devices table.

  5. Filter devices in the Device table by entering the partial host name or IP address in the text box (for example, S7C is entered in the Host Name text box for the current configuration). The Device table displays only devices that match the filtering criteria. However, filtering the Device table does not filter the devices visually on the topology map. To visually filter devices on the geographical or logical maps is to use device groups.

    Note


    You can also double click on the device in the list to recenter the selected device on the geographical or logical maps.


Create and Modify Device Groups

You can create device groups and devices to the groups either manually (as described in this section) or automatically, as described in Enable Dynamic Device Grouping. A device can belong to only one device group.
Procedure

Step 1

From the main menu choose Device Management > Groups.

Step 2

To add a new sub-group, click next to All Locations.

A new sub-group is added under All Locations.

Step 3

To add a device to a group, from the right-pane, under Unassigned Devices, select a device.

Step 4

From the Move to Group drop-down, select the appropriate group and click Move.

Device Group Selector

Step 5

To delete from a group, click Remove from Group. If you delete a group, all devices that belong to that group are moved to the Unassigned Devices group. Also, deleting a group deletes all the sub-groups under it.

Step 6

Click Save.


Enable Dynamic Device Grouping

You can create a rule to dynamically create device groups and automatically add unassigned devices to these groups using a Regular Expression (regex) on the device hostname. Any newly added or discovered devices that match the rule will be placed in the appropriate group.

Dynamic rules do not apply to devices that already belong to groups. You must move them to Unassigned Devices if you want them to be considered by the rule.

Before you begin

While you can follow examples given in the Dynamic Groups dialog, it is helpful to be familiar with Regular Expressions.

Procedure

Step 1

From the main menu choose Device Management > Groups.

Step 2

Click next to All Locations > Manage Location Dynamic Groups.

Step 3

Click Show more details and examples to help you fill out the required Host Name and Group Name fields.

Step 4

If there are any existing devices in the Unassigned Devices group, click Test Rule to view a sampling of what type of group names will be created.

Step 5

Turn the Enable Rule toggle ON to enable the rule. After the rule is enabled, the system checks for unassigned devices every minute and will assign them to the appropriate group based on the rule.

Step 6

Click Save.

Step 7

Groups that are created this way initially appear under Unassigned Groups (created when a rule is enabled for the first time). Move newly created groups to the desired group hierarchy.

Step 8

To move newly created Unassigned groups to the correct group, do the following:

  1. Click next to All Locations and click Add a Sub-Group.

  2. Enter the New Group details and click Create.

  3. Click on the unassigned devices from the left pane.

  4. From the right pane, select the devices you want to move and click Move to Group to move to an appropriate group.


Save Topology Views for Easy Access

When you rearrange the devices and links on a map, your changes are not normally saved. To easily access a useful map layout, you can save it as a named custom view and quickly retrieve it, without having to rearrange the map each time. This is especially useful when managing large networks with many devices.

When you save a custom view, the following settings will be saved:

  • Whether it is a geographical or logical map.

  • Device positions in the logical map layout.

  • Device and link display settings

  • Any filters used in the Device and Traffic Engineering tables

All custom views can be seen by all users. However, only users with the admin role or users that created the custom view can modify the view.

Procedure


Step 1

Customize the current map view until it contains just the information you want and the layout meets your needs.

Step 2

When you have the view the way you want it, click Save View.

Step 3

Enter a unique name for the new custom view and click Save. You can later modify the view (click Select a saved view) and choose to edit the topology, rename, or delete the view.