SR Policies Topology Map
To get to the topology map, choose Optimization Engine from the left navigation bar, and click SR Policies.
For information on topology issues, or using the map to get information about devices and links, see Network Topology Map and Troubleshoot Network Topology Map.
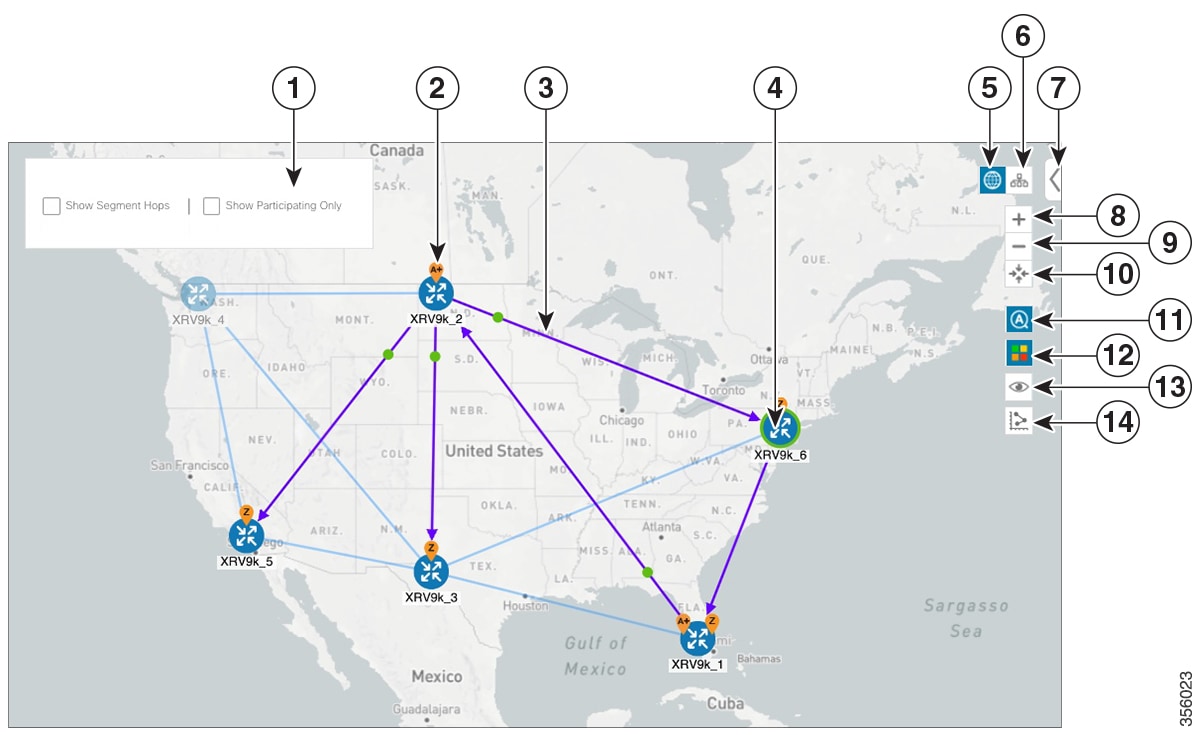
The following figure shows the topology map with SR policies highlighted. See the Visualize SR Policies Example for information on how to select SR policies so that they appear on the topology map/
| Callout No. | Description | |
|---|---|---|
|
1 |
Click the appropriate check box to enable the following options:
|
|
|
2 |
SR Policy Origin and Destination: If both A and Z are displayed in a device cluster, at least one node in the cluster is a source and another is a destination. The A+ denotes that there is more than one policy that originates from a node. The Z+ denotes that the node is a destination for more than one policy. |
|
|
3 |
SR Policies: When SR policies are selected from the SR Policies Table, they show as purple directional lines on the map indicating source and destination. An adjacency segment ID (SID) is shown as a green dot on a link along the path ( |
|
|
4 |
A device or device cluster with a green outline ( |
|
|
5 |
Geographical Map: Click this icon to view the geographical map. The geographical map shows single devices, device clusters, links, and SR policies, superimposed on a map of the world. Each device location on the map reflects the device's GPS coordinates (longitude and latitude) as defined in the device inventory. |
|
|
6 |
Logical Map: Click this icon to toggle from the geographical map to the logical map. The logical map shows devices and their links, positioned according to an automatic layout algorithm, ignoring their geographical location. You can change the layout algorithm; see Change the Layout of a Logical Map. The logical map displays up to 5000 devices and never displays devices in clusters. If you drill down to the logical map from a geographical cluster at the maximum zoom level, the logical map shows devices that are located in the same location. See Identify the Members of a Cluster. |
|
|
7 |
Expand/Collapse/Hide Side Panel: Expand or collapse the side panel to see the full and truncated versions of the right-side panel. Close the side panel to get a larger view of the topology map. |
|
|
8 |
Zoom In: Click this icon to zoom in on the selected area; for example, to view clustered devices on the geographical map. |
|
|
9 |
Zoom Out: Click this icon to zoom out from a selection area. |
|
|
10 |
Zoom Fit: Lets you automatically scale the map to fit your zoom area. |
|
|
11 |
Auto Zoom: Zooms in on selected SR policies. This option is selected by default. If you uncheck this option, navigate away from the map, and later return to the map; it will revert to the default option. |
|
|
12 |
Bandwidth Utilization: Lets you enable or disable visualization of the bandwidth utilization for the mapped links. See Show Bandwidth Utilization for Links on the Map. This option is selected by default. If you uncheck this option, navigate away from the map, and later return to the map; it will revert to the default option. |
|
|
13 |
Custom Map View: Lets you create a named custom view using the settings and layout for your current map, or display a custom view you have created previously. See Create Custom Map Views. |
|
|
14 |
Metrics: Shows IGP, TE, or delay metrics for each link along the SR policy paths (see Show IGP, Delay, and Traffic Engineering Metrics). |
|


 ) the table or policy details (if in the


 .
.

 next to the segment hop you want to move.


 Feedback