Cisco Modeling Labs User Guide, Release 1.0.1
Bias-Free Language
The documentation set for this product strives to use bias-free language. For the purposes of this documentation set, bias-free is defined as language that does not imply discrimination based on age, disability, gender, racial identity, ethnic identity, sexual orientation, socioeconomic status, and intersectionality. Exceptions may be present in the documentation due to language that is hardcoded in the user interfaces of the product software, language used based on RFP documentation, or language that is used by a referenced third-party product. Learn more about how Cisco is using Inclusive Language.
- Updated:
- November 14, 2014
Chapter: Visualizing the Topology
Visualizing the Topology
Visualization Overview
 Note | Visualization is only available where node configurations are generated using parameters defined in AutoNetkit. |
The AutoNetkit visualization runs in a browser window, either within the Cisco Modeling Labs client or in a separate browser window. Ensure that you use a compatible browser, as described in the Cisco Modeling Labs Corporate Edition System Administrator Installation Guide, Release 1.0.1 and Cisco Modeling Labs Corporate Edition Client Installation Guide, Release 1.0.1 for the version of Cisco Modeling Labs that you are using.

| Identifier | Description |
|---|---|
| 1 | Layers view selection. The layers shown correspond to the values selected when generating the configuration. For example, if IGP is chosen as OSPF, an OSPF layer will be shown. If MPLS is not used in the configuration, no MPLS layer will be shown. |
| 2 | Pan and zoom controls. Use the controls to pan the topology, zoom in and out on the topology, adjust the display so that all the nodes are shown, and switch to a full-screen view. |
| 3 | Settings, search, and filter controls. Use the settings control to change the appearance of the display. Use the search and filter controls to highlight specific nodes and connections. |
During the visualization phase, you perform the tasks described in the following sections.
Enabling AutoNetkit Visualization (for Windows Users)
To enable visualization for the Cisco Modeling Labs client on Windows, complete the tasks described in this section.

Opening AutoNetkit Visualization
Complete the task of building nodes and interfaces.
| Step 1 | Generate a
configuration for the topology.
Click Update Router Configurations from the toolbar. Alternatively, from the menu bar, choose . | ||
| Step 2 | View the
configuration changes.
 | ||
| Step 3 | Display the
AutoNetkit Visualization view of the topology.
When you close
the comparison view, a notification prompts you whether or not to open the
AutoNetkit Visualization.


|
What to Do Next
Explore the features in AutoNetkit Visualization.
Using Layers
| Step 1 | Verify if
visualization is open in a browser window.
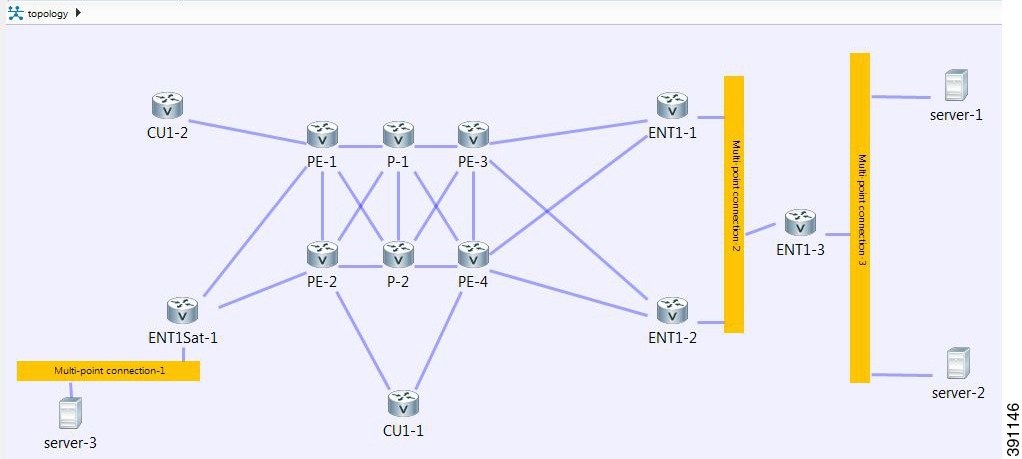
The initial
layer that is displayed in the browser window is the physical model of the
topology, as shown in the following figure. The physical model shows the nodes
and interface connections between the nodes. It is similar to the Cisco
Modeling Labs topology view.
| ||
| Step 2 | To select
another view, place the cursor over the
Layers view selection in the browser window. See
Visualization Overview for information on the
Layers view selection.
When you place
the cursor over the layers view, several choices appear. For example, selecting
ebgp_v4 will
show the IPv4 eBGP topology. This is constructed based on the AS property and
node connections created in the
Topology
Editor, as shown in the following figure.
 | ||
| Step 3 | Place the cursor
over one of the nodes.
This action
displays a pop-up view of information about that node. The type of information
displayed depends on the selected layer and node configuration.
 | ||
| Step 4 | Continue selecting layer views and observe how the protocol-centric view changes. In a complex topology, you can use the Layers views to verify that the protocols, nodes, and connections meet the design requirements. |
What to Do Next
-
(Optional) Change settings, use the Search feature, or use the Filter feature.
-
(Optional) Return to the design and build phases to modify the topology and generate new configurations and AutoNetkit Visualizations.
-
(Optional) Run the topology simulation when you are satisfied with your configuration.
Changing the Settings
| Step 1 | In the
AutoNetkit Visualization browser window, click
Settings.
The Settings
window opens, as shown in the following figure.

| ||||||||||||
| Step 2 | Observe the changes in the display when you select different settings. | ||||||||||||
| Step 3 | To close the Settings view, click the Settings tab. |
What to Do Next
Using Search
| Step 1 | In the
AutoNetkit Visualization browser window, click
Search.
The
Search window opens.

 | ||||||||
| Step 2 | Observe the visualization and how the different items are highlighted when they match the combination of Search nodes using and keywords that you enter. | ||||||||
| Step 3 | To close the Search window, click the Search tab. |
What to Do Next
Using Filters
| Step 1 | In the
AutoNetkit Visualization browser window, click
Filter.
The
Search window opens.

 | ||||||||
| Step 2 | To close the Filter window, click the Filter tab. |
What to Do Next
 Feedback