Cloud Connected Audio Service Provider Partner User Guide
Bias-Free Language
The documentation set for this product strives to use bias-free language. For the purposes of this documentation set, bias-free is defined as language that does not imply discrimination based on age, disability, gender, racial identity, ethnic identity, sexual orientation, socioeconomic status, and intersectionality. Exceptions may be present in the documentation due to language that is hardcoded in the user interfaces of the product software, language used based on RFP documentation, or language that is used by a referenced third-party product. Learn more about how Cisco is using Inclusive Language.
- Updated:
- December 12, 2016
Chapter: Customer Reports
Customer
Reports
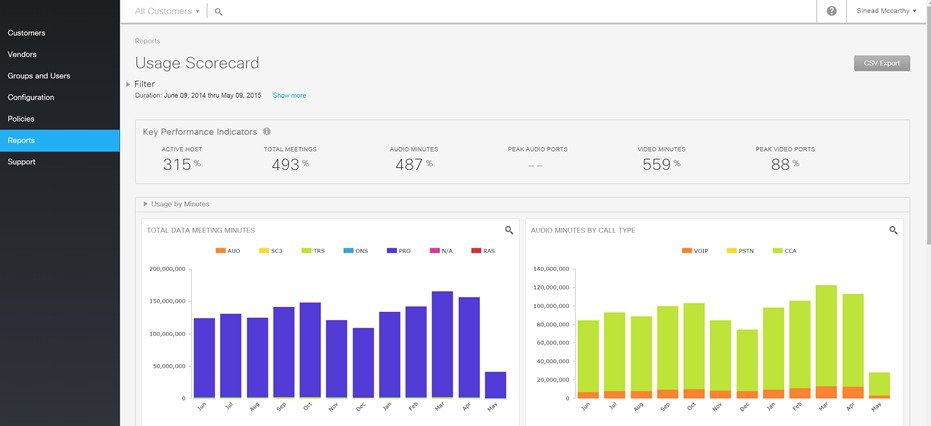
You can generate and view usage scorecards that show the usage metrics of the Cisco Cloud Connected Audio and Cisco WebEx conference services. You can view the metrics up to a maximum of the previous 12 months of usage. Or, you can filter them to display a shorter duration of days, a specific WebEx site, and one or more session types. You can also export the data to a .CSV file based on the filter that is set.
Reports can be generated for each of the following options:
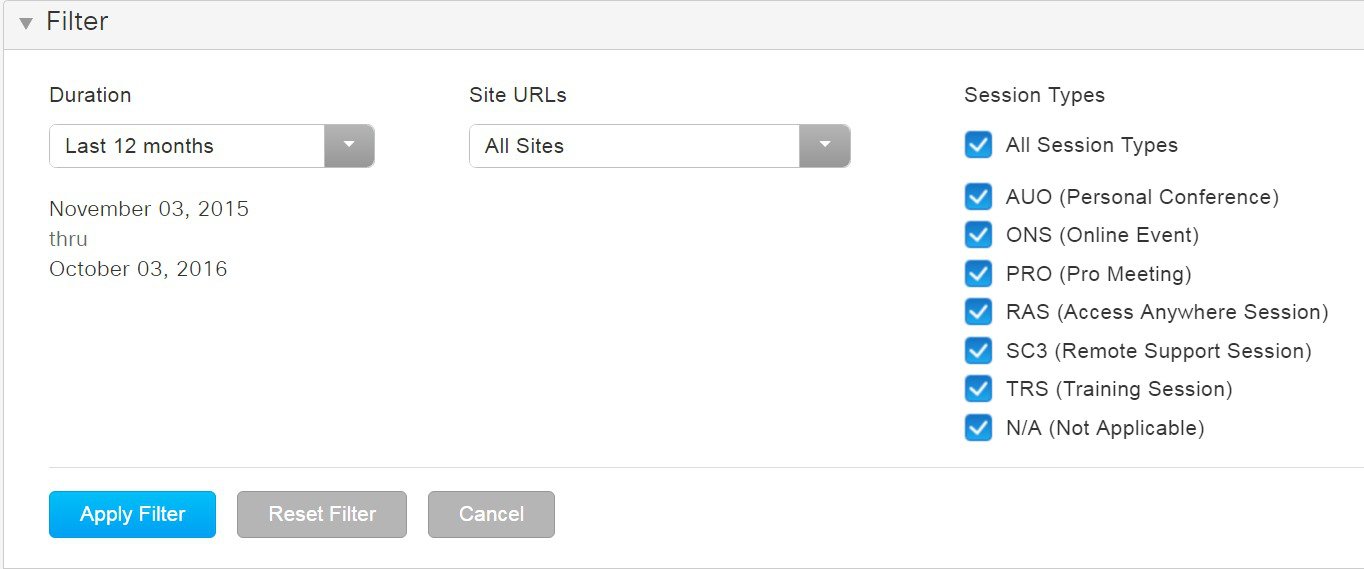
You can filter data by duration, site URLs, and session types. After selecting the filters, click Apply Filter to refresh the metrics based on the select filter settings. For example, if the duration filter is set to Last 45 Days, the key performance indicators (KPIs) compare the respective metrics for the last 45 days compared to the previous 45 days.
Key Performance Indicators and Graphic Metrics
KPIs are a set of comparisons of CCA usage metrics. They are based on the time period set by the duration filter and the previous time period of the same number of days.
 Note | A KPI of -- indicates that there is insufficient data or that the KPI is not applicable for the selected filters. |
-
Each KPI is a measure of percentage growth or decline in the respective metric.
-
To view a KPI in graph format, select the KPI name. To view a graph group, expand a report panel such as Total Meetings.
-
Within each graph, you can select each legend item to use as a subfilter.
-
Hover over elements in the graph to reveal the data point values.
-
Select the magnifier icon to display the enlarged graph as a shadowbox over the web page. You can then export each graph individually as a PDF or PNG by selecting the export button at the top right corner of the graph.
 Feedback