Cisco Network Insights for Resources Setup and Settings

This chapter contains the following sections:

Cisco Network Insights for Resources Components in Cisco APIC

The Cisco Network Insights for Resources (Cisco NIR) is a real-time monitoring and analytics application.

The Cisco NIR application consists of the following components:

  • Data Collection—The streaming of telemetry data is done by the Operating Systems on the fabric nodes. As each data source is different and the format in which data is streamed is different, there are corresponding collectors running analytics that translate the telemetry events from the nodes into data records to be stored in the data lake. The data stored in the data lake is a format that the analytics pipeline can understand and work upon.

    The following telemetry information collected from various nodes in the fabric to achieve the goal:

    • Resources Analytics—This includes monitoring software and hardware resources of fabric nodes on the Cisco APIC.

    • Environmental—This includes monitoring environmental statistics of hardware resources such as fan, CPU, memory, and power of the fabric nodes.

    • Statistics Analytics—This includes monitoring of nodes, interfaces, and protocols on the Cisco APIC and fabric nodes.

    • Flow Analytics—This includes monitoring of flows on the Cisco fabric nodes, detecting average latency, packet drop indication, and flow move indication across the entire Cisco ACI.

    • Endpoint Analytics—This includes monitoring endpoints on the Cisco fabric nodes for rapid endpoint moves, duplicate IP address, and endpoints that do not get learnt back after a reboot across the entire Cisco ACI.

    • Event Analytics—This includes monitoring of events, faults and configuration changes.

  • Resource Utilization and Environmental Statistics—Resource analytics supports configuration, operational and hardware resources. Environmental covers CPU, memory, temperature, fan utilization, power, and storage related to the leaf nodes, spine nodes, and Cisco APIC. System analytics also covers anomalies, the trending information of each resource, and graphing of parameters, which help network operators debug nodes over periods of time.

  • Predictive Analytics and Correlation—The value-add of this platform is predicting failures in the fabric and correlating internal fabric failures to the user-visible/interested failures.

  • Anomaly Detection—Involves understanding the behavior of each component using different machine learning algorithms and raising anomalies when the resource behavior deviates from the expected pattern. Anomaly detector applications use different supervised and unsupervised learning algorithms to detect the anomalies in the resources and they log the anomalies in an anomaly database.

Guidelines and Limitations

  • When fabric is upgraded and nodes are reloaded, disable and enable the Cisco NIR app for the application to load the latest data.

Cisco NIR Setup and Settings

Initial Setup

This section contains information required to set up the Cisco NIR application in the Cisco APIC.

Welcome to Network Insights

The first time you launch the Cisco Network Insights for Resources application, you are greeted with a welcome dialog. Follow these steps to complete the initial setup of Cisco NIR app:

  1. On the welcome dialog, click Begin First Time Setup.

    The Network Insights Setup window appears.

  2. Make sure the following fields are checked for the application. They are checked by default.

    • NTP and Time Zone Configuration

    • Inband IP Configuration

  3. Toggle to disable or enable Flow Analytics.

  4. Click Done.

The second time you launch the Cisco NIR application, click Review First Time Setup to review the setup. Check Do not show on launch for the splash screen welcome dialog to not appear again.

  1. Click Get Started to launch the application.

Settings

Once Cisco NIR is installed, if there are Faults present in the application, they will show on the Faults tab. To verify App functionality, click on the Settings icon and select Service Status . You should see green checks next to each service that is operating normally. In the Settings menu click Collection Status, you should see the green circles in the table indicating the nodes where information is being transmitted.

Property Description

Time Range

Specify a time range and the tables below display the data that is collected during the specified interval.

Clicking on this icon allows you to alter the following:

  • Flow Collection Configuration—Enable or disable flow collection and assign a previously configured inband management EPG. Create VRF and EPG collection rules per tenant:

    • Click the Plus icon and enter the filter Name.

    • Select a Tenant, and VRF from the drop-downs.

    • Enter the subnet in the Subnet field and click Add Subnet.

    • Click Save.

    Note 

    To verify that Flow Collection has started, select Collection Status. On the Collection Status table, you should see the green circles indicating the nodes where the flows are being exported.

  • System Status—Displays service status of the flows, such as API Server, APIC Config Manager, Correlation Engine, Flow Manager, and Prediction Engine and Capacity Usage per node and Network Insights usage.

  • Collection Status—Displays if Flow Collection is functioning, you should see the green circles in the table indicating the nodes where the flows are being exported.

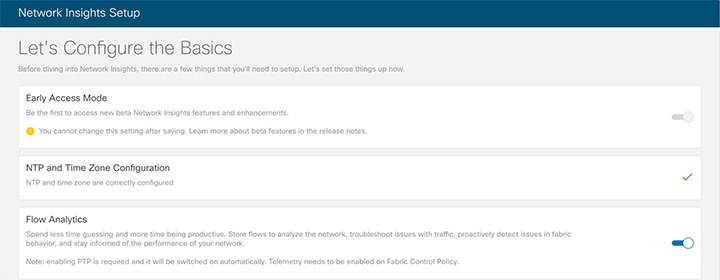
  • Network Insights Setup—Lets the user configure the Cisco NIR application setup and enable or disable Flow Analytics.

  • Network Insights Setup—Lets the user enable Early Access Mode and enable/disable Flow Analytics on Network Insights Setup page.

    The Early Access Mode lets the user enable beta Network Insights features and enhancements. Once the beta features are enabled, they can not be disabled.

  • About Network Insights—Displays the Cisco NIR application version.

The following is an example for Network Insights Setup configuration page.

The Early Access Mode lets the user enable beta Network Insights features and enhancements. Once the beta features are enabled, they can not be disabled.

Navigating Cisco NIR

The Cisco NIR application window is divided into two parts: the Navigation pane and the Work pane.

Navigation Pane

The Cisco NIR navigation pane divides the collected data into three categories:

1 Dashboard: The main dashboard for the Cisco NIR application providing immediate access to anomalies.

2 System: Resource and environmental utilization as well as software telemetry.

3 Operations: Statistics information for interfaces and protocols, flow analytics for viewing average latency, flow move indicator, and packet drops, and event analytics for viewing audit logs, events and faults.

Expanding System and/or Operations reveals additional functions:

1 Dashboard View icon: Provides immediate access to top usage or issues for the selected telemetry type.

2 Browse View icon: Provides a detailed view of returned data for the selected telemetry type and allows for filtering to further isolate problem areas.

Work Pane

The work pane is the main viewing location in the Cisco NIR application. All information tiles, graphs, charts, and lists appear in the work pane.

Dashboard Work Pane

This is an example of the Cisco NIR Dashboard work pane:

In an information tile, you can usually click on a numeric value to switch to the Browse work pane:

1 Launches the Browse work pane with all of the items displayed from the graph in the information tile.

2 Launches the Browse work pane with only the selected items displayed from the number in the information tile.

Browse Work Pane

The Browse work pane isolates the data for the parameter chosen on the Dashboard. The Browse work pane displays a top node lists, graphs over time, and lists all the nodes in an order defined by the anomaly score:

Clicking on one of the nodes in the list opens the Details work pane for that selection.

Details Work Pane

The Details work pane provides resource details about the item selected in the event list on the Browse work pane. The Details work pane consists of:

  • General Information: Includes the anomaly score and the node name.

  • Resource Trends: Includes operational resources, configuration resources, and hardware resources.

  • Anomalies: Includes all anomalies for the node resource.