Deployment Overview and Requirements

Deployment Overview

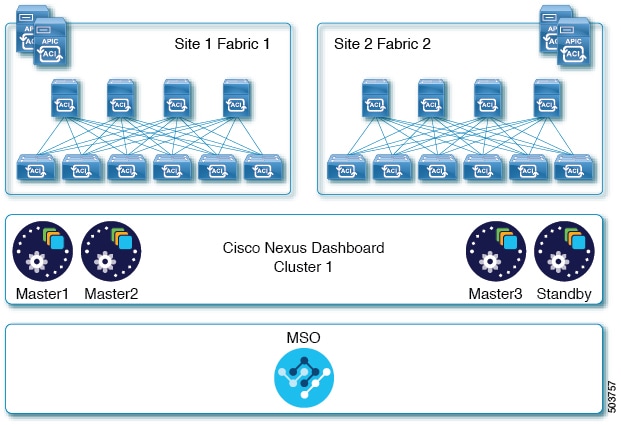
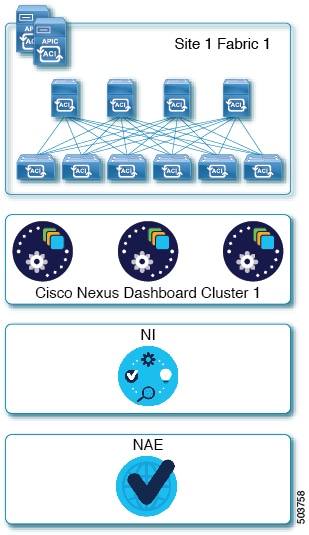
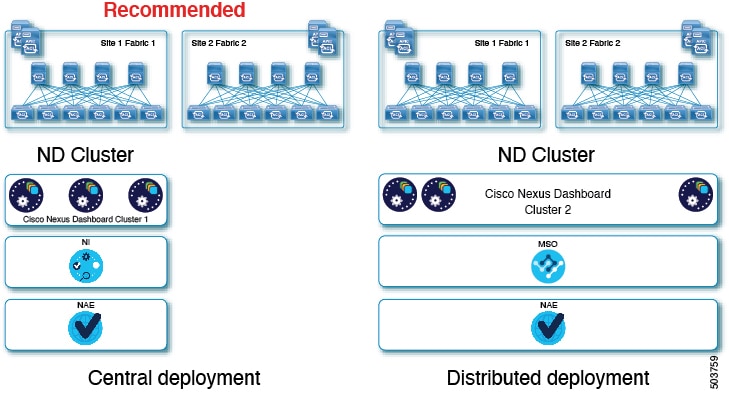
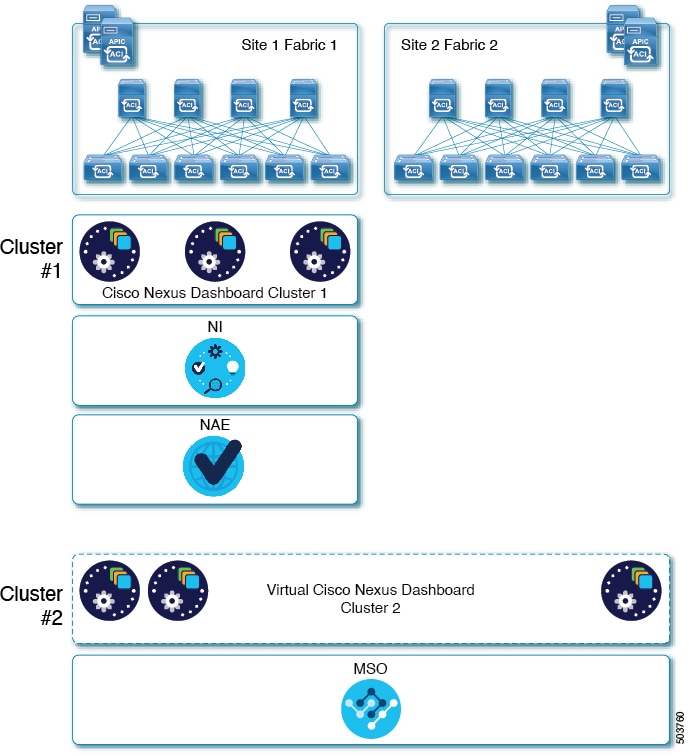
Cisco Nexus Dashboard is a central management console for multiple data center sites and a common platform for hosting Cisco data center operation applications, such as Nexus Insights and Nexus Assurance Engine. These applications are universally available for all the data center sites and provide real time analytics, visibility, and assurance for network policies and operations. Cisco Multi-Site Orchestrator can also run on Nexus Dashboard as a hosted application.

Nexus Dashboard provides a common platform and modern technology stack for these micro-services-based applications, simplifying the life cycle management of the different modern applications and reducing the operational overhead to run and maintain these applications. It also provides a central integration point for external 3rd party applications with the locally hosted applications.

Each Nexus Dashboard cluster consists of 3 master nodes. For physical Nexus Dashboard clusters, you can also provision up to 4 worker nodes to enable horizontal scaling and up to 2 standby nodes for easy cluster recovery in case of a master node failure. For virtual and cloud clusters, only the base 3-node cluster is supported.


Note


This document describes initial configuration of the 3-node cluster. After your cluster is up and running, you can configure and deploy additional nodes as described in the Cisco Nexus Dashboard User Guide, which is also available directly from the Nexus Dashboard GUI.


Hardware vs Software Stack

Nexus Dashboard is offered as a cluster of specialized Cisco UCS servers (Nexus Dashboard platform) with the software framework (Nexus Dashboard) pre-installed on it. The Cisco Nexus Dashboard software stack can be decoupled from the hardware and deployed in a number of virtual form factors. For the purposes of this document, we will use "Nexus Dashboard platform" specifically to refer to the hardware and "Nexus Dashboard" to refer to the software stack and the GUI console.

This guide describes the initial deployment of the Nexus Dashboard software; hardware setup is described in the Nexus Dashboard Hardware Setup Guide, while other Nexus Dashboard operations procedures are described in the Cisco Nexus Dashboard User Guide.

Nexus Dashboard and Cisco DCNM

Nexus Dashboard may be used in context of Cisco DCNM. In this case, DCNM is not an application running in the Nexus Dashboard software stack. Instead, the DCNM image (.iso) is installed directly on the Nexus Dashboard physical servers in order to provide additional compute resources to the applications installed and running in Cisco DCNM thus enabling horizontal scaling of the DCNM platform. As this document deals with the Nexus Dashboard software stack deployments, see a Cisco DCNM Installation Guide appropriate for your deployment type for information related to installing DCNM on Nexus Dashboard hardware.

Available Form Factors

Cisco Nexus Dashboard, Release 2.0.1 and 2.0.2g can be deployed as a physical appliance only. This refers to software stack already deployed on the Nexus Dashboard platform hardware that you purchase

Cisco Nexus Dashboard, Release 2.0.2h can be deployed using a number of different form factors. Keep in mind however, you must use the same form factor for all nodes, mixing different form factors within the same cluster is not supported.


Note


Nexus Dashboard, Release 2.0.2h supports virtual form factor clusters for Multi-Site Orchestrator application only. For other applications, such as Nexus Insights, you must deploy a physical cluster.


  • Cisco Nexus Dashboard physical appliance (.iso)

    This form factor refers to the original physical appliance hardware that you purchased with the Cisco Nexus Dashboard software stack pre-installed on it.

    The later sections in this document describe how to configure the software stack on the existing physical appliance hardware to deploy the cluster. Setting up the original Cisco Nexus Dashboard platform hardware is described in Cisco Nexus Dashboard Hardware Setup Guide.

  • VMware ESX (.ova)

    Virtual form factor that allows you to deploy a Nexus Dashboard cluster using three VMware ESX virtual machines.

  • Amazon Web Services (.ami)

    Cloud form factor that allows you to deploy a Nexus Dashboard cluster using three AWS instances.

  • Microsoft Azure (.arm)

    Cloud form factor that allows you to deploy a Nexus Dashboard cluster using three Azure instances.

Upgrading From Previous Versions of Nexus Dashboard

If you are already running a Nexus Dashboard, Release 2.0.1 or later, you can upgrade to the latest release while retaining the cluster configuration and applications, as described in Upgrading Nexus Dashboard

Upgrading From Application Services Engine

If you are running Application Services Engine, Release 1.1.3d as a physical appliance, you can upgrade to Nexus Dashboard to retain the cluster configuration and applications, as described in Upgrading Nexus Dashboard

If you are running Application Services Engine, Release 1.1.3d as a virtual appliance or a release prior to Release 1.1.3d, stateful upgrade or migration of the cluster is supported to Nexus Dashboard, Release 2.0.2h or later only. If you want to deploy Release 2.0.1 or 2.0.2g, you would need to deploy a brand new physical appliance cluster and reinstall all the applications.

Cluster Sizing Guidelines

Nexus Dashboard supports co-hosting of applications. Depending on the type and number of applications you choose to run, you may be required to deploy additional worker nodes in your cluster. For cluster sizing information and recommended number of nodes based on specific use cases, see Cisco Nexus Dashboard Cluster Sizing.

After your initial 3-node cluster is up and running, you can configure and deploy additional nodes as described in the Cisco Nexus Dashboard User Guide, which is also available directly from the Nexus Dashboard GUI.

Supported Applications

For the full list of supported applications and the associated compatibility and interoperability information, see the Cisco Day-2 Operations Apps Support Matrix.

The following table provides a reference for the recommended application release versions for Nexus Dashboard, Release 2.x:

Table 1. Recommended Application Versions

Nexus Dashboard Release and Form Factor

Nexus Insights

Multi-Site Orchestrator

Network Assurance Engine

Nexus Dashboard, Release 2.0.1

Physical cluster

5.0(1)

3.2(1)

5.1(1a)

Nexus Dashboard, Release 2.0.2g

Physical cluster

5.1(1)

3.2(1)

5.1(1b)

Nexus Dashboard, Release 2.0.2h

Physical cluster

5.1(1)

3.3(1)

5.1(1b)

Nexus Dashboard, Release 2.0.2h

Virtual cluster

Not supported

3.3(1)

Not supported

Prerequisites and Guidelines

Network Time Protocol (NTP)

The Nexus Dashboard nodes use NTP for clock synchronization, so you must have an NTP server configured in your environment.

Nexus Dashboard External Networks

Cisco Nexus Dashboard is deployed as a cluster, connecting each service node to two networks. When first configuring Nexus Dashboard, you will need to provide two IP addresses for the two Nexus Dashboard interfaces—one connected to the Data Network and the other to the Management Network.

Individual applications installed in the Nexus Dashboard may utilize the two networks for additional purposes, so we recommend consulting the specific application’s documentation in addition to this document for your deployment planning.

  • Data Network is used for:

    • Nexus Dashboard node clustering

    • Application to application communication

    • Nexus Dashboard nodes to Cisco APIC, Cloud APIC, and DCNM communication

      For example, the network traffic for Day-2 Operations applications such as NAE.

  • Management Network is used for:

    • Accessing Nexus Dashboard GUI

    • Accessing Nexus Dashboard CLI via SSH

    • DNS and NTP communication

    • Nexus Dashboard firmware upload

    • Accessing Cisco DC App Center (AppStore)

      If you want to use the Nexus Dashboard App Store to install applications, https://dcappcenter.cisco.com must be reachable via the Management Network

    • Intersight device connector

The two networks have the following requirements:

  • The two interfaces can be in the same or different subnets.

    In addition, each network's interfaces across different nodes in the cluster can also be in different subnets.

  • The management network must provide IP reachability to each node's CIMC via TCP ports 22/443.

    Nexus Dashboard cluster configuration uses each node's CIMC IP address to configure the node.

  • For Nexus Insights and Network Assurance Engine applications, the data network must provide IP reachability to the in-band network of each fabric and of the APIC.

  • For Nexus Insights and AppDynamics integration, the data network must provide IP reachability to the AppDynamics controller.

  • For Multi-Site Orchestrator application, the data network can have in-band and/or out-of-band IP reachability for Cisco APIC sites but must have in-band reachability for Cisco DCNM sites.

  • The data network interface requires a minimum MTU of 1500 to be available for the Nexus Dashboard traffic.

    Higher MTU can be configured if desired.

  • Connectivity between the nodes is required on both networks with the following additional round trip time (RTT) requirements.

    You must always use the lowest RTT requirement when deploying the Nexus Dashboard cluster and applications. For example, if you plan to co-host MSO and NI apps, site connectivity RTT must not exceed 50ms.

    Table 2. RTT Requirements

    Application

    Connectivity

    Maximum RTT

    Multi-Site Orchestrator (MSO)

    Between nodes

    50 ms

    To sites

    500 ms

    Nexus Insights (NI)

    Between nodes

    50 ms

    To sites

    50 ms

    Network Assurance Engine (NAE)

    Between nodes

    50 ms

    To sites

    50 ms

Nexus Dashboard Internal Networks

Two additional internal networks are required for communication between the containers used by the Nexus Dashboard:

  • Application overlay is used for applications internally within Nexus Dashboard

    Application overlay must be a /16 network and a default value is prepopulated during deployment.

  • Service overlay is used internally by the Nexus Dashboard.

    Service overlay must be a /16 network and a default value is prepopulated during deployment.


Note


Communications between containers deployed in different Nexus Dashboard nodes is VXLAN-encapsulated and uses the data interfaces IP addresses as source and destination. This means that the Application Overlay and Service Overlay addresses are never exposed outside the data network and any traffic on these subnets is routed internally and does not leave the cluster nodes. For example, if you had another service (such as DNS) on the same subnet as one of the overlay networks, you would not be able to access it from your Nexus Dashboard as the traffic on that subnet would never be routed outside the cluster. As such, when configuring these networks, ensure that they are unique and do not overlap with any existing networks or services external to the cluster, which you may need to access from the Nexus Dashboard cluster nodes.


Communication Ports

The following ports are required by the Nexus Dashboard cluster and its applications:

Table 3.

Interface

Port Number

Port Type

Management Interface

--

ICMP

22

TCP

67

UDP

69

UDP

443

TCP

5555

TCP

9880

TCP

30012

TCP

30021

TCP

30500-30600

TCP/UDP

Data Interface between ND nodes

53

TCP/UDP

443

TCP

3379

TCP

3380

TCP

4789

UDP

9969

TCP

9979

TCP

9989

TCP

15223

TCP

30002-30006

TCP

30009-30010

TCP

30012

TC

30015-30019

TCP

30017

UDP

30025

TCP

30500-30600

TCP/UDP

Data Interface on APICs

22

TCP

443

TCP

Data Interface between ND nodes and fabrics

443

TCP

2022

TCP

5640-5671

UDP

5965

UDP

8884

TCP

9989

TCP

30000-30001

TCP

Fabric Connectivity

The following sections describe how to connect your Nexus Dashboard cluster to your fabrics.

For on-premises APIC or DCNM fabrics, you can connect the Nexus Dashboard cluster in one of two ways:

  • The Nexus Dashboard cluster connected to the fabric via a Layer 3 network.

  • The Nexus Dashboard nodes connected to the leaf switches as typical hosts.

For Cloud APIC fabrics, you will need to connect via a Layer 3 network.

Physical Node Cabling

If you plan to deploy a virtual or cloud form factor cluster, you can skip this section.

The following figure shows the Nexus Dashboard physical node interfaces:

  • eth1-1 and eth1-2 must be connected to the Management network

  • eth2-1 and eth2-2 must be connected to the Data network

Figure 1. Node Connectivity

The interfaces are configured as Linux bonds (one for the data interfaces and one for the management interfaces) running in active-standby mode. All interfaces must be connected to individual host ports, PortChannel or vPC are not supported.

When Nexus Dashboard nodes are connected to Cisco Catalyst switches, packets are tagged with vlan0 if no VLAN is specified. In this case, you must add switchport voice vlan dot1p command to the switch interfaces where the nodes are connected to ensure reachability over the data network.

Connecting via External Layer 3 Network

We recommend connecting the Nexus Dashboard cluster to the fabrics via an external Layer 3 network as it does not tie the cluster to any one fabric and the same communication paths can be establish to all sites. Specific connectivity depends on the type of applications deployed in the Nexus Dashboard:

  • If you are deploying Multi-Site Orchestrator to manage Cisco ACI fabrics only, you can establish connectivity from the data interface to either the in-band or out-of-band (OOB) interface of each site's APIC or both.

  • If you are deploying Multi-Site Orchestrator to manage Cisco DCNM fabrics, you must establish connectivity from the data interface to the in-band interface of each site's DCNM.

  • If you are deploying Day-2 Operations applications, such as Nexus Insights, you must establish connectivity from the data interface to the in-band network of each fabric and of the APIC.

If you plan to connect the cluster across a Layer 3 network, keep the following in mind:

  • For ACI fabrics, you must configure an L3Out and the external EPG for Cisco Nexus Dashboard data network connectivity in the management tenant.

    Configuring external connectivity in an ACI fabric is described in Cisco APIC Layer 3 Networking Configuration Guide.

  • For DCNM fabrics, if the data interface and DCNM’s inband interface are in different subnets, you must add a route on DCNM to reach the Nexus Dashboard's data network address.

    You can add the route from the DCNM UI by navigating to Administration > Customization > Network Preference > In-Band (eth2) , then adding the route and saving.

  • If you specify a VLAN ID for your data interface during setup of the cluster, the host port must be configured as trunk allowing that VLAN.

    However, in most common deployments, you can leave the VLAN ID empty and configure the host port in access mode.

The following two figures show two distinct network connectivity scenarios when connecting the Nexus Dashboard cluster to the fabrics via a Layer 3 network. The primary purpose of each depends on the type of application you may be running in your Nexus Dashboard.

Note that the "L3 Network" and the "Management Network" can be the same network infrastructure, for example in case the Nexus Dashboard nodes have the management and data network interfaces in the same subnet.

Figure 2. Connecting via Layer 3 Network, Day-2 Operations Applications
Figure 3. Connecting via Layer 3 Network, Multi-Site Orchestrator

Connecting Nodes Directly to Leaf Switches

You can also connect the Nexus Dashboard cluster directly to one of the fabrics. This provides easy connectivity between the cluster and in-band management of the fabric, but ties the cluster to the specific fabric and requires reachability to other fabrics to be established through external connectivity. This also makes the cluster dependent on the specific fabric so issues within the fabric may impact Nexus Dashboard connectivity. Like in the previous example, connectivity depends on the type of applications deployed in the Nexus Dashboard:

  • If you are deploying Multi-Site Orchestrator to manage Cisco ACI fabrics only, you can establish connectivity from the data interface to either the in-band or out-of-band (OOB) interface of each site’s APIC

  • If you are deploying Nexus Insights or Network Assurance Engine, you must establish connectivity from the data interface to the in-band interface of each fabric.

    For ACI fabrics, the data interface IP subnet connects to an EPG/BD in the fabric and must have a contract established to the local in-band EPG in the management tenant. We recommend deploying the Nexus Dashboard in the management tenant and in-band VRF. Connectivity to other fabrics is established via an L3Out.

  • If you are deploying Nexus Insights with ACI fabrics, the data interface IP address and the ACI fabric's in-band IP address must be in different subnets.

If you plan to connect the cluster directly to the leaf switches, keep the following in mind:

  • If deploying in VMware ESX or Linux KVM, the host must be connected to the fabric via trunk port.

  • For ACI fabrics, we recommend configuring the bridge domain (BD), subnet, and endpoint group (EPG) for Cisco Nexus Dashboard connectivity in management tenant.

    Because the Nexus Dashboard requires connectivity to the in-band EPG in the in-band VRF, creating the EPG in the management tenant means no route leaking is required.

  • For ACI fabrics, you must create a contract between the fabric's in-band management EPG and Cisco Nexus Dashboard EPG.

  • For ACI fabrics, if several fabrics are monitored with apps on the Nexus Dashboard cluster, L3Out with default route or specific route to other ACI fabric in-band EPG must be provisioned and a contract must be established between the cluster EPG and the L3Out's external EPG.

  • If you specify a VLAN ID for your data network during setup of the cluster, the Nexus Dashboard interface and the port on the connected network device must be configured as trunk

    However, in most cases we recommend not assigning a VLAN to the data network, in which case you must configure the ports in access mode.

The following two figures show two distinct network connectivity scenarios when connecting the Nexus Dashboard cluster directly to the fabrics' leaf switches. The primary purpose of each depends on the type of application you may be running in your Nexus Dashboard.

Note that the "L3 Network" and the "Management Network" can be the same network infrastructure, for example in case the Nexus Dashboard nodes have the management and data network interfaces in the same subnet.

Figure 4. Connecting Directly to Leaf Switches, Day-2 Operations Applications
Figure 5. Connecting Directly to Leaf Switches, Multi-Site Orchestrator

Node Distribution Across Sites

Nexus Dashboard supports distribution of cluster nodes across multiple sites.

We recommend centralized, single-site deployment for Nexus Insights and Network Assurance Engine applications. These applications do not gain redundancy benefits from distributed cluster, which could instead expose the cluster to interconnection failures when nodes are in different sites.

We recommend distributed cluster for Multi-Site Orchestrator deployments. Keep in mind that at least two Nexus Dashboard master nodes are required for the cluster to remain operational, so when deploying a physical Nexus Dashboard cluster across two sites, we recommend deploying a standby node in the site with the single master node as shown in the following figure:

Figure 6. Node Distribution Across Two Sites for Multi-Site Orchestrator

If you are deployed a virtual Nexus Dashboard cluster, standby nodes are not supported and if one of the nodes fails, you will need to bring up a new virtual node to replace it, as described in the "Replacing Virtual Nodes" chapter of the Cisco Nexus Dashboard User Guide.

The following table summarizes additional supported scenarios for distribution of physical Nexus Dashboard master (M1, M2, M3) and standby (S1) nodes across multiple sites:

Table 4. Nexus Dashboard Node Distribution Across Sites

Number of Sites

Nodes in Site 1

Nodes in Site 2

Nodes in Site 3

Nodes in Site 4

1

M1, M2, M3

--

--

--

2

M1, M2

M3, S1

--

--

3

M1

M2

M3

--

4

M1

M2

M3

S1

App Co-location Use Cases

This section describes a number of recommended deployment scenarios for specific single-app or multiple apps co-hosting use cases.


Note


This release does not support application co-hosting for virtual or cloud form factors. All application co-hosting scenarios below apply for physical Nexus Dashboard clusters only.


Single Site, Nexus Insights and Network Assurance Engine

In a single site scenario with Nexus Insights and Network Assurance Engine applications, a single physical Nexus Dashboard cluster can be deployed with both applications co-hosted on it.

Figure 7. Single Site, Nexus Insights and Network Assurance Engine

Multiple Sites, Nexus Insights and Network Assurance Engine

In a multiple sites scenario with Nexus Insights and Network Assurance Engine applications, a single Nexus Dashboard cluster can be deployed with both applications co-hosted on it. In this case, the nodes can be distributed between the sites, however since these applications do not gain redundancy benefits from a distributed cluster and could instead be exposed to interconnection failures when nodes are in different sites, we recommend the deployment option on the left:

Figure 8. Single Site, Nexus Insights and Network Assurance Engine

Multiple Sites, Nexus Insights, Network Assurance Engine, and Multi-Site Orchestrator

In this case, we recommend deploying two Nexus Dashboard cluster, with one of them dedicated to the Multi-Site Orchestrator application using the virtual or cloud form factor and the nodes distributed across the sites.

Figure 9. Single Site, Nexus Insights and Network Assurance Engine

Pre-Installation Checklist

Before you proceed with deploying your Nexus Dashboard cluster, prepare the following information for easy reference during the process:

Table 5. Cluster Details

Parameters

Example

Your Entry

Cluster Name

nd-cluster

NTP Server

171.68.38.65

DNS Provider

64.102.6.247 171.70.168.183

DNS Search Domain

cisco.com

App Network

172.17.0.1/16

Service Network

100.80.0.0/16
Table 6. Node Details

Parameters

Example

Your Entry

For physical nodes, CIMC address and login information of the first node

10.195.219.84/24

Username: admin

Password: Cisco1234

For physical nodes, CIMC address and login information of the second node

10.195.219.85/24

Username: admin

Password: Cisco1234

For physical nodes, CIMC address and login information of the third node

10.195.219.86/24

Username: admin

Password: Cisco1234

Password used for each node's rescue-user and the initial GUI password.

We recommend configuring the same password for all nodes in the cluster.

Welcome2Cisco!

Management IP of the first node

192.168.9.172/24

Management Gateway of the first node.

192.168.9.1

Data Network IP of the first node

192.168.6.172/24

Data Network Gateway of the first node

192.168.6.1

(Optional) Data Network VLAN of the first node

101

Management IP of the second node

192.168.9.173/24

Management Gateway of the second node.

192.168.9.1

Data Network IP of the second node

192.168.6.173/24

Data Network Gateway of the second node

192.168.6.1

(Optional) Data Network VLAN of the second node

101

Management IP of the third node

192.168.9.174/24

Management Gateway of the third node.

192.168.9.1

Data Network IP of the third node

192.168.6.174/24

Data Network Gateway of the third node

192.168.6.1

(Optional) Data Network VLAN of the third node

101