Configuring iCAM

This chapter contains the following sections:

About iCAM

Cisco Nexus 9000 Platform switches support the Intelligent CAM Analytics and Machine-learning (iCAM) feature. iCAM enables you to:

  • View traffic and usage analytics per supported function, Ternary Content-Addressable Memory (TCAM) resources, and TCAM entries.

  • Allows you to plan better by understanding the Ternary Content-Addressable Memory (TCAM) usage per feature, enabling you to use TCAM space effectively.

  • Verify, detect, plan, and predict your environment against Cisco-verified scale numbers for the different supported functions (Layer 2 switching, unicast routing).

  • Maintain historical usage, functional scale analytics of different supported functions, including entries and resource usage of FIB and ACL TCAM.

  • Predict scale (usage level) monitoring for different supported functions in addition to predicted scale for ACL and FIB TCAM entries.

  • Allows monitoring and maintenance of historical usage of process memory and shared memory.

  • View health monitoring data (such as CPU, memory, power supply) and information on Intelligent Traffic Director (ITD) services.

The iCAM feature:

  • Does not require additional hardware or software.

  • Provides useful traffic telemetry and analytics.

  • Beginning with Cisco NX-OS Release 9.3(5), iCAM feature is always enabled and users cannot disable feature through no feature icam . Also that icam scale monitor is enabled by default if no startup configuration is present.

This topic provides an overview on the different capabilities of iCAM.

Overview of iCAM

iCAM provides resource monitoring and analytics for different functions and features on Cisco Nexus 9000 Platform switches. Based on a default or user-configured scale level threshold on a per-function basis, iCAM generates alerts through system logging messages generation to notify network administrators.


Note

Beginning with Cisco Nexus NX-OS Release 9.3(5), iCAM feature will be always-on and there is no need to enable feature through feature icam.


You can obtain traffic, scale and resource (usage level) monitoring for the following resources and functions:

  • ACL TCAM entries

  • ACL TCAM resource utilization

  • Forward information base (FIB) TCAM resource utilization

  • Layer 2 Switching

  • Unicast routing

  • Process memory

  • Shared memory

The iCAM process runs on the supervisor module. It interacts with various components on the line card and collects hardware resource utilization statistics, performs data processing, and presents a summarized output. The iCAM process also provides insights about the top hitters and bottom hitters for each feature, such as ACL and PBR entries. Using iCAM, you can get packet counts per TCAM entry, sort and search, and get a specified percentage for either the top or bottom entries. Traffic telemetry and analytics about iCAM entries helps to understand network traffic and so better use TCAM space.

TCAM Monitoring

iCAM provides analytics related to network traffic, TCAM usage per feature, detailed analysis per TCAM bank. This helps you to use available TCAM space effectively.

As an example, in the ACL Classification TCAM, the resource entries used per feature can include: Router-ACL (RACL), Vlan-ACL (VACL), Port-ACL (PACL), Policy Based Routing (PBR), QoS (Quality of Service), NAT, Intelligent Traffic Director (ITD), and Web Cache Communication Protocol (WCCP). iCAM provides visibility into effective resource usage of TCAM entries.

Scale Monitoring

iCAM scale monitoring provides you the ability to verify, detect, plan, and predict your environment against Cisco verified scale numbers. You can configure all scale monitoring features with default limits and thresholds or customize the threshold values to your specific needs.

Scale monitoring capabilities include:

  • Track system scale limits in comparison to Cisco verified limits.

  • Two-hour polling interval by default, configurable to one-hour.

  • Track average and peak utilizations, along with timestamps for peak utilizations.

  • User-configurable scale limits and alert thresholds.

  • JSON/XML compatible.

Historical Analytics Using iCAM

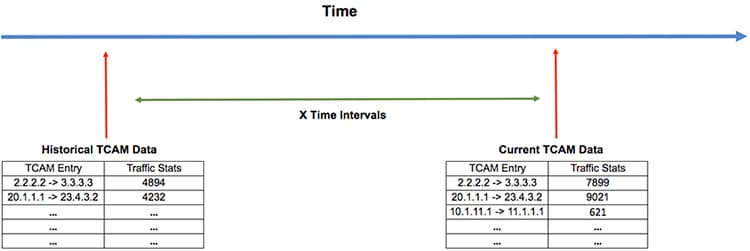
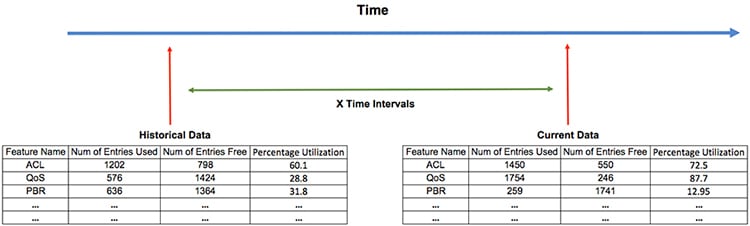
You can use iCAM to obtain historical traffic analytics of entries and resources. When iCAM monitoring is enabled for resources and entries, traffic data is periodically polled and stored in the iCAM database. The history option for iCAM entries displays the cumulative traffic statistics and average packets per second. The history option for TCAM resources displays the snapshots of TCAM statistics of the past.

The following figure shows the historical traffic data:

Figure 1. Historical Traffic Data

The following figure shows historical resource utilization:

Figure 2. Historical Resource Utilization

Predicting Traffic Analytics Using iCAM

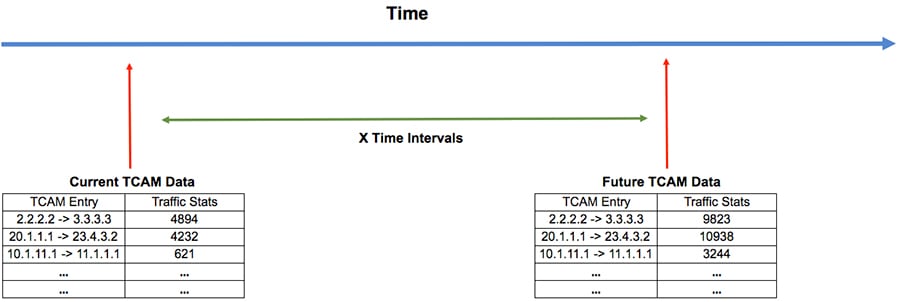
You can use iCAM to predict the traffic on entries and resources for a future date. When you enable iCAM monitoring for resources and entries, iCAM polls the traffic data periodically and stores the information in the iCAM database. The iCAM feature uses machine-learning algorithms to analyze the historical data and predicts the TCAM usage for a future date and time.

The following figure shows the predicted traffic data:

Figure 3. Predicted Traffic Data

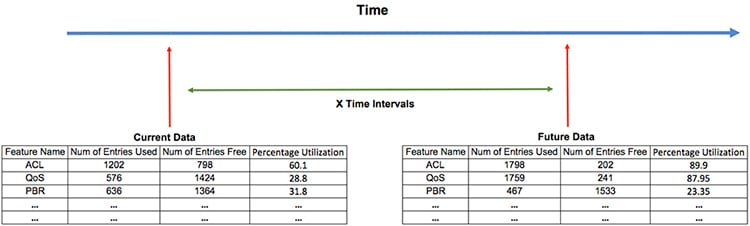
The following figure shows the predicted resource utilization:

Figure 4. Predicted Resource Utilization

Health Monitoring

iCAM can operate as a data provider to health monitoring applications such as iCAM micro-service and DCNM, and can be streamed through Software Telemetry to external applications for off-switch analysis. Health data is available through the iCAM show icam health CLI command.

iCAM provides Intelligent Traffic Director (ITD) services through the iCAM show icam itd CLI command.

Licensing Requirements

For a complete explanation of Cisco NX-OS licensing recommendations and how to obtain and apply licenses, see the Cisco NX-OS Licensing Guide.

About iCAM Monitoring

This topic describes how to enable and configure iCAM monitoring.

Enabling and Configuring iCAM Monitoring

Use the following commands to configure iCAM entries for a module on the Cisco Nexus 9000 Platform switches:


Note

We recommend that you have at least 1 GB of storage space for the iCAM database, preferably on logflash. Storage in memory and logflash is both supported. If logflash is not available, the iCAM database is created in memory and the database size is capped to1GB depending on the available memory storage space. If the iCAM DB is created in memory it may not be persistent upon switch reload.

SUMMARY STEPS

  1. configure terminal
  2. [no]icam monitor entries acl module module-number inst instance-number
  3. [no]icam monitor resource { | } module module inst instance
  4. (Optional) icam monitor interval interval-hours num-intervals

DETAILED STEPS

  Command or Action Purpose
Step 1

configure terminal

Example:

switch# configure terminal
switch(config)#

Enter global configuration mode.

Step 2

[no]icam monitor entries acl module module-number inst instance-number

Monitor ACL entries per module and instance numbers:

  • module-number —The module-number to monitor.

  • instance-number —The instance-number you want to monitor.

Step 3

[no]icam monitor resource { | } module module inst instance

Monitor the or resource per module and instance.

Step 4

(Optional) icam monitor interval interval-hours num-intervals

Example:

(Optional)

Set iCAM monitor and global intervals history:

  • interval-hours —Configures global monitoring interval in hours. The default value is 2 hours.

  • num-intervals —Configures monitoring interval history. The default value is 168 (2 hours * 168 intervals = 14 days).

Example

The following example shows how to configure iCAM entries for a module:

switch# configure terminal
switch# feature icam
switch# copy running-config startup-config

Example: Scale Monitoring

This example displays sample data from Layer 2 switching scale monitoring thresholds.

switch# show icam scale l2-switching 
Retrieving data.  This may take some time ... 
==================================================
Info Threshold =  80 percent (default)           |
Warning Threshold =  90 percent (default)        |
Critical Threshold = 100 percent (default)       |
All timestamps are in UTC                        |
==================================================

-------------------------------------------------------------------------------------------
Scale Limits for L2 Switching
-------------------------------------------------------------------------------------------
             Feature  Verified    Config       Cur     Cur   Threshold               Polled
                         Scale     Scale     Scale    Util    Exceeded            Timestamp
-------------------------------------------------------------------------------------------
       MAC Addresses         -         -         -      -           -                 -
        (Mod:1,FE:0)     90000     90000        16   0.01        None   2018-07-06 16:27:05
        (Mod:1,FE:1)     90000     90000         0   0.00        None   2018-07-06 16:27:05
               VLANs      3967      3967         1   0.02        None   2018-07-06 16:27:07
             (VDC:1)         -         -         1   0.02        None   2018-07-06 16:27:05
switch#

This example displays Layer 2 switching traffic history for a specified number of intervals.

switch# show icam scale l2-switching vlan vlan-count history 10
==================================================
Info Threshold =  80 percent (default)           |
Warning Threshold =  90 percent (default)        |
Critical Threshold = 100 percent (default)       |
All timestamps are in UTC                        |
==================================================

------------------------------------------------------------------------------------------------
Scale Limits for L2 Switching
------------------------------------------------------------------------------------------------
               Feature  Verified    Config       Cur     Cur   Threshold               Polled
                           Scale     Scale     Scale    Util    Exceeded            Timestamp
------------------------------------------------------------------------------------------------
                 VLANs      3967      3967         1   0.02        None     2019-04-09 08:11:50
                                                   1   0.02        None     2019-04-09 09:11:55
                                                   1   0.02        None     2019-04-09 10:11:59
                                                   1   0.02        None     2019-04-09 11:12:05
                                                   1   0.02        None     2019-04-09 12:12:09
                                                   1   0.02        None     2019-04-09 13:12:13
                                                   1   0.02        None     2019-04-09 14:12:18
                                                   1   0.02        None     2019-04-09 15:12:24
                                                   1   0.02        None     2019-04-09 16:12:29
                                                   1   0.02        None     2019-04-09 17:12:33
                  (VDC:1)         -         -      1   0.02        None     2019-04-09 08:11:02
                                                   1   0.02        None     2019-04-09 09:11:07
                                                   1   0.02        None     2019-04-09 10:11:11
                                                   1   0.02        None     2019-04-09 11:11:16
                                                   1   0.02        None     2019-04-09 12:11:21
                                                   1   0.02        None     2019-04-09 13:11:25
                                                   1   0.02        None     2019-04-09 14:11:30
                                                   1   0.02        None     2019-04-09 15:11:35
                                                   1   0.02        None     2019-04-09 16:11:41
                                                   1   0.02        None     2019-04-09 17:11:45
switch#
 

This example displays Layer 2 switching utilization data including average and peak utilization data, peak timestamp, 7-day totals, and total counts.

switch# show icam scale l2-switching vlan vlan-count utilization
==================================================
Info Threshold =  80 percent (default)           |
Warning Threshold =  90 percent (default)        |
Critical Threshold = 100 percent (default)       |
All timestamps are in UTC                        |
==================================================

-------------------------------------------------------------------------------------------------------------------------------
Scale Limits for L2 Switching
-------------------------------------------------------------------------------------------------------------------------------
                  Feature  Verified    Config     Cur    Cur    Avg  7-Day      7-Day Peak          Peak        Peak
                              Scale     Scale     Scale  Util   Util  Util      Timestamp           Util    Timestamp
-------------------------------------------------------------------------------------------------------------------------------
                    VLANs      3967      3967        1   0.02   0.02   0.02   2019-04-08 22:34:25   0.02   2019-04-08 22:34:25
                  (VDC:1)         -         -        1   0.02   0.02   0.02   2019-04-08 22:33:36   0.02   2019-04-08 22:33:36
switch#
 

This example displays Layer 2 switching hit count and the last timestamp of the exceeding configured scale for each configured threshold.

switch# show icam scale l2-switching vlan vlan-count thresholds
==================================================
Info Threshold =  80 percent (default)           |
Warning Threshold =  90 percent (default)        |
Critical Threshold = 100 percent (default)       |
All timestamps are in UTC                        |
==================================================

------------------------------------------------------------------------------------------------------------------------------------
Scale Limits for L2 Switching
------------------------------------------------------------------------------------------------------------------------------------
       Feature  Verified   Config    Current     Info          Last  Info       Warning      Last Warning      Critical Last Critical
                Scale      Scale      Scale     Exceeded    Exceeded Timestamp  Exceeded   Exceeded Timestamp  Exceeded Exceeded Timestamp
------------------------------------------------------------------------------------------------------------------------------------
        VLANs    3967      3967         1          0                 -             0                -               0          -
switch#
 

System Monitoring

Beginning with Cisco NX-OS Release 9.3(5), monitoring of per process memory and shared-memory of components is supported.

icam monitor system <CR>

This command will enable monitoring of all categories under system monitoring. Beginning with Cisco Nexus NX-OS Release 9.3(5), it will be for Memory and Shared-memory on Active SUP only.

ICAM system monitoring feature allows monitoring of process memory usage against available virtual memory for the process and shared-memory usage against the maximum available shared-memory for the component.

1.2 icam monitor system threshold info <1-100> warning <1-100> critical <1-100> 

This will set the threshold values for each level and will determine when Warning or Critical syslogs are generated. The default values are 80,90 and 100 for Info, Warning and Critical respectively. icam monitor command system threshold is applied for all processes memory and shared-memory usage level.

1.3 icam monitor interval <1-24> history <168-1344>

This command shows all monitoring and will determine the polling interval and the maximum polling samples will be kept at any time in the database.

show icam system output will be modeled similar to Scale features, i.e. show icam system for current values will be available without enabling icam system monitoring . For history related commands it will be similar to scale.

icam system monitoring needs to be enabled for history collection and related commands, show icam system [history interval ] [thresholds] [utilization]

The show icam system memory command will display the process UUID, process name, Mem Limit (in Bytes), Mem Used (in Bytes) and the percentage of Utilization

Example output proposal:

switch# show icam system memory
Retrieving data. This may take some time ...
==================================================
Info Threshold = 80 percent (default) |
Warning Threshold = 90 percent (default) |
Critical Threshold = 100 percent (default) |
All timestamps are in UTC |
==================================================

Process Memory
==============

Process Instance Unit Value Limit Util. Alarm Timestamp
------------------------------------------------------------------------------------------------------------------------------
aaa UUID:0x000000B5 PID:4024 Bytes 619171840 4294967295 14.41 Warning 2020-01-25 08:06:25
acllog UUID:0x0000023C PID:6648 Bytes 614506496 25222676480 14.30 Warning 2020-01-25 08:06:25
aclmgr UUID:0x00000182 PID:4030 Bytes 629452800 25222676480 14.65 Warning 2020-01-25 08:06:25

The show icam system shared-memory command will display the component name, Shared-Mem limit, Shared-Mem Used (in KB) and the percentage of Utilization

switch# show icam system shared-memory
Retrieving data. This may take some time ...
==================================================
Info Threshold = 80 percent (default) |
Warning Threshold = 90 percent (default) |
Critical Threshold = 100 percent (default) |
All timestamps are in UTC |
==================================================

Shared Memory
=============

Component Instance Unit Value Limit Util. Alarm Timestamp
------------------------------------------------------------------------------------------------------------------------------
am VDC:1 MOD:27 KB 201 1028 19.55 Critical 2020-01-25 08:07:37
am_lim VDC:1 MOD:27 KB 1 68 1.47 None 2020-01-25 08:07:37
arp VDC:1 MOD:27 KB 92 4100 2.24 None 2020-01-25 08:07:37
arplib VDC:1 MOD:27 KB 129 24580 0.52 None 2020-01-25 08:07:37

arplib     (VDC:1, Mod: 6)    KB          -        23580       10             0.52        None          2019-11-06 08:08:49

Without the category specified, the show icam system command will display all monitored categories i.e. memory and shared-memory.

switch(config)# show icam system 

Retrieving data.  This may take some time ...

==================================================

Info Threshold =  80 percent (default)           |

Warning Threshold =  90 percent (default)        |

Critical Threshold = 100 percent (default)       |

All timestamps are in UTC                        |

==================================================


Process Memory
==============

Process Instance Unit Value Limit Util. Alarm Timestamp
------------------------------------------------------------------------------------------------------------------------------
aaa UUID:0x000000B5 PID:4024 Bytes 619171840 4294967295 14.41 Warning 2020-01-25 08:06:25
acllog UUID:0x0000023C PID:6648 Bytes 614506496 25222676480 14.30 Warning 2020-01-25 08:06:25
aclmgr UUID:0x00000182 PID:4030 Bytes 629452800 25222676480 14.65 Warning 2020-01-25 08:06:25

---------------------------------------------------------------------------------------------------------------------------------

Shared Memory
=============

Component Instance Unit Value Limit Util. Alarm Timestamp
------------------------------------------------------------------------------------------------------------------------------
am VDC:1 MOD:27 KB 201 1028 19.55 Critical 2020-01-25 08:07:37
am_lim VDC:1 MOD:27 KB 1 68 1.47 None 2020-01-25 08:07:37
arp VDC:1 MOD:27 KB 92 4100 2.24 None 2020-01-25 08:07:37
arplib VDC:1 MOD:27 KB 129 24580 0.52 None 2020-01-25 08:07:37

In addition to above show commands when monitoring is enabled for system features, history/utilization/thresholds will be supported.

switch# show icam system ?
<CR>
> Redirect it to a file
>> Redirect it to a file in append mode
history Show usage history
memory Virtual Memory usage
shared-memory Shared Memory usage
thresholds Show thresholds statistics
utilization Show utilization statistics
| Pipe command output to filter

show icam system [memory | shared-memory] [history <1-1344>] [utilization | thresholds]   

This example displays sample data from the default scale monitoring thresholds.

switch# show icam scale
Retrieving data.  This may take some time ... 
==================================================
Info Threshold =  80 percent (default)           |
Warning Threshold =  90 percent (default)        |
Critical Threshold = 100 percent (default)       |
All timestamps are in UTC                        |
==================================================

-------------------------------------------------------------------------------------------
Scale Limits for L2 Switching
-------------------------------------------------------------------------------------------
             Feature  Verified    Config       Cur     Cur   Threshold               Polled
                         Scale     Scale     Scale    Util    Exceeded            Timestamp
-------------------------------------------------------------------------------------------
       MAC Addresses         -         -         -      -           -                 -
        (Mod:1,FE:0)     90000     90000        16   0.01        None   2018-07-06 16:27:05
        (Mod:1,FE:1)     90000     90000         0   0.00        None   2018-07-06 16:27:05
               VLANs      3967      3967         1   0.02        None   2018-07-06 16:27:07
             (VDC:1)         -         -         1   0.02        None   2018-07-06 16:27:05
switch#
 

This example displays Layer 2 switching traffic history for a specified number of intervals.

switch# show icam scale l2-switching vlan vlan-count history 10
==================================================
Info Threshold =  80 percent (default)           |
Warning Threshold =  90 percent (default)        |
Critical Threshold = 100 percent (default)       |
All timestamps are in UTC                        |
==================================================

------------------------------------------------------------------------------------------------
Scale Limits for L2 Switching
------------------------------------------------------------------------------------------------
               Feature  Verified    Config       Cur     Cur   Threshold               Polled
                           Scale     Scale     Scale    Util    Exceeded            Timestamp
------------------------------------------------------------------------------------------------
                 VLANs      3967      3967         1   0.02        None     2019-04-09 08:11:50
                                                   1   0.02        None     2019-04-09 09:11:55
                                                   1   0.02        None     2019-04-09 10:11:59
                                                   1   0.02        None     2019-04-09 11:12:05
                                                   1   0.02        None     2019-04-09 12:12:09
                                                   1   0.02        None     2019-04-09 13:12:13
                                                   1   0.02        None     2019-04-09 14:12:18
                                                   1   0.02        None     2019-04-09 15:12:24
                                                   1   0.02        None     2019-04-09 16:12:29
                                                   1   0.02        None     2019-04-09 17:12:33
                  (VDC:1)         -         -      1   0.02        None     2019-04-09 08:11:02
                                                   1   0.02        None     2019-04-09 09:11:07
                                                   1   0.02        None     2019-04-09 10:11:11
                                                   1   0.02        None     2019-04-09 11:11:16
                                                   1   0.02        None     2019-04-09 12:11:21
                                                   1   0.02        None     2019-04-09 13:11:25
                                                   1   0.02        None     2019-04-09 14:11:30
                                                   1   0.02        None     2019-04-09 15:11:35
                                                   1   0.02        None     2019-04-09 16:11:41
                                                   1   0.02        None     2019-04-09 17:11:45
switch#
 

This example displays Layer 2 switching utilization data including average and peak utilization data, peak timestamp, 7-day totals, and total counts.

switch# show icam scale l2-switching vlan vlan-count utilization
==================================================
Info Threshold =  80 percent (default)           |
Warning Threshold =  90 percent (default)        |
Critical Threshold = 100 percent (default)       |
All timestamps are in UTC                        |
==================================================

-------------------------------------------------------------------------------------------------------------------------------
Scale Limits for L2 Switching
-------------------------------------------------------------------------------------------------------------------------------
                  Feature  Verified    Config     Cur    Cur    Avg  7-Day      7-Day Peak          Peak        Peak
                              Scale     Scale     Scale  Util   Util  Util      Timestamp           Util    Timestamp
-------------------------------------------------------------------------------------------------------------------------------
                    VLANs      3967      3967        1   0.02   0.02   0.02   2019-04-08 22:34:25   0.02   2019-04-08 22:34:25
                  (VDC:1)         -         -        1   0.02   0.02   0.02   2019-04-08 22:33:36   0.02   2019-04-08 22:33:36
switch#
 

This example displays Layer 2 switching hit count and the last timestamp of the exceeding configured scale for each configured threshold.

switch# show icam scale l2-switching vlan vlan-count thresholds
==================================================
Info Threshold =  80 percent (default)           |
Warning Threshold =  90 percent (default)        |
Critical Threshold = 100 percent (default)       |
All timestamps are in UTC                        |
==================================================

------------------------------------------------------------------------------------------------------------------------------------
Scale Limits for L2 Switching
------------------------------------------------------------------------------------------------------------------------------------
       Feature  Verified   Config    Current     Info          Last  Info       Warning      Last Warning      Critical Last Critical
                Scale      Scale      Scale     Exceeded    Exceeded Timestamp  Exceeded   Exceeded Timestamp  Exceeded Exceeded Timestamp
------------------------------------------------------------------------------------------------------------------------------------
        VLANs    3967      3967         1          0                 -             0                -               0          -
switch#
 

About Displaying TCAM Entries and Usage

You can display current, historical, and predictive information about TCAM, including traffic analytics of TCAM entries and TCAM resource per feature.

Displaying Current, Historical, and Predictive Traffic Analytics of TCAM Entries

The TCAM entries and traffic analytics are listed per module and per TCAM instance.


Note

You can only display history and prediction for resources and entries on modules and instances that have monitoring enabled. The entries and resources are sorted based on the packet count.

To display the current, historical, or predictive traffic analytics of TCAM entries, use the following commands:

SUMMARY STEPS

  1. show icam entries acl module module inst instance [history num-intervals ] [sort { [filter feature-name [ exact]] [ sort-order [ascending | descending]] [ top top-percentage] } ]
  2. show icam prediction entries acl module module inst inst year month day time [top top-percentage ]

DETAILED STEPS

  Command or Action Purpose
Step 1

show icam entries acl module module inst instance [history num-intervals ] [sort { [filter feature-name [ exact]] [ sort-order [ascending | descending]] [ top top-percentage] } ]

Example:

switch# show icam entries acl module 1 inst 0

Example:

switch# show icam entries acl module 1 inst 0 sort filter RACL top 5 sort-order descending

Example:

switch# show icam entries acl module 1 inst 0 history 5 sort top 10

Displays the TCAM entries based on the options selected:

  • history —Displays the traffic history of entries for the specified number of intervals.

  • sort —Specifies how to filter or sort the list of TCAM entries. You must use at least one option if you filter TCAM entries using the sort keyword.

  • filter feature-name —Filters the TCAM entries based on the feature name.

    Note 
    By default, all the features are displayed. Enclose the feature name in quotation marks if it contains more than one word, like QoS CoPP.
  • exact —Filters the TCAM entries based on the exact feature name.

    Note 
    This keyword can be used only when filtering the TCAM entries by feature names.
  • sort-order —Sorts the entries in either ascending or descending order.

    Note 
    The valid values are ascending and descending. Setting the value to ascending displays the list in ascending order and setting to descending displays the list in descending order. The entries are sorted in descending order by default.
  • top top-percentage —Displays the top TCAM entries, which are sorted by packet count, based on the specified percentage.

    Note 
    The valid values are from 1 to 100. The default value is 1%.
Step 2

show icam prediction entries acl module module inst inst year month day time [top top-percentage ]

Example:

switch# show icam prediction entries acl module 1 inst 0 2020 Jul 20 10:45:00 top 5

Displays the traffic prediction of TCAM entries:

  • year —Specifies the year in the YYYY format. The values range from 1970 to 2030.

  • month —Specifies the month as Jan, Feb, or so on.

    Note 
    The values are case-sensitive.
  • day —Specifies the day of the month in the DD format. The values range from 1 to 31.

  • time —Specifies the time in the HH:MM:SS format.

  • top top-percentage —Displays the top TCAM entries, which are sorted by packet count, based on the specified percentage.

    Note 
    Valid values are from 1 to 10. The default value is 1%.

Generating a Chord Diagram to View Complex Traffic Flows

You can use the output of the commands to generate a chord diagram. A chord diagram provides a simple view of complex traffic flows. You can identify an anomalous traffic flow using a chord diagram.

The following chord diagram is a simple representation of a complex traffic flow, where the traffic flow between the various sources and destinations is uniform.

Figure 5. Chord Diagram Representing Uniform Traffic Flow

The following example shows how to view the top 2% traffic flow of the TCAM entries for a current date.

switch# show icam entries acl module 1 inst 0 sort top 2

Retrieving data from linecard.  This may take some time ...
========================================================================================
TCAM Entries (Mod 1,Inst 0)
----------------------------------------------------------------------------------------
Feature  Pkt_Type   Source IP/Mask    Dest IP/Mask    Action      Interface        Stats
----------------------------------------------------------------------------------------
RACL     IPv4        ip 1.1.1.1/32      2.2.2.1/32     Permit   Ethernet1/17   109099390
RACL     IPv4      ip 1.1.1.100/32    2.2.2.100/32     Permit   Ethernet1/17    94447216
RACL     IPv4       ip 1.1.1.99/32     2.2.2.99/32     Permit   Ethernet1/17    94447210
RACL     IPv4       ip 1.1.1.98/32     2.2.2.98/32     Permit   Ethernet1/17    94447204
RACL     IPv4       ip 1.1.1.97/32     2.2.2.97/32     Permit   Ethernet1/17    94447198
RACL     IPv4       ip 1.1.1.96/32     2.2.2.96/32     Permit   Ethernet1/17    94447192
RACL     IPv4       ip 1.1.1.95/32     2.2.2.95/32     Permit   Ethernet1/17    94447186


The following figure shows the traffic flow that is generated using the output in this example:

Figure 6. Chord Diagram

Every arc in the chord diagram represents the traffic flow from a source address to a destination address. The thick end of the chord represents the source address and the thin end represents the destination address. The thickness of the arc represents the percentage of the traffic. The statistics field in the output of the show icam entries command shows the number of packets or traffic hitting a TCAM entry. You can view traffic from a single source to multiple destinations and from multiple sources to single destination.

The following figure shows an anomalous traffic flow:

Figure 7. Anomaly Visualization

In the figure, the arcs with traffic from 209.165.201.0 to 209.165.202.10 can be easily identified as an anomalous traffic pattern.

Example: Displaying Traffic Analytics of TCAM Entries

The example shows the historical view for the top 1% of TCAM entries monitored by iCAM, and filters the entries by feature name. The Stats column shows the total number of packets hitting the entry for the last two intervals. The Rate column shows the average traffic rate in packets per second for the last two intervals.

switch# show icam entries acl module 1 inst 0 history 2 sort filter RACL top 1
=========================================================================================
TCAM Entries (Mod 1,Inst 0): Cumulative stats for last 2 intervals
-----------------------------------------------------------------------------------------
Feature  Pkt_Type  Source IP/Mask  Dest IP/Mask  Action     Interface    Stats  Rate(pps)
-----------------------------------------------------------------------------------------
RACL     IPv4       ip 1.1.1.1/32    2.2.2.1/32   Permit  Ethernet1/17  359378      1497
RACL     IPv4       ip 1.1.1.2/32    2.2.2.2/32   Permit  Ethernet1/17  359378      1497
RACL     IPv4       ip 1.1.1.3/32    2.2.2.3/32   Permit  Ethernet1/17  359378      1497


This example shows a view of the top 10% of TCAM entries for a current date and filtered by feature name.

switch# show icam entries acl module 1 inst 0 sort filter RACL top 10

Retrieving data from linecard. This may take some time ...
======================================================================================
TCAM Entries (Mod 1,Inst 0)
--------------------------------------------------------------------------------------
Feature  Pkt_Type   Source IP/Mask   Dest IP/Mask   Action      Interface        Stats
--------------------------------------------------------------------------------------
RACL     IPv4       ip 1.1.1.95/32    2.2.2.95/32    Permit   Ethernet1/17   664347410
RACL     IPv4       ip 1.1.1.96/32    2.2.2.96/32    Permit   Ethernet1/17   664347410
RACL     IPv4       ip 1.1.1.97/32    2.2.2.97/32    Permit   Ethernet1/17   664347410
RACL     IPv4       ip 1.1.1.98/32    2.2.2.98/32    Permit   Ethernet1/17   664347410
RACL     IPv4       ip 1.1.1.99/32    2.2.2.99/32    Permit   Ethernet1/17   664347410
RACL     IPv4      ip 1.1.1.100/32   2.2.2.100/32    Permit   Ethernet1/17   664347410
RACL     IPv4       ip 1.1.1.86/32    2.2.2.86/32    Permit   Ethernet1/17   664347409
RACL     IPv4       ip 1.1.1.87/32    2.2.2.87/32    Permit   Ethernet1/17   664347409
RACL     IPv4       ip 1.1.1.88/32    2.2.2.88/32    Permit   Ethernet1/17   664347409
RACL     IPv4       ip 1.1.1.89/32    2.2.2.89/32    Permit   Ethernet1/17   664347409
RACL     IPv4       ip 1.1.1.90/32    2.2.2.90/32    Permit   Ethernet1/17   664347409
RACL     IPv4       ip 1.1.1.91/32    2.2.2.91/32    Permit   Ethernet1/17   664347409
RACL     IPv4       ip 1.1.1.92/32    2.2.2.92/32    Permit   Ethernet1/17   664347409
RACL     IPv4       ip 1.1.1.93/32    2.2.2.93/32    Permit   Ethernet1/17   664347409
RACL     IPv4       ip 1.1.1.94/32    2.2.2.94/32    Permit   Ethernet1/17   664347409
RACL     IPv4       ip 1.1.1.78/32    2.2.2.78/32    Permit   Ethernet1/17   664347408
RACL     IPv4       ip 1.1.1.79/32    2.2.2.79/32    Permit   Ethernet1/17   664347408
RACL     IPv4       ip 1.1.1.80/32    2.2.2.80/32    Permit   Ethernet1/17   664347408
RACL     IPv4       ip 1.1.1.81/32    2.2.2.81/32    Permit   Ethernet1/17   664347408
RACL     IPv4       ip 1.1.1.82/32    2.2.2.82/32    Permit   Ethernet1/17   664347408
RACL     IPv4       ip 1.1.1.83/32    2.2.2.83/32    Permit   Ethernet1/17   664347408
RACL     IPv4       ip 1.1.1.84/32    2.2.2.84/32    Permit   Ethernet1/17   664347408
RACL     IPv4       ip 1.1.1.85/32    2.2.2.85/32    Permit   Ethernet1/17   664347408
RACL     IPv4       ip 1.1.1.69/32    2.2.2.69/32    Permit   Ethernet1/17   664347407
RACL     IPv4       ip 1.1.1.70/32    2.2.2.70/32    Permit   Ethernet1/17   664347407


This example shows a view of current TCAM entries that are filtered by a feature name using the exact keyword.

switch# show icam entries acl module 1 inst 0 sort filter PBR exact top 100

Retrieving data from linecard. This may take some time ...
===================================================================================
TCAM Entries (Mod 1,Inst 0)
-----------------------------------------------------------------------------------
Feature  Pkt_Type   Source IP/Mask    Dest IP/Mask    Action      Interface   Stats
-----------------------------------------------------------------------------------
PBR      IPv4         ip 0.0.0.0/0     224.0.0.0/4     Permit   Ethernet1/19      0
PBR      IPv4       tcp 3.3.3.3/32       0.0.0.0/0   Redirect   Ethernet1/19      0
PBR      IPv4     ip 100.10.1.2/32      2.2.2.4/32   Redirect   Ethernet1/19      0
PBR      IPv4       udp 3.3.3.4/32      2.2.2.2/32   Redirect   Ethernet1/19      0
PBR      IPv4        ip 1.1.1.2/32      2.2.2.2/32   Redirect   Ethernet1/19      0
PBR      IPv4        ip 1.1.1.1/32      2.2.2.2/32   Redirect   Ethernet1/19      0
PBR      IPv4         ip 0.0.0.0/0       0.0.0.0/0     Permit   Ethernet1/19      0


This example shows a view of the history of TCAM entries that are monitored by iCAM. The Stats column shows the total number of packets hitting the entry for the last five intervals. The Rate column shows the average traffic rate in packets per second for the last five intervals.

switch# show icam entries acl module 1 inst 0 history 5

===========================================================================================
TCAM Entries (Mod 1,Inst 0): Cumulative stats for last 5 intervals
-------------------------------------------------------------------------------------------
Feature  Pkt_Type  Source IP/Mask  Dest IP/Mask   Action     Interface     Stats  Rate(pps)
-------------------------------------------------------------------------------------------
RACL     IPv4      ip 1.1.1.1/32     2.2.2.1/32   Permit  Ethernet1/17   8494611       471
RACL     IPv4      ip 1.1.1.2/32     2.2.2.2/32   Permit  Ethernet1/17   8494612       471
RACL     IPv4      ip 1.1.1.3/32     2.2.2.3/32   Permit  Ethernet1/17   8494612       471
RACL     IPv4      ip 1.1.1.4/32     2.2.2.4/32   Permit  Ethernet1/17   8494611       471
RACL     IPv4      ip 1.1.1.5/32     2.2.2.5/32   Permit  Ethernet1/17   8494611       471
RACL     IPv4     ip 1.1.1.20/32    2.2.2.20/32   Permit  Ethernet1/17   8494611       471
RACL     IPv4     ip 1.1.1.21/32    2.2.2.21/32   Permit  Ethernet1/17   8494611       471
RACL     IPv4     ip 1.1.1.22/32    2.2.2.22/32   Permit  Ethernet1/17   8494611       471
RACL     IPv4     ip 1.1.1.23/32    2.2.2.23/32   Permit  Ethernet1/17   8494611       471
RACL     IPv4       ip 0.0.0.0/0      0.0.0.0/0     Deny  Ethernet1/17 325164152     73620
RACL     IPv4      ip 2.2.2.1/32     1.1.1.1/32   Permit  Ethernet1/18    424732        23
RACL     IPv4      ip 2.2.2.2/32     1.1.1.2/32   Permit  Ethernet1/18    424732        23
RACL     IPv4      ip 2.2.2.3/32     1.1.1.3/32   Permit  Ethernet1/18    424732        23
RACL     IPv4      ip 2.2.2.4/32     1.1.1.4/32   Permit  Ethernet1/18    424732        23
RACL     IPv4      ip 2.2.2.5/32     1.1.1.5/32   Permit  Ethernet1/18    424732        23
RACL     IPv4      ip 2.2.2.6/32     1.1.1.6/32   Permit  Ethernet1/18    424732        23
RACL     IPv4      ip 2.2.2.2/32     1.1.1.1/32   Permit  Ethernet1/18         0         0
RACL     IPv4      ip 2.2.2.3/32     1.1.1.1/32   Permit  Ethernet1/18         0         0
RACL     IPv4      ip 2.2.2.4/32     1.1.1.1/32   Permit  Ethernet1/18         0         0
RACL     IPv4      ip 2.2.2.1/32     1.1.1.2/32   Permit  Ethernet1/18         0         0
RACL     IPv4       ip 0.0.0.0/0      0.0.0.0/0     Deny  Ethernet1/18  66258430      3681
QoS COPP IPv4      tcp 0.0.0.0/0      0.0.0.0/0 Redirect                       0         0
QoS COPP IPv4      tcp 0.0.0.0/0   224.0.0.0/24 Redirect                       0         0
QoS COPP IPv4      tcp 0.0.0.0/0      0.0.0.0/0 Redirect                       0         0
QoS COPP IPv4      tcp 0.0.0.0/0   224.0.0.0/24 Redirect                       0         0
QoS COPP IPv4       88 0.0.0.0/0      0.0.0.0/0 Redirect                       0         0
QoS COPP IPv4       88 0.0.0.0/0   224.0.0.0/24 Redirect                       0         0
QoS COPP IPv4       ip 0.0.0.0/0  224.0.1.39/32 Redirect                       0         0
QoS COPP IPv4       ip 0.0.0.0/0  224.0.1.40/32 Redirect                       0         0
QoS COPP IPv4      udp 0.0.0.0/0   224.0.0.0/24 Redirect                       0         0


This example displays the prediction for the usage statistics of TCAM entries on a module and an instance where iCAM monitoring is enabled.

switch# show icam prediction entries acl module 1 inst 0 2020 Nov 1 10:45:00

Generating predictions, this may take some time ...
===========================================================================================
TCAM Entries Prediction (Mod 1,Inst 0)
-------------------------------------------------------------------------------------------
Feature  Pkt_Type  Source IP/Mask  Dest IP/Mask  Action     Interface     Stats  Prediction
-------------------------------------------------------------------------------------------
RACL     IPv4     ip 1.1.1.100/32  2.2.2.100/32  Permit  Ethernet1/17  664515047  664694822
RACL     IPv4      ip 1.1.1.94/32   2.2.2.94/32  Permit  Ethernet1/17  664515046  664694822
RACL     IPv4      ip 1.1.1.92/32   2.2.2.92/32  Permit  Ethernet1/17  664515046  664694818
RACL     IPv4      ip 1.1.1.93/32   2.2.2.93/32  Permit  Ethernet1/17  664515046  664694822
RACL     IPv4      ip 1.1.1.99/32   2.2.2.99/32  Permit  Ethernet1/17  664515047  664694822


This example displays the predictive analytics of the top 2% TCAM entries.

switch# show icam prediction entries acl module 1 inst 0 2020 Nov 1 10:45:00 sort top 2

Generating predictions, this may take some time ...
===========================================================================================
TCAM Entries Prediction (Mod 1,Inst 0)                                                   
-------------------------------------------------------------------------------------------
Feature  Pkt_Type  Source IP/Mask  Dest IP/Mask  Action     Interface     Stats  Prediction
-------------------------------------------------------------------------------------------
RACL     IPv4       ip 1.1.1.1/32    2.2.2.2/32  Permit  Ethernet1/17  279886055  279886080
RACL     IPv4      ip 1.1.1.10/32   2.2.2.10/32  Permit  Ethernet1/17   93274142  100204095
RACL     IPv4       ip 1.1.1.2/32    2.2.2.2/32  Permit  Ethernet1/17   93274093   98354091
RACL     IPv4       ip 1.1.1.3/32    2.2.2.3/32  Permit  Ethernet1/17   93274099   98575099
RACL     IPv4       ip 1.1.1.4/32    2.2.2.4/32  Permit  Ethernet1/17   93274105   98811092


Displaying Current, Historical, and Predictive TCAM Resource per Feature

To view the predictive analytics on the resources and entries using iCAM, use the following commands:

SUMMARY STEPS

  1. show icam resource module module inst instance [history num-intervals]
  2. show icam resource { | } module module inst instance [history num-intervals]
  3. show icam prediction resource module module inst inst year month day time
  4. show icam prediction resource { | } module module inst inst year month day time

DETAILED STEPS

  Command or Action Purpose
Step 1

show icam resource module module inst instance [history num-intervals]

Example:

Example:

Displays analytics per module and per instance for resources.

  • history —Displays historical snapshots of resource usage for the specified number of intervals.

  • num-intervals—Number of intervals in the history.

Step 2

show icam resource { | } module module inst instance [history num-intervals]

Example:

Example:

Example:

Example:

Displays analytics per module and per instance for resources.

  • history —Displays historical snapshots of resource usage for the specified number of intervals.

  • num-intervals—Number of intervals in the history.

Step 3

show icam prediction resource module module inst inst year month day time

Example:

  • year —Specifies the year in the YYYY format. The values range from 1970 to 2030.

  • month —Specifies the month as Jan, Feb, or so on.

    Note 
    The values are case sensitive.
  • day —Specifies the day of the month in the DD format. The values range from 1 to 31.

  • time —Specifies the time in the HH:MM:SS format.

Step 4

show icam prediction resource { | } module module inst inst year month day time

Example:

Example:

  • year —Specifies the year in the YYYY format. The values range from 1970 to 2030.

  • month —Specifies the month as Jan, Feb, or so on.

    Note 
    The values are case sensitive.
  • day —Specifies the day of the month in the DD format. The values range from 1 to 31.

  • time —Specifies the time in the HH:MM:SS format.

Generating Charts or Graphs to View Predictive Resource Usage

Using the output of predictive commands, you can generate a donut chart or a bar graph. The following figure shows the TCAM resource usage per feature:

Figure 8. Donut Chart Representing TCAM Resource Usage per Feature

Example: Displaying TCAM Resource per Feature

This example shows a view of iCAM monitoring of the ACL TCAM resources for a current date.

switch# 
---------------------------------------------------------------------------------------
Feature Hardware Resource Utilization (Mod 1,Inst 0)
---------------------------------------------------------------------------------------
Ingress Resources
---------------------------------------------------------------------------------------
Feature TCAM# BANK# Feature_Entries   Free_Entries   Percent_Util     Timestamp (UTC)
---------------------------------------------------------------------------------------
RACL    1     1             244           1545          13.61 2017-10-18 17:22:27
PBR     1     1               1           1545           0.05 2017-10-18 17:22:27
CoPP    3     0             198             27          88.00 2017-10-18 17:22:27

Egress Resources
----------------------------------------------------------------------------------------
Feature TCAM# BANK# Feature_Entries   Free_Entries   Percent_Util     Timestamp (UTC)
----------------------------------------------------------------------------------------
RACL     8     1             457           1333          25.50 2017-10-18 27:22:27
========================================================================================
ACL TCAM Resource Utilization (Mod 1,Inst 0)
----------------------------------------------------------------------------------------
Used                    Free        Percent_Util  Timestamp (UTC)
-----------------------------------------------------------------------------------------
Tcam 0 Bank 0        0       0           0.00      2017-10-18 17:22:27
Tcam 0 Bank 1        0     256           0.00      2017-10-18 17:22:27
Tcam 0 Bank 2        0     256           0.00      2017-10-18 17:22:27
Tcam 0 Bank 3        0       0           0.00      2017-10-18 17:22:27
Tcam 1 Bank 0        0       0           0.00      2017-10-18 17:22:27
Tcam 1 Bank 1      247    1545          13.78      2017-10-18 17:22:27
Tcam 1 Bank 2        4     508           0.78      2017-10-18 17:22:27
Tcam 1 Bank 3        0     256           0.00      2017-10-18 17:22:27


This example shows the historical view of iCAM monitoring of ACL TCAM resource utilization as snapshots. Each snapshot displays the state of TCAM utilization in the corresponding time interval.

switch# 
-----------------------------------------------------------------------------------------
Feature Hardware Resource Utilization (Mod 1,Inst 0)
------------------------------------------------------------------------------------------
Ingress Resources
------------------------------------------------------------------------------------------
Feature TCAM# BANK# Feature_Entries   Free_Entries   Percent_Util     Timestamp (UTC)
------------------------------------------------------------------------------------------
RACL     1     1             250           1539          13.61        2017-10-18 21:28:17
254                                        1535          13.61        2017-10-18 22:28:17
244                                        1545          13.61        2017-10-18 23:28:17
CoPP     3     0            
198                                          27          88.00        2017-10-18 21:28:17
198                                          27          88.00        2017-10-18 22:28:17
198                                          27          88.00        2017-10-18 23:28:17
PBR     1     1               1            1545           0.05        2017-10-18 21:28:17
                              1            1545           0.05        2017-10-18 22:28:17
                              1            1545           0.05        2017-10-18 23:28:17

Egress Resources
-------------------------------------------------------------------------------------------
Feature TCAM# BANK# Feature_Entries   Free_Entries   Percent_Util     Timestamp (UTC)
-------------------------------------------------------------------------------------------
RACL     8     1             457           1333          25.50 2017-10-18 21:28:17
                             457           1333          25.50 2017-10-18 22:28:17
                             457           1333          25.50 2017-10-18 23:28:17


==========================================================================================
ACL TCAM Resource Utilization (Mod 1,Inst 0)
------------------------------------------------------------------------------------------
Used    Free   Percent_Util          Timestamp (UTC)
------------------------------------------------------------------------------------------
Tcam 0 Bank 0        
0       0           0.00      2017-10-18 21:28:17
0       0           0.00      2017-10-18 22:28:17
0       0           0.00      2017-10-18 23:28:17
Tcam 0 Bank 1        
0     256           0.00      2017-10-18 21:28:17 
0     256           0.00      2017-10-18 22:28:17
0     256           0.00      2017-10-18 23:28:17
Tcam 0 Bank 2        
0     256           0.00      2017-10-18 21:28:17 
0     256           0.00      2017-10-18 22:28:17
0     256           0.00      2017-10-18 23:28:17
Tcam 0 Bank 3        
0       0           0.00      2017-10-18 21:28:17
0       0           0.00      2017-10-18 22:28:17
0       0           0.00      2017-10-18 23:28:17

This example shows a view of iCAM monitoring of FIB TCAM resources.

switch# 

===============================================================================================
FIB TCAM Resource Utilization (Mod 1,Inst 0)
-----------------------------------------------------------------------------------------------
                     Type           Used            Max   Percent_Util          Timestamp (UTC)
-----------------------------------------------------------------------------------------------
         IPv4 Trie Routes              0         458752           0.00      2017-11-07 21:27:56
         IPv4 TCAM Routes             11           6144           0.17      2017-11-07 21:27:56
  IPv4 Native Host Routes            713          65536           1.08      2017-11-07 21:27:56
           IPv4 Multicast            254           8192           3.10      2017-11-07 21:27:56
         IPv6 Trie Routes              0         206438           0.00      2017-11-07 21:27:56
         IPv6 TCAM Routes              9           2048           0.43      2017-11-07 21:27:56
  IPv6 Native Host Routes              0          57344           0.00      2017-11-07 21:27:56
           IPv6 Multicast              1           2048           0.04      2017-11-07 21:27:56


This example shows a view of the history of iCAM monitoring of FIB TCAM resources.

switch# 

===============================================================================================
FIB TCAM Resource Utilization (Mod 1,Inst 0)
-----------------------------------------------------------------------------------------------
                     Type           Used            Max   Percent_Util          Timestamp (UTC)
-----------------------------------------------------------------------------------------------
         IPv4 Trie Routes              0         458752           0.00      2017-11-07 21:24:31
                                       0         458752           0.00      2017-11-07 22:24:31
                                       0         458752           0.00      2017-11-07 23:24:32
         IPv4 TCAM Routes             11           6144           0.17      2017-11-07 21:24:31
                                      11           6144           0.17      2017-11-07 22:24:31
                                      11           6144           0.17      2017-11-07 23:24:32
  IPv4 Native Host Routes            713          65536           1.08      2017-11-07 21:24:31
                                     713          65536           1.08      2017-11-07 22:24:31
                                     713          65536           1.08      2017-11-07 23:24:32
           IPv4 Multicast            254           8192           3.10      2017-11-07 21:24:31
                                     254           8192           3.10      2017-11-07 22:24:31
                                     254           8192           3.10      2017-11-07 23:24:32
         IPv6 Trie Routes              0         206438           0.00      2017-11-07 21:24:31
                                       0         206438           0.00      2017-11-07 22:24:31
                                       0         206438           0.00      2017-11-07 23:24:32
         IPv6 TCAM Routes              9           2048           0.43      2017-11-07 21:24:31
                                       9           2048           0.43      2017-11-07 22:24:31
                                       9           2048           0.43      2017-11-07 23:24:32
  IPv6 Native Host Routes              0          57344           0.00      2017-11-07 21:24:31
                                       0          57344           0.00      2017-11-07 22:24:31
                                       0          57344           0.00      2017-11-07 23:24:32
           IPv6 Multicast              1           2048           0.04      2017-11-07 21:24:31
                                       1           2048           0.04      2017-11-07 22:24:31
                                       1           2048           0.04      2017-11-07 23:24:32


This example displays the predictive analytics of the ACL TCAM resources.

switch# 
Generating predictions, this may take some time ...
----------------------------------------------------------------------------------------
Feature Hardware Resource Prediction (Mod 1,Inst 0)
----------------------------------------------------------------------------------------
Feature   Direction   TCAM#   BANK#   Feature_Entries    Free_Entries    Percent_Util
----------------------------------------------------------------------------------------
RACL     ingress       1       1               244            1545           13.61
CoPP     ingress       3       0               198              27           88.00
PBR      ingress       1       1                 1            1545            0.05
RACL      egress       8       1               457            1333           25.50
========================================================================================
ACL TCAM Resource Prediction (Mod 1,Inst 0)
----------------------------------------------------------------------------------------
Used    Free   Percent_Util
----------------------------------------------------------------------------------------
Tcam 11 Bank 1        0       0           0.00
Tcam 11 Bank 0        0       0           0.00
Tcam 11 Bank 3        0       0           0.00
Tcam 11 Bank 2        0       0           0.00
Tcam 10 Bank 1        0       0           0.00
Tcam 10 Bank 0      128     128          50.00

This example displays the predictive analytics of the FIB TCAM resources.

switch# 
Generating predictions, this may take some time ...

======================================================================
FIB TCAM Resource Prediction (Mod 1,Inst 0)
----------------------------------------------------------------------
                     Type           Used            Max   Percent_Util
----------------------------------------------------------------------
         IPv6 TCAM Routes              9           2048           0.43
           IPv6 Multicast              1           2048           0.04
         IPv6 Trie Routes              0         206438           0.00
  IPv6 Native Host Routes              0          57344           0.00
  IPv4 Native Host Routes            713          65536           1.08
         IPv4 Trie Routes              0         458752           0.00
         IPv4 TCAM Routes             11           6144           0.17
           IPv4 Multicast            254           8192           3.10

Explanation of the Display Outputs

When you enable iCAM monitoring for an entry or a resource, the corresponding traffic statistics or resources usage snapshot is stored in the database once for every interval.

This example shows the historical view of the TCAM entries that are monitored by iCAM. The Stats column shows the total number of packets hitting the entry for the last five intervals. The Rate column shows the average traffic rate in packets per second for the last five intervals.

switch# show icam entries acl module 1 inst 0 history 5

===========================================================================================
TCAM Entries (Mod 1,Inst 0): Cumulative stats for last 5 intervals
-------------------------------------------------------------------------------------------
Feature  Pkt_Type  Source IP/Mask  Dest IP/Mask   Action      Interface    Stats  Rate(pps)
-------------------------------------------------------------------------------------------
RACL     IPv4      ip 1.1.1.1/32     2.2.2.1/32   Permit  Ethernet1/17    8494611      471
RACL     IPv4      ip 1.1.1.2/32     2.2.2.2/32   Permit  Ethernet1/17    8494612      471
RACL     IPv4      ip 1.1.1.3/32     2.2.2.3/32   Permit  Ethernet1/17    8494612      471
RACL     IPv4      ip 1.1.1.4/32     2.2.2.4/32   Permit  Ethernet1/17    8494611      471
RACL     IPv4      ip 1.1.1.5/32     2.2.2.5/32   Permit  Ethernet1/17    8494611      471
RACL     IPv4     ip 1.1.1.20/32    2.2.2.20/32   Permit  Ethernet1/17    8494611      471
RACL     IPv4     ip 1.1.1.21/32    2.2.2.21/32   Permit  Ethernet1/17    8494611      471
RACL     IPv4     ip 1.1.1.22/32    2.2.2.22/32   Permit  Ethernet1/17    8494611      471
RACL     IPv4     ip 1.1.1.23/32    2.2.2.23/32   Permit  Ethernet1/17    8494611      471
RACL     IPv4       ip 0.0.0.0/0      0.0.0.0/0     Deny  Ethernet1/17  325164152    73620
RACL     IPv4      ip 2.2.2.1/32     1.1.1.1/32   Permit  Ethernet1/18     424732       23
RACL     IPv4      ip 2.2.2.2/32     1.1.1.2/32   Permit  Ethernet1/18     424732       23
RACL     IPv4      ip 2.2.2.3/32     1.1.1.3/32   Permit  Ethernet1/18     424732       23
RACL     IPv4      ip 2.2.2.4/32     1.1.1.4/32   Permit  Ethernet1/18     424732       23
RACL     IPv4      ip 2.2.2.5/32     1.1.1.5/32   Permit  Ethernet1/18     424732       23
RACL     IPv4      ip 2.2.2.6/32     1.1.1.6/32   Permit  Ethernet1/18     424732       23
RACL     IPv4      ip 2.2.2.2/32     1.1.1.1/32   Permit  Ethernet1/18          0        0
RACL     IPv4      ip 2.2.2.3/32     1.1.1.1/32   Permit  Ethernet1/18          0        0
RACL     IPv4      ip 2.2.2.4/32     1.1.1.1/32   Permit  Ethernet1/18          0        0
RACL     IPv4      ip 2.2.2.1/32     1.1.1.2/32   Permit  Ethernet1/18          0        0
RACL     IPv4       ip 0.0.0.0/0      0.0.0.0/0     Deny  Ethernet1/18   66258430     3681
QoS COPP IPv4      tcp 0.0.0.0/0      0.0.0.0/0 Redirect                        0        0
QoS COPP IPv4      tcp 0.0.0.0/0   224.0.0.0/24 Redirect                        0        0
QoS COPP IPv4      tcp 0.0.0.0/0      0.0.0.0/0 Redirect                        0        0
QoS COPP IPv4      tcp 0.0.0.0/0   224.0.0.0/24 Redirect                        0        0
QoS COPP IPv4       88 0.0.0.0/0      0.0.0.0/0 Redirect                        0        0
QoS COPP IPv4       88 0.0.0.0/0   224.0.0.0/24 Redirect                        0        0
QoS COPP IPv4       ip 0.0.0.0/0  224.0.1.39/32 Redirect                        0        0
QoS COPP IPv4       ip 0.0.0.0/0  224.0.1.40/32 Redirect                        0        0
QoS COPP IPv4      udp 0.0.0.0/0   224.0.0.0/24 Redirect                        0        0


This example shows the historical view of the TCAM resource utilization as snapshots. Each snapshot displays the state of TCAM utilization in the corresponding time interval.

switch# 
---------------------------------------------------------------------------------------------
Feature Hardware Resource Utilization (Mod 1,Inst 0)
---------------------------------------------------------------------------------------------
Ingress Resources
---------------------------------------------------------------------------------------------        
Feature TCAM# BANK# Feature_Entries   Free_Entries   Percent_Util     Timestamp (UTC)
---------------------------------------------------------------------------------------------       
RACL     1     1     250               1539          13.61             2017-10-18 21:28:17
                     254               1535          13.61             2017-10-18 22:28:17
                     244               1545          13.61             2017-10-18 23:28:17
CoPP     3     0     198                 27          88.00             2017-10-18 21:28:17
                     198                 27          88.00             2017-10-18 22:28:17
                     198                 27          88.00             2017-10-18 23:28:17 
PBR      1     1       1               1545           0.05             2017-10-18 21:28:17
                       1               1545           0.05             2017-10-18 22:28:17
                       1               1545           0.05             2017-10-18 23:28:17
Egress Resources
---------------------------------------------------------------------------------------------
Feature TCAM# BANK# Feature_Entries   Free_Entries   Percent_Util     Timestamp (UTC)
--------------------------------------------------------------------------------------------- 
RACL     8     1    457               1333            25.50           2017-10-18 21:28:17
                    457               1333            25.50           2017-10-18 22:28:17
                    457               1333            25.50           2017-10-18 23:28:17
=============================================================================================
ACL TCAM Resource Utilization (Mod 1,Inst 0)
--------------------------------------------------------------------------------------------- 
Used    Free   Percent_Util          Timestamp (UTC)
---------------------------------------------------------------------------------------------
Tcam 0  Bank 0     
0       0           0.00      2017-10-18 21:28:17
0       0           0.00      2017-10-18 22:28:17
0       0           0.00      2017-10-18 23:28:17
Tcam 0 Bank 1        
0     256           0.00      2017-10-18 21:28:17
0     256           0.00      2017-10-18 22:28:17
0     256           0.00      2017-10-18 23:28:17
Tcam 0 Bank 2        
0     256           0.00      2017-10-18 21:28:17
0     256           0.00      2017-10-18 22:28:17
0     256           0.00      2017-10-18 23:28:17
Tcam 0 Bank 3        
0       0           0.00      2017-10-18 21:28:17
0       0           0.00      2017-10-18 22:28:17
0       0           0.00      2017-10-18 23:28:17

Example: Obtaining JSON Outputs for iCAM Configurations

This example shows how to view top 1% RACL entries for a current date in JSON format.

switch# show icam entries acl module 1 inst 0 sort filter RACL top 1 | json-pretty
{                                                                                                       
    "module": "1",                                                                                      
    "instance": "0",                                                                                    
    "TABLE_ACL_entries": {                                                                              
        "ROW_ACL_entries": [                                                                            
            {                                                                                           
                "Feature": "RACL",                                                                      
                "Pkt_Type": "IPv4",                                                                     
                "SourceIP_Mask_DestIP_Mask": "ip 0.0.0.0/0 0.0.0.0/0",                                  
                "Action": "Deny",                                                                       
                "Intf_name": "Ethernet1/17",                                                                
                "Stats": "6124597284"                                                                  
            },                                                                                          
            {                                                                                           
                "Feature": "RACL",                                                                      
                "Pkt_Type": "IPv4",                                                                     
                "SourceIP_Mask_DestIP_Mask": "ip 0.0.0.0/0 0.0.0.0/0",                                  
                "Action": "Deny",                                                                       
                "Intf_name": "Ethernet1/17",                                                                
                "Stats": "306239019"                                                                    
            },                                                                                          
            {                                                                                           
                "Feature": "RACL",                                                                      
                "Pkt_Type": "IPv4",                                                                     
                "SourceIP_Mask_DestIP_Mask": "ip 1.1.1.100/32 2.2.2.100/32",                          
                "Action": "Permit",                                                                   
                "Intf_name": "Ethernet1/17",                                                               
                "Stats": "39260103"                                                                     
            },                                                                                          
            {                                                                                           
                "Feature": "RACL",                                                                      
                "Pkt_Type": "IPv4",                                                                     
                "SourceIP_Mask_DestIP_Mask": "ip 1.1.1.99/32 2.2.2.99/32",                              
                "Action": "Permit",                                                                     
                "Intf_name": "Ethernet1/17",                                                                
                "Stats": "39260096"                                                                     
            },                                                                                           
            {                                                                                            
                "Feature": "RACL",                                                                       
                "Pkt_Type": "IPv4",                                                                      
                "SourceIP_Mask_DestIP_Mask": "ip 1.1.1.98/32 2.2.2.98/32",                               
                "Action": "Permit",                                                                      
                "Intf_name": "Ethernet1/17",                                                                 
                "Stats": "39260090"                                                                      
            }                                                                                            
        ]                                                                                                
    }                                                                                                    
}

This example shows how to view iCAM monitoring of the FIB TCAM resources for a current date in JSON format.

switch# 
{                                                       
    "module": "1",                                      
    "instance": "0",                                    
    "TABLE_fib_resource": {                             
        "ROW_fib_resource": [                           
            {                                           
                "Class": "IPv4 Trie Routes",            
                "TABLE_fib_stats": {                    
                    "ROW_fib_stats": {                  
                        "Used_Entries": "0",            
                        "Max_Entries": "458752",        
                        "Percent_Util": "0.00",         
                        "Timestamp": "2017-10-26 18:54:20"
                    }                                     
                }                                         
            },                                            
            {                                             
                "Class": "IPv4 TCAM Routes",              
                "TABLE_fib_stats": {                      
                    "ROW_fib_stats": {                    
                        "Used_Entries": "11",             
                        "Max_Entries": "6144",            
                        "Percent_Util": "0.17",           
                        "Timestamp": "2017-10-26 18:54:20"
                    }                                     
                }                                         
            },                                            
            {                                             
                "Class": "IPv4 Native Host Routes",       
                "TABLE_fib_stats": {                      
                    "ROW_fib_stats": {                    
                        "Used_Entries": "713",            
                        "Max_Entries": "65536",           
                        "Percent_Util": "1.08",           
                        "Timestamp": "2017-10-26 18:54:20"
                    }                                     
                }                                         
            },                                            
            {                                             
                "Class": "IPv4 Multicast",                
                "TABLE_fib_stats": {                      
                    "ROW_fib_stats": {                    
                        "Used_Entries": "254",            
                        "Max_Entries": "8192",            
                        "Percent_Util": "3.10",           
                        "Timestamp": "2017-10-26 18:54:20"
                    }                                     
                }                                         
            },                                            
            {                                             
                "Class": "IPv6 Trie Routes",              
                "TABLE_fib_stats": {                      
                    "ROW_fib_stats": {                    
                        "Used_Entries": "0",              
                        "Max_Entries": "206438",          
                        "Percent_Util": "0.00",           
                        "Timestamp": "2017-10-26 18:54:20"
                    }                                     
                }                                         
            },
            {
                "Class": "IPv6 TCAM Routes",
                "TABLE_fib_stats": {
                    "ROW_fib_stats": {
                        "Used_Entries": "9",
                        "Max_Entries": "2048",
                        "Percent_Util": "0.43",
                        "Timestamp": "2017-10-26 18:54:20"
                    }
                }
            },
            {
                "Class": "IPv6 Native Host Routes",
                "TABLE_fib_stats": {
                    "ROW_fib_stats": {
                        "Used_Entries": "0",
                        "Max_Entries": "57344",
                        "Percent_Util": "0.00",
                        "Timestamp": "2017-10-26 18:54:20"
                    }
                }
            },
            {
                "Class": "IPv6 Multicast",
                "TABLE_fib_stats": {
                    "ROW_fib_stats": {
                        "Used_Entries": "1",
                        "Max_Entries": "2048",
                        "Percent_Util": "0.04",
                        "Timestamp": "2017-10-26 18:54:20"
                    }
                }
            }
        ]
    }
}

About Streaming Telemetry

Telemetry is an automated communications process where measurements and other data is collected at remote or inaccessible points and transmitted to receiving equipment for monitoring. In streaming network routing telemetry, devices stream data with incremental updates, thus helping to optimize, monitor, troubleshoot, and provide predictive analytics about traffic.

You can use the NX API feature to send iCAM CLI output to any server outside of the switch. You must configure the destination address and port and specify the CLI you want to send.

NX API uses either the HTTP or Google Remote Procedure Call (gRPC) as a transport medium. The CLIs are encoded using Google Protocol Buffer (GPB) or JSON.

You must enable the telemetry feature to configure streaming. You can configure a set of CLI commands to execute and the frequency of sending the desired CLI output.

You must also configure a telemetry receiver or an application that stores the telemetry data with a corresponding port open. You can verify the telemetry receiver using the show telemetry policies CLI command. The streaming telemetry receiver receives the data at the frequency that is configured in the policy file.

The following example shows a cadence-based collection of show iCAM data that is collected at 750-second intervals: