Optimized Edge Routing Configuration Guide, Cisco IOS Release 12.2SX
Bias-Free Language
The documentation set for this product strives to use bias-free language. For the purposes of this documentation set, bias-free is defined as language that does not imply discrimination based on age, disability, gender, racial identity, ethnic identity, sexual orientation, socioeconomic status, and intersectionality. Exceptions may be present in the documentation due to language that is hardcoded in the user interfaces of the product software, language used based on RFP documentation, or language that is used by a referenced third-party product. Learn more about how Cisco is using Inclusive Language.
- Updated:
- October 12, 2011
Chapter: Measuring the Traffic Class Performance and Link Utilization Using OER
- Finding Feature Information
- Prerequisites for Measuring the Traffic Class Performance and Link Utilization Using OER
- Information About Measuring the Traffic Class Performance and Link Utilization Using OER
- How to Measure the Traffic Class Performance and Link Utilization Using OER
- Modifying the OER Link Utilization for Outbound Traffic
- Modifying the OER Link Utilization for Inbound Traffic
- Modifying the OER Exit Link Utilization Range
- Modifying the OER Entrance Link Utilization Range
- Configuring and Verifying OER Passive Monitoring
- Configuring OER Active Probing Using the Longest Match Target Assignment
- Configuring OER Voice Probes with a Forced Target Assignment
- Configuring OER Voice Probes for Fast Failover
- Configuring Exit Link Load Balancing Using OER
- Configuring the Source Address of an Active Probe
- Configuration Examples for Measuring the Traffic Class Performance and Link Utilization Using OER
- Modifying the OER Link Utilization for Outbound Traffic Example
- Modifying the OER Link Utilization for Inbound Traffic Example
- Modifying the OER Exit Link Utilization Range Example
- Modifying the OER Entrance Link Utilization Range Example
- Active Probing Examples
- Configuring OER Active Probing Using the Longest Match Target Assignment Examples
- Configuring Active Probing with a Forced Target Assignment Examples
- Configuring OER Voice Probes for Fast Failover Example
- Configuring the Source Address of an Active Probe Example
- Where to Go Next
- Additional References
- Feature Information for Measuring the Traffic Class Performance and Link Utilization Using OER
Measuring the Traffic Class Performance and Link Utilization Using OER
This module describes the Cisco IOS Optimized Edge Routing (OER) measure phase, which is the second step in the OER performance loop. In the measure phase, OER monitors the performance metrics of the traffic class entries that were identified during the OER profile phase. OER also monitors the link utilization in the measure phase. Monitoring is the act of measurement and comparison against a threshold to determine the occurrence of an out-of-policy (OOP) event. OER uses two types of measurement; active and passive monitoring.
- Finding Feature Information
- Prerequisites for Measuring the Traffic Class Performance and Link Utilization Using OER
- Information About Measuring the Traffic Class Performance and Link Utilization Using OER
- How to Measure the Traffic Class Performance and Link Utilization Using OER
- Configuration Examples for Measuring the Traffic Class Performance and Link Utilization Using OER
- Where to Go Next
- Additional References
- Feature Information for Measuring the Traffic Class Performance and Link Utilization Using OER
Finding Feature Information
Your software release may not support all the features documented in this module. For the latest feature information and caveats, see the release notes for your platform and software release. To find information about the features documented in this module, and to see a list of the releases in which each feature is supported, see the Feature Information Table at the end of this document.
Use Cisco Feature Navigator to find information about platform support and Cisco software image support. To access Cisco Feature Navigator, go to www.cisco.com/go/cfn. An account on Cisco.com is not required.
Prerequisites for Measuring the Traffic Class Performance and Link Utilization Using OER
- Before implementing traffic class performance monitoring using OER, you need to understand and configure a basic OER-managed network. See the Cisco IOS Optimized Edge Routing Overview and Setting Up OER Network Components modules for more details.
- If you are following the OER performance loop we recommend that you understand and configure tasks in the Using OER to Profile the Traffic Classes module before attempting the tasks in this module.
Information About Measuring the Traffic Class Performance and Link Utilization Using OER
OER Measure Phase
The OER measure phase is the second step in the OER performance loop and it follows the OER profile phase where the traffic class entries fill the Monitored Traffic Class (MTC) list. The MTC list is now full of traffic class entries and OER must measure the performance metrics of these traffic class entries. Monitoring is defined here as the act of measurement performed periodically over a set interval of time where the measurements are compared against a threshold. OER measures the performance of traffic classes using active and passive monitoring techniques but it also measures, by default, the utilization of links. The master controller can be configured to monitor learned and configured traffic classes. The border routers collect passive monitoring and active monitoring statistics and then transmit this information to the master controller. The OER measure phase is complete when each traffic class entry in the MTC list has associated performance metric measurements.
The overall structure of the OER measure phase and its component parts can be seen in the diagram below.
| Figure 1 | OER Performance Measuring Process |

OER measures the performance of both traffic classes and links, but before monitoring a traffic class or link OER checks the state of the traffic class or link. OER uses a policy decision point (PDP) that operates according to the traffic class state transition diagram shown in the diagram below. In some states, OER does not initiate monitoring. The state transition diagram in the diagram below contains the following states:
- Default--A traffic class is placed in the default state when it is not under OER control. Traffic classes are placed in the default state when they are initially added to the central policy database, the MTC. A traffic class will transition into and out of the default state depending on performance measurements, timers, and policy configuration.
- Choose Exit--This is a temporary state in which the PDP compares the current state of the traffic class against its policy settings and chooses the optimal exit for the traffic class. OER will try to keep a traffic class flowing through its current exit but, as in the default state, performance measurements, timers, and policy configurations can cause the master controller to place a traffic class in this state for the duration of the exit link selection process. The traffic class remains in the choose exit state until it is moved to the new exit.
- Holddown--A traffic class is placed in the holddown state when the master controller requests a border router to forward the traffic class to be monitored using probes. Measurements are collected for the selected traffic class until the holdown timer expires unless the exit used by this traffic class is declared unreachable. If the exit is unreachable, the traffic class transitions back to the choose exit state.
| Figure 2 | OER Traffic Class State Transition Diagram |

- In-Policy--After performance measurements are compared against default or user-defined policy settings and an exit selection is made, the traffic class enters an in-policy state. When a traffic class is in the in-policy state, the traffic class is forwarded through an exit that satisfies the default or user-defined settings. The master controller continues to monitor the traffic class, but no action is taken until the periodic timer expires, or an out-of-policy message is received from a measurement collector, when the traffic class transitions back to the choose exit state.
- Out-of-Policy (OOP)--A traffic class is placed in this state when there are no exits through which to forward the traffic class that conform to default or user-defined policies. While the traffic class is in this state, the backoff timer controls exiting from this state. Each time the traffic class enters this state, the amount of time the traffic class spends in this state increases. The timer is reset for a traffic class when the traffic class enters an in-policy state. If all exit links are out-of-policy, the master controller may select the best available exit.
After determining the state of the traffic class or link, OER may initiate one of the following performance measuring processes:
OER Traffic Class Performance Measurement
OER uses three methods of traffic class performance measurement:
- Passive monitoring--measuring the performance metrics of traffic class entries while the traffic is flowing through the device using NetFlow functionality.
- Active monitoring--creating a stream of synthetic traffic replicating a traffic class as closely as possible and measuring the performance metrics of the synthetic traffic. The results of the performance metrics of the synthetic traffic are applied to the traffic class in the MTC list. Active monitoring uses integrated IP Service Level Agreements (IP SLAs) functionality.
- Both active and passive monitoring--combining both active and passive monitoring in order to generate a more complete picture of traffic flows within the network.
In Cisco IOS Release 12.4(15)T, another variation of the combined active and passive monitoring modes was introduced--fast failover monitoring mode. In fast failover monitoring mode, all exits are continuously probed using active monitoring and passive monitoring. When fast failover monitoring mode is enabled, the probe frequency can be set to a lower frequency than for other monitoring modes, to allow a faster failover capability.
No explicit NetFlow or IP SLAs configuration is required and support for NetFlow and IP SLAs is enabled automatically. You can use both active and passive monitoring methods for a traffic class.
After the master controller is defined and OER functionality is enabled, the master controller uses both passive and active monitoring by default. All traffic classes are passively monitored using integrated NetFlow functionality. Out-of-policy traffic classes are actively monitored using IP SLA functionality. You can configure the master controller to use only passive monitoring, active monitoring, both passive and active monitoring, or fast failover monitoring. The main differences between the different modes can be seen in the table below.
| Table 1 | Mode Comparison Table |
| Comparison Parameter |
Active Mode |
Passive Mode |
Combined Mode |
Fast Failover Mode |
|---|---|---|---|---|
| Release Introduced |
12.3(14)T |
12.3(14)T |
12.3(14)T |
12.4(15)T |
| Active/IP SLA |
Yes |
No |
Yes |
Yes |
| Passive/NetFlow |
No |
Yes |
Yes |
Yes |
| Monitoring of Alternate Paths |
On Demand |
On Demand |
On Demand |
Continuous |
| Best Failover Time |
10 seconds |
~ 1 minute |
~ 1.1 minute |
3 seconds |
| Support for Round Trip Delay |
Yes |
Yes |
Yes |
Yes |
| Support for Loss |
Only with Jitter probe |
Only for TCP traffic |
Only for TCP traffic |
Only for TCP traffic and Jitter probe |
| Support for Reachability |
Yes |
Only for TCP traffic |
Only for TCP traffic |
Yes |
| Support for Jitter |
Yes |
No |
No |
Yes |
| Support for MOS |
Yes |
No |
No |
Yes |
In Cisco IOS Release 12.2(33)SXH support for using a Cisco Catalyst 6500 series switch as an OER border router was introduced. In Cisco IOS Release 12.2(33)SRB support for using a Cisco 7600 series router as an OER border router was introduced. The master controller that communicates with the Cisco Catalyst 6500 switch or a Cisco 7600 series router being used as a border router must be a router running Cisco IOS Release 12.4(6)T or a later release because a special monitoring mode was introduced to support the limited capabilities for collecting passive statistics on the Catalyst 6500. The special mode is set globally and cannot be configured using the command-line interface (CLI). For more details, see OER Special Monitoring.
For more details about each of the monitoring methods, see the following concepts:
- OER Passive Monitoring
- OER Active Monitoring
- OER Combined Monitoring
- OER Fast Failover Monitoring
- OER Special Monitoring
OER Passive Monitoring
Cisco IOS OER uses NetFlow, an integrated technology in Cisco IOS software, to collect and aggregate passive monitoring statistics on a per traffic class basis. Passive monitoring is enabled along with active monitoring by default when an OER managed network is created. Passive monitoring can also be enabled explicitly using the mode monitor passive command. Netflow is a flow-based monitoring and accounting system, and NetFlow support is enabled by default on the border routers when passive monitoring is enabled.
Passive monitoring uses only existing traffic; additional traffic is not generated. Border routers collect and report passive monitoring statistics to the master controller approximately once per minute. If traffic does not go over an external interface of a border router, no data is reported to the master controller. Threshold comparison is done at the master controller. In Cisco IOS Release 12.4(6)T, passive monitoring is supported only for prefixes. In Cisco IOS Release 12.4(9)T, and later releases, passive monitoring supports traffic classes defined by prefix, port, protocol, and DSCP value.
OER uses passive monitoring to measure the following metrics for all the traffic classes:
- Delay--OER measures the average delay of TCP flows for a given prefix. Delay is the measurement of the round-trip response time (RTT) between the transmission of a TCP synchronization message and receipt of the TCP acknowledgement.
- Packet loss--OER measures packet loss by tracking TCP sequence numbers for each TCP flow. OER estimates packet loss by tracking the highest TCP sequence number. If a subsequent packet is received with a lower sequence number, OER increments the packet loss counter. Packet loss is measured in packets per million.
- Reachability--OER measures reachability by tracking TCP synchronization messages that have been sent repeatedly without receiving a TCP acknowledgement.
- Throughput--OER measures throughput by measuring the total number of bytes and packets for each traffic class for a given interval of time.
 Note |
Although all traffic classes are monitored, delay, loss, and reachability information is captured only for TCP traffic flows. Throughput statistics are captured for all non-TCP traffic flows. |
Passive monitoring of application traffic was introduced in Cisco IOS Release 12.4(9)T, and later releases, with application traffic class configuration support of the profiling of DSCP values as well as protocol and port numbers. DSCP values, port numbers, and protocols in addition to prefixes, are all now sent to the master controller. Passive monitoring statistics are gathered and stored in a prefix history buffer that can hold a minimum of 60 minutes of information depending on whether the traffic flow is continuous. OER uses this information to determine if the prefix is in-policy based on the default or user-defined policies. No alternative path analysis is performed as the traffic for a traffic class is flowing through one transit device in the network. If the traffic class goes OOP and only passive monitoring mode is enabled, the traffic class is moved to another point and the measurement repeated until a good or best exit is found. If the traffic class goes OOP and both passive and active monitoring modes are enabled, active probing is executed on all the exits and a best or good exit is selected. For more details on good and best exit selections, see the Configuring and Applying OER Policies module.
OER Active Monitoring
If OER passive monitoring techniques create too much overhead on a network device, or the performance metrics of a traffic class cannot be measured using the OER passive monitoring mode, then OER active monitoring techniques are performed. Active monitoring involves creating a stream of synthetic traffic that replicates a traffic class as closely as possible. The performance metrics of the synthetic traffic are measured and the results are applied to the traffic class entry in the MTC list. In Cisco IOS Release 12.4(6)T, and earlier releases, active monitoring supports traffic classes defined by prefix, port, and protocol. In Cisco IOS Release 12.4(9)T, 12.2(33)SRB, and later releases, active monitoring supports traffic classes defined by prefix, port, protocol, and DSCP value.
OER uses active monitoring to measure the following metrics for all the traffic classes:
- Delay--OER measures the average delay of TCP, UDP, and ICMP flows for a given prefix. Delay is the measurement of the round-trip response time (RTT) between the transmission of a TCP synchronization message and receipt of the TCP acknowledgement.
- Reachability--OER measures reachability by tracking TCP synchronization messages that have been sent repeatedly without receiving a TCP acknowledgement.
- Jitter--Jitter means interpacket delay variance. OER measures jitter by sending multiple packets to a target address and a specified target port number, and measuring the delay interval between packets arriving at the destination.
- MOS--Mean Opinion Score (MOS) is a standards-based method of measuring voice quality. Standards bodies like the ITU have derived two important recommendations: P.800 (MOS) and P.861 (Perceptual Speech Quality Measurement [PSQM]). P.800 is concerned with defining a method to derive a Mean Opinion Score of voice quality. MOS scores range between 1 representing the worst voice quality, and 5 representing the best voice quality. A MOS of 4 is considered "toll-quality" voice.
The creation of synthetic traffic in Cisco network devices is activated through the use of Cisco IOS IP SLA probes. OER is integrated with IP SLAs functionality such that OER will use IP SLA probes to actively monitor a traffic class. When active monitoring is enabled, the master controller commands the border routers to send active probes to set of target IP addresses. The border sends probe packets to no more than five target host addresses per traffic class, and transmits the probe results to the master controller for analysis.
IP SLA Active Probe Types Used by OER
IP SLAs are an embedded feature set in Cisco IOS software and they allow you to analyze IP service levels for IP applications and services, to increase productivity, to lower operational costs, and to reduce occurrences of network congestion or outages. IP SLAs use active traffic monitoring--the generation of traffic in a continuous, reliable, and predictable manner--for measuring network performance. The accuracy of measured data is enhanced by enabling the IP SLAs Responder, available in Cisco routers, on the destination device. For more details about IP SLAs, see the Cisco IOS IP SLAs Configuration Guide .
The following types of active probes can be configured:
- ICMP Echo--A ping is sent to the target address. OER uses ICMP Echo probes, by default, when an active probe is automatically generated. Configuring an ICMP echo probe does not require knowledgeable cooperation from the target device. However, repeated probing could trigger an Intrusion Detection System (IDS) alarm in the target network. If an IDS is configured in a target network that is not under your control, we recommend that you notify the administrator of this target network.
- Jitter--A jitter probe is sent to the target address. A target port number must be specified. A remote responder must be enabled on the target device, regardless of the configured port number. Jitter probe support was introduced in Cisco IOS Release 12.4(6)T and 12.2(33)SRB. In Cisco IOS Release 12.4(15)T support for loss policy was introduced for active monitoring if the jitter probe is used.
- TCP Connection--A TCP connection probe is sent to the target address. A target port number must be specified. A remote responder must be enabled if TCP messages are configured to use a port number other than TCP port number 23, which is well-known.
- UDP Echo--A UDP echo probe is sent to the target address. A target port number must be specified. A remote responder must be enabled on the target device, regardless of which port number is configured.
In Cisco IOS Release 12.4(9)T, 12.2(33)SRB, and later releases, OER marks the probe packets with the DSCP value by default if the monitored traffic classes have the DCSP field set to a nonzero value.
Creation of Active Probe for a Traffic Class
To create an active probe for a traffic class, a probe type has to be discovered, and a probe target assigned to the traffic class. To discover a probe type, OER uses one of the following methods:
- Learned probe--Active probes are automatically generated when a traffic class is learned using the NetFlow TopTalker Learn mechanism. Five targets are learned for each traffic class and, by default, the active probe is set as an ICMP echo probe.
- Configured probe--Active probes can also be configured on the master controller by specifying the probe type, target address and port if needed. Configured traffic classes can be configured to use any of the IP SLA active probes.
To assign a probe target for a traffic class, OER uses one of the following methods:
- Longest match--By default, OER assigns a probe target to the traffic class with the longest matching prefix in the MTC list. This is referred to as a default probe assignment.
- Forced assignment--An IP SLA probe can be configured using an OER map and the results of the probe are assigned to specific traffic classes associated with the OER map. This specific assignment of active probe results is called a forced target probe assignment.
The active probe is sourced from the border router and transmitted through an external interface (the external interface may, or may not, be the preferred route for an optimized prefix). When creating an active probe through an external interface for a specified target, the target should be reachable through the external interface. To test the reachability of the specified target, OER performs a route lookup in the BGP and static routing tables for the specified target and external interface. In Cisco IOS Release 12.4(24)T, Protocol Independent Route Optimization (PIRO) introduced the ability of OER to search for a parent route--an exact matching route, or a less specific route--in any IP Routing Information Base (RIB). The BGP routing table is searched first, followed by the static routing table, and finally the RIB.
In active monitoring mode, the probes are activated from all the border routers to find the best performance path for the specific traffic class. The active probes for that traffic class are not activated again unless the traffic class goes OOP.
In Cisco IOS Release 12.4(4)T and earlier releases, the frequency of an active probe used by OER was set to 60 seconds. In Cisco IOS Release 12.4(6)T and 12.2(33)SRB the frequency can be increased for each policy by configuring a lower time-interval between two probes. Increased probe frequency can reduce the response time and, for voice traffic, provide a better approximation of the MOS-low count percentage.
OER Active Probe Source Address
Support for the ability to configure an OER active probe source address was introduced in Cisco IOS Release 12.4(2)T and 12.2(33)SRB. By default, active probes use the source IP address of the OER external interface that transmits the probe. The active probe source address feature is configured on the border router. When this command is configured, the primary IP address of the specified interface is used as the active probe source. The active probe source interface IP address must be unique to ensure that the probe reply is routed back to the specified source interface. If the interface is not configured with an IP address, the active probe will not be generated. If the IP address is changed after the interface has been configured as an active probe source, active probing is stopped, and then restarted with the new IP address. If the IP address is removed after the interface has been configured as an active probe source, active probing is stopped and not restarted until a valid primary IP address is configured.
OER Voice Traffic Optimization Using Active Probes
In Cisco IOS Release 12.4(6)T support was introduced for outbound optimization of voice traffic using active probes on the basis of voice metrics such as delay, reachability, jitter, and Mean Opinion Score (MOS).
OER voice traffic optimization provides support for outbound optimization of voice traffic on the basis of the voice performance metrics such as delay, reachability, jitter, and MOS. Delay, reachability, jitter and MOS are important quantitative quality metrics for voice traffic, and these voice metrics are measured using OER active probes. In Cisco IOS Release 12.4(4)T and earlier releases, OER probes could measure delay and reachability, but not jitter and MOS. The IP SLA jitter probe is integrated with OER to measure jitter (source to destination) and the MOS score in addition to measuring delay and reachability. The jitter probe requires a responder on the remote side just like the UDP Echo probe. Integration of the IP SLA jitter probe type in OER enhances the ability of OER to optimize voice traffic. OER policies can be configured to set the threshold and priority values for the voice performance metrics: delay, reachability, jitter, and MOS.
Configuring an OER policy to measure jitter involves configuring only the threshold value and not relative changes (used by other OER features) because for voice traffic, relative jitter changes have no meaning. For example, jitter changes from 5 milliseconds to 25 milliseconds are just as bad in terms of voice quality as jitter changes from 15 milliseconds to 25 milliseconds. If the short-term average (measuring the last 5 minutes) jitter is higher than the jitter threshold, the prefix is considered out-of-policy due to jitter. OER then probes all exits, and the exit with the least jitter is selected as the best exit.
MOS policy works in a different way. There is no meaning to average MOS values, but there is meaning to the number of times that the MOS value is below the MOS threshold. For example, if the MOS threshold is set to 3.85 and if 3 out of 10 MOS measurements are below the 3.85 MOS threshold, the MOS-low-count is 30 percent. When OER runs a policy configured to measure MOS, both the MOS threshold value and the MOS-low-count percentage are considered. A prefix is considered out-of-policy if the short term (during the last 5 minutes) MOS-low-count percentage is greater than the configured value for a given MOS threshold. OER then probes all exits, and the exit with the highest MOS value is selected as the best exit.
OER Combined Monitoring
Cisco IOS OER can also be configured to combine both active and passive monitoring in order to generate a more complete picture of traffic flows within the network. There are some scenarios in which you may want to combine both OER monitoring modes.
One example scenario is when you want to learn traffic classes and then monitor them passively, but you also want to determine the alternate path performance metrics in order to control the traffic classes. The alternate path performance metrics, in the absence of the actual traffic flowing through the alternate path in the network, can be measured using the active probes. OER automates this process by learning traffic classes at five targets and probing through all the alternate paths using active probes.
OER Fast Failover Monitoring
In Cisco IOS Release 12.4(15)T, a new monitoring mode, fast monitoring, was introduced. Fast monitoring sets the active probes to continuously monitor all the exits (probe-all), and passive monitoring is enabled too. Fast failover monitoring can be used with all types of active probes: ICMP echo, Jitter, TCP connection, and UDP echo. When the mode monitor fast command is enabled, the probe frequency can be set to a lower frequency than for other monitoring modes, to allow a faster failover ability. Under fast monitoring with a lower probe frequency, route changes can be performed within 3 seconds of an out-of-policy situation. When an exit becomes OOP under fast monitoring, the select best exit is operational and the routes from the OOP exit are moved to the best in-policy exit. Fast monitoring is a very aggressive mode that incurs a lot of overhead with the continuous probing. We recommend that you use fast monitoring only for performance sensitive traffic. For example, a voice call is very sensitive to any performance problems or congested links, but the ability to detect and reroute the call within a few seconds can demonstrate the value of using fast monitoring mode.
OER Special Monitoring
In Cisco IOS Release 12.2(33)SXH support for using a Cisco Catalyst 6500 series switch as an OER border router was introduced. In Cisco IOS Release 12.2(33)SRB support for using a Cisco 7600 series router as an OER border router was introduced. Only border router functionality is included in the Cisco IOS Release 12.2(33)SXH and 12.2(33)SRB images; no master controller configuration is available. The master controller that communicates with the Cisco Catalyst 6500 series switch or a Cisco 7600 series router being used as a border router must be a router running Cisco IOS Release 12.4(6)T or a later release.
In Cisco IOS Release 12.4(6)T the OER master controller software was modified to support the limited capabilities for collecting passive statistics on a Cisco Catalyst 6500 switch or a Cisco 7600 series router used as a border router. If mode monitor active is configured on the master controller, no changes are made. If mode monitor passive or mode monitor both is configured, the master controller sends commands to each border router to determine if the border router can activate passive monitoring. If the master controller has mode monitor passive configured, and a Cisco Catalyst 6500 series switch or a Cisco 7600 series router is being used as a border router, the master controller changes the mode to a special mode because it cannot activate passive monitoring. If mode monitor both is configured on the master controller and at least one border router cannot activate passive monitoring then the master controller changes the mode to a special mode. The special mode is set globally and cannot be configured using the command-line interface (CLI). In the special mode only a subset of passive performance metrics--the ingress and egress bandwidth--are evaluated for a traffic class. Active monitoring at regular intervals using a periodic timer supplies the delay and reachability statistics.
When the special monitoring mode is set, the PDP--OER uses a policy decision point (PDP) that operates according to the traffic class state transition diagram shown in figure OER Traffic Class State Transition Diagram --examines probing results for delay and unreachability statistics when measuring the performance of a traffic class. Bandwidth calculations are considered, but loss is not supported.
OER Link Utilization Measurement
Link Utilization Threshold
After an external interface is configured for a border router, OER automatically monitors the utilization of the external link (an external link is an interface on a border router that typically links to a WAN). Every 20 seconds, by default, the border router reports the link utilization to the master controller. In Cisco IOS Release 12.4(6)T and prior releases, only egress (transmitted) traffic utilization values were reported, but in Cisco IOS Release 12.4(9)T, 12.2(33)SRB, and later releases, the ingress (received) traffic utilization values are also reported to the master controller. If the exit or entrance link utilization is above the default threshold of 75 percent, the exit or entrance link is in an OOP state and OER starts the monitoring process to find an alternative link for the traffic class. The link utilization threshold can be manually configured either as an absolute value in kilobytes per second (kbps) or as a percentage.
Link Utilization Range
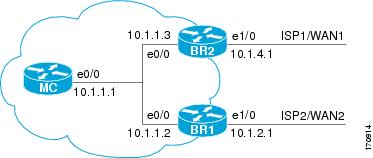
OER can also be configured to calculate the range of utilization over all the links. In Cisco IOS Release 12.4(6)T and prior releases, only egress (transmitted) traffic utilization range values were reported, but in Cisco IOS Release 12.4(9)T, 12.2(33)SRB, and later releases, the ingress (received) traffic utilization range values are also reported to the master controller. In the figure below there are two border routers with exits links to the Internet through two ISPs. The master controller determines which link on one of the border routers--either BR1 or BR2 in the figure below--is used by a traffic class.
| Figure 3 | OER network diagram |

OER range functionality attempts to keep the exit or entrance links within a utilization range, relative to each other to ensure that the traffic load is distributed. The range is specified as a percentage and is configured on the master controller to apply to all the exit or entrance links on border routers managed by the master controller. For example, if the range is specified as 25 percent, and the utilization of the exit link at BR1 (in the figure above) is 70 percent, then if the utilization of the exit link at BR2 (in the figure above) falls to 40 percent, the percentage range between the two exit links will be more than 25 percent and OER will attempt to move some traffic classes to use the exit link at BR1 to even the traffic load. If BR1 (in the figure above) is being configured as an entrance link, the link utilization range calculations work in the same way as for an exit link, except that the utilization values are for received traffic, not transmitted traffic.
How to Measure the Traffic Class Performance and Link Utilization Using OER
- Modifying the OER Link Utilization for Outbound Traffic
- Modifying the OER Link Utilization for Inbound Traffic
- Modifying the OER Exit Link Utilization Range
- Modifying the OER Entrance Link Utilization Range
- Configuring and Verifying OER Passive Monitoring
- Configuring OER Active Probing Using the Longest Match Target Assignment
- Configuring OER Voice Probes with a Forced Target Assignment
- Configuring OER Voice Probes for Fast Failover
- Configuring Exit Link Load Balancing Using OER
- Configuring the Source Address of an Active Probe
Modifying the OER Link Utilization for Outbound Traffic
Perform this task at the master controller to modify the OER exit (outbound) link utilization threshold. After an external interface has been configured for a border router, OER automatically monitors the utilization of external links on a border router every 20 seconds. The utilization is reported back to the master controller and, if the utilization exceeds 75 percent, OER selects another exit link for traffic classes on that link. An absolute value in kilobytes per second (kbps), or a percentage, can be specified.
To modify the link utilization threshold for inbound traffic, see the Modifying the OER Link Utilization for Inbound Traffic task.
DETAILED STEPS
Modifying the OER Link Utilization for Inbound Traffic
In Cisco IOS Release 12.4(9)T, 12.2(33)SRB, and later releases, the ability to report inbound traffic utilization to the master controller was introduced. Perform this task at the master controller to modify the OER entrance (inbound) link utilization threshold. After an external interface has been configured for a border router, OER automatically monitors the utilization of entrance links on a border router every 20 seconds. The utilization is reported back to the master controller and, if the utilization exceeds 75 percent, OER selects another entrance link for traffic classes on that link. An absolute value in kilobytes per second (kbps), or a percentage, can be specified. This task is configured in the same way as the Modifying the OER Link Utilization for Outbound Traffic task as an external interface can be used as either an exit link or an entrance link. The difference in the configuration for this task is the command that specifies the utilization threshold for inbound traffic.
This task requires the master controller and border routers to be running Cisco IOS Release 12.4(9)T, 12.2(33)SRB, or later release.
DETAILED STEPS
| Command or Action | Purpose | |||
|---|---|---|---|---|
|
|
Example: Router> enable |
Enables privileged EXEC mode. |
||
|
|
Example: Router# configure terminal |
Enters global configuration mode. |
||
|
|
Example: Router(config)# oer master |
Enters OER master controller configuration mode to configure a router as a master controller and to configure global operations and policies. |
||
|
|
Example: Router(config-oer-mc)# border 10.1.1.2 |
Enters OER-managed border router configuration mode to establish communication with a border router.
|
||
|
|
Example: Router(config-oer-mc-br)# interface Ethernet 1/0 external |
Configures a border router interface as an OER-managed external interface and enters OER border exit interface configuration mode.
Only the syntax relevant to this task is displayed. For more details, see the Cisco IOS Optimized Edge Routing Command Reference. |
||
|
|
Example: Router(config-oer-mc-br-if)# maximum utilization receive percent 90 |
Sets the maximum receive utilization threshold for the configured OER-managed link interface.
|
||
|
|
Example: Router(config-oer-mc-br-if)# end |
Exits OER border exit interface configuration mode and returns to privileged EXEC mode. |
Modifying the OER Exit Link Utilization Range
Perform this task at the master controller to modify the maximum exit link utilization range threshold over all the border routers. By default, OER automatically monitors the utilization of external links on a border router every 20 seconds, and the border router reports the utilization to the master controller. If the utilization range between all the exit links exceeds 20 percent, the master controller tries to equalize the traffic load by moving some traffic classes to another exit link. The maximum utilization range is configured as a percentage.
OER uses the maximum utilization range to determine if exit links are in-policy. OER will equalize outbound traffic across all exit links by moving traffic classes from overutilized or out-of-policy exits to in-policy exits.
To modify the link utilization range for entrance links, see the Modifying the OER Entrance Link Utilization Range task.
DETAILED STEPS
| Command or Action | Purpose | |
|---|---|---|
|
|
Example: Router> enable |
Enables privileged EXEC mode. |
|
|
Example: Router# configure terminal |
Enters global configuration mode. |
|
|
Example: Router(config)# oer master |
Enters OER master controller configuration mode to configure a router as a master controller and to configure global operations and policies. |
|
|
Example: Router(config-oer-mc)# max-range-utilization percent 25 |
Sets the maximum utilization range for all OER-managed exit link.s. |
|
|
Example: Router(config-oer-mc)# end |
Exits OER master controller configuration mode and returns to privileged EXEC mode. |
Modifying the OER Entrance Link Utilization Range
Perform this task at the master controller to modify the maximum entrance link utilization range over all the border routers. By default, OER automatically monitors the utilization of external links on a border router every 20 seconds, and the border router reports the utilization to the master controller. In Cisco IOS Release 12.4(9)T, 12.2(33)SRB, and later releases, the ability to report inbound traffic utilization to the master controller, and to specify a link utilization range for entrance links, was introduced. In this task, if the utilization range between all the entrance links exceeds 20 percent, the master controller tries to equalize the traffic load by moving some traffic classes to another entrance link. The maximum utilization range is configured as a percentage.
OER uses the maximum utilization range to determine if links are in-policy. In this task, OER will equalize inbound traffic across all entrance links by moving traffic classes from overutilized or out-of-policy exits to in-policy exits.
This task requires the master controller and border routers to be running Cisco IOS Release 12.4(9)T, 12.2(33)SRB, or later release.
DETAILED STEPS
| Command or Action | Purpose | |
|---|---|---|
|
|
Example: Router> enable |
Enables privileged EXEC mode.
|
|
|
Example: Router# configure terminal |
Enters global configuration mode. |
|
|
Example: Router(config)# oer master |
Enters OER master controller configuration mode to configure a router as a master controller and to configure global operations and policies. |
|
|
Example: Router(config-oer-mc)# max range receive percent 20 |
Specifies the upper limit of the receive utilization range between all the entrance links on the border routers.
|
|
|
Example: Router(config-oer-mc)# end |
Exits OER master controller configuration mode and returns to privileged EXEC mode. |
Configuring and Verifying OER Passive Monitoring
OER enables passive monitoring by default when an OER managed network is created, but there are times when passive monitoring is disabled. Use this task to configure passive monitoring and then verify that the passive monitoring is being performed. Perform this task on a border router to display passive measurement information collected by NetFlow for monitored prefixes or application traffic flows. These commands are entered on a border router through which the application traffic is flowing. The show commands can be entered in any order.
DETAILED STEPS
| Step 1 |
enable Enables privileged EXEC mode. Enter your password if prompted. Example:
Router> enable
|
||
| Step 2 |
configure terminal Enters global configuration mode. Example:
Router# configure terminal
|
||
| Step 3 |
oer master Enters OER master controller configuration mode to configure a router as a master controller and to configure global operations and policies. Example:
Router(config)# oer master
|
||
| Step 4 |
mode monitor {active | both| passive} Configures route monitoring or route control on an OER master controller. The monitor keyword is used to configure active monitoring, passive monitoring, or both active and passive monitoring. Passive monitoring is enabled when either the both or passive keywords are specified. In this example, passive monitoring is enabled.
Example:
Router(config-oer-mc)# mode monitor passive
|
||
| Step 5 |
end Exits OER master controller configuration mode and returns to privileged EXEC mode. Example:
Router(config-oer-mc)# end
|
||
| Step 6 |
show oer border passive cache {applications | learned[application] | prefix} This command is used to display real-time passive measurement information collected by NetFlow from the border router for OER monitored prefixes and traffic flows. The applications keyword displays information about the monitored application traffic classes, and the prefix keyword displays information about monitored prefixes. Using the learned and application keywords you can display information about learned applications. The following output shows the passive measurement information collected by NetFlow for monitored prefixes and traffic flows for the border router on which the show oer border passive cache prefix command was run: Example:
Router# show oer border passive cache prefix

OER Passive Prefix Cache, State: enabled, 278544 bytes
  1 active, 4095 inactive, 2 added
  82 ager polls, 0 flow alloc failures
  Active flows timeout in 1 minutes
  Inactive flows timeout in 15 seconds
IP Sub Flow Cache, 17416 bytes
  2 active, 1022 inactive, 4 added, 2 added to flow
  0 alloc failures, 0 force free
  1 chunk, 2 chunks added
Prefix              NextHop         Src If         Dst If
                     Flows   Pkts   B/Pk  Active   sDly   #Dly  PktLos #UnRch
------------------------------------------------------------------------------
10.1.5.0/24         10.1.2.2        Et0/0          Et1/0
                      381    527      40    65.5    300      2       10       1
The following output shows the passive measurement information collected by NetFlow for monitored application traffic flows for the border router on which the show oer border passive cache applications command was run: Example:
Router# show oer border passive cache applications
OER Passive Prefix Cache, State: enabled, 278544 bytes
  6 active, 4090 inactive, 384 added
  6438 ager polls, 0 flow alloc failures
  Active flows timeout in 1 minutes
  Inactive flows timeout in 15 seconds
IP Sub Flow Cache, 25800 bytes
  18 active, 1006 inactive, 1152 added, 384 added to flow
  0 alloc failures, 0 force free
  1 chunk, 1 chunk added
Prefix              NextHop         Src If         Dst If          Flows
 Prot  DSCP SrcPort         DstPort          Appl_ID
                      Pkts   B/Pk  Active   sDly   #Dly  PktLos  #UnRch
------------------------------------------------------------------------
10.1.1.0/24         10.1.1.2        Et8/0          Et0/0              1
17       ef [1, 65535]      [3000, 4000]     2
                        2      28    16.5      0      0       0       0
10.1.3.0/24         10.1.1.2        Et8/0          Et0/0              1
17       ef [1, 65535]      [3000, 4000]     1
                       16      28    19.9      0      0       0       0
|
||
| Step 7 |
show oer border passive prefixes This command is used to display passive measurement information collected by NetFlow for OER monitored prefixes and traffic flows. The following output shows the prefix that is being passively monitored by NetFlow for the border router on which the show oer border passive prefixes command was run: Example:
Router# show oer border passive prefixes

OER Passive monitored prefixes:
Prefix         Mask   Match Type
10.1.5.0 /24 exact |
Configuring OER Active Probing Using the Longest Match Target Assignment
Perform this task at the master controller to configure active probing using the longest match target assignment. Active monitoring is enabled with the mode monitor activeor mode monitor both commands, and the type of active probe is specified using the active-probe command. Active probes are configured with a specific host or target address and the active probes are sourced on the border router. The active probe source external interface may, or may not, be the preferred route for an optimized prefix. In this example, both active and passive monitoring are enabled and the target IP address of 10.1.5.1 is to be actively monitored using Internet Control Message Protocol (ICMP) echo (ping) messages. This task does not require an IP SLA responder to be enabled.
OER Active Probing Target Reachability
The active probe is sourced from the border router and transmitted through an external interface (the external interface may or may not be the preferred route for an optimized prefix). When creating an active probe through an external interface for a specified target, the target should be reachable through the external interface. To test the reachability of the specified target, OER performs a route lookup in the BGP and static routing tables for the specified target and external interface.
ICMP Echo Probes
Configuring an ICMP echo probe does not require knowledgeable cooperation from the target device. However, repeated probing could trigger an IDS alarm in the target network. If an IDS is configured in a target network that is not under your administrative control, we recommend that you notify the target network administration entity.
The following defaults are applied when active monitoring is enabled:
DETAILED STEPS
| Command or Action | Purpose | |||
|---|---|---|---|---|
|
|
Example: Router> enable |
Enables privileged EXEC mode. |
||
|
|
Example: Router# configure terminal |
Enters global configuration mode. |
||
|
|
Example: Router(config)# oer master |
Enters OER master controller configuration mode to configure a router as a master controller and to configure global operations and policies. |
||
|
|
Example: Router(config-oer-mc)# mode monitor both |
Configures route monitoring on an OER master controller.
|
||
|
|
Example: Router(config-oer-mc)# active-probe echo 10.1.5.1 |
Configures an active probe for a target prefix.
|
||
|
|
Example: Router(config-oer-mc)# end |
Exits OER master controller configuration mode and returns to privileged EXEC mode. |
Configuring OER Voice Probes with a Forced Target Assignment
Perform this task to enable active monitoring using OER jitter probes. Support for the jitter probe was introduced in Cisco IOS Release 12.4(6)T and 12.2(33)SRB. In this example, the traffic to be monitored is voice traffic, which is identified using an access list. The active voice probes are assigned a forced target for OER instead of the usual longest match assigned target. This task also demonstrates how to modify the OER probe frequency, another feature added in Cisco IOS Release 12.4(6)T and 12.2(33)SRB.
Before configuring the OER jitter probe on the source device, the IP SLAs Responder must be enabled on the target device (the operational target). The IP SLAs Responder is available only on Cisco IOS software-based devices. Start this task at the network device that runs the IP SLAs Responder.
Note |
The device that runs the IP SLAs Responder does not have to be configured for OER. |
Prerequisites
This task requires the master controller and border routers to be running Cisco IOS Release 12.4(6)T, 12.2(33)SRB, or later releases.
Jitter
Jitter means interpacket delay variance. When multiple packets are sent consecutively from source to destination, for example, 10 ms apart, and if the network is behaving ideally, the destination should be receiving them 10 ms apart. But if there are delays in the network (like queuing, arriving through alternate routes, and so on) the arrival delay between packets might be greater than or less than 10 ms. Using this example, a positive jitter value indicates that the packets arrived more than 10 ms apart. If the packets arrive 12 ms apart, then positive jitter is 2 ms; if the packets arrive 8 ms apart, then negative jitter is 2 ms. For delay-sensitive networks like VoIP, positive jitter values are undesirable, and a jitter value of 0 is ideal.
MOS
Mean Opinion Score (MOS) is a quantitative quality metric for voice traffic that can be measured using OER active probes. With all the factors affecting voice quality, many people ask how voice quality can be measured. Standards bodies like the ITU have derived two important recommendations: P.800 (MOS) and P.861 (Perceptual Speech Quality Measurement [PSQM]). P.800 is concerned with defining a method to derive a Mean Opinion Score of voice quality. MOS scores range between 1 representing the worst voice quality, and 5 representing the best voice quality. A MOS of 4 is considered "toll-quality" voice.
Before configuring this task, an access list must be defined. For an example access list and more details about configuring voice traffic using active probes, see the OER Voice Traffic Optimization Using Active Probes solution module.
DETAILED STEPS
| Command or Action | Purpose | |||
|---|---|---|---|---|
|
|
Example: Router> enable |
Enables privileged EXEC mode. |
||
|
|
Example: Router# configure terminal |
Enters global configuration mode. |
||
|
|
Example: Router(config)# ip sla monitor responder |
Enables the IP SLAs Responder. |
||
|
|
Example: Router(config)# exit |
Exits global configuration mode and returns to privileged EXEC mode. |
||
|
|
|
-- |
||
|
|
Example: Router> enable |
Enables privileged EXEC mode. |
||
|
|
Example: Router# configure terminal |
Enters global configuration mode. |
||
|
|
Example: Router(config)# oer master |
Enters OER master controller configuration mode to configure a router as a master controller and to configure global operations and policies. |
||
|
|
Example: Router(config-oer-mc)# mode monitor active |
Configures route monitoring on an OER master controller.
|
||
|
|
Example: Router(config-oer-mc)# exit |
Exits OER master controller configuration mode and returns to global configuration . |
||
|
|
Example: Router(config)# oer-map TARGET_MAP 10 |
Enters OER map configuration mode to configure an OER map to apply policies to selected IP prefixes. |
||
|
|
Example: Router(config-oer-map)# match ip address access-list VOICE_ACCESS_LIST |
References an extended IP access list or IP prefix as match criteria in an OER map. |
||
|
|
Example: Router(config-oer-map)# set active-probe jitter 10.20.22.1 target-port 2000 codec g729a |
Creates a set clause entry to assign a target prefix for an active probe.
|
||
|
|
Example: Router(config-oer-map)# set probe frequency 10 |
Creates a set clause entry to set the frequency of the OER active probe. |
||
|
|
Example: Router(config-oer-map)# set jitter threshold 20 |
Creates a set clause entry to configure the jitter threshold value. |
||
|
|
Example: Router(config-oer-map)# set mos threshold 4.0 percent 30 |
Creates a set clause entry to configure the MOS threshold and percentage values used to decide whether an alternate exit is be selected.
|
||
|
|
Example: Router(config-oer-map)# set delay threshold 100 |
Creates a set clause entry to configure the delay threshold.
|
||
|
|
Example: Router(config-oer-map)# end |
Exits OER map configuration mode and enters privileged EXEC mode. |
||
|
|
Example: Router# show oer master active-probes forced |
Displays connection and status information about active probes on an OER master controller.
|
Examples
This example shows output from the show oer master active-probes forced command. The output is filtered to display only connection and status information about the active probes generated for voice traffic configured with a forced target assignment.
Router# show oer master active-probes forced
OER Master Controller active-probes
Border   = Border Router running this Probe
Policy   = Forced target is configure under this policy
Type     = Probe Type
Target   = Target Address
TPort    = Target Port
N - Not applicable
The following Forced Probes are running:
Border          State    Policy             Type     Target          TPort
10.20.20.2     ACTIVE    40                 jitter   10.20.22.1      3050
10.20.21.3     ACTIVE    40                 jitter   10.20.22.4      3050
Configuring OER Voice Probes for Fast Failover
In Cisco IOS Release 12.4(15)T the ability to configure a fast monitoring mode was introduced. In fast failover monitoring mode, all exits are continuously probed using active monitoring and passive monitoring. The probe frequency can be set to a lower frequency in fast failover monitoring mode than for other monitoring modes, to allow a faster failover capability. Fast failover monitoring can be used with all types of active probes: ICMP echo, jitter, TCP connection, and UDP echo.
Perform this task to enable fast monitoring using OER jitter probes. Fast failover monitoring is designed for traffic classes that are very sensitive to performance issues or congested links, and voice traffic is very sensitive to any dropped links. In this example, the fast failover monitoring mode is enabled and the voice traffic to be monitored is identified using an IP prefix list. To reduce some of the overhead that fast failover monitoring produces, the active voice probes are assigned a forced target for OER. The OER probe frequency is set to 2 seconds. In the examples section after the task table, the show oer master prefix command is used to show the policy configuration for the prefix specified in the task steps and some logging output is displayed to show that fast failover is configured.
Note |
Fast monitoring is a very aggressive mode that incurs a lot of overhead with the continuous probing. We recommend that you use fast monitoring only for performance sensitive traffic. |
Before configuring the OER jitter probe on the source device, the IP SLAs Responder must be enabled on the target device (the operational target). The IP SLAs Responder is available only on Cisco IOS software-based devices. Start this task at the network device that runs the IP SLAs Responder.
Note |
The device that runs the IP SLAs Responder does not have to be configured for OER. |
This task requires the master controller and border routers to be running Cisco IOS Release 12.4(15)T, or later releases.
DETAILED STEPS
| Command or Action | Purpose | |||
|---|---|---|---|---|
|
|
Example: Router> enable |
Enables privileged EXEC mode. |
||
|
|
Example: Router# configure terminal |
Enters global configuration mode. |
||
|
|
Example: Router(config)# ip sla monitor responder |
Enables the IP SLAs Responder. |
||
|
|
Example: Router(config)# exit |
Exits global configuration mode and returns to privileged EXEC mode. |
||
|
|
|
-- |
||
|
|
Example: Router> enable |
Enables privileged EXEC mode. |
||
|
|
Example: Router# configure terminal |
Enters global configuration mode. |
||
|
|
Example: Router(config)# ip prefix-list VOICE_FAIL_LIST permit 10.1.0.0/24 |
Creates an IP prefix list. |
||
|
|
|
-- |
||
|
|
Example: Router(config)# oer-map FAST_FAIL_MAP 10 |
Enters OER map configuration mode to configure an OER map to apply policies to selected IP prefixes. |
||
|
|
Example: Router(config-oer-map)# match traffic-class prefix-list VOICE_FAIL_LIST |
References an IP prefix list as traffic class match criteria in an OER map. |
||
|
|
Example: Router(config-oer-map)# set mode monitor fast |
Creates a set clause entry to configure route monitoring on an OER master controller.
|
||
|
|
Example: Router(config-oer-map)# set jitter threshold 12 |
Creates a set clause entry to configure the jitter threshold value. |
||
|
|
Example: Router(config-oer-map)# set mos threshold 3.6 percent 30 |
Creates a set clause entry to configure the MOS threshold and percentage values used to decide whether an alternate exit is be selected.
|
||
|
|
Example: Router(config-oer-map)# set delay relative 50 |
Creates a set clause entry to configure the delay threshold.
|
||
|
|
Example: Router(config-oer-map)# set active-probe jitter 10.120.120.1 target-port 20 codec g729a |
Creates a set clause entry to assign a target prefix for an active probe.
|
||
|
|
Example: Router(config-oer-map)# set probe frequency 2 |
Creates a set clause entry to set the frequency of the OER active probe.
|
||
|
|
Example: Router(config-oer-map)# end |
Exits OER map configuration mode and enters privileged EXEC mode. |
||
|
|
Example: Router# show oer master prefix 10.1.1.0/24 policy |
(Optional) Displays the status of monitored prefixes.
|
Examples
This example shows output from the show oer master prefixcommand when a prefix is specified with the policy keyword to display the policy configured for the prefix 10.1.1.0/24. Note that the mode monitor is set to fast, which automatically sets the select-exit to best, and allows the probe frequency to be set at 2.
Router# show oer master prefix 10.1.1.0/24 policy
* Overrides Default Policy Setting
oer-map MAP 10
  sequence no. 8444249301975040, provider id 1, provider priority 30
    host priority 0, policy priority 10, Session id 0
  match ip prefix-lists: VOICE_FAIL_LIST
  backoff 90 90 90
  delay relative 50
  holddown 90
  periodic 0
 *probe frequency 2
  mode route control
 *mode monitor fast
 *mode select-exit best
  loss relative 10
 *jitter threshold 12
  mos threshold 3.60 percent 30
  unreachable relative 50
  next-hop not set
  forwarding interface not set
  resolve jitter priority 1 variance 10
  resolve utilization priority 12 variance 20

  Forced Assigned Target List:
   active-probe jitter 10.120.120.1 target-port 20 codec g729a
After the master controller is configured for fast failover as shown in this task, and a traffic class goes out of policy, the logging output below shows that the traffic class represented by prefix 10.1.1.0 is routed by OER through a new border router exit at interface 10.3.3.4 within 3 seconds. From the logging output, it appears that the traffic class moved to an out-of-policy state due to the jitter threshold being exceeded.
May  2 10:55:27.355: %OER_MC-5-NOTICE: Active ABS Jitter OOP Prefix 10.1.1.0/24,
jitter 15, BR 10.4.4.2, i/f Et2/0
May  2 10:55:27.367: %OER_MC-5-NOTICE: Route changed Prefix 10.1.1.0/24, BR 10.3.3.4,
i/f Et5/0, Reason Jitter, OOP Reason Jitter
Configuring Exit Link Load Balancing Using OER
Perform this task at the master controller to configure load balancing for traffic classes over the border router exit links. In this example, both active and passive monitoring is enabled, and range and exit utilization policies are given priority when OER chooses the best exit selection for traffic classes. Best route selection for performance policies is disabled. The external Ethernet interfaces on border router 1 and border router 2--BR1 and BR2 in the figure below--are both configured with a maximum utilization threshold of 70 percent. After an external interface is configured for the border routers, OER automatically monitors the utilization of external links on a border router every 20 seconds. The utilization is reported back to the master controller and, if the utilization exceeds 70 percent, OER selects another exit link for traffic classes on that link.
| Figure 4 | Network diagram for OER Exit Link Load Balancing |
Traffic can also be load balanced over entrance links, for more details see the Using OER to Control Traffic Classes and Verify the Network Performance module.
DETAILED STEPS
| Command or Action | Purpose | |||||
|---|---|---|---|---|---|---|
|
|
Example: Router> enable |
Enables privileged EXEC mode. |
||||
|
|
Example: Router# configure terminal |
Enters global configuration mode. |
||||
|
|
Example: Router(config)# oer master |
Enters OER master controller configuration mode to configure a router as a master controller and to configure global operations and policies. |
||||
|
|
Example: Router(config-oer-mc)# mode monitor both |
Configures route monitoring on an OER master controller.
|
||||
|
|
Example: Router(config-oer-mc)# resolve range priority 1 |
Sets policy priority or resolves policy conflicts.
|
||||
|
|
Example: Router(config-oer-mc)# resolve utilization priority 2 variance 25 |
Sets policy priority or resolves policy conflicts.
|
||||
|
|
Example: Router(config-oer-mc)# no resolve delay |
Sets policy priority or resolves policy conflicts.
|
||||
|
|
Example: Router(config-oer-mc)# no resolve loss |
Sets policy priority or resolves policy conflicts.
|
||||
|
|
Example: Router(config-oer-mc)# border 10.1.1.2 key-chain border1_OER |
Enters OER-managed border router configuration mode to establish communication with a border router.
|
||||
|
|
Example: Router(config-oer-mc-br)# interface Ethernet 1/0 external |
Configures a border router interface as an OER-managed external interface.
|
||||
|
|
Example: Router(config-oer-mc-br-if)# max-xmit-utilization absolute 500000 |
Configures the maximum utilization on a single OER managed exit link. |
||||
|
|
Example: Router(config-oer-mc-br-if)# exit |
Exits OER-managed border exit interface configuration mode and returns to OER-managed border router configuration mode. |
||||
|
|
|
-- |
||||
|
|
Example: Router(config-oer-mc)# keepalive 10 |
(Optional) Configures the length of time that an OER master controller will maintain connectivity with an OER border router after no keepalive packets have been received. |
||||
|
|
Example: Router(config-oer-mc)# end |
Exits OER master controller configuration mode and returns to privileged EXEC mode. |
||||
|
|
Example: Router# show running-config |
(Optional) Displays the running configuration to verify the configuration entered in this task. |
Configuring the Source Address of an Active Probe
Perform this task on a border router to specify the source interface for active probing. Support for configuring a source interface for active probing was introduced in Cisco IOS Release 12.4(2)T and 12.2(33)SRB. The active probe source interface is configured on the border router with the active-probe address source in OER border router configuration mode. The active probe source interface IP address must be unique to ensure that the probe reply is routed back to the specified source interface.
The following is default behavior:
- The source IP address is used from the default OER external interface that transmits the active probe when this command is not enabled or if the no form is entered.
- If the interface is not configured with an IP address, the active probe will not be generated.
- If the IP address is changed after the interface has been configured as an active probe source, active probing is stopped, and then restarted with the new IP address.
- If the IP address is removed after the interface has been configured as an active probe source, active probing is stopped and not restarted until a valid primary IP address is configured.
This task requires the master controller and border routers to be running Cisco IOS Release 12.4(2)T, 12.2(33)SRB, or later releases.
DETAILED STEPS
| Command or Action | Purpose | |
|---|---|---|
|
|
Example: Router> enable |
Enables privileged EXEC mode. |
|
|
Example: Router# configure terminal |
Enters global configuration mode. |
|
|
Example: Router(config)# oer border |
Enters OER border router configuration mode to configure a router as a border router. |
|
|
Example: Router(config-oer-br)# active-probe address source interface FastEthernet 0/0 |
Configures an interface on a border router as the active-probe source. |
|
|
Example: Router(config-oer-br)# end |
Exits OER border router configuration mode and enters privileged EXEC mode.
|
|
|
Example: Router# show oer border active-probes |
Displays connection status and information about active probes on an OER border router. |
Examples
This example shows output from the show oer border active-probescommand. The output is filtered to display only connection and status information about the active probes generated for voice traffic configured with a forced target assignment.
Router# show oer border active-probes
        OER Border active-probes
Type      = Probe Type
Target    = Target IP Address
TPort     = Target Port
Source    = Send From Source IP Address
Interface = Exit interface
Att       = Number of Attempts
Comps   = Number of completions
N - Not applicable
Type     Target          TPort Source          Interface           Att   Comps
udp-echo 10.4.5.1           80 10.0.0.1        FE2/0                 1       0
tcp-conn 10.4.7.1           33 10.0.0.1        FE0/0                 1       0
echo     10.4.9.1            N 10.0.0.1        FE1/0                 2       2
Configuration Examples for Measuring the Traffic Class Performance and Link Utilization Using OER
The examples in this section show how to configure OER to measure traffic class performance and link utilization.
- Modifying the OER Link Utilization for Outbound Traffic Example
- Modifying the OER Link Utilization for Inbound Traffic Example
- Modifying the OER Exit Link Utilization Range Example
- Modifying the OER Entrance Link Utilization Range Example
- Active Probing Examples
- Configuring OER Active Probing Using the Longest Match Target Assignment Examples
- Configuring Active Probing with a Forced Target Assignment Examples
- Configuring OER Voice Probes for Fast Failover Example
- Configuring the Source Address of an Active Probe Example
Modifying the OER Link Utilization for Outbound Traffic Example
The following example shows how to modify the OER exit link utilization threshold. In this example, the exit utilization is set to 80 percent. If the utilization for this exit link exceeds 80 percent, OER selects another exit link for traffic classes that were using this exit link.
Router(config)# oer master
Router(config-oer-mc)# border 10.1.4.1
Router(config-oer-mc-br)# interface Ethernet 1/0 external
Router(config-oer-mc-br-if)# max-xmit-utilization percentage 80
Router(config-oer-mc-br-if)# end
Modifying the OER Link Utilization for Inbound Traffic Example
The following example shows how to modify the OER entrance link utilization threshold. In this example, the entrance utilization is set to 65 percent. If the utilization for this exit link exceeds 65 percent, OER selects another entrance link for traffic classes that were using this entrance link.
Router(config)# oer master
Router(config-oer-mc)# border 10.1.2.1
Router(config-oer-mc-br)# interface Ethernet 1/0 external
Router(config-oer-mc-br-if)# maximum receive utilization percentage 65
Router(config-oer-mc-br-if)# end
Modifying the OER Exit Link Utilization Range Example
The following example shows how to modify the OER exit utilization range. In this example, the exit utilization range for all exit links is set to 10 percent. OER uses the maximum utilization range to determine if exit links are in-policy. OER will equalize outbound traffic across all exit links by moving prefixes from overutilized or out-of-policy exits to in-policy exits.
Router(config)# oer master
Router(config-oer-mc)# max-range-utilization percentage 10
Router(config-oer-mc)# end
Modifying the OER Entrance Link Utilization Range Example
The following example shows how to modify the OER entrance utilization range. In this example, the entrance utilization range for all entrance links is set to 15 percent. OER uses the maximum utilization range to determine if entrance links are in-policy. OER will equalize inbound traffic across all entrance links by moving prefixes from overutilized or out-of-policy exits to in-policy exits.
Router(config)# oer master
Router(config-oer-mc)# max range receive percent 15
Router(config-oer-mc)# end
Active Probing Examples
ICMP Echo Example
The following example, starting in global configuration mode, configures an active probe using an ICMP echo (ping) message. The 10.5.5.55 address is the target. No explicit configuration is required on the target device.
Router(config)# oer master
Router(config-oer-mc)# active-probe echo 10.5.5.55
TCP Connection Example
The following example, starting in global configuration mode, configures an active probe using a TCP connection message. The 10.5.55.56 address is the target. The target port number must be specified when configuring this type of probe.
Router(config)# oer master
Router(config-oer-mc)# active-probe tcp-conn 10.5.5.56 target-port 23
Note |
A remote responder is required for TCP connection probes when a port other than 23 is configured. |
UDP Echo Example
The following example, starting in global configuration mode, configures an active probe using UDP echo messages. The 10.5.5.57 address is the target. The target port number must be specified when configuring this type of probe, and a remote responder must also be enabled on the target device.
Router(config)# oer master
Router(config-oer-mc)# active-probe udp-echo 10.5.5.57 target-port 1001
UDP Remote Responder Example
The following example, starting in global configuration mode, configures a remote responder on a border router to send IP SLAs control packets in response to UDP active probes. The port number must match the number that is configured for the active probe.
Border-Router(config)# ip sla monitor responder type udpEcho port 1001
TCP Remote Responder Example
The following example, starting in global configuration mode, configures a remote responder on a border router to send IP SLAs control packets in response to TCP active probes. The remote responder must be configured for TCP active probes that do not use the TCP well-known port number 23.
Border-Router(config)# ip sla monitor responder type tcpConnect port 49152
Configuring OER Active Probing Using the Longest Match Target Assignment Examples
The example configurations in this section demonstrate active probing using the longest match target assignment using the following probe types:
- ICMP Probe for Longest Match Target Assignment
- TCP Probe for Longest Match Target Assignment
- UDP Probe for Longest Match Target Assignment
ICMP Probe for Longest Match Target Assignment
The following example shows how to configure active probing using the ICMP probe with the longest match target assignment:
Router(config)# oer master
Router(config-oer-mc)# mode monitor active
Router(config-oer-mc)# active-probe echo 10.5.5.55
TCP Probe for Longest Match Target Assignment
The following example shows how to configure active probing using the TCP probe with the longest match target assignment. The IP SLAs Responder must first be enabled on the target device, and this device does not have to be configured for OER. A border router can be used as the target device. The second configuration is performed at the master controller.
Target Device
Router> enable
Router# configure terminal
Router(config)# ip sla monitor responder type tcpConnect port 49152
Router(config)# exit
Master Controller
Router(config)# oer master
Router(config-oer-mc)# mode monitor active
Router(config-oer-mc)# active-probe tcp-conn 10.4.4.44 target-port 49152
UDP Probe for Longest Match Target Assignment
The following example shows how to configure active probing using the UDP probe with the longest match target assignment. The IP SLAs Responder must first be enabled on the target device, and this device does not have to be configured for OER. A border router can be used as the target device. The second configuration is performed at the master controller.
Target Device
Router> enable
Router# configure terminal
Router(config)# ip sla monitor responder type udpEcho port 1001
Router(config)# exit
Master Controller
Router(config)# oer master
Router(config-oer-mc)# mode monitor active
Router(config-oer-mc)# active-probe udp-echo 10.3.3.33 target-port 1001
Configuring Active Probing with a Forced Target Assignment Examples
The example configurations in this section demonstrate active probing using a forced target assignment using the following probe types:
UDP Probe for Forced Target Assignment
The following example shows how to configure active probing with a forced target assignment and a configured probe frequency of 20 seconds. This example requires an IP SLAs Responder to be enabled on the target device.
Target Device
Router> enable
Router# configure terminal
Router(config)# ip sla monitor responder type udpEcho port 1001
Router(config)# exit
Master Controller
Router(config)# oer master

Router(config-oer-mc)# mode monitor active
Router(config-oer-mc)# exit

Router(config)# oer-map FORCED_MAP 10
Router(config-oer-map)# match ip address access-list FORCED_LIST
Router(config-oer-map)# set active-probe udp-echo 10.5.5.57 target-port 1001
Router(config-oer-map)# set probe frequency 20
Router(config-oer-map)# end
Jitter Probe for Forced Target Assignment
The following example shows how to configure active probing for Voice traffic with a forced target assignment using the jitter probe and a configured probe frequency of 15 seconds. The voice traffic is identified using an access list and thresholds are set for jitter, mos, and delay. In this task, the codec keyword and codec-name argument used in the jitter probe configuration specify the codec value used for mos calculation. This example requires an IP SLAs Responder to be enabled on the target device.
Target Device
Router> enable
Router# configure terminal
Router(config)# ip sla monitor responder
Router(config)# exit
Master Controller
Router(config)# oer master

Router(config-oer-mc)# mode monitor active
Router(config-oer-mc)# exit

Router(config)# oer-map FORCED_VOICE_MAP 10
Router(config-oer-map)# match ip address access-list FORCED_VOICE_LIST
Router(config-oer-map)# set active-probe jitter 172.17.5.57 target-port 2000 codec g729a
Router(config-oer-map)# set probe frequency 15
Router(config-oer-map)# set jitter threshold 20
Router(config-oer-map)# set mos threshold 4.0 percent 30
Router(config-oer-map)# set delay threshold 100
Router(config-oer-map)# end
Configuring OER Voice Probes for Fast Failover Example
The following example, starting in global configuration mode, shows how quickly a new exit can be selected when fast failover is configured.
Note |
Fast monitoring is a very aggressive mode that incurs a lot of overhead with the continuous probing. We recommend that you use fast monitoring only for performance sensitive traffic. |
The first output shows the configuration at the master controller of three border routers. Route control mode is enabled.
Router# show run | sec oer master
oer master
 policy-rules MAP
 port 7777
 logging
 !
 border 10.3.3.3 key-chain key1
  interface Ethernet9/0 external
  interface Ethernet8/0 internal
 !
 border 10.3.3.4 key-chain key2
  interface Ethernet5/0 external
  interface Ethernet8/0 internal
 !
 border 10.4.4.2 key-chain key3
  interface Ethernet2/0 external
  interface Ethernet8/0 internal
 backoff 90 90
 mode route control
 resolve jitter priority 1 variance 10
 no resolve delay
!
To verify the basic configuration and show the status of the border routers, the show oer master command is run:
Router# show oer master
OER state: ENABLED and ACTIVE
  Conn Status: SUCCESS, PORT: 7777
  Version: 2.1
  Number of Border routers: 3
  Number of Exits: 3
  Number of monitored prefixes: 1 (max 5000)
  Max prefixes: total 5000 learn 2500
  Prefix count: total 1, learn 0, cfg 1

Border           Status   UP/DOWN             AuthFail  Version
10.4.4.2        ACTIVE   UP       17:00:32          0  2.1
10.3.3.4        ACTIVE   UP       17:00:35          0  2.1
10.3.3.3        ACTIVE   UP       17:00:38          0  2.1

Global Settings:
  max-range-utilization percent 20 recv 20
  mode route metric bgp local-pref 5000
  mode route metric static tag 5000
  trace probe delay 1000
  logging

Default Policy Settings:
  backoff 90 90 90
  delay relative 50
  holddown 90
  periodic 0
  probe frequency 56
  mode route control
  mode monitor both
  mode select-exit good
  loss relative 10
  jitter threshold 20
  mos threshold 3.60 percent 30
  unreachable relative 50
  resolve jitter priority 1 variance 10
  resolve utilization priority 12 variance 20

Learn Settings:
  current state : DISABLED
  time remaining in current state : 0 seconds
  no throughput
  no delay
  no inside bgp
  no protocol
  monitor-period 5
  periodic-interval 120
  aggregation-type prefix-length 24
  prefixes 100
  expire after time 720
Fast failover is now configured for active voice probes and the probe frequency is set to 2 seconds using an OER map. The fast failover monitoring mode is enabled and the voice traffic to be monitored is identified using an IP prefix list to specify the 10.1.1.0/24 prefix. To reduce some of the overhead that fast failover monitoring produces, the active voice probes are assigned a forced target for OER.
Router# show run | sec oer-map
oer-map MAP 10
 match traffic-class prefix-list VOICE_FAIL_LIST
 set mode select-exit best
 set mode monitor fast
 set jitter threshold 12
 set active-probe jitter 120.120.120.1 target-port 20 codec g729a
 set probe frequency 2
The following output from the show oer master prefixcommand when a prefix is specified with the policy keyword shows the policy configured for the prefix 10.1.1.0/24. Note that the mode monitor is set to fast, which automatically sets the select-exit to best, and allows the probe frequency to be set at 2.
Router# show oer master prefix 10.1.1.0/24 policy
* Overrides Default Policy Setting
oer-map MAP 10
  sequence no. 8444249301975040, provider id 1, provider priority 30
    host priority 0, policy priority 10, Session id 0
  match ip prefix-lists: VOICE_FAIL_LIST
  backoff 90 90 90
  delay relative 50
  holddown 90
  periodic 0
 *probe frequency 2
  mode route control
 *mode monitor fast
 *mode select-exit best
  loss relative 10
 *jitter threshold 12
  mos threshold 3.60 percent 30
  unreachable relative 50
  next-hop not set
  forwarding interface not set
  resolve jitter priority 1 variance 10
  resolve utilization priority 12 variance 20

  Forced Assigned Target List:
   active-probe jitter 10.120.120.1 target-port 20 codec g729a
After the master controller is configured for fast failover as shown in this task, and a traffic class goes out of policy, the logging output below shows that the traffic class represented by prefix 10.1.1.0/24 is routed by OER through a new border router exit at interface 10.3.3.4 within 3 seconds. From the logging output, it appears that the traffic class moved to an out-of-policy state due to the jitter threshold being exceeded.
May  2 10:55:27.355: %OER_MC-5-NOTICE: Active ABS Jitter OOP Prefix 10.1.1.0/24,
jitter 15, BR 10.4.4.2, i/f Et2/0
May  2 10:55:27.367: %OER_MC-5-NOTICE: Route changed Prefix 10.1.1.0/24, BR 10.3.3.4,
i/f Et5/0, Reason Jitter, OOP Reason Jitter
Configuring the Source Address of an Active Probe Example
The following example, starting in global configuration mode, configures FastEthernet 0/0 as the active-probe source interface.
Router(config)# oer border
Router(config-oer-br)# active-probe address source interface FastEthernet 0/0
Where to Go Next
This module described the OER measure phase and it has assumed that you started with the Cisco IOS Optimized Edge Routing Overview module, followed by the Setting Up OER Network Components module. The measure phase is the second phase in the OER performance loop. To learn more about the other OER phases, read through the other modules in the following list:
Additional References
Related Documents
| Related Topic |
Document Title |
|---|---|
| Cisco IOS Master Command List |
http://www.cisco.com/en/US/docs/ios/mcl/allreleasemcl/all_book.html |
| Command Lookup Tool |
|
| Cisco OER technology overview |
|
| Concepts and configuration tasks required to set up OER network components. |
|
| Cisco OER commands: complete command syntax, command mode, command history, defaults, usage guidelines and examples |
Technical Assistance
| Description |
Link |
|---|---|
| The Cisco Support and Documentation website provides online resources to download documentation, software, and tools. Use these resources to install and configure the software and to troubleshoot and resolve technical issues with Cisco products and technologies. Access to most tools on the Cisco Support and Documentation website requires a Cisco.com user ID and password. |
Feature Information for Measuring the Traffic Class Performance and Link Utilization Using OER
The following table provides release information about the feature or features described in this module. This table lists only the software release that introduced support for a given feature in a given software release train. Unless noted otherwise, subsequent releases of that software release train also support that feature.
Use Cisco Feature Navigator to find information about platform support and Cisco software image support. To access Cisco Feature Navigator, go to www.cisco.com/go/cfn. An account on Cisco.com is not required.
| Table 2 | Feature Information for Measuring the Traffic Class Performance and Link Utilization Using OER |
| Feature Name |
Releases |
Feature Configuration Information |
|---|---|---|
| Optimized Edge Routing |
12.3(8)T 12.2(33)SRB |
OER was introduced. |
| OER Active Probe Source Address |
12.4(2)T 12.2(33)SRB |
The OER Active Probe Source Address feature allows you to configure a specific exit interface on the border router as the source for active probes. The active-probe address source command was introduced by this feature. |
| OER Voice Traffic Optimization |
12.4(6)T 12.2(33)SRB |
The OER Voice Traffic Optimization feature introduced support for outbound optimization of voice traffic based on the voice metrics, jitter and Mean Opinion Score (MOS). Jitter and MOS are important quantitative quality metrics for voice traffic and these voice metrics are measured using OER active probes. The following commands were introduced or modified by this feature: active-probe, jitter, mos, resolve, set jitter, set mos, set probe, set resolve, show oer master active-probes, show oer policy, show oer master prefix. |
| OER BGP Inbound Optimization |
12.4(9)T 12.2(33)SRB |
OER BGP inbound optimization supports best entrance selection for traffic that originates from prefixes outside an autonomous system destined for prefixes inside the autonomous system. External BGP (eBGP) advertisements from an autonomous system to an Internet service provider (ISP) can influence the entrance path for traffic entering the network. OER uses eBGP advertisements to manipulate the best entrance selection. The following commands were introduced or modified by this feature: clear oer master prefix, downgrade bgp, inside bgp, match ip address (OER), match oer learn, max range receive, maximum utilization receive, show oer master prefix. |
| OER DSCP Monitoring |
12.4(9)T 12.2(33)SRB |
OER DSCP Monitoring introduced automatic learning of traffic classes based on protocol, port numbers, and DSCP value. Traffic classes can be defined by a combination of keys comprising of protocol, port numbers, and DSCP values, with the ability to filter out traffic that is not required, and the ability to aggregate the traffic in which you are interested. Information such as protocol, port number, and DSCP information is now sent to the master controller database in addition to the prefix information. The new functionality allows OER to both actively and passively monitor application traffic. The following commands were introduced or modified by this feature: show oer border passive applications, show oer border passive cache, show oer border passive learn, show oer master appl, traffic-class aggregation, traffic-class filter, and traffic-class keys. |
| Support for Fast Failover Monitoring1 |
12.4(15)T |
Fast Failover Monitoring introduced the ability to configure a fast monitoring mode. In fast failover monitoring mode, all exits are continuously probed using active monitoring and passive monitoring. The probe frequency can be set to a lower frequency in fast failover monitoring mode than for other monitoring modes, to allow a faster failover capability. Fast failover monitoring can be used with all types of active probes: ICMP echo, jitter, TCP connection, and UDP echo. The following commands were modified by this feature: mode (OER), set mode. |
| OER Border Router Only Functionality |
12.2(33)SXH |
In Cisco IOS Release 12.2(33)SXH support for using a Cisco Catalyst 6500 series switch as an OER border router was introduced. Only border router functionality is included in the Cisco IOS Release 12.2(33)SXH images; no master controller configuration is available. The master controller that communicates with the Cisco Catalyst 6500 series switch being used as a border router must be a router running Cisco IOS Release 12.4(6)T or a later release. The OER master controller software has been modified to handle the limited functionality supported by the Cisco Catalyst 6500 border routers. Using the Route Processor (RP), the Catalyst 6500 border routers can capture throughput statistics only for a traffic class compared to the delay, loss, unreachability, and throughput statistics collected by non-Catalyst 6500 border routers. A master controller automatically detects the limited capabilities of the Catalyst 6500 border routers and downgrades other border routers to capture only the throughput statistics for traffic classes. By ignoring other types of statistics, the master controller is presented with a uniform view of the border router functionality. The following command was introduced or modified by this feature: show oer border passive cache. |
Cisco and the Cisco Logo are trademarks of Cisco Systems, Inc. and/or its affiliates in the U.S. and other countries. A listing of Cisco's trademarks can be found at www.cisco.com/go/trademarks. Third party trademarks mentioned are the property of their respective owners. The use of the word partner does not imply a partnership relationship between Cisco and any other company. (1005R)
Any Internet Protocol (IP) addresses and phone numbers used in this document are not intended to be actual addresses and phone numbers. Any examples, command display output, network topology diagrams, and other figures included in the document are shown for illustrative purposes only. Any use of actual IP addresses or phone numbers in illustrative content is unintentional and coincidental.
 Feedback