This example shows
how to configure a nonstateful correlation rule to permanently suppress node
status messages:
logging correlator rule node_status type nonstateful
timeout 4000
  rootcause PLATFORM INVMGR NODE_STATE_CHANGE
  nonrootcause
    alarm PLATFORM SYSLDR LC_ENABLED
    alarm PLATFORM ALPHA_DISPLAY CHANGE
  !
!
logging correlator apply rule node_status

  all-of-router
!
In this example,
three similar messages are identified as forwarded to the syslog process
simultaneously after a card boots:
PLATFORM-INVMGR-6-NODE_STATE_CHANGE : Node: 0/1/CPU0, state: IOS
XR RUN
PLATFORM-SYSLDR-5-LC_ENABLED : LC in slot 1 is now running IOX
PLATFORM-ALPHA_DISPLAY-6-CHANGE : Alpha display on node 0/1/CPU0
changed to IOX RUN in state default
These messages are
similar. To see only one message appear in the logs, one of the messages is
designated as the root cause message (the one that appears in the logs), and
the other messages are considered non-root-cause messages.
The root-cause
message is typically the one that arrives earliest, but that is not a
requirement.
logging correlator rule node_status type nonstateful
  timeout 4000
  rootcause PLATFORM INVMGR NODE_STATE_CHANGE
  nonrootcause
    alarm PLATFORM SYSLDR LC_ENABLED
    alarm PLATFORM ALPHA_DISPLAY CHANGE
  !
!
In this example, the
correlation rule named node_status is configured to correlate the PLATFORM
INVMGR NODE_STATE_CHANGE alarm (the root-cause message) with the PLATFORM
SYSLDR LC_ENABLED and PLATFORM ALPHA_DISPLAY CHANGE alarms. The updown
correlation rule is applied to the entire router.
logging correlator apply rule node_status
  all-of-router
!
After a card boots
and sends these messages:
PLATFORM-INVMGR-6-NODE_STATE_CHANGE : Node: 0/1/CPU0, state: IOS
XR RUN
PLATFORM-SYSLDR-5-LC_ENABLED : LC in slot 1 is now running IOX
PLATFORM-ALPHA_DISPLAY-6-CHANGE : Alpha display on node 0/1/CPU0
changed to IOX RUN in state default
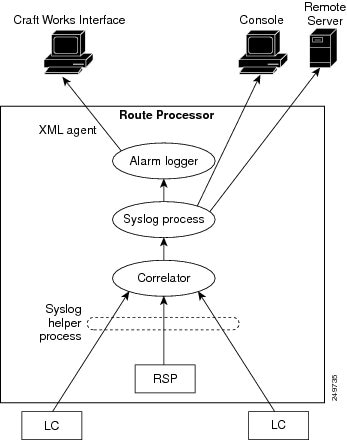
the correlator
forwards the PLATFORM-INVMGR-6-NODE_STATE_CHANGE message to the syslog process,
while the remaining two messages are held in the logging correlator buffer.
In this example, the
show sample output from the
show logging events buffer
all-in-buffer command displays the alarms stored in the logging
events buffer after the 4-second time period expires for the node_status
correlation rule:
RP/0/RSP0/CPU0:router# show logging events buffer all-in-buffer

#ID :C_id:Source :Time :%CATEGORY-GROUP-SEVERITY-MESSAGECODE: Text

#76 :12  :RP/0/0/CPU0:Aug  2 22:32:43 : invmgr[194]:

%PLATFORM-INVMGR-6-NODE_STATE_CHANGE : Node: 0/1/CPU0, state: IOS XR RUN
The
show logging correlator
buffer correlation ID command generates the following output
after the one minute interval expires. The output displays the alarms assigned
correlation ID 12 in the logging correlator buffer.
RP/0/RSP0/CPU0:router# show logging correlator buffer correlationID 46

#C_id.id:Rule Name:Source :Time : Text

#12.1 :nodestatus:RP/0/0/CPU0:Aug  2 22:32:43 : invmgr[194]: %PLATFORM-INVMGR-6-NODE_STATE_CHANGE : Node: 0/1/CPU0, state: IOS XR RUN
#12.2 :nodestatus:RP/0/0/CPU0:Aug  2 22:32:43 : sysldr[336]: %PLATFORM-SYSLDR-5-LC_ENABLED : LC in slot 1 is now running IOX
#12.3 :nodestatus:RP/0/0/CPU0:Aug  2 22:32:44 : alphadisplay[102]: %PLATFORM-ALPHA_DISPLAY-6-CHANGE : Alpha display on node 0/1/CPU0 changed to IOX RUN  in state default
Because this rule was defined as nonstateful, these messages are held in the buffer indefinitely.


 Feedback