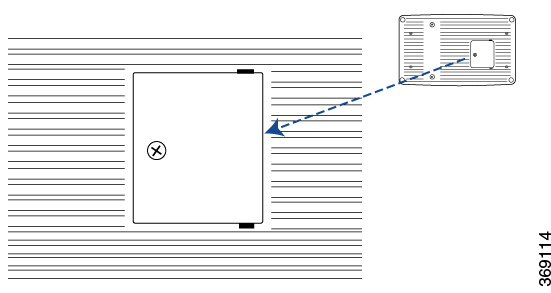
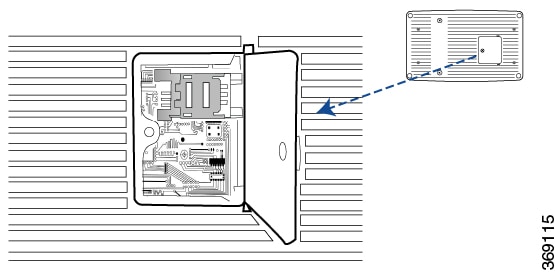
You can monitor and troubleshoot the vEdge 100m router using the various LEDs and system alarms on the router.
Alarm Severity Levels
The system alarms on the vEdge 100m router have two severity levels:
A major alarm condition requires immediate attention. If a temperature related major alarm persists for more than five minutes,
the router will shut down.
-
Minor (yellow)—Indicates a warning on the router that, if left unattended, might result in an interruption in router operation
or degradation in router performance. A yellow alarm condition requires further monitoring and/or maintenance.
Hardware Alarms
Hardware alarms on the vEdge 100m router are predefined and are triggered by a physical condition on the router such as a
power supply failure, excessive component temperature, or fan failure. The vEdge 100m router triggers the following types
of hardware alarms:
-
Main board temperature alarm—The main board of the router has one temperature sensing point (board sensor 0). If the temperature
of the sensor location crosses the predefined threshold level, the system triggers an alarm.
-
CPU temperature alarm—If the temperature of the system CPU crosses the predefined threshold level, the system triggers an
alarm.
-
Fan alarm—The router has a fixed built-in fan for system cooling which runs at a variable speed. The Viptela software maintains
the fan at an optimal fan speed, raising the speed as the ambient temperature increases and decreasing the speed as the temperature
decreases, to keep the router operating at the lowest possible temperature in the green temperature threshold. If the fan
stops running, the system triggers an alarm. Also if the fan starts to run below a predefined RPM threshold, the system triggers
an alarm.
The following table lists the yellow and red alarm threshold for the temperature sensing points in the system—one board sensor
on the board and one CPU junction temperature sensor. The lower threshold value (Bad Fan) applies if a fan failure condition
is also detected; otherwise, the higher threshold value (normal) applies.
Table 7.
|
Item
|
Yellow Alarm (ºC)
|
Red Alarm (ºC)
|
|
|
Normal
|
Bad Fan
|
Normal
|
Bad Fan
|
|
Board sensor 0
|
75
|
70
|
90
|
85
|
|
CPU junction temperature
|
80
|
75
|
95
|
90
|
Checking Alarms and Notifications
To view the current chassis environment condition , enter the show hardware environment command at the system prompt. The system displays the power supply status, temperature sensor readings, fan speed, and related
alarm status if any exists.
To view the severity of active alarms, enter the show hardware alarms command at the system prompt. The system displays the alarm severity and a brief description of the cause of each active
alarm.
To view temperature thresholds at which green, yellow, and red alarms are generated, enter the show hardware temperature-thresholds command at the system prompt. The system displays the alarm temperature threshold information for a specific board or all
boards in the router and for the router's CPU.
To view all other events on a Viptela device, enter the show notification stream command. The system displays notifications about events that have occurred on the Viptela device.
LEDs
The chassis LEDs located on the front panel of the vEdge 100m router indicate the status of the router.
If one or more major alarms are active in the router, the Status LED is lit red. If one or more minor alarms are active in
the router, the Status LED is lit solid yellow. See Front and Rear Panel Components for details of the LEDs and the status
they indicate.


 Feedback