Testing and Troubleshooting

This chapter describes how to troubleshoot the ASA and test basic connectivity.

Recover Enable and Telnet Passwords

If you forget the enable or Telnet passwords, you can recover them for ASA virtual and ISA 3000 models. You must perform the task using the CLI.


Note


For other platforms, you cannot recover lost passwords. You can only restore the factory default configuration, and reset the passwords to the default. For Firepower 4100/9300, see the FXOS configuration guide. For other models, see the FXOS troubleshooting guide.


Recover Passwords on the ISA 3000

To recover passwords for the ISA 3000 perform the following steps:

Procedure


Step 1

Connect to the ASA console port.

Step 2

Power off the ASA, then power it on.

Step 3

After startup, press the Escape key when you are prompted to enter ROMMON mode.

Step 4

To update the configuration register value, enter the following command:


rommon #1> confreg 0x41

You must reset or power cycle for new config to take effect

The ASA displays the current configuration register value and a list of configuration options. Record the current configuration register value, so you can restore it later.


Configuration Register: 0x00000041

Configuration Summary
 [ 0 ] password recovery
 [ 1 ] display break prompt
 [ 2 ] ignore system configuration
 [ 3 ] auto-boot image in disks
 [ 4 ] console baud: 9600
 boot: ...... auto-boot index 1 image in disks

Step 5

Reload the ASA by entering the following command:


rommon #2> boot
Launching BootLoader...
Boot configuration file contains 1 entry.

Loading disk0:/asa932-226-k8.bin... Booting...Loading...

The ASA loads the default configuration instead of the startup configuration.

Step 6

Access the privileged EXEC mode by entering the following command:


ciscoasa# enable

Step 7

When prompted for the password, press Enter.

The password is blank.

Step 8

Load the startup configuration by entering the following command:


ciscoasa# copy startup-config running-config

Step 9

Access the global configuration mode by entering the following command:


ciscoasa# configure terminal

Step 10

Change the passwords, as required, in the default configuration by entering the following commands:


ciscoasa(config)# password password
ciscoasa(config)# enable password password
ciscoasa(config)# username name password password

Step 11

Load the default configuration by entering the following command:


ciscoasa(config)# no config-register 

The default configuration register value is 0x1. See the command reference for more information about the configuration register.

Step 12

Save the new passwords to the startup configuration by entering the following command:


ciscoasa(config)# copy running-config startup-config


Recover Passwords or Images on the ASA Virtual

To recover passwords or images on the ASA virtual, perform the following steps:

Procedure


Step 1

Copy the running configuration to a backup file on the ASA virtual:

copy running-config filename

Example:


ciscoasa# copy running-config backup.cfg

Step 2

Restart the ASA virtual:

reload

Step 3

From the GNU GRUB menu, press the down arrow, choose the <filename> with no configuration load option, then press Enter. The filename is the default boot image filename on the ASA virtual. The default boot image is never automatically booted through the fallback command. Then load the selected boot image.


GNU GRUB version 2.0(12)4
bootflash:/asa100123-20-smp-k8.bin
bootflash: /asa100123-20-smp-k8.bin with no configuration load

Example:


GNU GRUB version 2.0(12)4
bootflash: /asa100123-20-smp-k8.bin with no configuration load

Step 4

Copy the backup configuration file to the running configuration.

copy filename running-config

Example:


ciscoasa (config)# copy backup.cfg running-config

Step 5

Reset the password.

enable password password

Example:


ciscoasa(config)# enable password cisco123

Step 6

Save the new configuration.

write memory

Example:


ciscoasa(config)# write memory


Disable Password Recovery for ISA 3000 Hardware


Note


You cannot disable password recovery on the ASA virtual, Secure Firewall models.


To disable password recovery to ensure that unauthorized users cannot use the password recovery mechanism to compromise the ASA, perform the following steps.

Before you begin

On the ASA, the no service password-recovery command prevents you from entering ROMMON mode with the configuration intact. When you enter ROMMON mode, the ASA prompts you to erase all Flash file systems. You cannot enter ROMMON mode without first performing this erasure. If you choose not to erase the Flash file system, the ASA reloads. Because password recovery depends on using ROMMON mode and maintaining the existing configuration, this erasure prevents you from recovering a password. However, disabling password recovery prevents unauthorized users from viewing the configuration or inserting different passwords. In this case, to restore the system to an operating state, load a new image and a backup configuration file, if available.

The service password-recovery command appears in the configuration file for information only. When you enter the command at the CLI prompt, the setting is saved in NVRAM. The only way to change the setting is to enter the command at the CLI prompt. Loading a new configuration with a different version of the command does not change the setting. If you disable password recovery when the ASA is configured to ignore the startup configuration at startup (in preparation for password recovery), then the ASA changes the setting to load the startup configuration as usual. If you use failover, and the standby unit is configured to ignore the startup configuration, then the same change is made to the configuration register when the no service password- recovery command replicates to the standby unit.

Procedure


Disable password recovery.

no service password-recovery

Example:


ciscoasa (config)# no service password-recovery


View Debugging Messages

Because debugging output is assigned high priority in the CPU process, it can render the system unusable. For this reason, use debug commands only to troubleshoot specific problems or during troubleshooting sessions with Cisco TAC. Moreover, it is best to use debug commands during periods of less network traffic and fewer users. Debugging during these periods decreases the likelihood that increased debug command processing overhead will affect system use. To enable debugging messages, see the debug commands in the command reference.

Packet Capture

Capturing packets may be useful when troubleshooting connectivity problems or monitoring suspicious activity. We recommend that you contact Cisco TAC if you want to use the packet capture service.

Guidelines for Packet Capture

Context Mode

  • You can configure captures on the cluster control link within a context; only the packet that is associated with the context sent in the cluster control link is captured.

  • You can only configure one capture for a shared VLAN; if you configure a capture in multiple contexts on the shared VLAN, then only the last capture that was configured is used.

  • If you remove the last-configured (active) capture, no captures become active, even if you have previously configured a capture in another context; you must remove the capture and add it again to make it active.

  • All traffic that enters the interface to which the capture is attached is captured, including traffic to other contexts on the shared VLAN. Therefore, if you enable a capture in Context A for a VLAN that is also used by Context B, both Context A and Context B ingress traffic are captured.

  • For egress traffic, only the traffic of the context with the active capture is captured. The only exception is when you do not enable the ICMP inspection (therefore the ICMP traffic does not have a session in the accelerated path). In this case, both ingress and egress ICMP traffic for all contexts on the shared VLAN is captured.

Additional Guidelines

  • If the ASA receives packets with an incorrectly formatted TCP header and drops them because of the invalid-tcp-hdr-length ASP drop reason, the show capture command output on the interface where those packets are received does not show those packets.

  • You can only capture IP traffic; you cannot capture non-IP packets such as ARPs.

  • For inline SGT tagged packets, captured packets contain an additional CMD header that your PCAP viewer might not understand.

  • Packet captures include packets that the system modifies or injects into the connection due to inspection, NAT, TCP normalization, or other features that adjust the content of a packet.

  • The trace of the lifespan of an injected virtual packet in a datapath does not exactly reflect how the datapath handles the physical packets. This difference depends on the software version, configuration, and type of the injected virtual packets. Following are configuration settings that might lead to the disparity:

    • at least 2 NAT statements for the same host exist.

    • forward and reverse flows of a connection having different protocols. For example, forward flow is UDP or TCP, reverse flow is ICMP.

    • ICMP error inspection being enabled.

Capture Packets

To capture packets, perform the following steps.

Procedure


Step 1

Enable packet capture capabilities for packet sniffing and network fault isolation:

capture capture_name [type {asp-drop [all | drop-code] | tls-proxy | raw-data | isakmp [ikev1 | ikev2] | inline-tag [tag] | webvpn user webvpn-user}] [access-list access_list_name] {interface {interface_name | asa_dataplane | asa_mgmt_plane | cplane} } [buffer buf_size] [ethernet-type type] [reeinject-hide] [packet-length bytes ] [circular-buffer] [trace [trace-count number]] [real-time [dump] [detail]][ file-size ] [ headers-only ] [match protocol {host source-ip | source-ip mask | any | any4|any6} [operator src_port] {host dest_ip |dest_ip mask | any | any4|any6} [operator dest_port]]

Example:


ciscoasa# capture captest interface inside

You must configure an interface for any packets to be captured. Use the same capture_name on multiple capture statements to capture multiple types of traffic.

The type asp-drop keyword captures packets dropped by the accelerated security path. In a cluster, dropped forwarded data packets from one unit to another are also captured. In multiple context mode, when this option is issued in the system execution space, all dropped data packets are captured; when this option is issued in a context, only dropped data packets that enter from interfaces belonging to the context are captured.

The type raw-data keywords capture inbound and outbound packets. This setting is the default.

The inline-tag tag keyword-argument pair specifies a tag for a particular SGT value or leaves it unspecified to capture a tagged packet with any SGT value.

The buffer keyword defines the buffer size used to store the packet. When the byte buffer is full, packet capture stops. When used in a cluster, this is the per-unit size, not the sum of all units. The circular-buffer keyword overwrites the buffer, starting from the beginning, when the buffer is full.

The ethernet-type keyword sets an ethernet type to capture. Supported Ethernet types include 8021Q, ARP, IP, IP6, LACP, PPPOED, PPPOES, RARP, and VLAN. An exception occurs with the 802.1Q or VLAN type. The 802.1Q tag is automatically skipped and the inner Ethernet type is used for matching. IP is the default ethernet type.

The interface keyword sets the name of the interface on which to use packet capture.

To capture packets on the dataplane, use the asa_dataplane keyword.

To configure the size of capture file, use the file-size keyword. The file size can be between 32 and 10000 MB.

If you want to capture only L2, L3 and L4 headers of packet without data in them, use the headers-only command.

The match keyword captures matching the protocol and source and destination IP addresses and optional ports. You can use this keyword up to three times in one command. The any keyword captures IPv4 traffic only. You can use the any4 and any6 keywords to capture the matching IPv4 and IPv6 network traffic respectively. The operator can be one of the following:

  • lt—less than

  • gt—greater than

  • eq—equal to

The real-time keyword displays the captured packets continuously in real-time.

The reinject-hide keyword specifies that no reinjected packets will be captured and applies only in a clustering environment.

Note


If ACL optimization is configured, you cannot use the access-list command in capture. You can only use the access-group command. An error appears if you try to use the access-list command in this case.

Step 2

Capture cluster control-link traffic:

capture capture_name {type lacp interface interface_id [buffer buf_size] [packet-length bytes ] [circular-buffer] [real-time [dump] [detail]]

capture capture_name interface cluster [buffer buf_size] [cp-cluster] [ethernet-type type] [packet-length bytes ] [circular-buffer] [trace [trace-count number]] [real-time [dump] [detail]] [trace] [match protocol {host source-ip | source-ip mask | any | any4|any6} [operator src_port] {host dest_ip |dest_ip mask | any | any4|any6} [operator dest_port]]

Example:


ciscoasa# capture ccl type lacp interface GigabitEthernet0/0
ciscoasa# capture ccl interface cluster match udp any eq 49495 any
ciscoasa# capture ccl interface cluster match udp any any eq 49495

You can capture cluster control link traffic in two ways: to capture all the traffic on the cluster control link, use the cluster keyword for the interface name. To capture only cLACP packets, specify type lacp , and specify the physical interface ID instead of the interface name. There are two types of packets on the cluster control link: control plane packets and data plane packets, which both include forwarded data traffic and cluster LU messages. The TTL field in the IP address header is encoded to differentiate between these two types of packets. When forwarded data packets are captured, their clustering trailers are included in the capture file for debugging purposes.

The cp-cluster keyword only captures control plane packets on the cluster control link (and no data plane packets). This option is useful in the system in multiple context mode where you cannot match traffic using an ACL.

Step 3

Capture packets cluster-wide:

cluster exec capture capture_name arguments

Step 4

Stop the packet capture:

no capture capture_name

To terminate a real-time packet capture, enter Ctrl + c. To permanently remove the capture, use the no form of this command. The real-time option applies only to raw-data and asp-drop captures.

Step 5

To manually stop the packet capture without removing packets from the buffer:

capture name stop

Step 6

To start the capture again:

no capture name stop

Step 7

Capture persistent packet traces on cluster units:

cluster exec capture_test persist

Step 8

Clear persistent packet traces:

cluster exec clear packet-trace

Step 9

Capture decrypted IPsec packets:

cluster exec capture_test include-decrypted

Step 10

Clear the capture:

clear capture capture_name

Examples

Control Plane Packets

All packets to and from the control plane have a TTL of 255, and port number 49495 is used for the clustering control-plane listen port. The following example shows how to create a LACP capture for the clustering environment:


ciscoasa# capture lacp type lacp interface GigabitEthernet0/0

The following example shows how to create a capture for control path packets in the clustering link:


ciscoasa# capture cp interface cluster match udp any eq 49495 any
ciscoasa# capture cp interface cluster match udp any any eq 49495

Data Plane Packets

Data packets include those forwarded from one unit to another unit (its connection owner) and cluster LU messages. Regular cluster LU update messages have a TTL of 254, and there is a special LU packet that has a TTL of 253. This special LU packet is only for TCP, and it only happens when the director elects a new flow owner; the director sends back the requesting packet along with the CLU_FULL update packet. The LU packet is filled with the original packet's L3/L4 header to avoid a potential race condition at the receiver side. Forwarded data packets have a TTL of less than 4. The following example shows how to create a capture for data path packets in the cluster control link. To capture all inter-cluster dataplane "flow logical update" messages, use port 4193.


ciscoasa# access-list cc1 extended permit udp any any eq 4193
ciscoasa# access-list cc1 extended permit udp any eq 4193 any
ciscoasa# capture dp interface cluster access-list ccl

View a Packet Capture

You can view a packet capture at the CLI, in a browser, or download a capture to a server of your choice.

Procedure


Step 1

View the capture at the CLI:

[cluster exec] show capture [capture_name] [access-list access_list_name] [count number] [decode] [detail] [dump] [packet-number number]

Example:


ciscoasa# show capture capin
 
 8 packets captured
 
 1: 03:24:35.526812       192.168.10.10 > 203.0.113.3: icmp: echo request
 2: 03:24:35.527224       203.0.113.3 > 192.168.10.10: icmp: echo reply
 3: 03:24:35.528247       192.168.10.10 > 203.0.113.3: icmp: echo request
 4: 03:24:35.528582       203.0.113.3 > 192.168.10.10: icmp: echo reply
 5: 03:24:35.529345       192.168.10.10 > 203.0.113.3: icmp: echo request
 6: 03:24:35.529681       203.0.113.3 > 192.168.10.10: icmp: echo reply
 7: 03:24:57.440162       192.168.10.10 > 203.0.113.3: icmp: echo request
 8: 03:24:57.440757       203.0.113.3 > 192.168.10.10: icmp: echo reply

The access-list keyword displays information for packets that are based on IP or higher fields for the specific access list identification.

The cluster exec keyword lets you issue the show capture command in one unit and run the command in all the other units at the same time.

The count keyword displays the number of packets specified data.

The decode keyword is useful when a capture of type isakmp is applied to an interface. All ISAKMP data flowing through that interface will be captured after decryption and shown with more information after decoding the fields. The decoded output of the packets depend on the protocol of the packet. Typically, this command supports IP decode for the ICMP, UDP, and TCP protocols. From version 9.10(1), this command also supports IP decode for GRE and IPinIP.

The detail keyword displays additional protocol information for each packet.

The dump keyword displays a hexadecimal dump of the packets that are transported over the data link.

The packet-number keyword starts the display at the specified packet number.

Step 2

View the packet capture with your browser:

https://ip_of_asa/admin/capture/capture_name/pcap

If you leave out the pcap keyword, then only the equivalent of the show capture capture_name command output is provided.

In multiple context mode, the copy capture command is available only in the system execution space.

Step 3

Copy the packet capture to a server. This example shows FTP.

[cluster exec] copy /pcap capture:[context-name/]capture_name ftp://username:password@server_ip/path

If you leave out the pcap keyword, then only the equivalent of the show capture capture_name command output is provided.

Note


When you copy a packet capture to a disk, ensure that the capture filename is less than or equal to 63 characters. When the filename is more than 63 characters, though the packet capture is successful, copying the capture to a disk fails.


Examples

The following example shows a type asp-drop capture:


ciscoasa# capture asp-drop type asp-drop acl-drop
ciscoasa# show capture asp-drop
 
 2 packets captured
 
 1: 04:12:10.428093       192.168.10.10.34327 > 10.94.0.51.15868: S
    2669456341:2669456341(0) win 4128 <mss 536> Drop-reason: (acl-drop)
    Flow is denied by configured rule
 2: 04:12:12.427330       192.168.10.10.34327 > 10.94.0.51.15868: S
    2669456341:2669456341(0) win 4128 <mss 536> Drop-reason: (acl-drop)
    Flow is denied by configured rule
 2 packets shown

The following example shows an ethernet-type capture:


ciscoasa# capture arp ethernet-type arp interface inside
ciscoasa# show cap arp

22 packets captured

   1: 05:32:52.119485       arp who-has 10.10.3.13 tell 10.10.3.12
   2: 05:32:52.481862       arp who-has 192.168.10.123 tell 192.168.100.100
   3: 05:32:52.481878       arp who-has 192.168.10.50 tell 192.168.100.10
   4: 05:32:53.409723       arp who-has 10.106.44.135 tell 10.106.44.244
   5: 05:32:53.772085       arp who-has 10.106.44.108 tell 10.106.44.248
   6: 05:32:54.782429       arp who-has 10.106.44.135 tell 10.106.44.244
   7: 05:32:54.784695       arp who-has 10.106.44.1 tell 11.11.11.112:

View the Crash Dump

If the ASA or ASA virtual crashes, you can view the crash dump information. We recommend that you contact Cisco TAC if you want to interpret the crash dump. See the show crashdump command in the command reference.

View the Coredump

A coredump is a snapshot of the running program when the program has terminated abnormally or crashed. Coredumps are used to diagnose or debug errors and save a crash for future off-site analysis. Cisco TAC may request that you enable the coredump feature to troubleshoot application or system crashes on the ASA or ASA virtual. See the coredump command in the command reference.

CPU Usage and Reporting

The CPU Utilization report summarizes the percentage of the CPU used within the time specified. Typically, the core operates at approximately 30 to 40 percent of total CPU capacity during non-peak hours and approximately 60 to 70 percent capacity during peak hours.

vCPU Usage in the ASA Virtual

Use the show cpu usage command on the ASA virtual to display CPU utilization statistics. The ASA virtual vCPU usage shows the amount of vCPUs used for the data path, control point, and external processes.

The vCPU usage reported by the cloud service provider (such as VMware, Azure, OCI, and so on) includes the ASA virtual usage as described plus:

  • ASA virtual idle time

  • %SYS overhead used for the ASA virtual VM

  • Overhead of moving packets between vSwitches, vNICs, and pNICs. This overhead can be quite significant.

CPU Usage Example

The following is an example in which the reported vCPU usage is substantially different:

  • ASA Virtual reports: 40%

  • DP: 35%

  • External Processes: 5%

  • vSphere reports: 95%

  • ASA (as ASA virtual reports): 40%

  • ASA idle polling: 10%

  • Overhead: 45%

The overhead is used to perform hypervisor functions and to move packets between NICs and vNICs using the vSwitch.

Usage can exceed 100% because the ESXi server can use additional compute resources for overhead on behalf of the ASA virtual.

VMware CPU Usage Reporting

In vSphere, click the VM Performance tab, then click Advanced to display the Chart Options drop-down list, which shows vCPU usage for each state (%USER, %IDLE, %SYS, and so on) of the VM. This information is useful for understanding VMware’s perspective on where CPU resources are being used.

On the ESXi server shell (you access the shell by using SSH to connect to the host), esxtop is available. Esxtop has a similar look and feel to the Linux top command and provides VM state information for vSphere performance, including the following:

  • Details on vCPU, memory, and network usage

  • vCPU usage for each state of each VM.

  • Memory (type M while running) and network (type N while running), as well as statistics and the number of RX drops

ASA Virtual and vCenter Graphs

There are differences in the CPU % numbers between the ASA virtual and vCenter:

  • The vCenter graph numbers are always higher than the ASA virtual numbers.

  • vCenter calls it %CPU usage; the ASA virtual calls it %CPU utilization.

The terms “%CPU utilization” and “%CPU usage” mean different things:

  • CPU utilization provides statistics for physical CPUs.

  • CPU usage provides statistics for logical CPUs, which is based on CPU hyperthreading. But because only one vCPU is used, hyperthreading is not turned on.

vCenter calculates the CPU % usage as follows:

Amount of actively used virtual CPUs, specified as a percentage of the total available CPUs

This calculation is the host view of the CPU usage, not the guest operating system view, and is the average CPU utilization over all available virtual CPUs in the virtual machine.

For example, if a virtual machine with one virtual CPU is running on a host that has four physical CPUs and the CPU usage is 100%, the virtual machine is using one physical CPU completely. The virtual CPU usage calculation is Usage in MHz / number of virtual CPUs x core frequency

When you compare the usage in MHz, both the vCenter and ASA virtual numbers match. According to the vCenter graph, MHz % CPU usage is calculated as 60/(2499 x 1 vCPU) = 2.4

Amazon CloudWatch CPU Usage Reporting

You can view the metrics explorer to monitor resources by their tags and properties. Perform the following steps to view CPU utilization statistics for a specific instance:

Procedure


Step 1

Open the CloudWatch console and choose Metrics in the navigation pane.

Step 2

Select the EC2 metric namespace and select Per-instance Metrics dimension.

Step 3

Enter CPUUtilization in the search field and press Enter. Select the row for the required instance to display a graph for the CPUUtilization metric for that instance.

See Amazon CloudWatch documentation for more information.


ASA Virtual and Amazon CloudWatch Graphs

The Amazon CloudWatch graph numbers are higher than the numbers because of the different ways in which CPU usage is calculated on the ASA virtual and the CloudWatch.

When ASA virtual is running in poll mode, each CPU runs a loop of lightweight commands instead of entering power saving mode or any other idle state. This improves performance by keeping each core active at all times instead of having to be turned on/off or have their clocks adjusted by the Intel power states.

Inside ASA virtual, this activity is understood to be idling behaviour, and the CPU usage is correctly calculated. However, on the Amazon CloudWatch, the idle behaviour appears like normal CPU activity because all CPU cycles have instructions to run, and this causes the CloudWatch to display a high CPU usage percentage (85-90%).

Azure CPU Usage Reporting

Perform the following steps to view CPU utilization % across all monitored VMs by using VM Insights from the Azure Monitor:

Procedure


Step 1

Go to the Azure portal, select Monitor and choose Virtual Machines in the Solutions section.

Step 2

Select the Performance tab to display the CPU Utilization % chart. This chart displays the top five machines with the highest average processor utilization.


Perform the following steps to view the CPU utilization % chart directly from a specific Azure VM:

Procedure

Step 1

Go to the Azure portal and select Virtual Machines.

Step 2

From the list of VMs, choose a VM.

Step 3

In the Monitoring section, select Insights.

Step 4

Select the Performance tab.

See How to chart performance with VM Insights for more information.


ASA Virtual and Azure Graphs

There are differences in the CPU % numbers between the ASA virtual and Azure. The Azure graph numbers are always higher than the ASA virtual numbers because Azure calculates the CPU % usage as the amount of actively used virtual CPUs, specified as a percentage of the total available CPUs.

This calculation is the host view of the CPU usage, not the guest operating system view, and is the average CPU utilization over all available virtual CPUs in the virtual machine.

For example, if a virtual machine with one virtual CPU is running on a host that has four physical CPUs and the CPU usage is 100%, the virtual machine is using one physical CPU completely. The virtual CPU usage calculation is Usage in MHz / number of virtual CPUs x core frequency.

Azure also rate limits the amount of CPU that is requested by the guest OS. Consider a scenario in which ASA virtual is reporting CPU usage at 40% and the hypervisor is reporting CPU usage at 90%. Now, if the ASA virtual needs more processing power, the CPU usage may go above 80% and the hypervisor may then report CPU usage at more than 95%. This leads to the hypervisor throttling the ASA virtual CPU even though the ASA virtual is just running a loop of lightweight commands in poll mode exhibiting idling behavior.

Hyper-V CPU Usage Reporting

In addition to viewing CPU, RAM, and disk space configuration information for available Cloud Servers, you can also view disk, I/O, and networking information. Use this information to help you decide which Cloud Server is right for your needs. You can view the available servers through either the command-line nova client or the Cloud Control Panel interface.

On the command line, run the following command:

nova flavor-list

All available server configurations are displayed. The list contains the following information:

  • ID - The server configuration ID

  • Name - The configuration name, labeled by RAM size and performance type

  • Memory_MB - The amount of RAM for the configuration

  • Disk - The size of the disk in GB (for general purpose Cloud Servers, the size of the system disk)

  • Ephemeral - The size of the data disk

  • Swap - The size of the swap space

  • VCPUs - The number of virtual CPUs associated with the configuration

  • RXTX_Factor - The amount of bandwidth, in Mbps, allocated to the PublicNet ports, ServiceNet ports, and isolated networks (cloud networks) attached to a server

  • Is_Public - Not used

ASA Virtual and Hyper-V Graphs

There are differences in the CPU % numbers between the ASA Virtual and Hyper-V:

  • The Hyper-V graph numbers are always higher than the ASA Virtual numbers.

  • Hyper-V calls it %CPU usage; the ASA Virtual calls it %CPU utilization.

The terms “%CPU utilization” and “%CPU usage” mean different things:

  • CPU utilization provides statistics for physical CPUs.

  • CPU usage provides statistics for logical CPUs, which is based on CPU hyperthreading. But because only one vCPU is used, hyperthreading is not turned on.

Hyper-V calculates the CPU % usage as follows:

Amount of actively used virtual CPUs, specified as a percentage of the total available CPUs

This calculation is the host view of the CPU usage, not the guest operating system view, and is the average CPU utilization over all available virtual CPUs in the virtual machine.

For example, if a virtual machine with one virtual CPU is running on a host that has four physical CPUs and the CPU usage is 100%, the virtual machine is using one physical CPU completely. The virtual CPU usage calculation is Usage in MHz / number of virtual CPUs x core frequency


Note


It is recommended to look into ASA Virtual reports to get an accurate CPU usage percentage.


OCI CPU Usage Reporting

You can view the CPU utilization % in OCI by using the compute instance metric: oci_computeagent. The CpuUtilization metric displays the activity level from the CPU and is expressed as a percentage of total time. Perform the following steps to view metric charts for a single compute instance:

Procedure


Step 1

Open the navigation menu and click Instances under Compute.

Step 2

Click an instance and click Metrics under Resources.

Step 3

Select oci_computeagent in the Metric namespace list.

See Compute Instance Metrics for more information.


ASA Virtual and OCI Graphs

The OCI graph numbers are always higher than the ASA virtual numbers because OCI calculates the CPU % usage as the amount of actively used virtual CPUs, specified as a percentage of the total available CPUs.

This calculation is the host view of the CPU usage, not the guest operating system view, and is the average CPU utilization over all available virtual CPUs in the virtual machine.

For example, if a virtual machine with one virtual CPU is running on a host that has four physical CPUs and the CPU usage is 100%, the virtual machine is using one physical CPU completely. The virtual CPU usage calculation is Usage in MHz / number of virtual CPUs x core frequency.

Test Your Configuration

This section describes how to test connectivity for the single mode ASA or for each security context, how to ping the ASA interfaces, and how to allow hosts on one interface to ping through to hosts on another interface.

Test Basic Connectivity: Pinging Addresses

Ping is a simple command that lets you determine if a particular address is alive and responsive. The following topics explain more about the command and what types of testing you can accomplish with it.

What You Can Test Using Ping

When you ping a device, a packet is sent to the device and the device returns a reply. This process enables network devices to discover, identify, and test each other.

You can use ping to do the following tests:

  • Loopback testing of two interfaces—You can initiate a ping from one interface to another on the same ASA, as an external loopback test to verify basic “up” status and operation of each interface.

  • Pinging to an ASA—You can ping an interface on another ASA to verify that it is up and responding.

  • Pinging through an ASA—You can ping through an intermediate ASA by pinging a device on the other side of the ASA. The packets will pass through two of the intermediate ASA’s interfaces as they go in each direction. This action performs a basic test of the interfaces, operation, and response time of the intermediate unit.

  • Pinging to test questionable operation of a network device—You can ping from an ASA interface to a network device that you suspect is functioning incorrectly. If the interface is configured correctly and an echo is not received, there might be problems with the device.

  • Pinging to test intermediate communications—You can ping from an ASA interface to a network device that is known to be functioning correctly. If the echo is received, the correct operation of any intermediate devices and physical connectivity is confirmed.

Choosing Between ICMP and TCP Ping

The ASA includes the traditional ping, which sends ICMP Echo Request packets and gets Echo Reply packets in return. This is the standard tool and works well if all intervening network devices allow ICMP traffic. With ICMP ping, you can ping IPv4 or IPv6 addresses, or host names.

However, some networks prohibit ICMP. If this is true of your network, you can instead use TCP ping to test network connectivity. With TCP ping, the ping sends TCP SYN packets, and considers the ping a success if it receives a SYN-ACK in response. With TCP ping, you can ping IPv4 addresses or host names, but you cannot ping IPv6 addresses.

Keep in mind that a successful ICMP or TCP ping simply means that the address you are using is alive and responding to that specific type of traffic. This means that basic connectivity is working. Other policies running on a device could prevent specific types of traffic from successfully getting through a device.

Enable ICMP

By default, you can ping from a high security interface to a low security interface. You just need to enable ICMP inspection to allow returning traffic through. If you want to ping from low to high, then you need to apply an ACL to allow traffic.

When pinging an ASA interface, any ICMP rules applied to the interface must allow Echo Request and Echo Response packets. ICMP rules are optional: if you do not configure them, all ICMP traffic to an interface is allowed.

This procedure explains all of ICMP configuration you might need to complete to enable ICMP pinging of ASA interfaces, or for pinging through an ASA.

Procedure

Step 1

Ensure ICMP rules allow Echo Request/Echo Response.

ICMP rules are optional and apply to ICMP packets sent directly to an interface. If you do not apply ICMP rules, all ICMP access is allowed. In this case, no action is required.

However, if you do implement ICMP rules, ensure that you include at least the following on each interface, replacing “inside” with the name of an interface on your device.


ciscoasa(config)# icmp permit 0.0.0.0 0.0.0.0 echo inside
ciscoasa(config)# icmp permit 0.0.0.0 0.0.0.0 echo-reply inside

Step 2

Ensure access rules allow ICMP.

When pinging a host through an ASA, access rules must allow ICMP traffic to leave and return. The access rule must at least allow Echo Request/Echo Reply ICMP packets. You can add these rules as global rules.

Assuming you already have access rules applied to interfaces or applied globally, simply add these rules to the relevant ACL, for example:


ciscoasa(config)# access-list outside_access_in extendedpermit icmp any anyecho       
ciscoasa(config)# access-list outside_access_in extendedpermit icmp any anyecho-reply 

Alternatively, just allow all ICMP:


ciscoasa(config)# access-list outside_access_in extendedpermit icmp any any       

If you do not have access rules, you will need to also allow the other type of traffic you want, because applying any access rules to an interface adds an implicit deny, so all other traffic will be dropped. Use the access-group command to apply the ACL to an interface or globally.

If you are simply adding the rule for testing purposes, you can use the no form of the access-list command to remove the rule from the ACL. If the entire ACL is simply for testing purposes, use the no access-group command to remove the ACL from the interface.

Step 3

Enable ICMP inspection.

ICMP inspection is needed when pinging through the ASA, as opposed to pinging an interface. Inspection allows returning traffic (that is, the Echo Reply packet) to return to the host that initiated the ping, and also ensures there is one response per packet, which prevents certain types of attack.

You can simply enable ICMP inspection in the default global inspection policy.


ciscoasa(config)# policy-map  global_policy
ciscoasa(config-pmap)# class inspection_default
ciscoasa(config-pmap-c)# inspect icmp


Ping Hosts

To ping any device, you simply enter ping with the IP address or host name, such as ping 10.1.1.1 or ping www.example.com. For TCP ping, you include the tcp keyword and the destination port, such as ping tcp www.example.com 80. That is usually the extent of any test you need to run.

Example output for a successful ping:


Sending 5, 100-byte ICMP Echos to out-pc, timeout is 2 seconds:
!!!!!
Success rate is 100 percent (5/5), round-trip min/avg/max = 1/1/1 ms

If the ping fails, the output indicates ? for each failed attempt, and the success rate is less than 100 percent (complete failure is 0 percent):


Sending 5, 100-byte ICMP Echos to 10.132.80.101, timeout is 2 seconds:
?????
Success rate is 0 percent (0/5)

However, you can also add parameters to control some aspects of the ping. Following are your basic options:

  • ICMP ping.

    ping [if_name] host [repeat count] [timeout seconds] [data pattern] [size bytes] [validate]

    Where:

    • if_name specifies the source IP address for the ping; however, the egress interface is determined by a route lookup using the data routing table.

    • host is the IPv4, IPv6, or host name of the host you are pinging.

    • repeat count is how many packets to send. The default is 5.

    • timeout seconds is the number of seconds for each packet to time out if no response occurs. The default is 2.

    • data pattern is the hexadecimal pattern to use in the packets sent. The default is 0xabcd.

    • size bytes is the length of the packet sent. The default is 100 bytes.

    • validate indicates that you want reply data validated.

  • TCP ping.

    ping tcp [if_name] host [port] [repeat count] [timeout seconds] [source host [ports]

    Where:

    • if_name specifies the source IP address for the ping; however, the egress interface is determined by a route lookup using the data routing table.

    • host is the IPv4 address or host name of the destination you are pinging. You cannot use TCP ping with IPv6 addresses.

    • port is the TCP port on the host you are pinging.

    • repeat and timeout have the same meaning as above.

    • source host port indicates the source IP address and port for the ping. Use port 0 to get a random port.

  • Interactive ping.

    ping

    By entering ping without parameters, you are prompted for interface, destination, and other parameters, including extended parameters not available as keywords. Use this method if you have need for extensive control over the ping packets.

Test ASA Connectivity Systematically

If you want to do a more systematic test of ASA connectivity, you can use the following general procedure.

Before you begin

If you want to see the syslog messages mentioned in the procedure, enable logging (the logging enable command, or Configuration > Device Management > Logging > Logging Setup in ASDM).

Although unnecessary, you can also enable ICMP debug to see messages on the ASA console as you ping ASA interfaces from external devices (you will not see debug messages for pings that go through the ASA). We recommend that you only enable pinging and debugging messages during troubleshooting, as they can affect performance. The following example enables ICMP debugging, sets syslog messages to be sent to Telnet or SSH sessions and sends them to those sessions, and enables logging. Instead of using the logging monitor debug command, you can alternately use the logging buffer debug command to send log messages to a buffer, and then view them later using the show loggingcommand.


ciscoasa(config)# debug icmp trace    
ciscoasa(config)# logging monitor debug   
ciscoasa(config)# terminal monitor  
ciscoasa(config)# logging enable   

With this configuration, you would see something like the following for a successful ping from an external host (209.165.201.2) to the ASA outside interface (209.165.201.1):


ciscoasa(config)# debug icmp trace 
Inbound ICMP echo reply (len 32 id 1 seq 256) 209.165.201.1 > 209.165.201.2
Outbound ICMP echo request (len 32 id 1 seq 512) 209.165.201.2 > 209.165.201.1
Inbound ICMP echo reply (len 32 id 1 seq 512) 209.165.201.1 > 209.165.201.2
Outbound ICMP echo request (len 32 id 1 seq 768) 209.165.201.2 > 209.165.201.1
Inbound ICMP echo reply (len 32 id 1 seq 768) 209.165.201.1 > 209.165.201.2
Outbound ICMP echo request (len 32 id 1 seq 1024) 209.165.201.2 > 209.165.201.1
Inbound ICMP echo reply (len 32 id 1 seq 1024) 209.165.201.1 > 209.165.201.2

The output shows the ICMP packet length (32 bytes), the ICMP packet identifier (1), and the ICMP sequence number (the ICMP sequence number starts at 0, and is incremented each time that a request is sent).

When you are finished testing, disable debugging. Leaving the configuration in place can pose performance and security risks. If you enabled logging just for testing, you can disable it also.


ciscoasa(config)# no debug icmp trace 
ciscoasa(config)# no logging monitor debug 
ciscoasa(config)# no terminal monitor 
ciscoasa(config)# no logging enable 
Procedure

Step 1

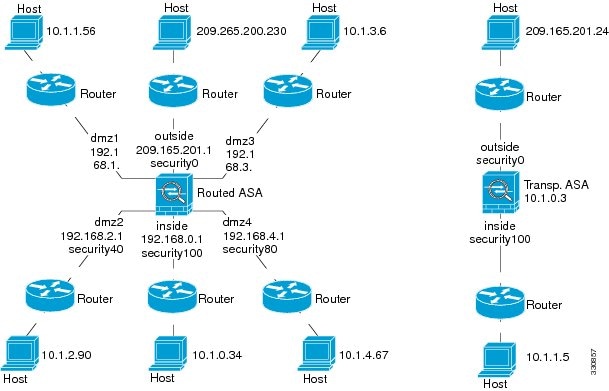
Draw a diagram of your single-mode ASA or security context that shows the interface names, security levels, and IP addresses. The diagram should also include any directly connected routers and a host on the other side of the router from which you will ping the ASA.

Figure 1. Network Diagram with Interfaces, Routers, and Hosts

Step 2

Ping each ASA interface from the directly connected routers. For transparent mode, ping the BVI IP address. This test ensures that the ASA interfaces are active and that the interface configuration is correct.

A ping might fail if the ASA interface is not active, the interface configuration is incorrect, or if a switch between the ASA and a router is down (see the following figure). In this case, no debugging messages or syslog messages appear, because the packet never reaches the ASA.

Figure 2. Ping Failure at the ASA Interface
Figure 3. Ping Failure Because of IP Addressing Problems

If the ping reply does not return to the router, then a switch loop or redundant IP addresses might exist (see the following figure).

Step 3

Ping each ASA interface from a remote host. For transparent mode, ping the BVI IP address. This test checks whether the directly connected router can route the packet between the host and the ASA, and whether the ASA can correctly route the packet back to the host.

A ping might fail if the ASA does not have a return route to the host through the intermediate router (see the following figure). In this case, the debugging messages show that the ping was successful, but syslog message 110001 appears, indicating a routing failure has occurred.

Figure 4. Ping Failure Because the ASA Has No Return Route

Step 4

Ping from an ASA interface to a network device that you know is functioning correctly.

  • If the ping is not received, a problem with the transmitting hardware or interface configuration may exist.

  • If the ASA interface is configured correctly and it does not receive an echo reply from the “known good” device, problems with the interface hardware receiving function may exist. If a different interface with “known good” receiving capability can receive an echo after pinging the same “known good” device, the hardware receiving problem of the first interface is confirmed.

Step 5

Ping from the host or router through the source interface to another host or router on another interface. Repeat this step for as many interface pairs as you want to check. If you use NAT, this test shows that NAT is operating correctly.

If the ping succeeds, a syslog message appears to confirm the address translation for routed mode (305009 or 305011) and that an ICMP connection was established (302020). You can also enter either the show xlate or show conns command to view this information.

The ping might fail because NAT is not configured correctly. In this case, a syslog message appears, showing that the NAT failed (305005 or 305006). If the ping is from an outside host to an inside host, and you do not have a static translation, you get message 106010.

Figure 5. Ping Failure Because the ASA is Not Translating Addresses

Trace Routes to Hosts

If you are having problems sending traffic to an IP address, you can trace the route to the host to determine if there is a problem on the network path.

Procedure


Step 1

Make the ASA Visible on Trace Routes.

Step 2

Determine Packet Routes.


Make the ASA Visible on Trace Routes

By default, the ASA does not appear on traceroutes as a hop. To make it appear, you need to decrement the time-to-live on packets that pass through the ASA, and increase the rate limit on ICMP unreachable messages.

Procedure

Step 1

Create an L3/L4 class map to identify the traffic for which you want to customize connection settings.

class-map name

match parameter

Example:

ciscoasa(config)# class-map CONNS  
ciscoasa(config-cmap)# match any   

For information on matching statements, see the Service Policy chapter in the firewall configuration guide.

Step 2

Add or edit a policy map that sets the actions to take with the class map traffic, and identify the class map.

policy-map name class name

Example:

ciscoasa(config)# policy-map global_policy  
ciscoasa(config-pmap)# class CONNS   

In the default configuration, the global_policy policy map is assigned globally to all interfaces. If you want to edit the global_policy, enter global_policy as the policy name. For the class map, specify the class you created earlier in this procedure.

Step 3

Decrement time-to-live (TTL) on packets that match the class.


set connection decrement-ttl

Step 4

If you are editing an existing service policy (such as the default global policy called global_policy), you can skip this step. Otherwise, activate the policy map on one or more interfaces.


service-policy policymap_name {global | interface interface_name      }
Example:

ciscoasa(config)# service-policy global_policy global    

The global keyword applies the policy map to all interfaces, and interface applies the policy to one interface. Only one global policy is allowed. You can override the global policy on an interface by applying a service policy to that interface. You can only apply one policy map to each interface.

Step 5

Increase the rate limit on ICMP Unreachable messages so that the ASA will appear on trace route output.

icmp unreachable rate-limit rate burst-size size

Example:

ciscoasa(config)# icmp unreachable rate-limit 50 burst-size 1        

The rate limit can be 1-100, with 1 being the default. The burst size is meaningless, but must be 1-10.


Example

The following example decrements TTL for all traffic globally and increase the ICMP unreachable limit to 50.


ciscoasa(config)# class-map global-policy
ciscoasa(config-cmap)# match any
ciscoasa(config-cmap)# exit
ciscoasa(config)# policy-map global_policy
ciscoasa(config-pmap)# class global-policy
ciscoasa(config-pmap-c)# set connection decrement-ttl
ciscoasa(config-pmap-c)# exit
ciscoasa(config)# icmp unreachable rate-limit 50 burst-size 6

Determine Packet Routes

Use Traceroute to help you to determine the route that packets will take to their destination. A traceroute works by sending UDP packets or ICMPv6 echo to a destination on an invalid port. Because the port is not valid, the routers along the way to the destination respond with an ICMP or ICMPv6 Time Exceeded Message, and report that error to the ASA.

The traceroute shows the result of each probe sent. Every line of output corresponds to a TTL value in increasing order. The following table explains the output symbols.

Output Symbol

Description

*

No response was received for the probe within the timeout period.

U

No route to the destination.

nn msec

For each node, the round-trip time (in milliseconds) for the specified number of probes.

!N.

ICMP network unreachable. For ICMPv6, address is out of scope.

!H

ICMP host unreachable.

!P

ICMP unreachable. For ICMPv6, port not reachable.

!A

ICMP administratively prohibited.

?

Unknown ICMP error.

Procedure

Trace the route to a destination:

traceroute [destination_ip | hostname} [source {source_ip | source-interface}] [numeric] [timeout timeout_value] [probe probe_num] [ttl min_ttl max_ttl] [port port_value] [use-icmp]

Example:

ciscoasa# traceroute 209.165.200.225

Type escape sequence to abort.
Tracing the route to 209.165.200.225

1 10.83.194.1 0 msec 10 msec 0 msec
2 10.83.193.65 0 msec 0 msec 0 msec
3 10.88.193.101 0 msec 10 msec 0 msec
4 10.88.193.97 0 msec 0 msec 10 msec
5 10.88.239.9 0 msec 10 msec 0 msec
6 10.88.238.65 10 msec 10 msec 0 msec
7 172.16.7.221 70 msec 70 msec 80 msec
8 209.165.200.225 70 msec 70 msec 70 msec

ciscoasa# traceroute 2002::130

Type escape sequence to abort.
Tracing the route to 2002::130

 1  5000::2 0 msec 0 msec 0 msec
 2  2002::130 10 msec 0 msec 0 msec

Normally, you simply include the destination IP address or hostname, such as traceroute www.example.com. However, you can adjust the characteristics of the trace if desired:

  • source {source_ip | source-interface}—Specifies the interface to use as the source of the trace. You can specify the interface by name or by IP address. For IPv6, you cannot specify the source interface; you can only specify the source IP address. An IPv6 address is valid only if you enabled IPv6 on an ASA interface. In transparent mode, you must use the management address.

  • numeric—Indicates that only the IP addresses should be shown in the trace route. Without this keyword, the trace route does DNS lookups for addresses and includes DNS names, assuming that you configure DNS.

  • timeout timeout_value—How long to wait for a response before timing out. The default is 3 seconds.

  • probe probe_num—How many probes to send at each TTL level. The default is 3.

  • ttl min_ttl max_ttl—The minimum and maximum time-to-live values for the probes. The minimum default is one, but you can set it to a higher value to suppress the display of known hops. The maximum default is 30. The traceroute terminates when the packet reaches the destination or when the maximum value is reached.

  • port port_value—The UDP port to use. The default is 33434.

  • use-icmp—Send ICMP packets instead of UDP packets for probes.


Using the Packet Tracer to Test Policy Configuration

You can test your policy configuration by modeling a packet based on source and destination addressing and protocol characteristics. The trace does policy lookup to test access rules, NAT, routing, and so forth, to see if the packet would be permitted or denied.

By testing packets this way, you can see the results of your policies and test whether the types of traffic you want to allow or deny are handled as desired. Besides verifying your configuration, you can use the tracer to debug unexpected behavior, such as packets being denied when they should be allowed.

Procedure


Step 1

The command is complicated, so we divided it into parts. Start by choosing the interface and protocol for the trace:

packet-tracer input ifc_name [vlan-idvlan_id ] {icmp | tcp | udp | rawip | sctp} [inline-tag tag] ...

Where:

  • input ifc_name—The name of the interface from which to start the trace. For a bridge group, specify the bridge group member interface name.

  • vlan-id vlan_id—(Optional.) The virtual LAN, where packet tracer enters a parent interface, which is later redirected to a sub-interface. VLAN identity is available only when the input interface is not a sub-interface. Valid values range from 1 - 4096.

  • icmp, tcp, udp, rawip, sctp —The protocol to use. “rawip” is raw IP, that is, IP packets that are not TCP/UDP.

  • inline-tag tag—(Optional.) The security group tag value embedded in the Layer 2 CMD header. Valid values range from 0 - 65533.

Step 2

Next, type in the source address and protocol criteria.

...{src_ip | user username | security-group {name name | tag tag} | fqdn fqdn-string}...

Where:

  • src_ip—The source IPv4 or IPv6 address for the packet trace.

  • user username—The user identity in the format of domain\user. The most recently mapped address for the user (if any) is used in the trace.

  • security-group {name name | tag tag}—The source security group based on the IP-SGT lookup for Trustsec. You can specify a security group name or a tag number.

  • fqdn fqdn-string—The fully qualified domain name of the source host, IPv4 only.

Step 3

Next, type in the protocol characteristics.

  • ICMP—Enter the ICMP type (1-255), ICMP code (0-255), and optionally, the ICMP identifier. You must use numbers for each variable, for example, 8 for echo.

    type code... [ident]...

  • TCP/UDP/SCTP—Enter the source port number.

    ...src_port ...

  • Raw IP—Enter the protocol number, 0-255.

    ... protocol ...

Step 4

Finally, type in the destination address criteria, destination port for TCP/UDP traces, and optional keywords, and press Enter.

...dmac {dst_ip | security-group {name name | tag tag} | fqdn fqdn-string} dst_port [detailed] [xml]

Where:

  • dst_ip—The destination IPv4 or IPv6 address for the packet trace.

  • security-group {name name | tag tag}—The destination security group based on the IP-SGT lookup for Trustsec. You can specify a security group name or a tag number.

  • fqdn fqdn-string—The fully qualified domain name of the destination host, IPv4 only.

  • dst_port—The destination port for TCP/UDP/SCTP traces. Do not include this value for ICMP or raw IP traces.

  • dmac—(Transparent mode) The Destination MAC address.

  • detailed—Provides detailed trace results information in addition to the normal output.

  • xml—Displays the trace results in XML format.

Step 5

Type in the persist option for packet tracer to debug packets across cluster units.

  • You can allow simulated packets to egress the ASA by using the transmit option.

  • To skip security checks like ACL, VPN filters, IPsec spoof, and uRPF, use the bypass-checks option.

  • Using the decrypted option, you can inject a decrypted packet in a VPN tunnel and also simulate a packet that comes across a VPN tunnel.

Step 6

Type in the id and origin for tracking a specific packet in the cluster units.

  • id—The identity number assigned by the unit that starts the trace.

  • origin—Indicates the cluster unit that commences the trace.


Example

The following example traces a TCP packet for the HTTP port from 10.100.10.10 to 10.100.11.11. The result indicates that the packet will be dropped by the implicit deny access rule.

ciscoasa(config)# packet-tracer input outside tcp 10.100.10.10 80 10.100.11.11 80        

Phase: 1
Type: ROUTE-LOOKUP
Subtype: Resolve Egress Interface
Result: ALLOW
Config:
Additional Information:
found next-hop 10.86.116.1 using egress ifc  outside

Phase: 2
Type: ACCESS-LIST
Subtype:
Result: DROP
Config:
Implicit Rule
Additional Information:

Result:
input-interface: outside
input-status: up
input-line-status: up
output-interface: NP Identity Ifc
output-status: up
output-line-status: up
Action: drop
Drop-reason: (acl-drop) Flow is denied by configured rule

Monitoring Connections

To view current connections with information about source, destination, protocol, and so forth, use the show conn all detail command.

History for Testing and Troubleshooting

Feature Name

Platform Releases

Description

IPv6 support for traceroute

9.7(1)

The traceroute command was modified to accept an IPv6 address.

We modified the following command: traceroute

Support for the packet tracer for bridge group member interfaces

9.7(1)

You can now use the packet tracer for bridge group member interfaces.

We added two new options to the packet-tracer command; vlan-id and dmac

Manually start and stop packet captures

9.7(1)

You can now manually stop and start the capture.

Added/Modified commands: capture stop

Enhanced packet tracer and packet capture capabilities

9.9(1)

The packet tracer has been enhanced with the following features:

  • Trace a packet when it passes between cluster units.

  • Allow simulated packets to egress the ASA.

  • Bypass security checks for a similated packet.

  • Treat a simulated packet as an IPsec/SSL decrypted packet.

The packet capture has been enhanced with the following features:

  • Capture packets after they are decrypted.

  • Capture traces and retain them in the persistent list.

New or modified commands: cluster exec capture test trace include-decrypted, cluster exec capture test trace persist, cluster exec clear packet-tracer, cluster exec show packet-tracer id, cluster exec show packet-tracer origin, packet-tracer persist, packet-tracer transmit, packet-tracer decrypted, packet-tracer bypass-checks

Packet capture support for matching IPv6 traffic without using an ACL

9.10(1)

If you use the match keyword for the capture command, the any keyword only matches IPv4 traffic. You can now specify any4 and any6 keywords to capture either IPv4 or IPv6 traffic. The any keyword continues to match only IPv4 traffic.

New/Modified commands: capture match

New debug telemetry command for Forepower 9300/4100.

9.14(1)

If you use the debug telemetry command, debug messages related to telemetry are displayed. The debugs help to identify the cause for errors when generating the telemetry report.

New/Modified commands: [ no ] debug telemetry ,show debug telemetry

ping command changes

9.18(2)

To support pinging a loopback interface, the ping command now has changed behavior. If you specify the interface in the command, the source IP address matches the specified interface IP address, but the actual egress interface is determined by a route lookup using the data routing table.

New/Modified commands: ping