Monitoring and Reporting Change Logs, Workflows, and Jobs

Security Cloud Control effectively monitors configuration change logs, bulk device operations, and the process that runs when communicating with devices. This helps you understand how your network's existing policies influence its security posture.

Manage Change Logs in Security Cloud Control

A Change Log captures the configuration changes made in Security Cloud Control, providing a single view that includes changes in all the supported devices and services. These are some of the features of the change log:

  • Provides a side-by-side comparison of changes made to device configuration.

  • Provides labels for all change log entries.

  • Records onboarding and removal of devices.

  • Detects policy change conflicts occurring outside Security Cloud Control.

  • Provides answers about who, what, and when during an incident investigation or troubleshooting.

  • Enables downloading of the complete change log, or only a portion of it, as a CSV file.

Manage Change Log Capacity

Security Cloud Control retains the change log information for one year and deletes data older than a year.

There is a difference between the change log information stored in Security Cloud Control's database and what you see in an exported change log. See Export the Change Log for more information.

Change Log Entries

A change log entry reflects the changes to a single device configuration, an action performed on a device, or the change made to a device outside Security Cloud Control:

  • For change log entries that contain configuration changes, you can view details about the change by clicking anywhere in the corresponding row.

  • For out-of-band changes made outside Security Cloud Control and are detected as conflicts, the System User is reported as the Last User.

  • Security Cloud Control closes a change log entry after a device's configuration on Security Cloud Control is synced with the configuration on the device, or when a device is removed from Security Cloud Control. Configurations are considered to be in sync after they read the configuration from the device to Security Cloud Control or after deploying the configuration from Security Cloud Control to the device.

  • Security Cloud Control creates a new change log entry immediately after completing an existing entry, irrespective of whether the change was a success or failure. Additional configuration changes are added to the new change log entry that opens.

  • Events are displayed for read, deploy, and delete actions for a device. These actions close a device's change log.

  • A change log is closed after Security Cloud Control is in sync with the configuration on the device (either by reading or deploying), or when Security Cloud Control no longer manages the device.

  • If a change is made to the device outside of Security Cloud Control, a Conflict detected entry is included in the change log.

Pending and Completed Change Log Entries

Change logs have a status of either Pending or Completed. As you make changes to a device's configuration using Security Cloud Control, these changes are recorded in a Pending change log entry. The following activities complete a Pending change log, and after this a new change log is created for recording future changes.

  • Reading a configuration from a device to Security Cloud Control

  • Deploying changes from Security Cloud Control to a device

  • Deleting a device from Security Cloud Control

  • Running a CLI command that updates the running configuration file

Search and Filter Change Log Entries

You can search and filter change log entries. Use the search field to find events. Use the filter () to find the entries that meet the criteria you specify. You can also combine the two tasks by filtering the change log and adding a keyword to the search field to find an entry within the filtered results.

Change Log Entries After Deploying to FDM-Managed Device

The changes in the change log entries for FDM-managed devices are summarized in simple terms. Clicking a change in the change log entry provides information about the exact changes. After writing changes from Security Cloud Control to your FDM-managed device, the change log entry is moved to Completed state and Security Cloud Control creates a new entry for future changes. Clicking the Diff link in a change log entry row displays a side-by-side comparison of the changes in the context of the running configuration file.

Each row within a log contains a colored band or outline at the start of the row which indicate the state of the changes. As shown in the image below, red indicates deletions, blue indicates modifications, green indicates additions to the device configuration, and grey indicates messages.

The image below shows the log details for addition of a network object called HR_network. Look at the expanded section for Added HR_network. The Deployed Version contains information about the configuration present in the device. The Pending Version column contains the configuration that are yet to be updated. The Deployed Version column is empty because there was no HR_network object on the device before the change. The Pending Version column shows that HR_network object was created with the value 10.10.11.0/24.

Change Log Entries After Reading Changes from an FDM-Managed Device

When Security Cloud Control detects a change in an FDM-managed device, it registers a Conflict Detected state in the Security Devices page's Configuration Status column. It does not record this status in the change log.

When you accept configuration changes made outside Security Cloud Control, Security Cloud Control creates a job and displays the job's processing status in the lower-right corner of the interface. We recommend that you do not make additional changes until the current job is completed. Doing so might lead to the changes being lost.

After the job successfully completes, click "Diff" for the change log entry.

View Change Log Differences

Click Diff in the change log to open up a side-by-side comparison of the changes in the running configuration file of the device.

In the following figure, the Original Configuration column is the running configuration file before a change was written to the ASA. The Modified Configuration column shows the running configuration file after the change was written. In this case, the Original Configuration column highlights a row in the running configuration file; this row doesn't change, but gives you a point of reference in the Modified Configuration column.

Follow the lines across from the left to the right column to see the addition of the HR_network object and the access rule preventing addresses in the engineering network to reach addresses in the HR_network network. Click Previous and Next to move through the changes in the file.

Related Topics

Export the Change Log

You can export all or a subset of the Security Cloud Control change log to a comma-separated value (.csv) file so that you can filter and sort the information, as required.

To export the change log to a .csv file, follow this procedure:

Procedure


Step 1

In the left pane, click Events & Logs > Logs > Change Log.

Step 2

Find the changes you want to export by doing one of the following tasks:

  • Use the filter () and the search field to find what you want to export. For example, filter by device to see only the changes for your selected device or devices.

  • Clear all the filters and search criteria in the change log. This allows you to export the entire change log.

Note


Security Cloud Control retains 1 year of change log data. It is recommended to filter the change log contents and download the results ot a .csv file rather than downloading the entire change log history for a year.

Step 3

Click the export icon at the top right corner of the page.

Step 4

Save the .csv file to your local file system, with a descriptive name.


Differences Between Change Log Capacity in Security Cloud Control and Size of an Exported Change Log

The information that you export from Security Cloud Control's Change Log page is different from the change log information that Security Cloud Control stores in its database.

For every change log, Security Cloud Control stores two copies of the device's configuration–the starting configuration and either the ending configuration in the case of a closed change log or the current configuration in the case of an open change log. This allows Security Cloud Control to display configuration differences side by side. In addition, Security Cloud Control tracks and stores every step (change event) with the username that made the change, the time the change was made, and other details.

However, when you export the change log, the export does not include the two complete copies of the configuration. It only includes the change events, which makes the export file much smaller than the change log that Security Cloud Control stores.

Security Cloud Control stores change log information for a year. This includes two copies of the configuration.

Change Request Management

Change Request Management enables the linking of a Change Request and its business justification to a Change Log event. The Change Request is opened in a third-party ticketing system.

Use Change Request Management to create a Change Request in Security Cloud Control and associate it with change log events. You can search for this change request by Name within the change log.


Note


In Security Cloud Control, Change Request Tracking and Change Request Management refer to the same functionality.


Enable Change Request Management

Enabling change request tracking affects all users of your tenant.

Procedure


Step 1

In the left pane, click Administration > General Settings.

Step 2

Enable the Change Request Tracking toggle button.

When enabled, the Change Request menu appears at the bottom-left corner and the Change Request drop-down list is available in the Change Log page.


Create a Change Request

Procedure


Step 1

In Security Cloud Control, click the Create Change Request (+) icon in the Change Request menu at the bottom-left corner.

Step 2

Enter a Name and Description.

Ensure that the Name corresponds to a Change Request name that your organization intends to use, and that the Description describes the purpose of the change.

Note


You cannot modify the name of a Change Request after you create it.

Step 3

Click Save.

Note


When a Change Request is saved, Security Cloud Control associates all the new changes with the corresponding Change Request name. This association continues until you either disable change requests or clear the change request details from the menu.


Associate a Change Request with a Change Log Event

Procedure


Step 1

In the left pane, click Events & Logs > Logs > Change Log.

Step 2

Expand the change log to view the events you want to associate with a Change Request.

Step 3

Click the drop-down list adjacent to the corresponding change log entry.

Note


The latest change requests are displayed at the top of the change request list.

Step 4

Select a change request and click Select.


Search for Change Log Events with Change Requests

Procedure


Step 1

In the left pane, click Events & Logs > Logs > Change Log.

Step 2

In the change log search field, enter the name of a change request to find the associated change log events.

Security Cloud Control highlights the change log events that are exact matches.


Search for a Change Request

Procedure


Step 1

In Security Cloud Control, click the Create Change Request (+) icon in the Change Request menu at the bottom-left corner.

Step 2

Enter the name of the Change Request or a relevant keyword in the search field. As you enter a value, the results that partially match your input, appear in both the Name and Description fields.


Filter Change Requests

Procedure


Step 1

In the left pane, click Events & Logs > Logs > Change Log.

Step 2

Click the filter icon to view all the options.

Step 3

In the search field, enter the name of a Change Request.

As you enter a value, the results that partially match your entry appear.

Step 4

Select a change request by checking the corresponding check box.

The matches appear in the Change Log table. Security Cloud Control highlights the change log events that are exact matches.


Clear the Change Request Toolbar

To avoid automatic association of change log events with an existing change request, clear the information in the change request toolbar.

Procedure


Step 1

In Security Cloud Control, click the Create Change Request (+) icon in the Change Request menu at the bottom-left corner.

Step 2

Click Clear.

The Change Request menu now displays None.


Clear a Change Request Associated with a Change Log Event

Procedure


Step 1

In the left pane, click Events & Logs > Logs > Change Log.

Step 2

Expand the Change Log to view the events that you want to disassociate from Change Requests.

Step 3

Click the drop-down list adjacent to the corresponding change log entry.

Step 4

Click Clear.


Delete a Change Request

Deleting a Change Request removes it from the change request list, but not from the Change Log.

Procedure


Step 1

Click the Create Change Request (+) icon in the Change Request menu at the bottom-left corner.

Step 2

Select the change request and click the bin icon to delete it.

Step 3

Click the check mark to confirm.


Disable Change Request Management

Disabling Change Request Management or Change Request Tracking affects all users of your account.

Procedure


Step 1

In the left pane, click Administration > General Settings.

Step 2

Disable the Change Request Tracking toggle button.


Change Request Management Use Cases

These use cases assume that you have enabled Change Request Management.

Track Changes Made to the Firewall Device to Resolve a Ticket Maintained in an External System

This use case describes a scenario where you want to make changes to a firewall device to resolve a ticket maintained in an external system and want to associate the change log events resulting from these firewall changes to a change request. Follow this procedure to create a change request and associate change log events to it:

  1. Create a Change Request.

  2. Use the ticket name or number from the external system as the name of the change request and add the justification for the change and other relevant information in the Description field.

  3. Ensure that the new change request is visible in the change request toolbar.

  4. Make the changes to the firewall device.

  5. In the navigation pane, click Change Log and find the change log events that are associated with your new change request.

  6. Clear the Change Request Toolbar to avoid automatic association of change log events with an existing change request.

Manually Update Individual Change Log Events After Changes are Made to the Firewall Device

This use case describes a scenario where you have made changes to a firewall device to resolve a ticket that is maintained in an external system, but forgot to use the Change Request Management feature to associate change requests with the change log events. You want to update the change log events with the ticket number. Follow this procedure to associate change requests with change log events:

  1. Create a Change Request. Use the ticket name or number from the external system as the name of the change request. Use the Description field to add the justification for the change and other relevant information.

  2. In the navigation pane, click Change Log and search for the change log events that are associated with the changes.

  3. Associate a Change Request with a Change Log Event.

  4. Clear the Change Request Toolbar to avoid automatic association of change log events with an existing change request.

Search for Change Log Events Associated with a Change Request

This use case describes a scenario where, you want to find out what change log events were recorded in the change log because of the work done to resolve a ticket maintained in an external system. Follow this procedure to search for change log events that are associated with a change request:

  1. In the navigation pane, click Change Log.

  2. Search for change log events that are associated with change requests using one of the following methods below:

    • In the Change Log search field, enter the exact name of the change request to find change log events associated with that change request. Security Cloud Control highlights change log events that are exact matches.

    • Filter Change Requests to find the change log events.

  3. View each change log to find the highlighted change log events showing the associated change request.

FDM-Managed Device Executive Summary Report

The Executive Summary Report offers a collection of operational statistics for all FDM-managed devices. After a device is onboarded, Security Cloud Control might take up to two hours to collect this information from the Firewall Device Manager. After the initial report generation, data is compiled hourly. Note that report information is not part of the request for events. So events and reports are not available at the same cadence.

Data in the reports is generated when network traffic triggers an access rule or policy on an FDM-managed device. We strongly recommend that you enable malware defense and IPS licenses, as well as file logging for access rules, in order to allow a device to generate the events that are reflected in the reports.

Note that all of the information displayed in the report is dependent on the Time Range toggle button located at the top of the page. Policies may experience varying traffic or triggers during the time range you select.

If you experience issues with the Executive Summary Report or see an unexpected amount of traffic, see Troubleshoot the Executive Summary Report for more information.

Generate Network Operation Data

After a device is onboarded to Security Cloud Control, event data is automatically collected. The data that is collected is dependent on the device configuration. The license that is delivered with all FDM-managed devices does not support all the options within the Network Operations Report. We recommend the following configurations for the devices you want to collect data from:

  • Logging : Enable file logging on applicable access control rules. See Logging Settings in an FDM Access Control Rule for more information.

  • Malware Events: Enable the malware Smart License.

  • Security Intelligence: Enable the Smart License.

  • IPS Threats : Enable the Smart License.

  • Web Categories : Enable the URL Smart License.

  • Files Detected: Enable the Smart License.

See FDM-Managed Device Licensing Types for more information on smart licenses and the capabilities these licenses provide.


Note


The executive summary does not inherently include traffic that is flowing over VPN.


Overview

The Overview tab displays visuals from triggered rules, threats, and file types. These items are displayed numerically, with the largest or most frequently hit rules, events, or files listed first.

Malware events represent detected or blocked malware files only. Note that the disposition of a file can change, for example, from clean to malware or from malware to clean. We recommend that you Schedule a Security Database Update to keep your devices up to date with the latest intrusion rules (SRUs).

Top Ten Access Rule Hits offers three tabs you can toggle between to view the top ten rule transfers, connections, or rules that blocked packets.

Network Assessment

The Network Assessment tab addresses web site categories and detected file types. This display captures only the top ten most frequently encountered categories and file types. Other than selected time range, you cannot use this tab to determine when a specific web category or file type was detected.

Threats

The Threats tab displays statistics generated by intrusion events—Top Attacker captures the originating IP address of an event, Top Target captures the destination IP address of an event, and Top Threats captures the type of events that have been categorized as a threat.

This tab also provides details about the threats and malware types that are detected.

Generate a Report

After you configure the report to your preference, generate a PDF of the report. See Manging Reports for more information.

Generating FDM-Managed Device Executive Summary Reports

Security Cloud Control provides several reports that you can use to analyze the impact of your security policies on the traffic going through your FDM-managed devices. An Executive Summary Report summarizes the most impactful malware, threats, and impacted security intelligence. Security Cloud Control polls devices every hour to collect events. To learn more about what the executive summary offers, see FDM-Managed Device Executive Summary Report.


Important


The FDM-managed device reports are available only on the FDM-managed device that is currently onboarded to your tenant. These reports are generated hourly and are not part of the request for events. So events and reports are not available at the same cadence. After initially onboarding your FDM-managed device, Security Cloud Control may take up to two hours to generate reports. Until there are reports to display, the Reports tab under the Analytics option will not be visible.


If you are a Security Analytics and Logging subscriber, Network Reports do not reflect the events forwarded to the Secure Event Connector (SEC).


Note


The data used in traffic-related reports is collected from events triggered by access control rules and other security policies. The generated report does not show traffic for rules in which logging is not enabled, or rules that have not been triggered. Ensure that you configure your rules with the information that matters to you.


The following procedure shows how to generate an Executive Summary Report:

Procedure


Step 1

In the navigation pane, click Analytics > Executive Summary Report.

Step 2

Select the time range for the reports—24 Hours, 7 Dayss, 30 Days, or 90 Days.

Step 3

(Optional) Click the filter () icon to select a custom list of devices, for which to generate a report.

Step 4

Click Generate Report (PDF).

Step 5

To save the report as a PDF, click Save and choose Save as PDF in the Destination drop-down.

Step 6

Browse to the location in which you want to save the report, and click Save. If you do not want to save the report, click Cancel at any time.


Monitor Jobs in Security Cloud Control

The Jobs page provides an overview of the progress of bulk operations, such as reconnecting multiple devices, reading configurations from multiple devices, or upgrading multiple devices simultaneously. The Jobs table uses color-coded rows along with the status of individual actions, indicating if they have succeeded or failed.

One row in the table represents a single bulk operation. This one bulk operation may have been, for example, an attempt to reconnect 20 devices. Expanding a row in the Jobs page displays the results for each of the devices affected by the bulk operation.

You can reach the Jobs page in two different ways:

  • In the Notifications tab, when there is a new Job notification, click the Review link. You will be redirected to the Jobs page and see the specific job represented by the notification.

  • In the left pane, click Events & Logs > Events heading > Jobs. This table shows a complete list of the bulk actions performed in Security Cloud Control.

Search Jobs in Security Cloud Control

When you're on the Jobs page, you can filter and search by different actions, the users who performed them, and the action status.

Reinitiate a Bulk Action

After reviewing the Jobs page, if you find that one or more actions in a bulk action have failed, you can retry the bulk action after making the necessary corrections.. Note that Security Cloud Control will re-run the job only for the failed actions. To re-run a bulk action:

Procedure


Step 1

In the Jobs page. select the row that indicates a failed action.

Step 2

Click the Retry() icon.


Cancel a Bulk Action

You can cancel the bulk actions that are currently in progress on multiple devices. For example, if you have tried to reconnect four managed devices, and three of them have successfully reconnected, but the fourth device is still neither connected nor disconnected, you can cancel the bulk action.

To cancel a bulk action:

Procedure


Step 1

In the left pane, click Events & Logs > Events heading > Jobs.

Step 2

Identify the running bulk action and click the Cancel link on the right side.

Note


If any part of the bulk action is successful, it cannot be undone. Any ongoing action will be cancelled.


Monitor Workflows in Security Cloud Control

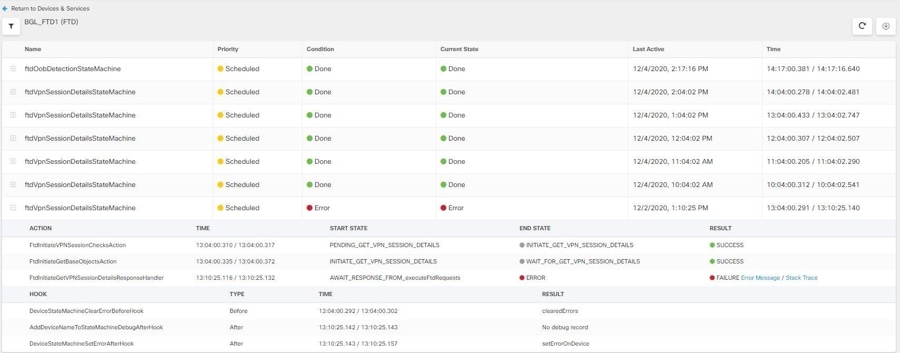
The Workflows page allows you to monitor every process that Security Cloud Control runs when communicating with devices, Secure Device Connector (SDC), or Secure Event Connector (SEC), and when applying ruleset changes to devices. Security Cloud Control creates an entry in the workflow table for every step and displays its outcome on this page. The entry contains information pertaining only to the action performed by Security Cloud Control and not the device it is interacting with.

Security Cloud Control reports an error when it fails to perform a task on a device. Navigate to the Workflows page to see the step where the error occurred, for more details.

This page also helps you determine and troubleshoot errors or share information with TAC, when required.

To navigate to the Workflows page, in the left pane, click Security Devices and, click the Devices tab. Click the appropriate device type tab to locate the device and select the device you want. Under the Devices and Actions in the right pane, click Workflows. This figure shows the Workflows page with entries in the Workflow table.

Export Device Workflows

You can download the complete workflow information to a JSON file and provide it when the TAC team asks for further analysis. To export the workflow information, select the corresponding device and, navigate to its Workflows page and click the export () icon appearing at the top-right corner.

Copy Stack Trace

If you have an error you cannot resolve and you approach TAC, they may ask you for a copy of the stack trace. To collect the stack trace for the error, click the Stack Trace link and click Copy Stacktrace to copy the stacks appearing on the screen, to a clipboard.