View the Security Dashboard
To view the Security Dashboard, in the left navigation pane, click Overview.
The documentation set for this product strives to use bias-free language. For the purposes of this documentation set, bias-free is defined as language that does not imply discrimination based on age, disability, gender, racial identity, ethnic identity, sexual orientation, socioeconomic status, and intersectionality. Exceptions may be present in the documentation due to language that is hardcoded in the user interfaces of the product software, language used based on RFP documentation, or language that is used by a referenced third-party product. Learn more about how Cisco is using Inclusive Language.
Security Dashboard presents actionable security scores by bringing together multiple signals available in Secure Workload. It helps in understanding the current security position and improving it.
Security Dashboard acts as a springboard to many richer drill-downs within Secure Workload such as flow search, inventory search, automatic policy discovery, and forensics.

To view the Security Dashboard, in the left navigation pane, click Overview.
Security Score is a number from 0 through 100, indicating the security position in a category. A score of 100 is the best score and a score of 0 is the worst. Scores closer to 100 are better.
The Security Score computation considers vulnerabilities in installed software packages, consistency of process hashes, open ports on different interfaces, forensic and network anomaly events, and compliance or noncompliance to policies.
There are six different score categories. Most security aspects of a workload are taken into account to come up with these categories.
Vulnerability Score: Vulnerabilities in the installed packages on a workload are used for scoring.
Process Hash Score: Process hash consistency (and anomaly) along with Benign and Flagged process hashes is used for scoring.
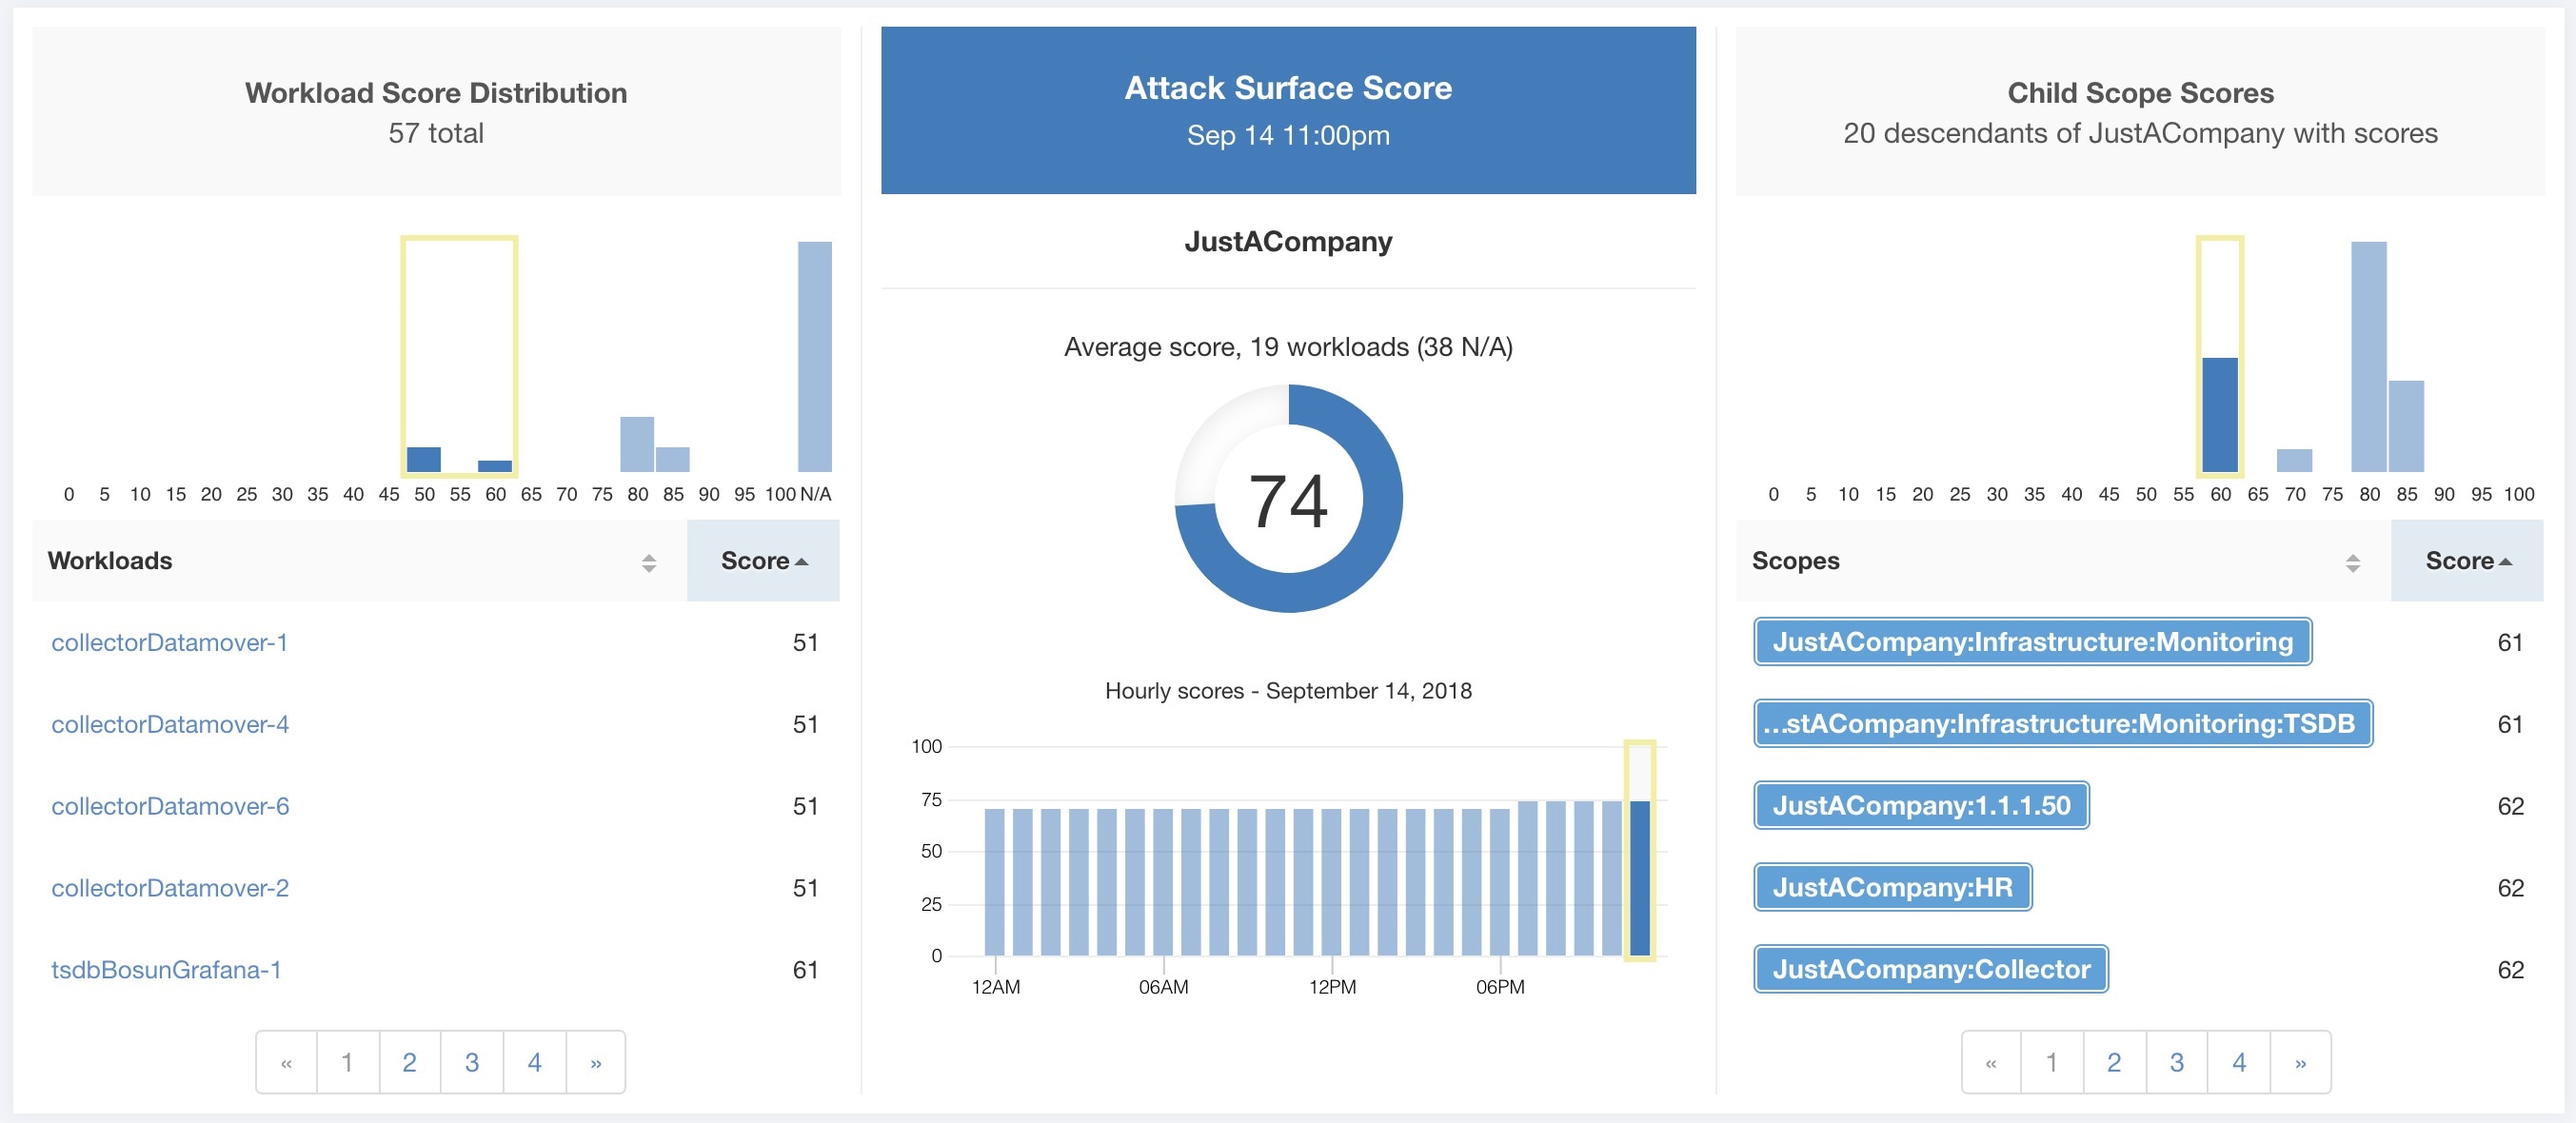
Attack Surface Score: Process may have one or more ports open on multiple interfaces to make services available. Unused open ports are used for scoring.
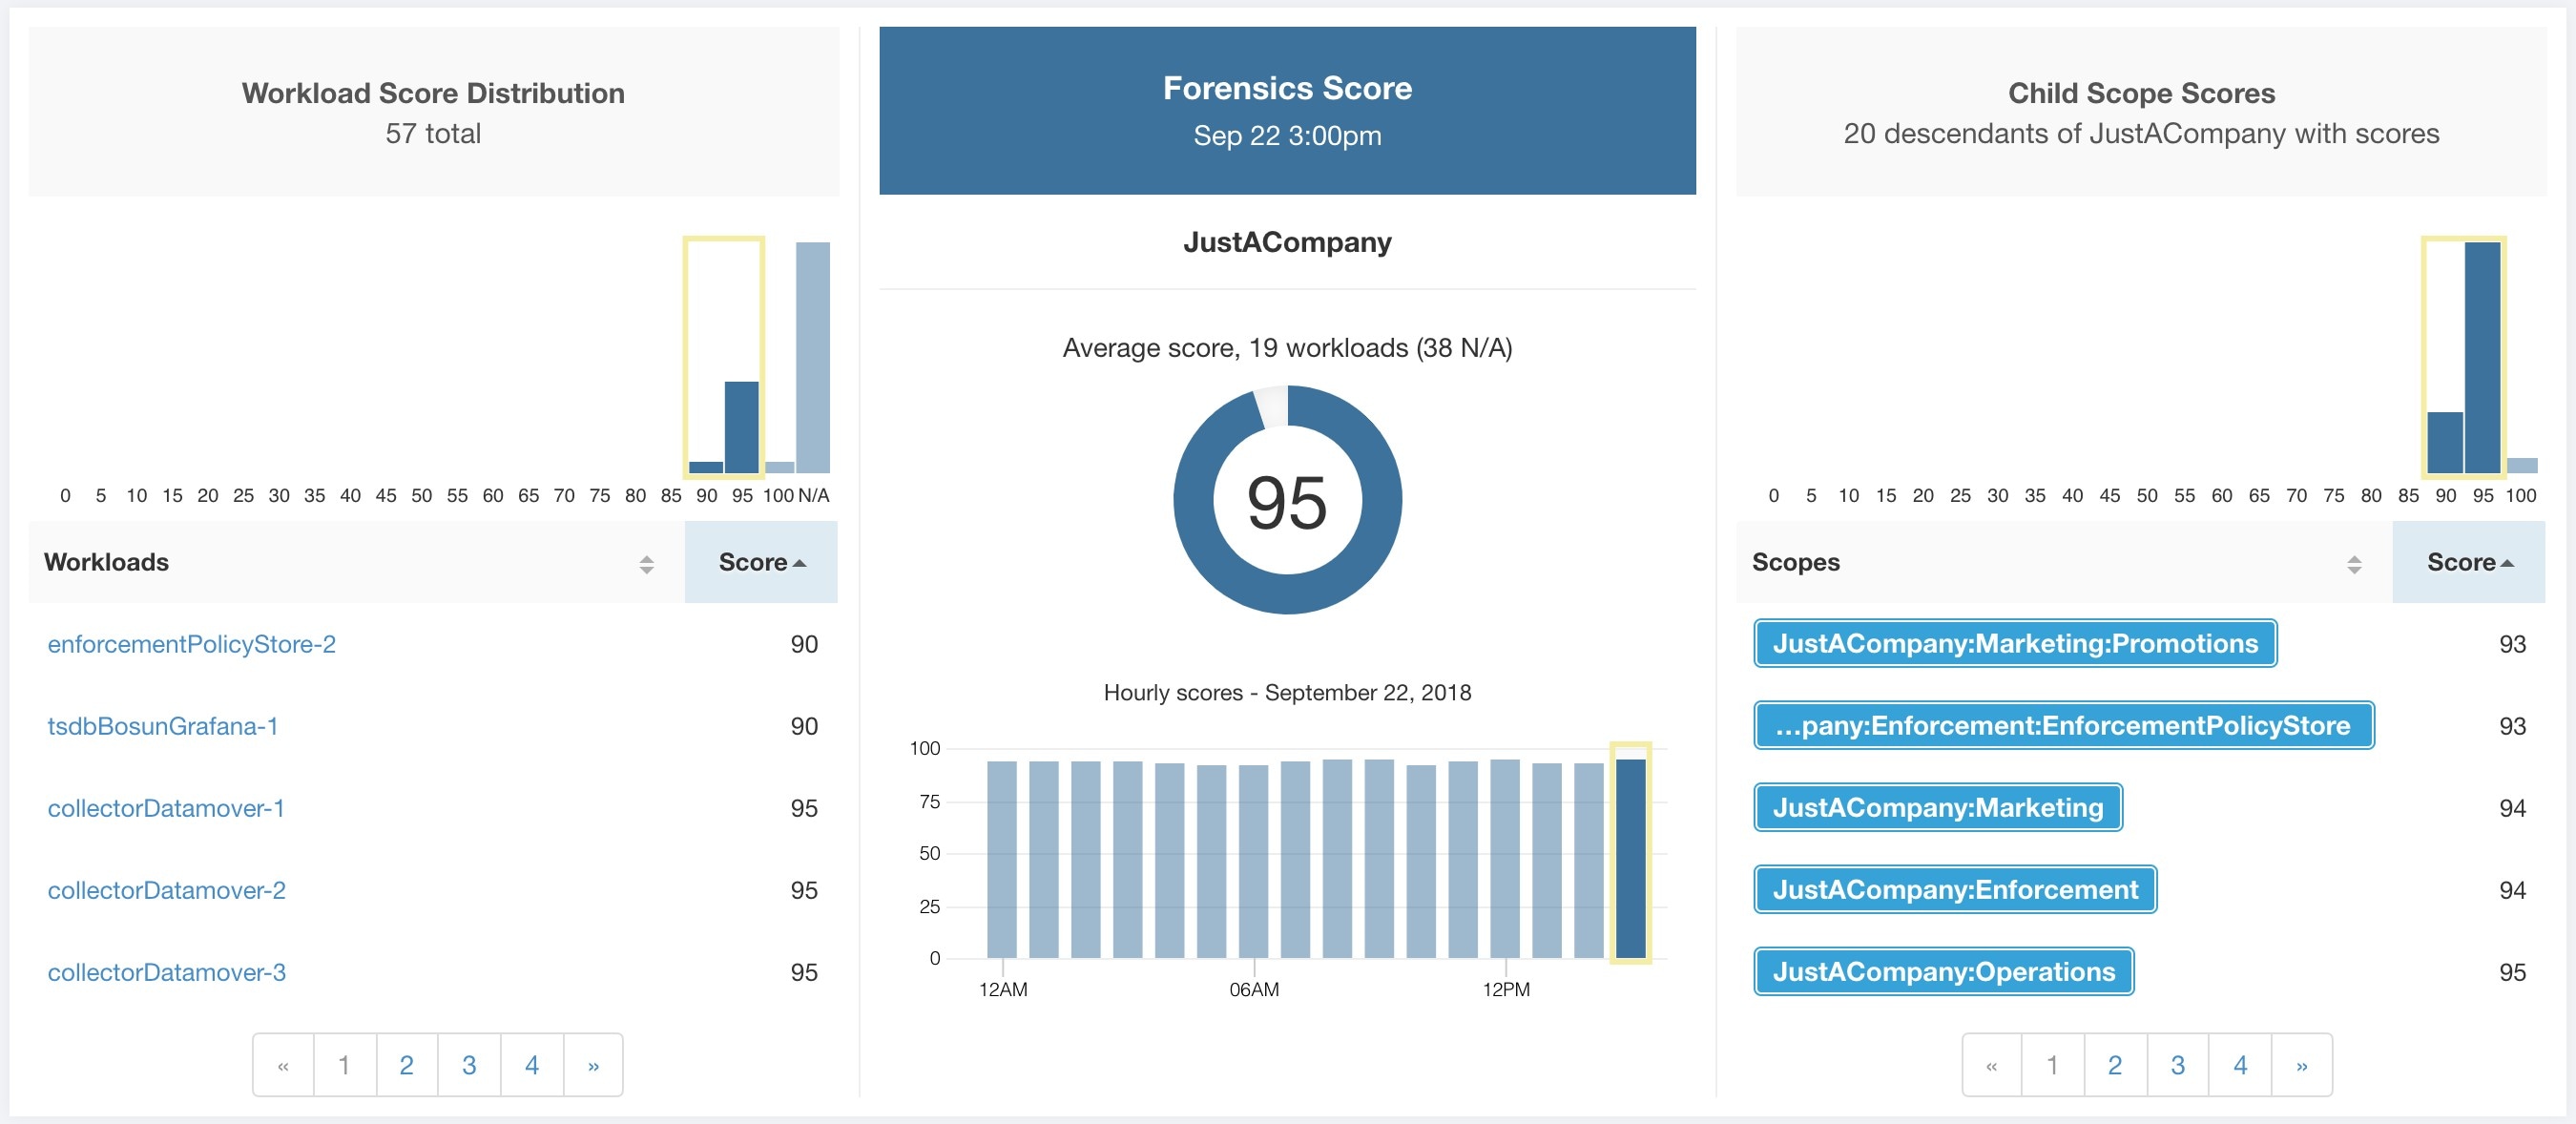
Forensics Score: Severity of forensic events on a workload is used for scoring.
Network Anomaly Score: Severity of network anomaly events on a workload is used for scoring.
Segmentation Compliance Score: Compliance (permitted) and violations (escaped) to automatically discovered policies is used for scoring.
Security dashboard has scope level scores for the selected scope. There is an overall score with time series and score breakdown. Score details for the six score categories for the selected scope are displayed.
Scope Level Score details are on top of the dashboard.

The following details are displayed:
Overall Scope Score: Overall score for the selected scope.
Daily Score Time series: Stacked time series that can go up to 3 months.
Score Breakdown: Breakdown of category scores for the selected day on time series.
The overall score is represented as a letter from A+, A, … , F, with A+ considered as the best score and F to be the worst. It is displayed as a donut chart with each slice (color-coded) representing a score category.

Overall score is the weighted average of the six score categories. By default, all weights are equal. If a score is N/A, it is considered as 0 in the overall score calculation.

Weights can be adjusted using slides in the Adjust Weights module. Each user can set their own weight adjustments, which help in aligning scores with your priorities.

Important: If a score is N/A, it is considered as 0 in the overall score calculation.
Stacked time series that can go up to three months. It helps in tracking security position over a long period. Each stack represents an overall score for a day. Each segment in the stack is a category that is represented by different color. You can click on day to get the score breakdown for the day.

The Score Breakdown displays the score for all the six categories for the day that is selected on the time series. Score N/A indicates that score is not available. It will be counted as 0 for the overall score calculation.

 Important |
If a score is N/A, it is considered as 0 for overall score calculation. |
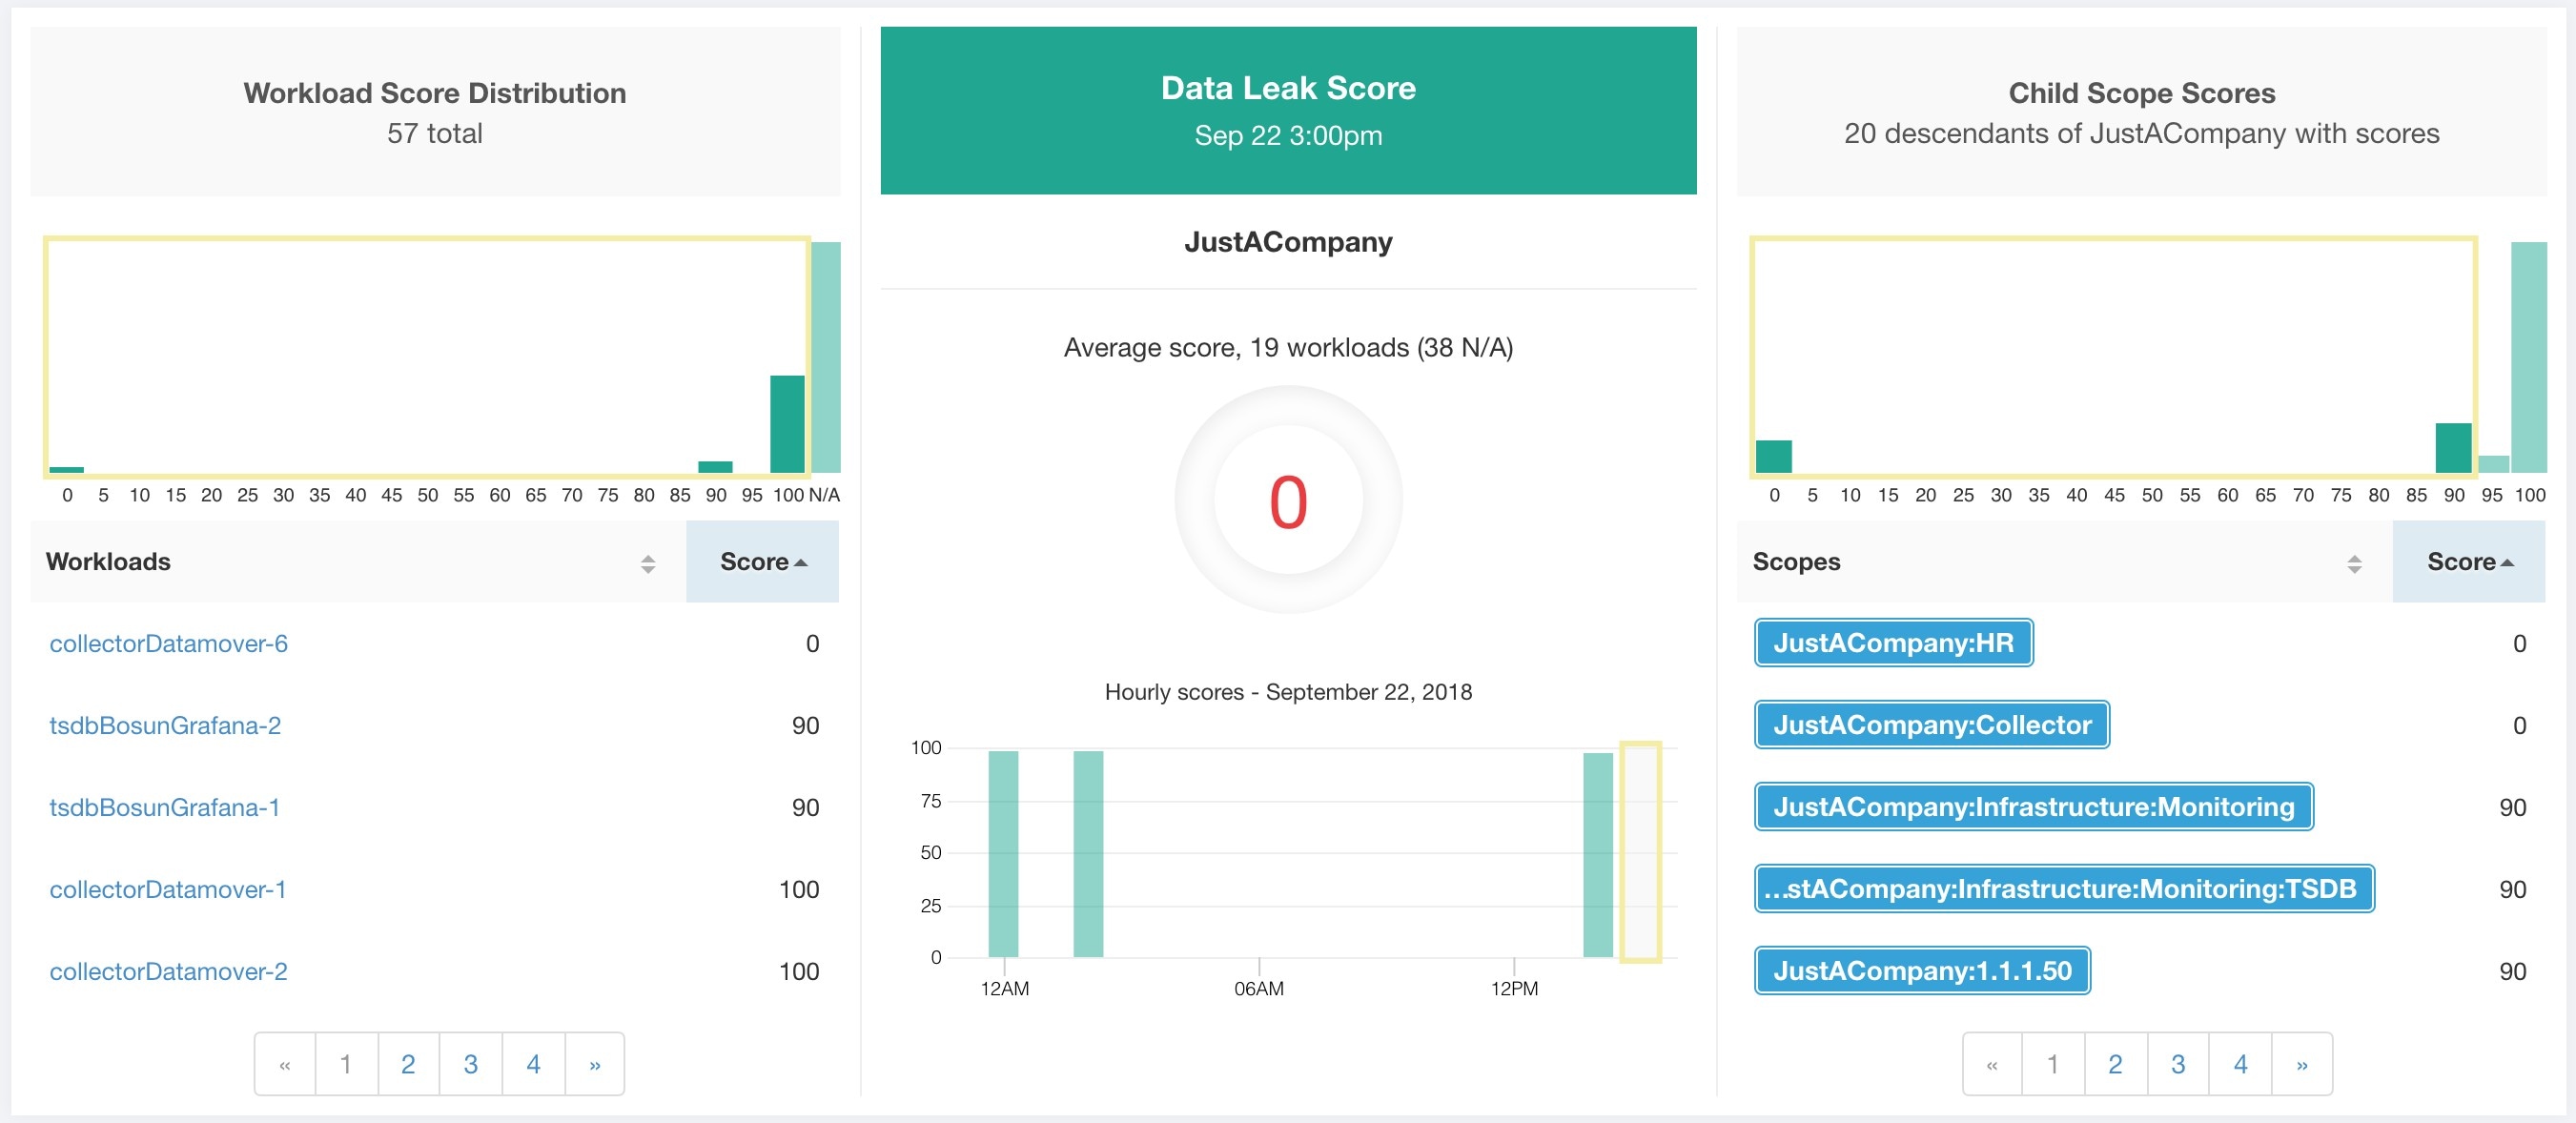
Each of the six categories follows the following template. It has workload score distribution, hourly time series, and child scope score distribution.

Workload score distribution provides insight into score contribution from workloads under the selected scope. It helps to bubble up lowest-scoring workloads to expedite corrective actions.

Hourly time series helps in getting the hourly score over the course of a selected day. Selecting an hour in the hourly time series updates the workload score distribution and descendent scope distribution to show the selected hour.

Descendent scope distribution provides insight into the score contribution of child scopes of the selected scope.

Details of each score category are explained in this section.
Vulnerabilities in software packages installed on workloads are used for computing Vulnerability Security Score.
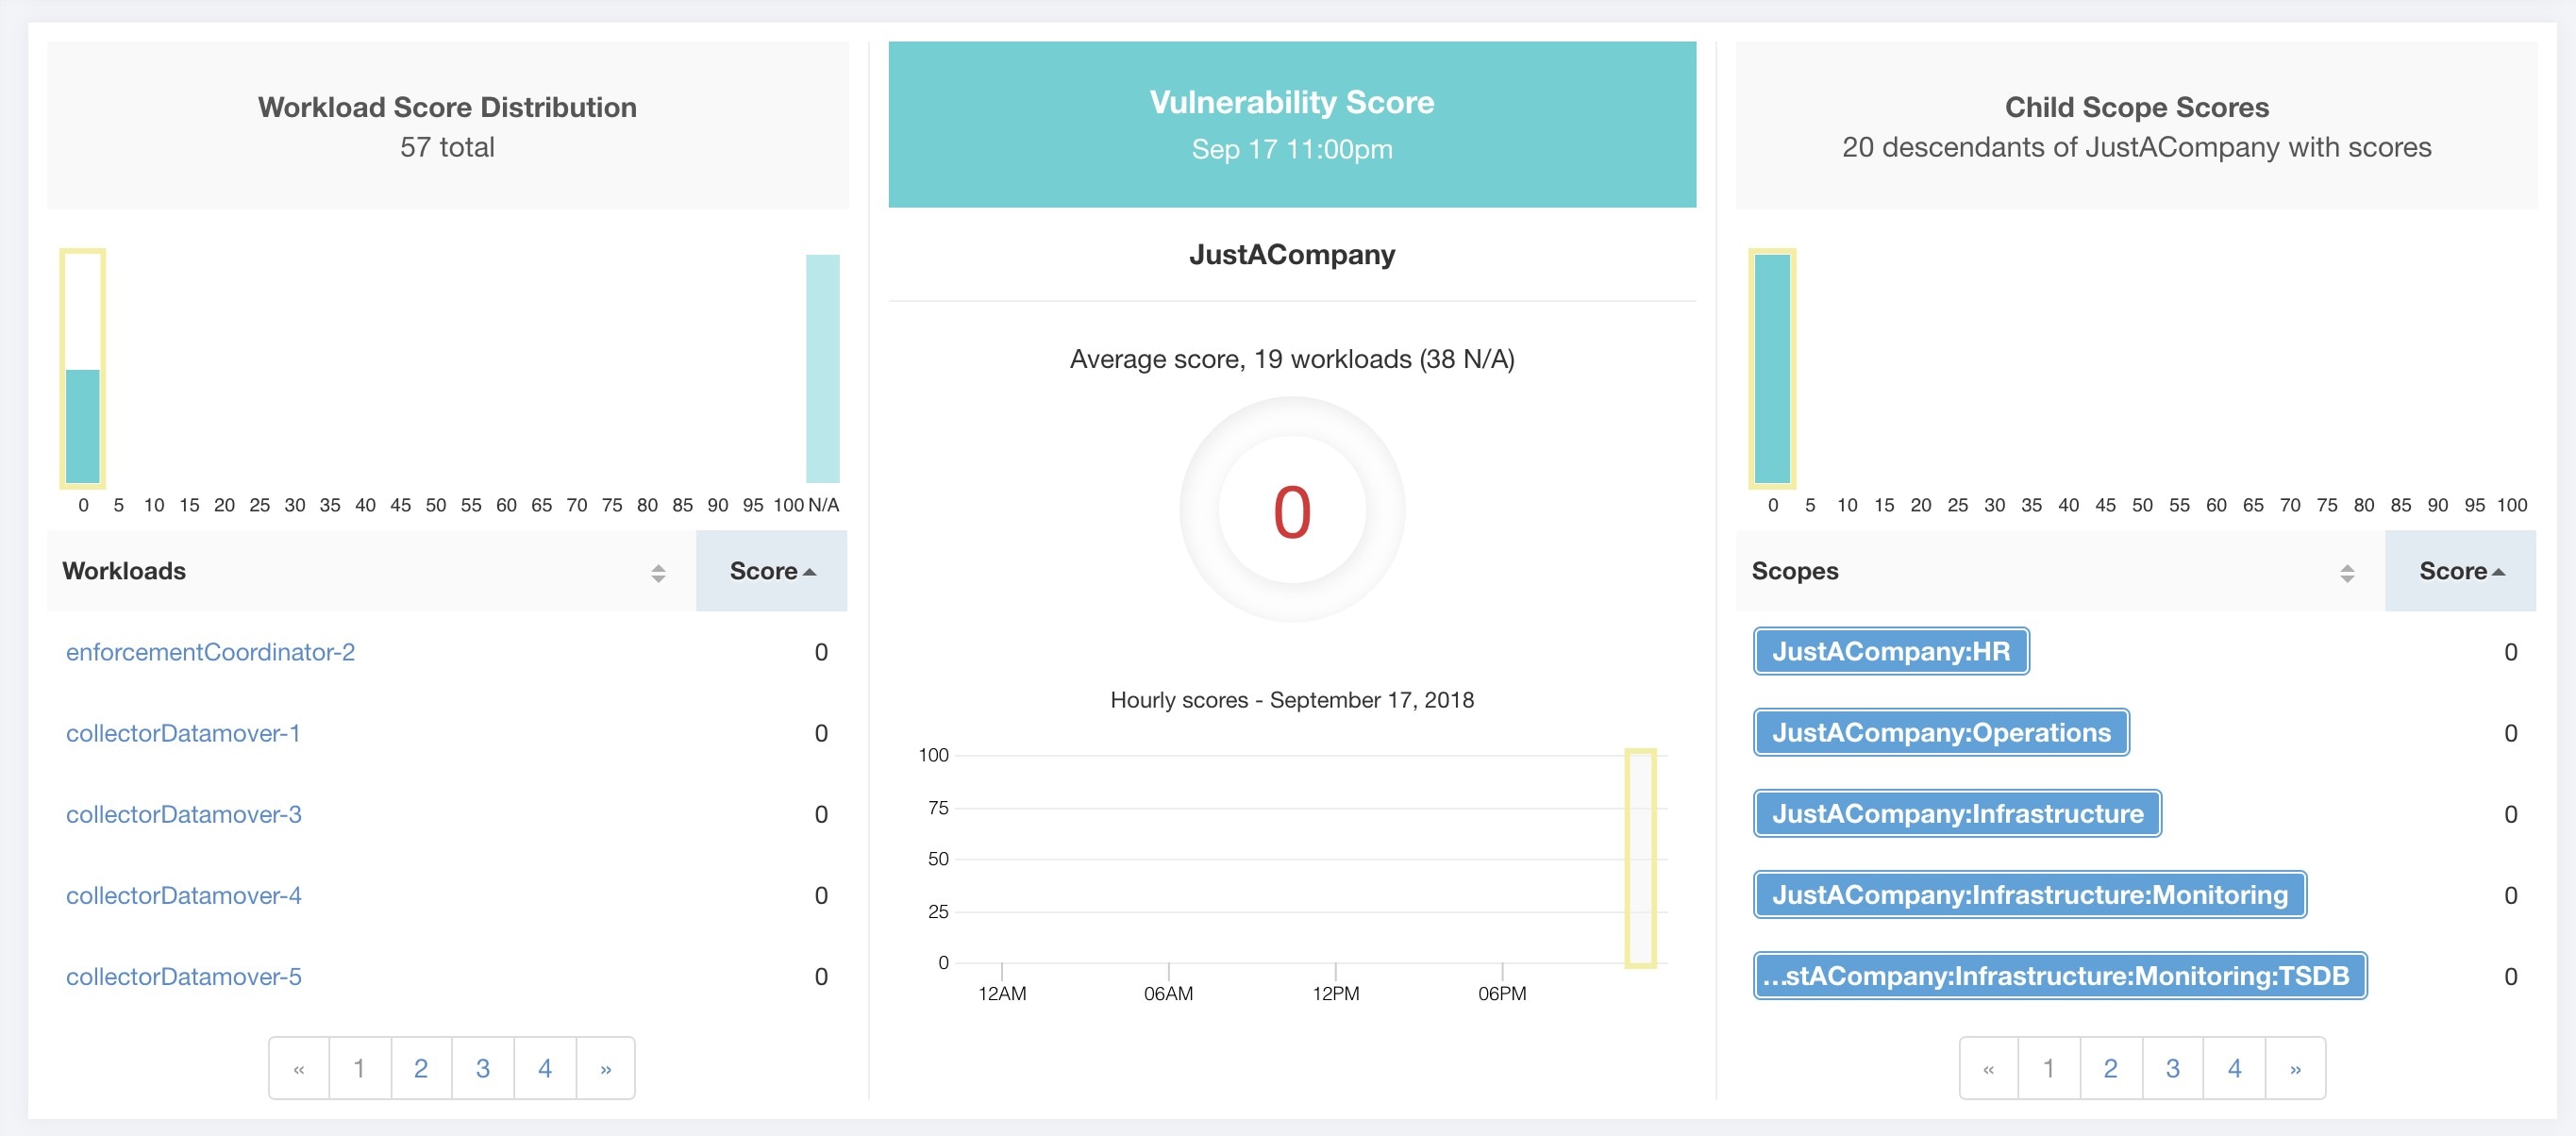
Lower score indicates:
One or more installed software packages have serious vulnerabilities.
Apply patch or upgrade to reduce the chances of exposures or exploits
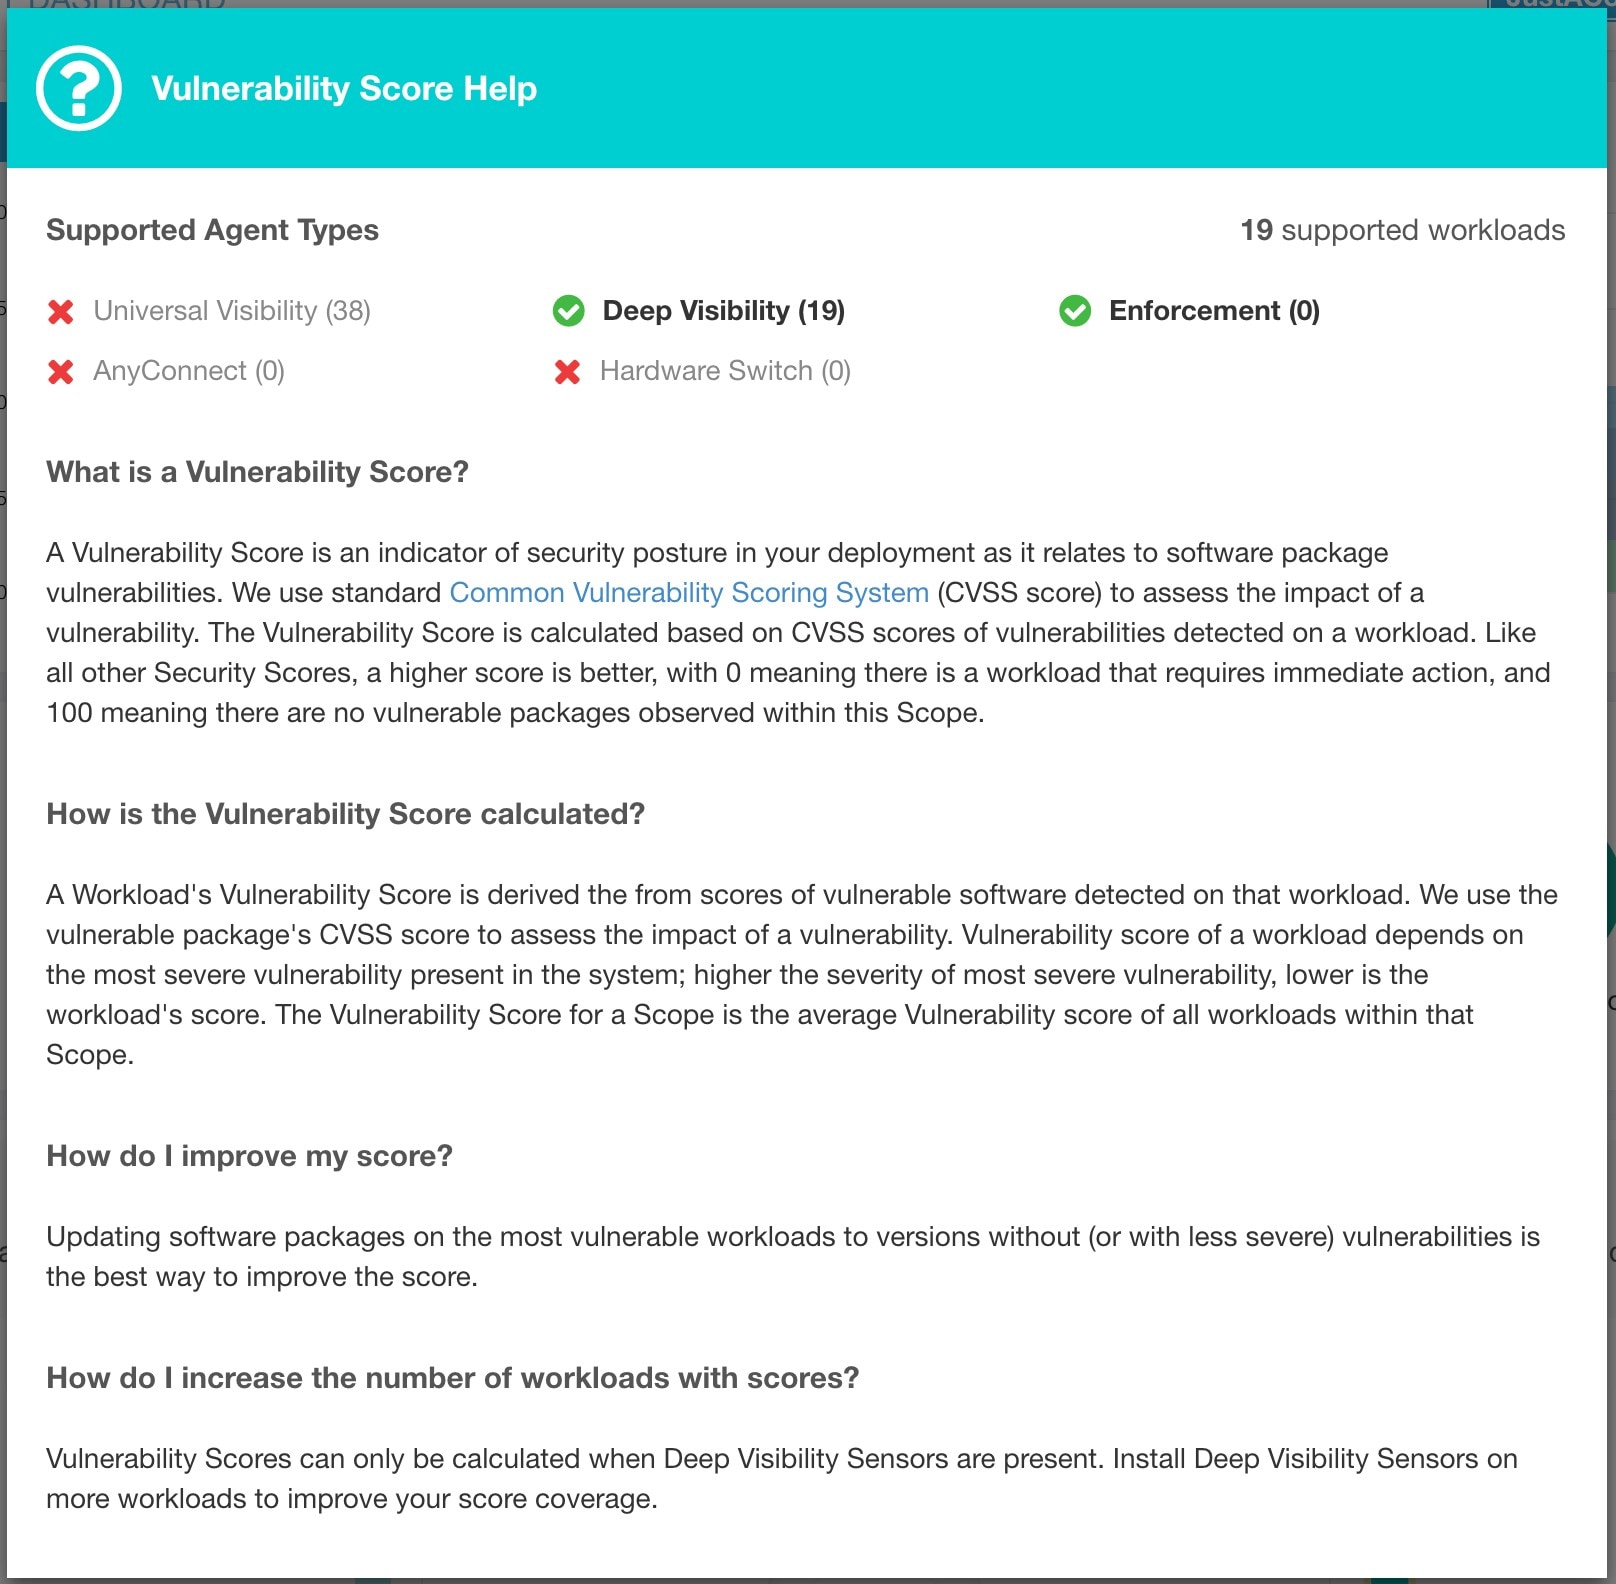
Software packages on workloads could potentially be associated with known vulnerabilities (CVE). CVSS (Common Vulnerability Scoring System) is used for assessing the impact of a CVE. CVSS score range is 0–10, with 10 being the most severe.
CVE can have CVSS v2 and CVSS v3 score. To compute Vulnerability score, CVSS v3 is considered if available, else CVSS v2 is considered.
Vulnerability score for a workload is derived from scores of vulnerable software that is detected on that workload. The Workload Vulnerability Score is calculated based on the CVSS scores, the vendor data, and may be adjusted by our security research team when data is missing or inaccurate (common for new vulnerabilities). This data is updated every 24 hours when the threat feed is configured. Higher the severity of the most severe vulnerability, lower is the score.
Scope score is average of workload scores in the scope. Improve the score by identifying workload or scopes with vulnerable software packages, and patch or upgrade with safer packages.
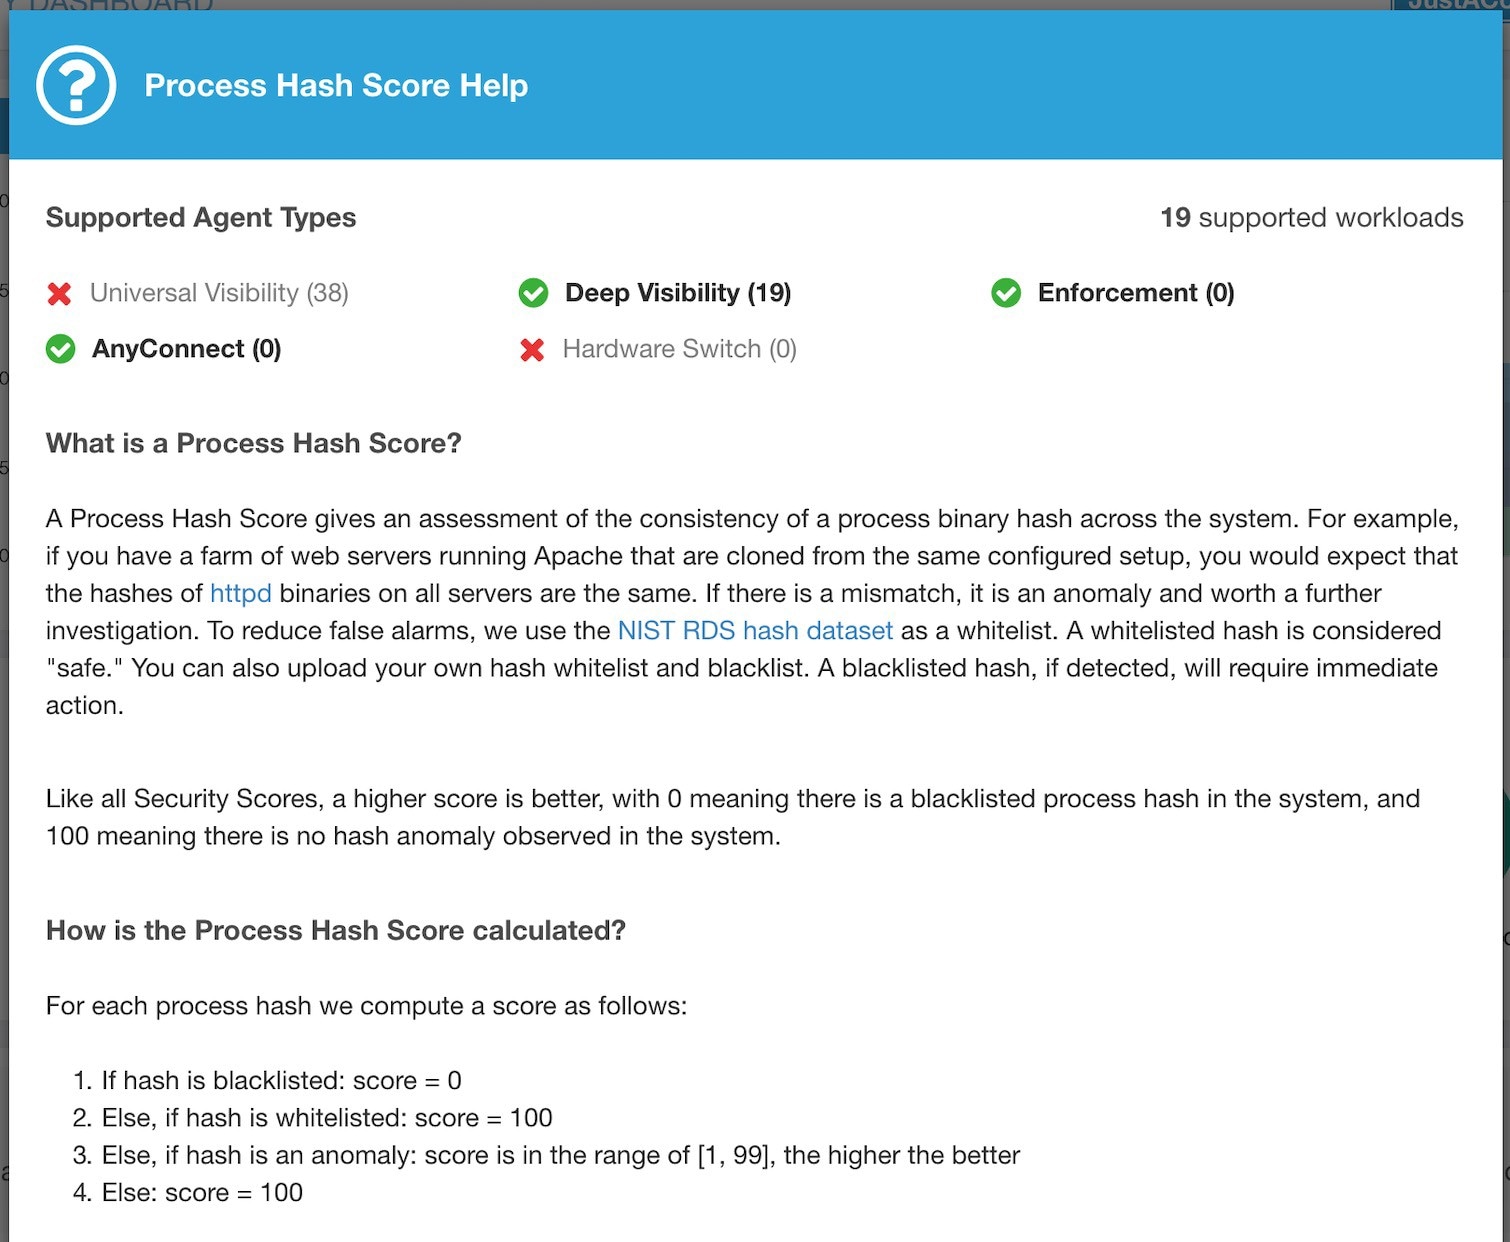
Process hash score is an assessment of process binary hash (file hash) consistency across workloads. For example: A web server farm running Apache that is cloned from the same setup config is expected to have same hash for httpd binaries on all servers. A mismatch is an anomaly.
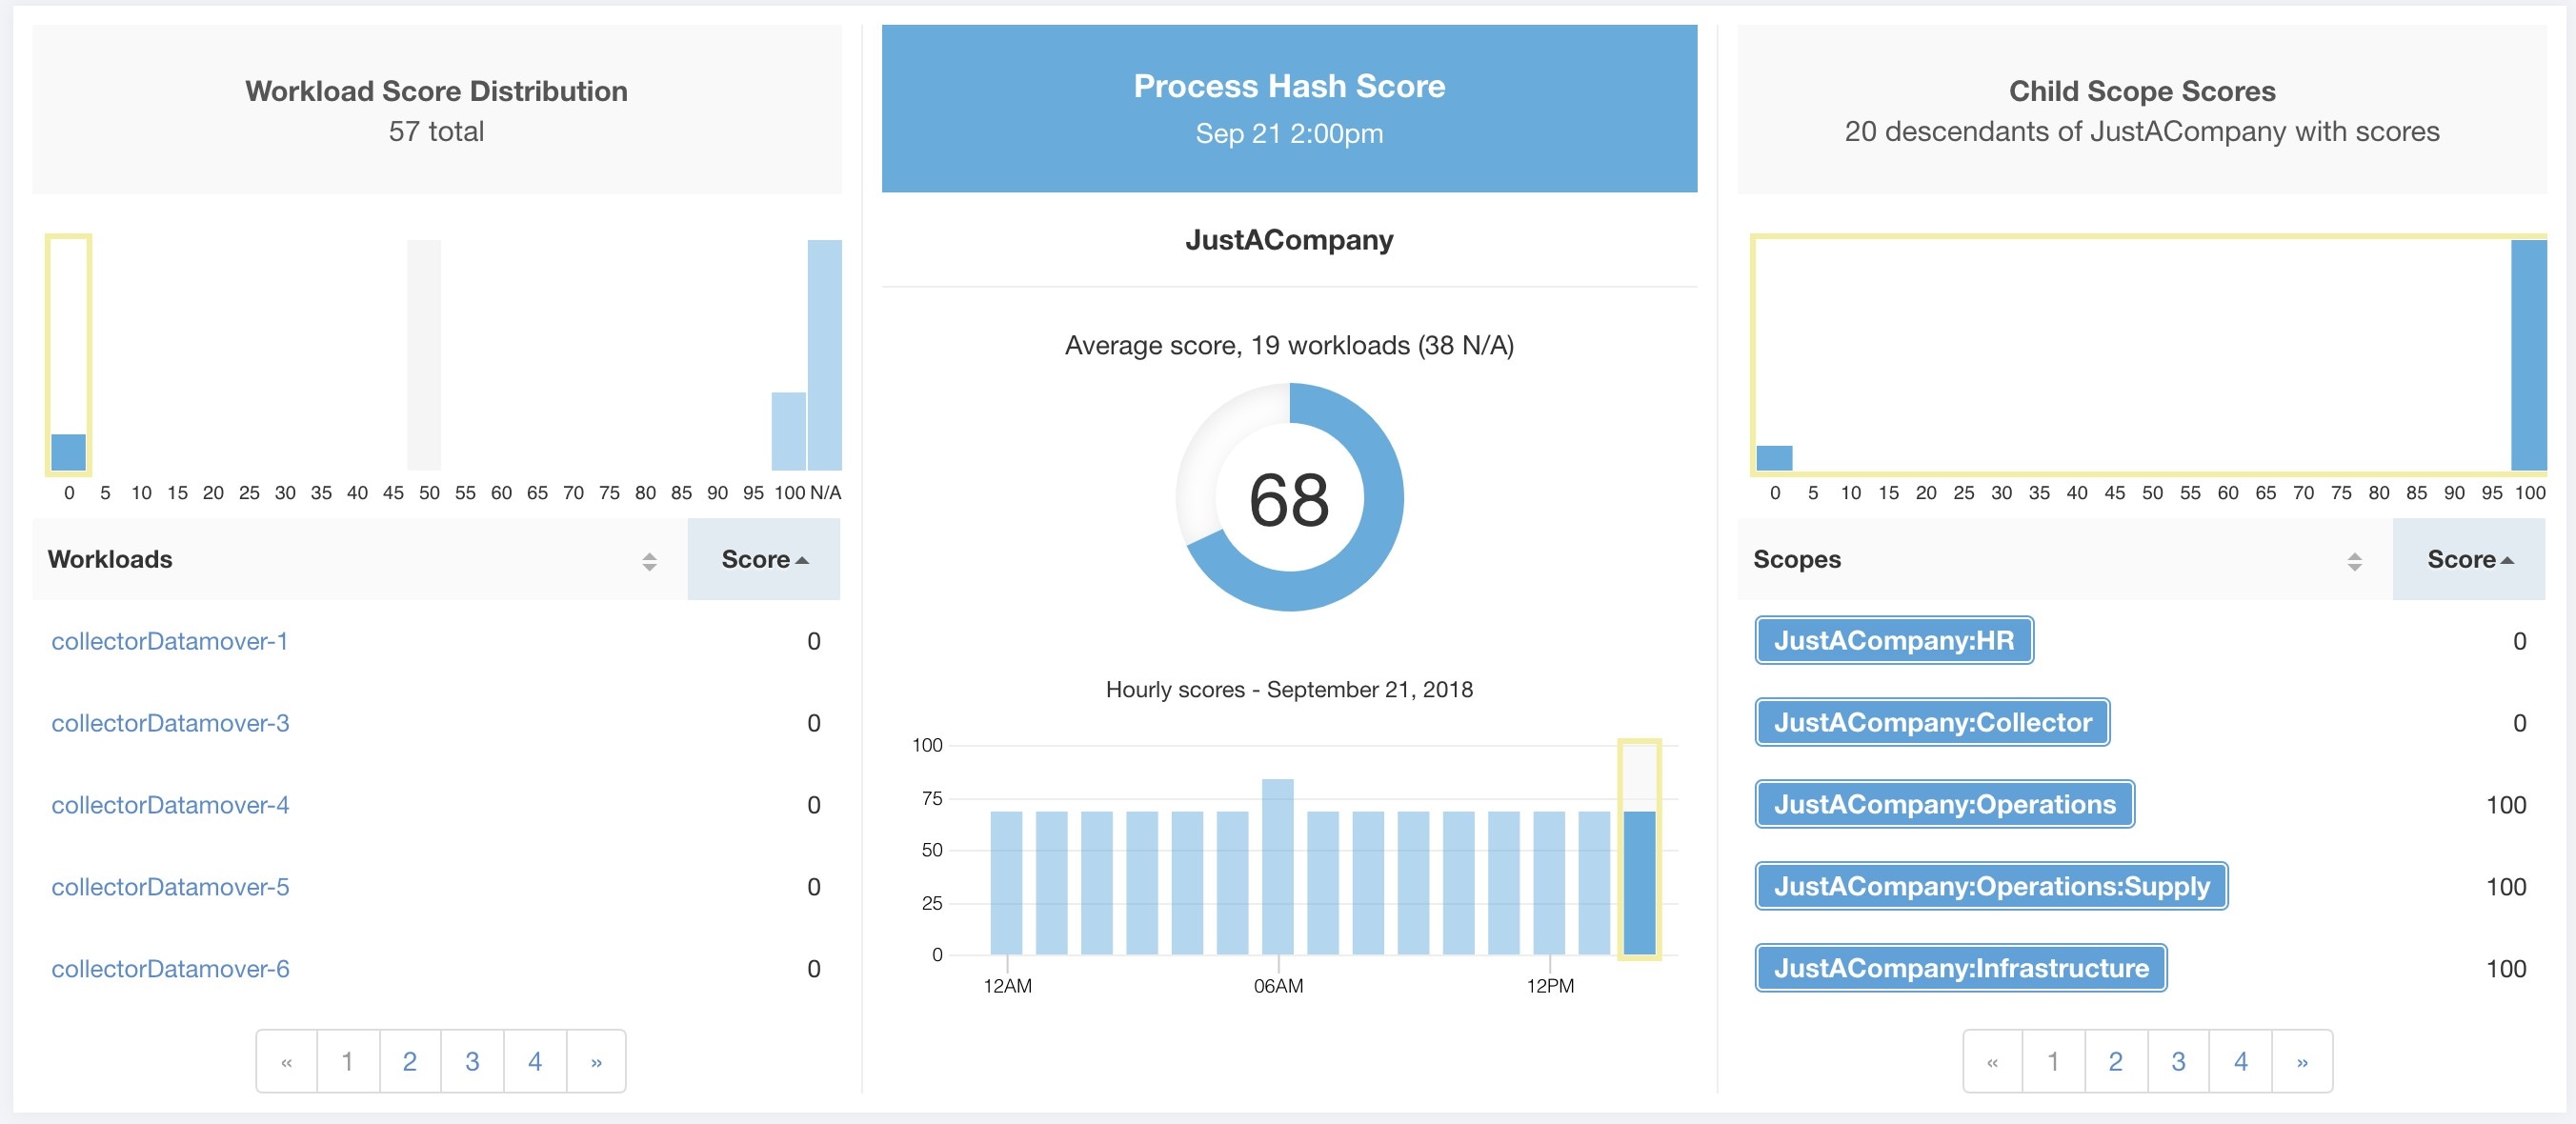
Lower score indicates, at least one or both of:
One or more process hashes are flagged.
One or more process hashes are anomalous.
Refer to Process hash anomaly detection for more details.
Attack Surface Score highlights potential attack surface in a workload. Open unused ports (open ports without traffic) contribute to lowering this score.
A lower score indicates:
Many open ports without any traffic in the last 2 weeks
Well-known attack ports may be open and unused in last 2 weeks.
One or more open ports are attached with packages that have serious vulnerabilities.
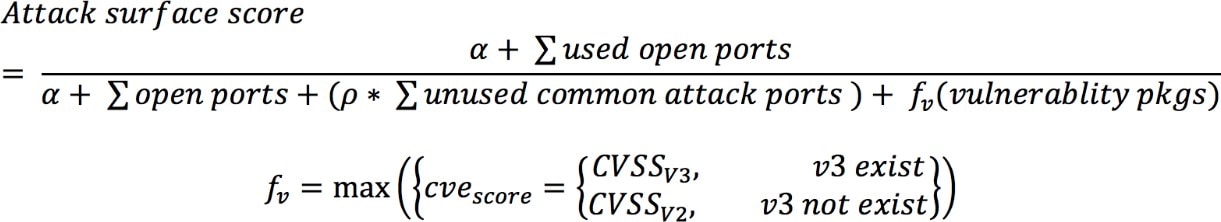
The attack surface score is a function of unused open ports relative to total ports, with a smoothing factor. Open ports without any traffic over the past 2 weeks are considered “unused open ports”. An extra penalty is applied to unused open ports which are well-known ports that are used in attacks (for example, 21, 22, 8080 and so on).
Laplace smoothing is used with a penalty factor based on heuristic data. Score is computed daily with the past 2 weeks of data.
Tenant score is average of workload scores in the scope. Improve the score by identifying workload or scopes with unused open ports, and closing the unused ports.
When a workload link is clicked an attack surface modal is opened with details on all available ports and interfaces within the context of that workload.

Features:
Unused Ports Only: checkbox that when toggled filters out the ports that are used and only shows you the unused ports that are associated with the workload.
Columns: Approved, port, package name, total permitted, CVE Max Score, Process Hash, Interfaces, Package Publisher, Package Version, Total Escaped, Total Rejected, Commonly Hacked Port, Links.
Interfaces: If you click on any one of the line items in the Attack Surface table you can view the interfaces that are associated with each port inside a modal.
Approved: checkbox that when toggled, allows you to intentionally set an “unused port” as “approved” on any one of the scopes on the scope chain that that workload has access to. Note: if a port is approved on a scope and that port is not explicitly approved on any of the children (if that scope has children), then the scope checkboxes are disabled as it is implied that any child scope that the parent scope has access to already is approved in that chain.
Approval Modal:

Interfaces Modal:


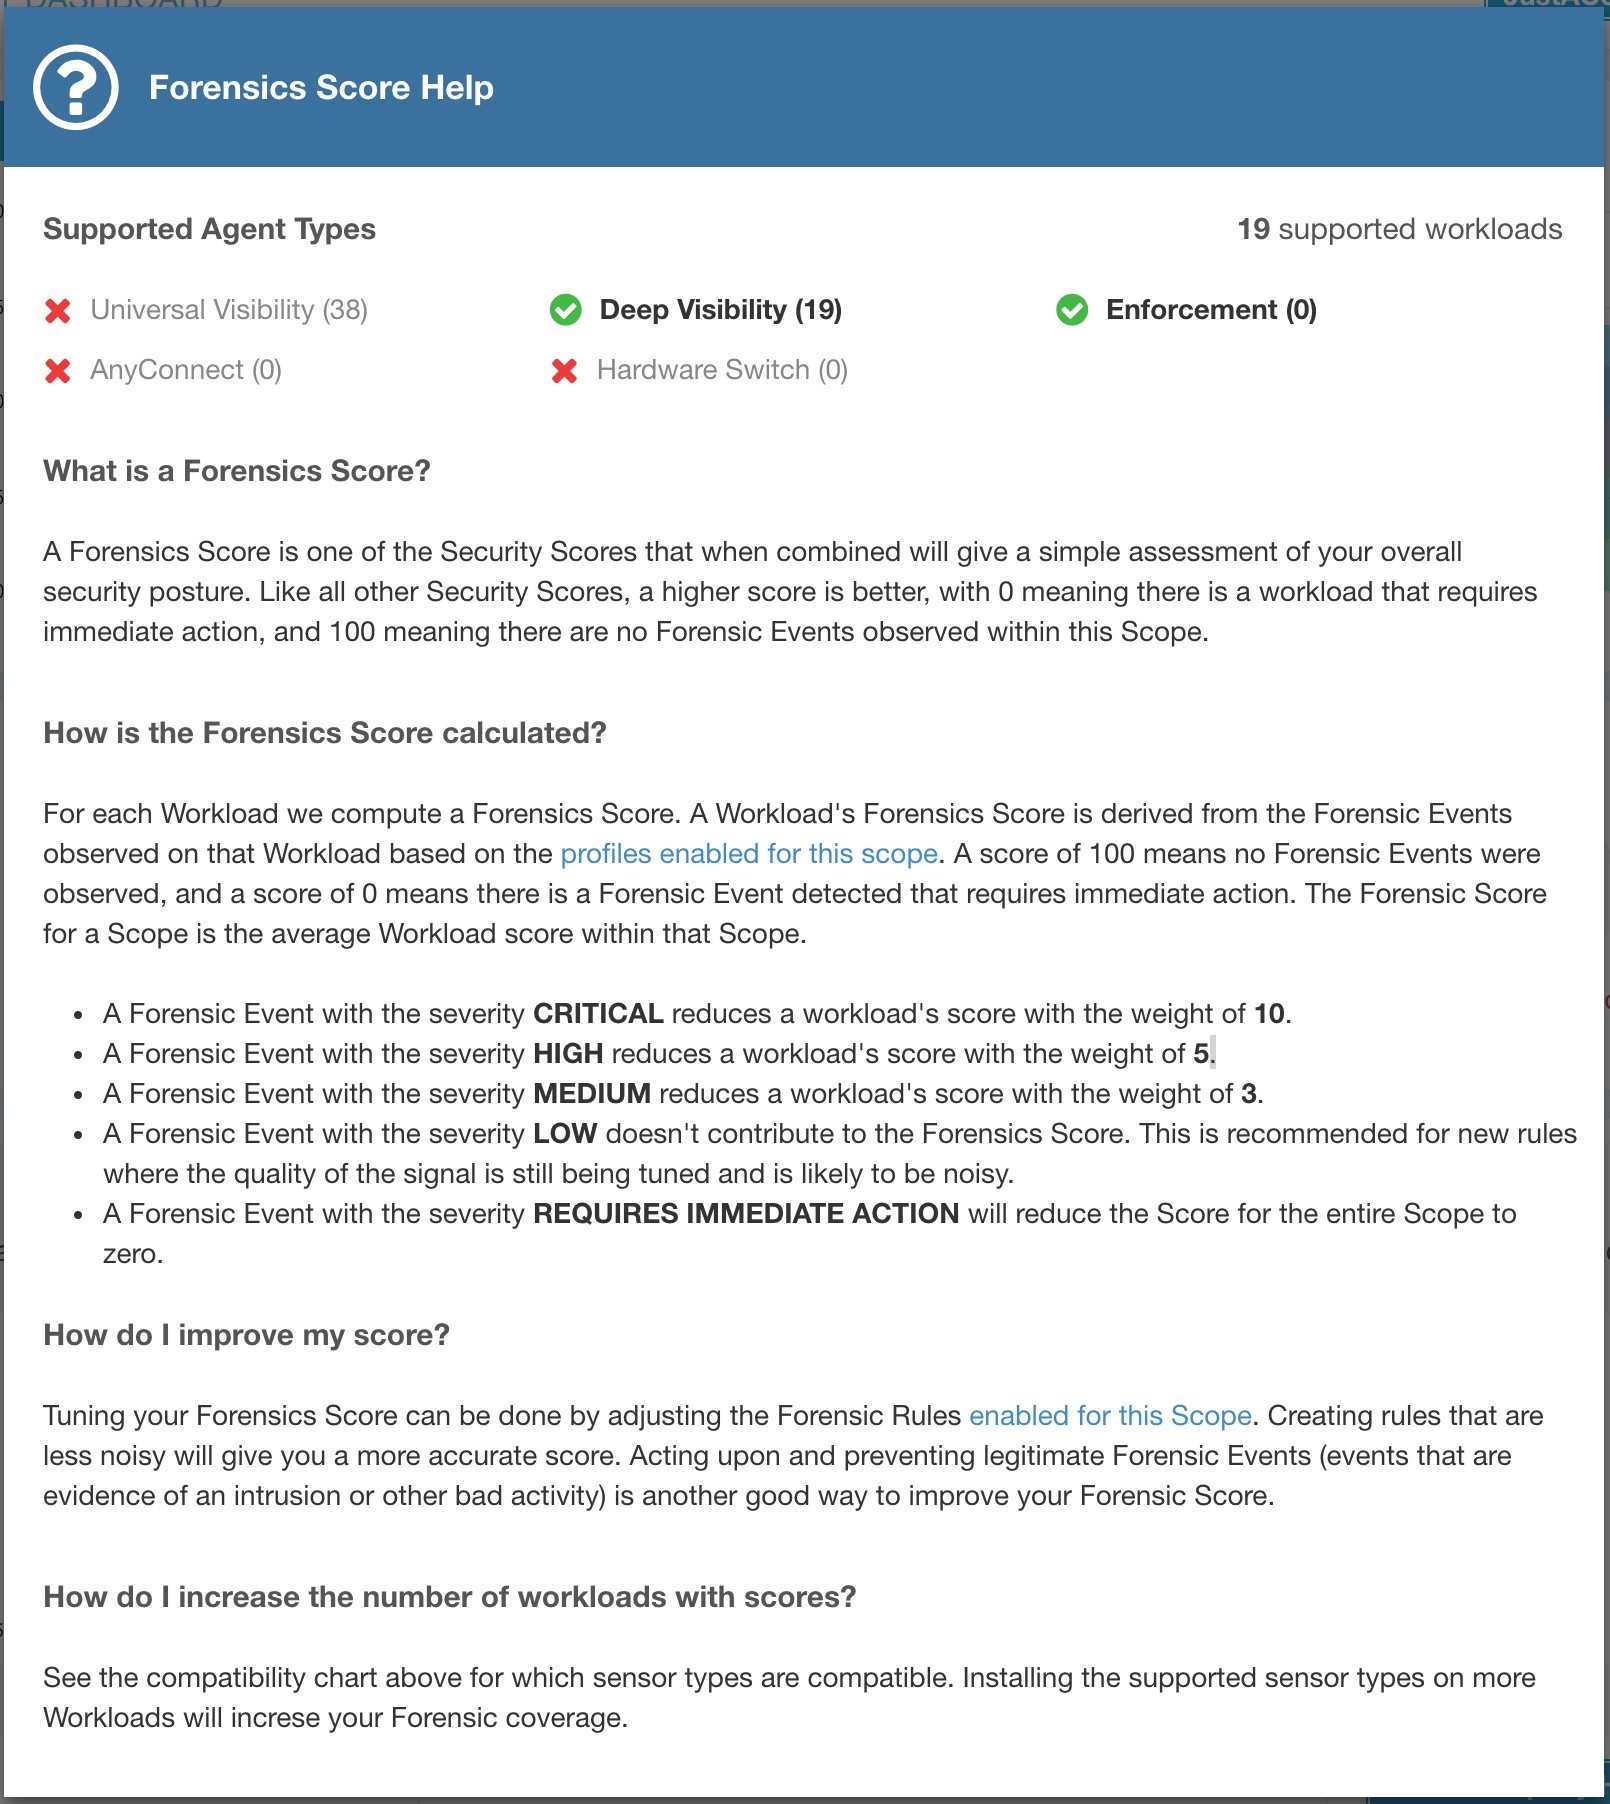
Severity of forensics events on workloads is used for computing the scores.
Lower score indicates:
One or more forensics events were observed on the workload.
Or one/more forensics rules are noisy and/or incorrect.
To improve the score:
Fix the issue if any to reduce the chances of exposures/exploits.
Tweak forensics rules to reduce noise and false alarms.
Forensics score for a workload is inverse function of total impact score of forensics events. Higher is the total impact score of forensics events, lower is the forensics score.
|
Severity |
Impact Score |
|
IMMEDIATE_ACTION |
100 |
|
CRITICAL |
10 |
|
HIGH |
5 |
|
CRITICAL |
3 |

Refer to Forensics for more details.
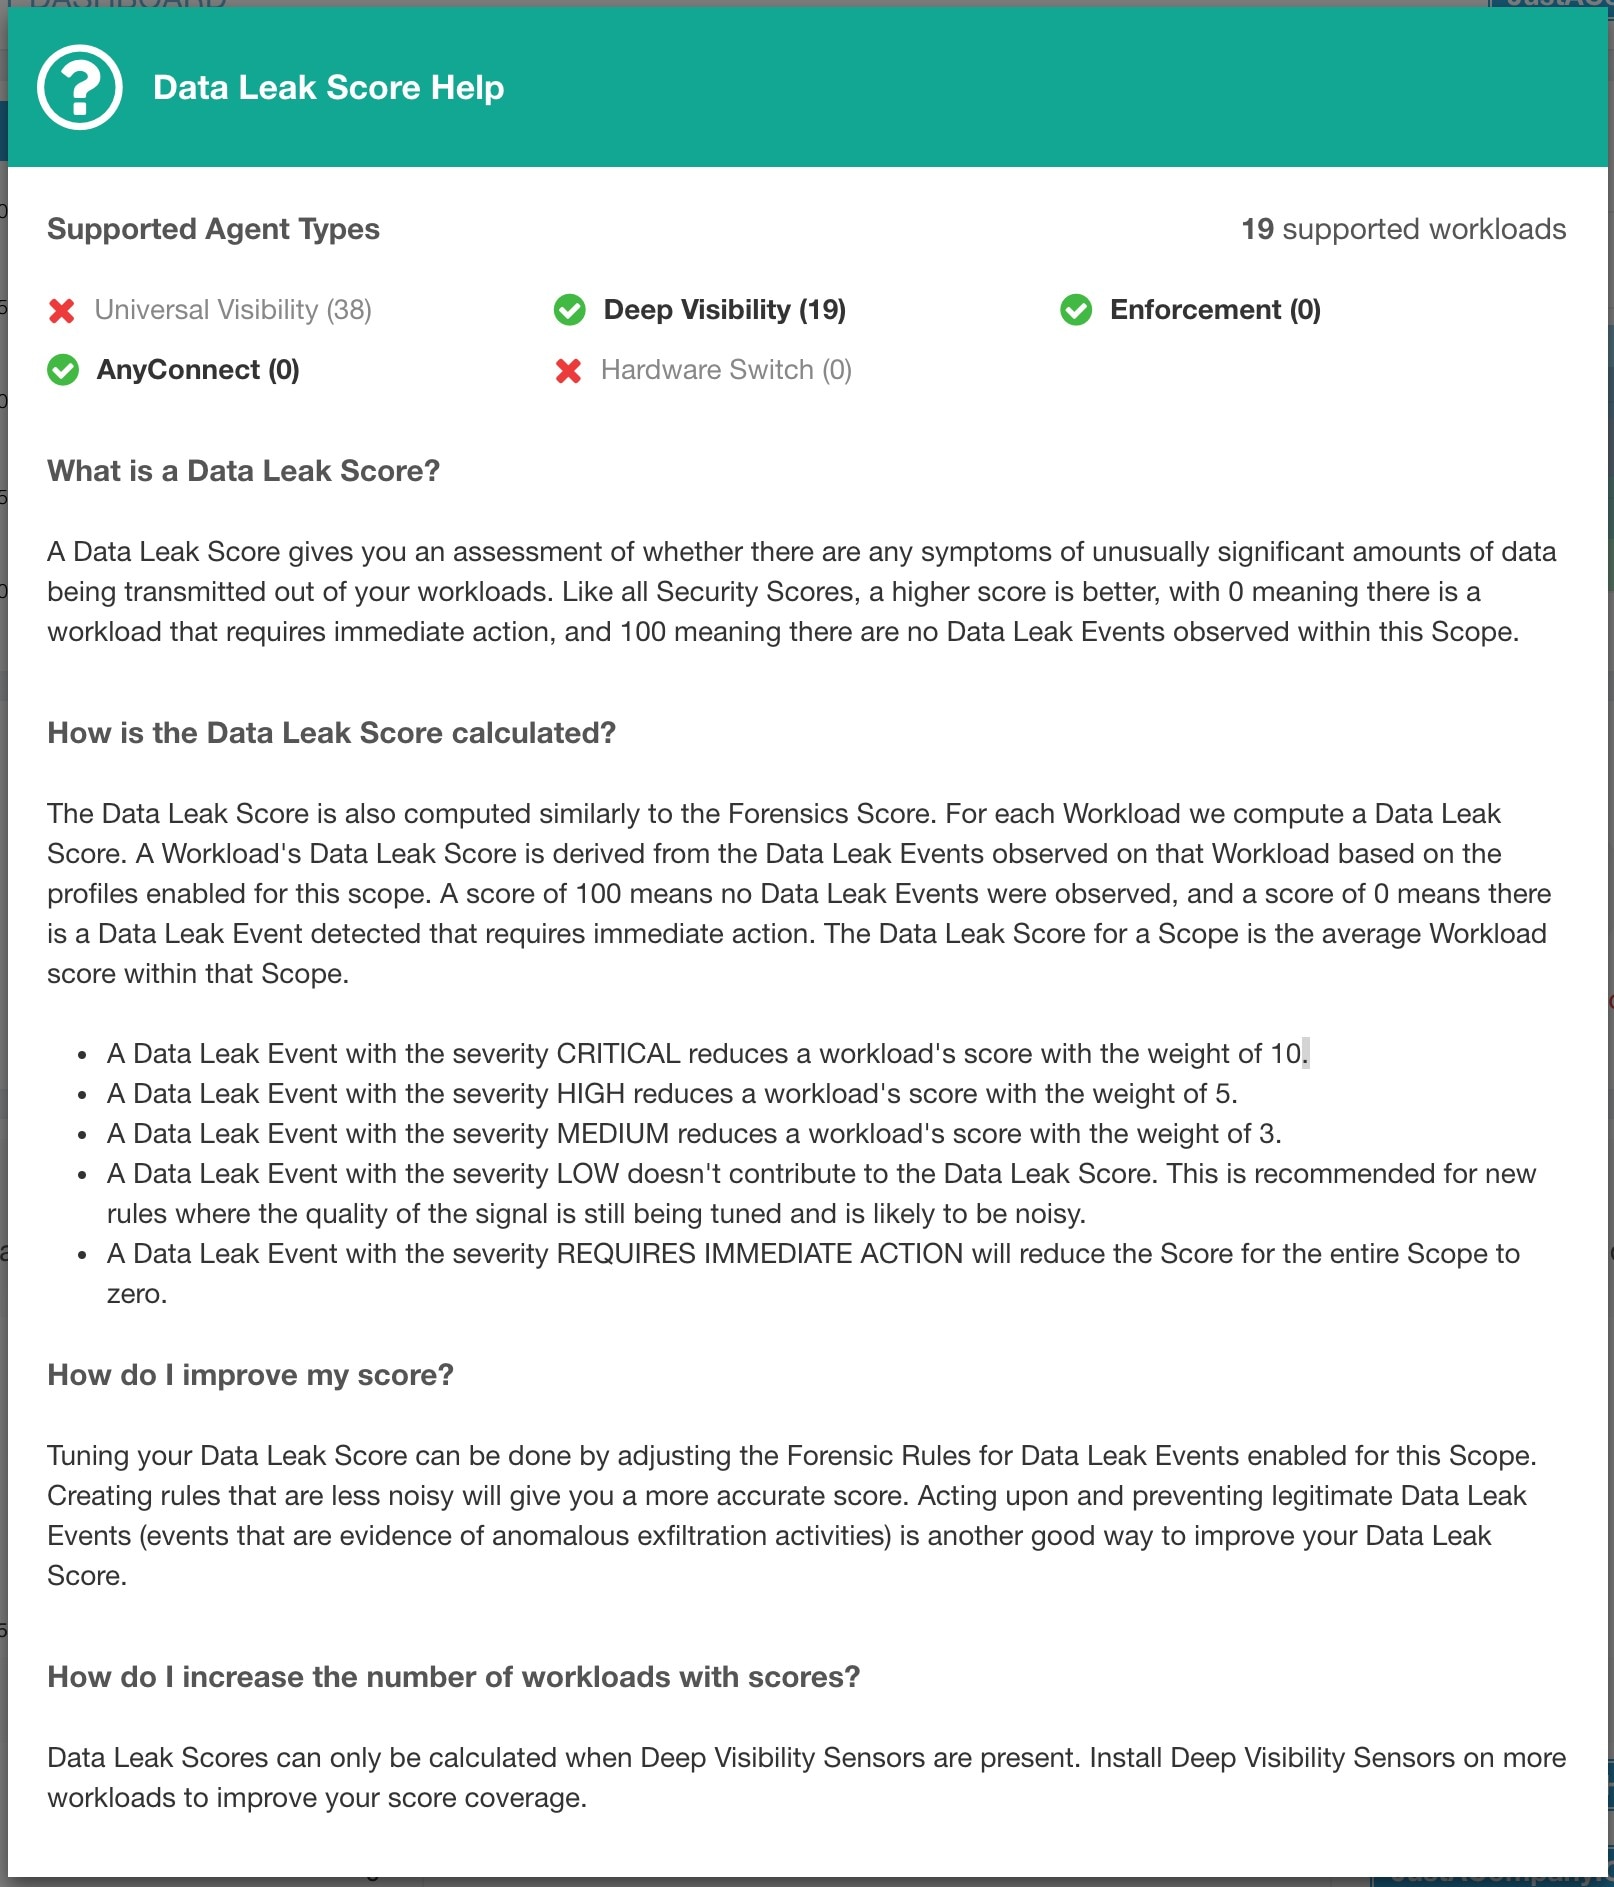
Severity of Network Anomaly events on workloads is used for computing the scores.
Lower score indicates:
Unusually high amount of data is being transferred out of workloads.
Or Network Anomaly forensic rule is incorrect or noisy.
To improve the score:
Fix the issue if any to reduce the chances of data exfiltration.
Adjust Network Anomaly rules to reduce noise and false alarms.
Network Anomaly score for a workload is inverse function of total severity score of Network Anomaly events. Higher is the total severity score, lower is the Network Anomaly score.
|
Severity |
Score |
|
IMMEDIATE_ACTION |
100 |
|
CRITICAL |
10 |
|
HIGH |
5 |
|
CRITICAL |
3 |

Refer to PCR-based Network Anomaly detection for more details.
Segmentation Compliance Score presents a top-level view of policy violations and emphasizes which scopes and workspaces have the most violations.
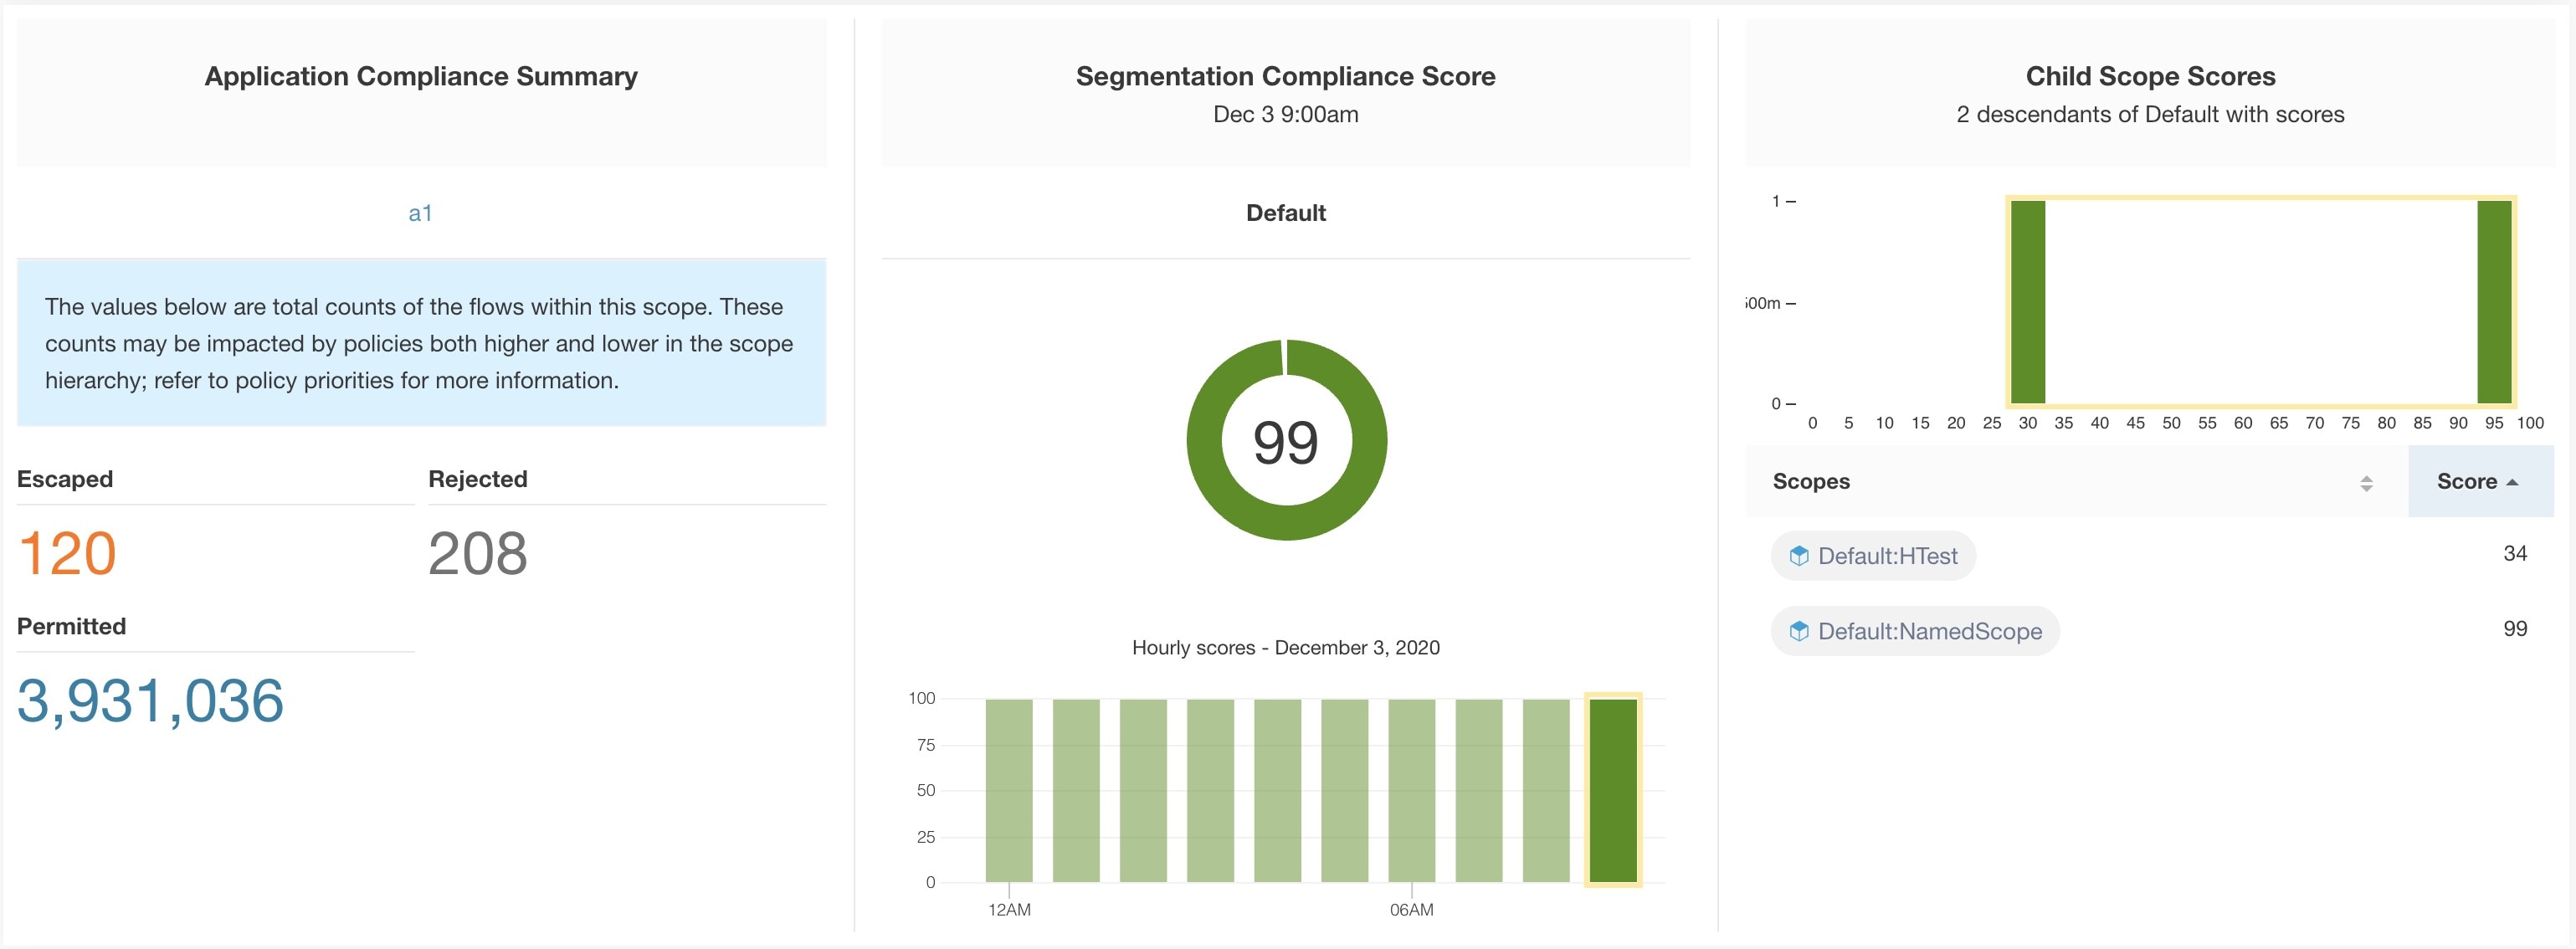
Note |
Escaped/Rejected/Permitted count that is displayed on security dashboard for root scope does not add up to all the counts respectively displayed for all child scopes. Escaped/Rejected/Permitted count is an evaluation on the policy and not just on source or destination. |
Lower score indicates:
Significant number of escaped flows (policy violations) relative to permitted
Score is 0 when more escaped flows than permitted.
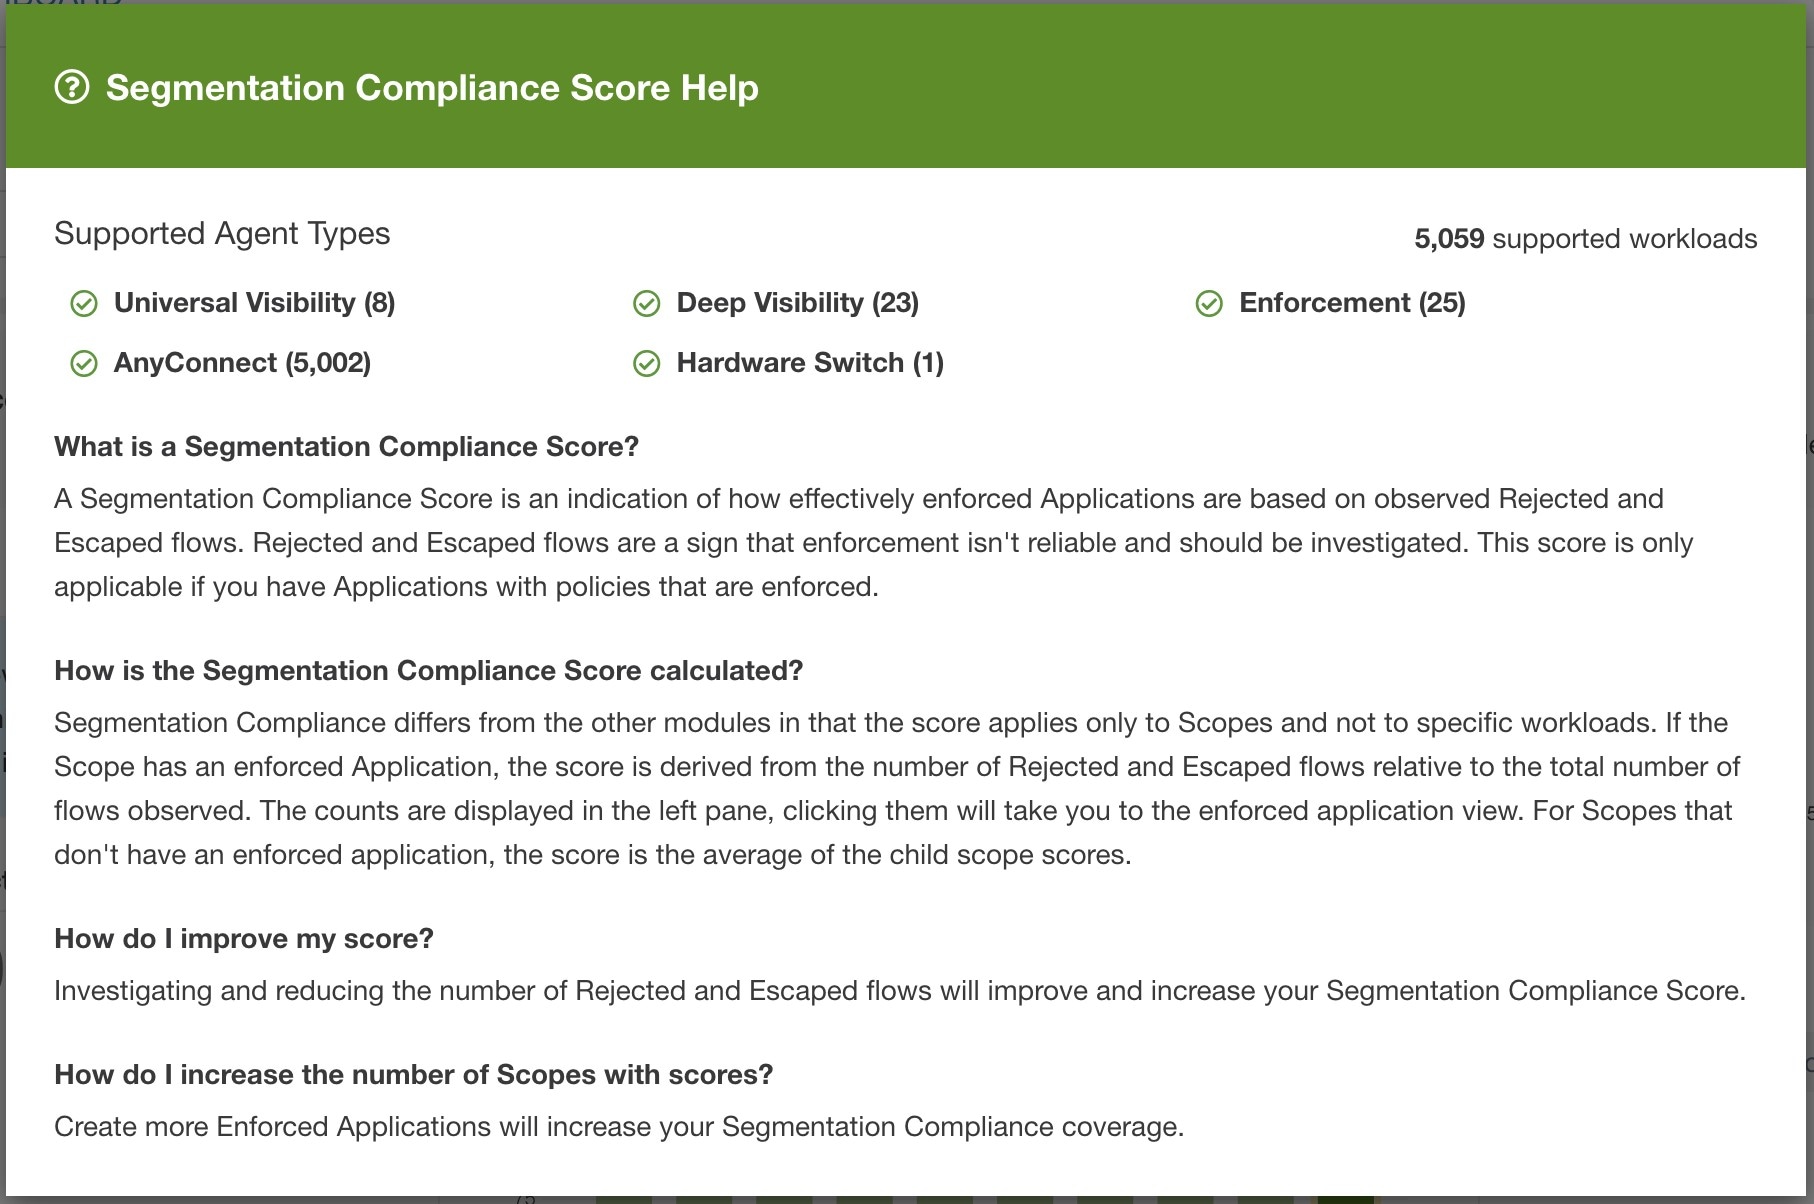
Segmentation Compliance Score is computed for scopes with an enforced primary workspace. For scopes without enforced workspaces, the score will be computed as the average of descendant scope scores with enforced policies.
Score is computed by using the ratio between escaped and permitted.

Improve score by reducing number of policy violations
Verify policies correctly cover desired behavior.
Verify that policies are correctly being enforced.
 Feedback