Industrial Automation Implementation Guide
Bias-Free Language
The documentation set for this product strives to use bias-free language. For the purposes of this documentation set, bias-free is defined as language that does not imply discrimination based on age, disability, gender, racial identity, ethnic identity, sexual orientation, socioeconomic status, and intersectionality. Exceptions may be present in the documentation due to language that is hardcoded in the user interfaces of the product software, language used based on RFP documentation, or language that is used by a referenced third-party product. Learn more about how Cisco is using Inclusive Language.
- Updated:
- August 20, 2020
Chapter: Industrial Automation Implementation Guide
- Configuring the Infrastructure
- Switch Configuration
- Cisco Industrial Network Director Configuration
- Cisco ISE Configuration
- Access Level Switch Configuration
- Configuring Distribution Switch—Cisco Catalyst 9300
- Cisco Cyber Vision Center Configuration
- Installation
- Cisco Cyber Vision Center Interfaces
- Joining Sensors to Cisco Cyber Vision Center
- Configuring Presets
- Viewing Assets
- Viewing Asset Activity
- Performing a Packet Capture on a Sensor
- Integrating Cisco Cyber Vision Center with Cisco ISE pxGrid
- Integrating Cisco Cyber Vision Center with Cisco Stealthwatch
- Cisco Cyber Vision Sensor Configuration
- Cisco Stealthwatch Configuration
- Precision Time Protocol Configuration
Networking and Security in Industrial Automation Environments
Configuring the Infrastructure
Switch Configuration
The following configuration tools are used in this guide for configuration and management of Cisco IE switches:
Device Manager
You can use Device Manager, which is in the switch memory, to manage individual switches. This web interface offers quick configuration and monitoring. You can access Device Manager from anywhere in your network through a web browser. For more information, see the Device Manager online help.
Some of the features that can be configured with Device Manage are:
■![]() Resilient Ethernet Protocol (REP)
Resilient Ethernet Protocol (REP)
■![]() Authentication, Authorization, and Accounting (AAA)
Authentication, Authorization, and Accounting (AAA)
The following sections contain some features that are configured using device manager. For a complete list and configuration details and options, see the Device Manager online help.
Traffic Segmentation
Interface Configurations
■![]() Switch virtual interfaces (SVIs) in Configuration -> Layer 2 -> VLAN
Switch virtual interfaces (SVIs) in Configuration -> Layer 2 -> VLAN
■![]() Interface settings in Configuration -> Interface -> Ethernet
Interface settings in Configuration -> Interface -> Ethernet
Redundancy
Routing
■![]() Default Gateway in Configuration -> Routing Protocols -> Static Routing
Default Gateway in Configuration -> Routing Protocols -> Static Routing
■![]() Static routes in Configuration -> Routing Protocols -> Static Routing
Static routes in Configuration -> Routing Protocols -> Static Routing
Security
■![]() Access control lists (ACLs) in Configuration -> Security -> ACL
Access control lists (ACLs) in Configuration -> Security -> ACL
■![]() AAA in Configuration -> Security -> AAA
AAA in Configuration -> Security -> AAA
■![]() User creation in Administration -> Management -> User Administration
User creation in Administration -> Management -> User Administration
Other Configuration
■![]() VTP in Configuration -> Layer 2 -> VTP
VTP in Configuration -> Layer 2 -> VTP
■![]() Interface Smartport macros in Configuration -> Layer 2 -> Smartports
Interface Smartport macros in Configuration -> Layer 2 -> Smartports
■![]() IGMP snooping in Configuration -> Services -> Multicast
IGMP snooping in Configuration -> Services -> Multicast
■![]() QoS in Configuration -> Services -> Multicast
QoS in Configuration -> Services -> Multicast
■![]() PTP in Administration -> Management -> Time
PTP in Administration -> Management -> Time
■![]() Network Time Protocol (NTP) in Administration -> Management -> Time
Network Time Protocol (NTP) in Administration -> Management -> Time
Command Line Interface
The switch CLI is based on Cisco IOS software and is enhanced to support desktop-switching features. You can fully configure and monitor the switch. You can access the CLI either by connecting your management station directly to the switch management port, connecting to a console port, or by using Telnet or SSH from a remote management station.
The following sections contain some configurations that are not possible using Device Manager and should be configured using CLI.
Line Passwords Encryption
The password encryption service is enabled in the global configuration with the following command:
Logging Settings
To configure the logging buffer size or the time stamping service:
Error Disable
To fully configure the error-disable feature, use the following commands:
VTY Line Configuration
If desired the VTY lines must be configured to use SSH only. By default they accept both SSH and Telnet. Add the following configuration under line settings:
Smartport
Smartport macros provide a convenient way to save and share common configurations. You can use Smartport macros to enable features and settings based on the location of a switch in the network and for mass configuration deployments across the network.
Each Smartport macro is a set of CLI commands that you define. Smartport macros do not contain new CLI commands; they are simply a group of existing CLI commands.
When you apply a Smartport macro to an interface, the CLI commands within the macro are configured on the interface. When the macro is applied to an interface, the existing interface configurations are not lost. The new commands are added to the interface and are saved in the running configuration file.
Refer to Cisco Industrial Ethernet 4000, 4010 and 5000 Switch Software Configuration Guide for Smartport configuration details:
https://www.cisco.com/c/en/us/td/docs/switches/lan/cisco_ie4010/software/release/15-2_4_EC/configuration/guide/scg-ie4010_5000/swmacro.html
After running the express setup you could apply the following configuration macros through the CLI:
The cisco-global macro applies the following configurations:
■![]() Enable dynamic port error recovery for link state failures.
Enable dynamic port error recovery for link state failures.
■![]() Enable aggressive mode UniDirectional Link Detection (UDLD) on all fiber uplinks.
Enable aggressive mode UniDirectional Link Detection (UDLD) on all fiber uplinks.
■![]() Enable Rapid Per VLAN Spanning Tree Plus (Rapid PVST+) and Loopguard.
Enable Rapid Per VLAN Spanning Tree Plus (Rapid PVST+) and Loopguard.
To apply use the following command in configuration mode:
The cisco-ie-global macro applies the following configurations:
■![]() Access list and policy map for Common Industrial Protocol (CIP) QoS.
Access list and policy map for Common Industrial Protocol (CIP) QoS.
■![]() Configures IP Internet Group Management Protocol (IGM) snooping and IP IGMP snooping querier.
Configures IP Internet Group Management Protocol (IGM) snooping and IP IGMP snooping querier.
■![]() Configures spanning-tree mode to MST and Loopguard.
Configures spanning-tree mode to MST and Loopguard.
To apply use the following command in configuration mode:
QoS Configuration Examples
Cisco IND Plug-and-Play
The Cisco IND plug-and-play feature provides the OT technician with a way to efficiently replace or add a new network device to their current network topology. The following section describes the steps to add a device to an existing ring using a configuration template in the IND plug-n-play feature.
Creating a Template
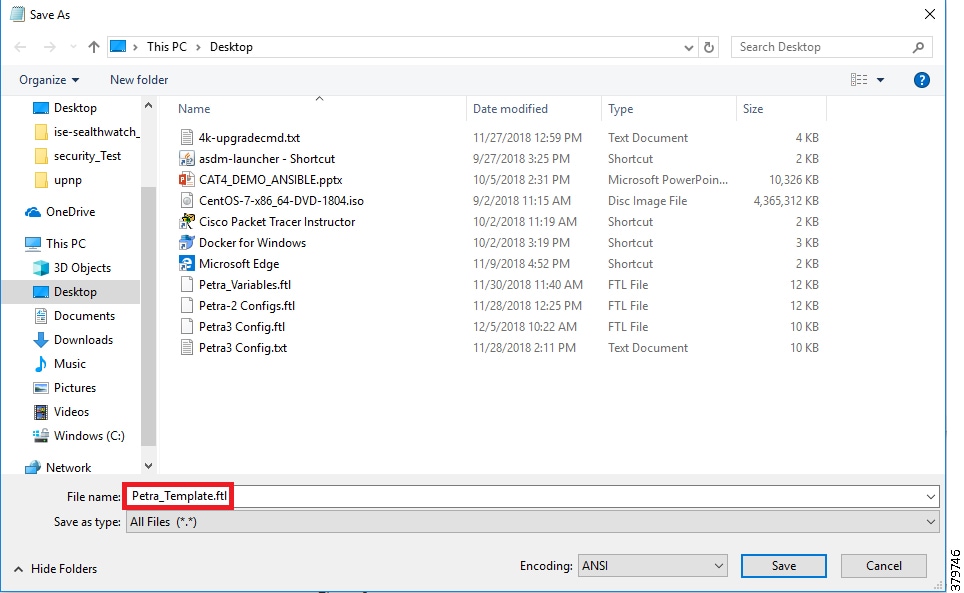
IND requires a template to be saved with a.ftl file extension (Apache FreeMarker TM). The template is created using a copy of standard configuration on an existing switch. Values that may change, like host names, are replaced with input variables that are set before deploying the configuration to a new device. The template is saved with a.ftl extension by utilizing File -> Save As.. and changing the.txt extension to.ftl.
Note: If you are copying a running configuration and modifying it as a template, be sure to remove any crypto self-signed certificate configurations. If you push a configuration with a certificate in the template, the self-signed certificate will be overwritten with the old one and will prevent the web UI from functioning.
Figure 1 Replacing File Extension
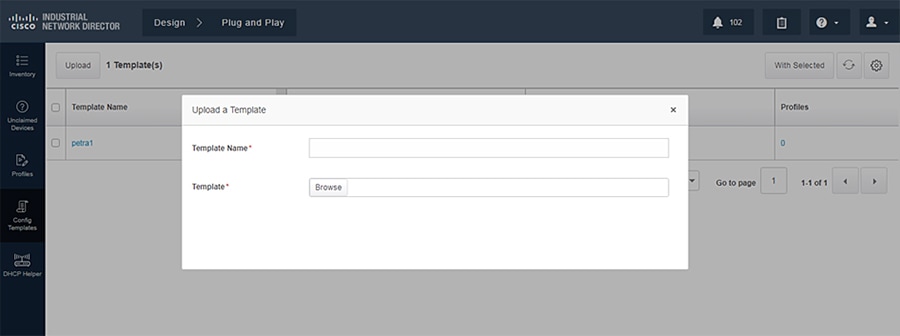
Loading a Template
Go to Design -> Plug and Play -> Config Templates -> Upload and select the template previously created.
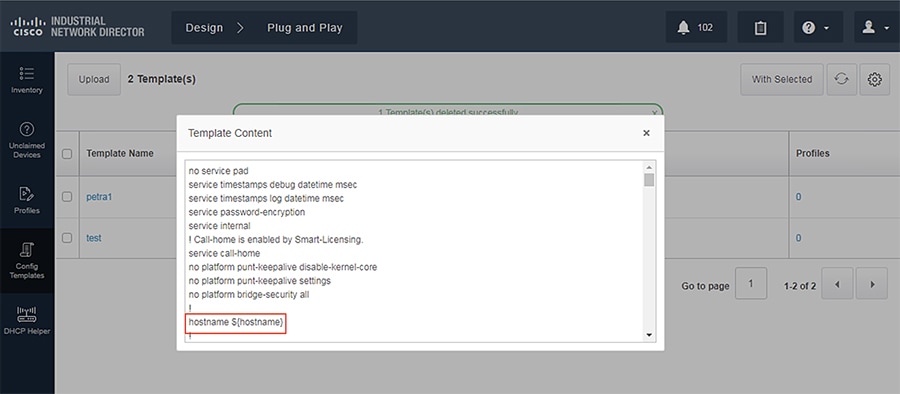
Template Validation
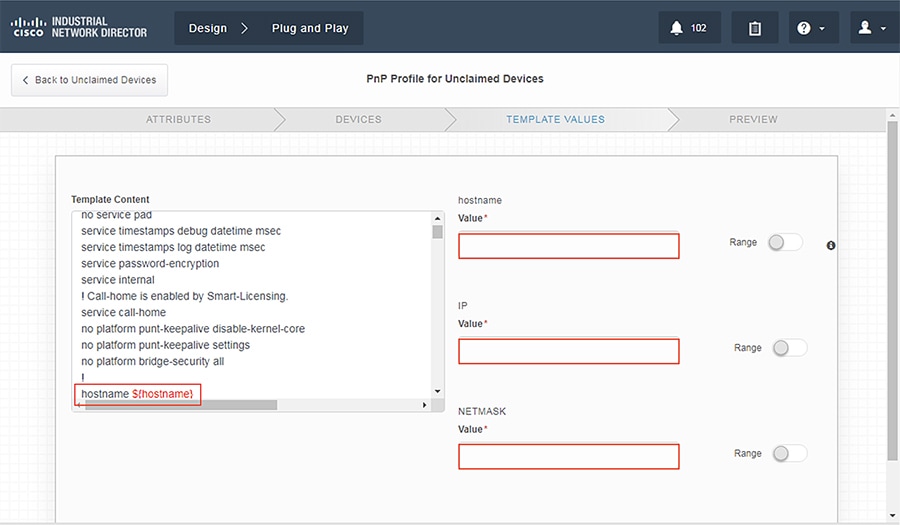
In the current template you will notice the ${hostname} variable. Using the dollar sign ($) and curly brackets ({}), you can define a variable in a template that will require the user to input the required value when pushing the configuration.
Configuring a Device for Plug-and-Play
Out of the box, a switch will guide you through initial configuration, such as switch name, management, interface, and so on. Ensure the IP address of the device is reachable by IND. After initial configuration, configure the device to utilize plug-and-play with IND:
Pushing Configuration Template
1.![]() Once the device is configured, you should see the device under Design -> Plug-and-Play -> Unclaimed Devices. You should now be able to select the device to push a configuration template.
Once the device is configured, you should see the device under Design -> Plug-and-Play -> Unclaimed Devices. You should now be able to select the device to push a configuration template.
Figure 4 Pushing Template to New Device
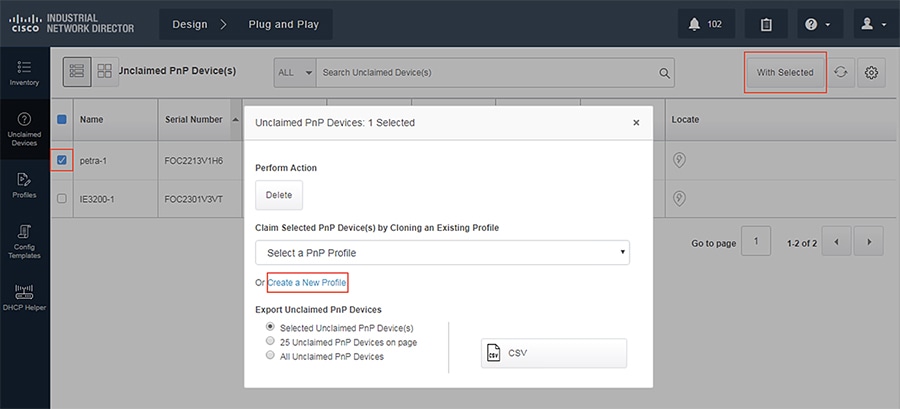
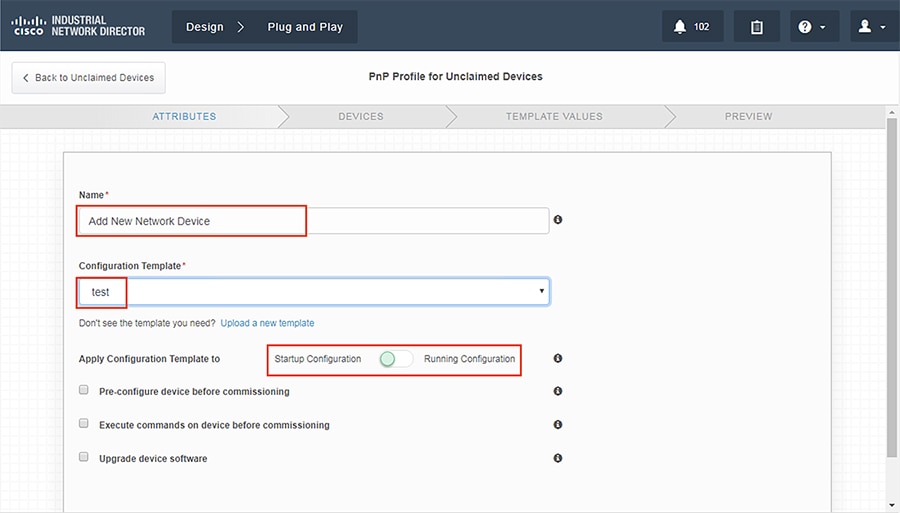
2.![]() To push a configuration template, we must first create a new profile to define some attributes.
To push a configuration template, we must first create a new profile to define some attributes.
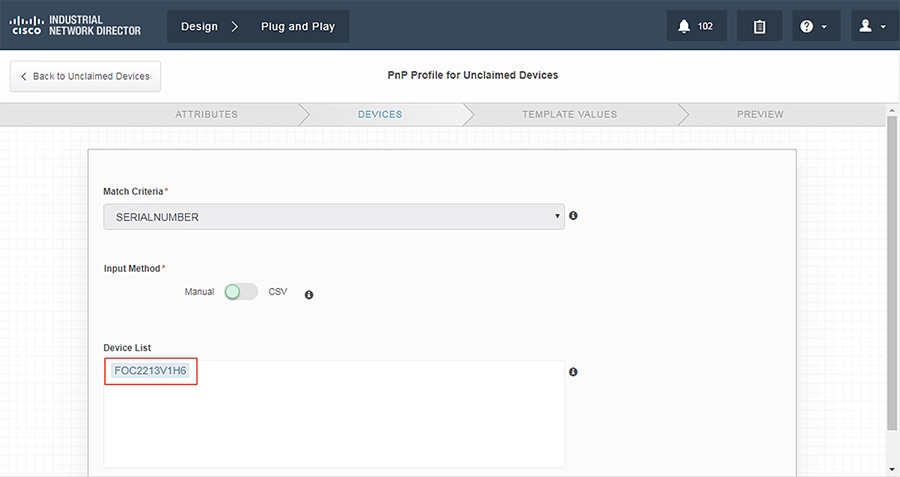
3.![]() Devices that need to be configured are matched via serial number.
Devices that need to be configured are matched via serial number.
4.![]() Enter the proper values in the variable fields.
Enter the proper values in the variable fields.
5.![]() Validate that the configuration is correct and click Claim.
Validate that the configuration is correct and click Claim.
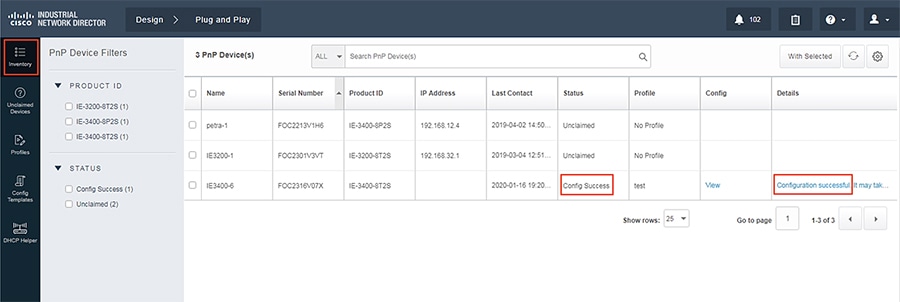
6.![]() Verify that the new device has been configured correctly. The status should read Config Success.
Verify that the new device has been configured correctly. The status should read Config Success.
Figure 8 Verifying Device Creation
Cisco Industrial Network Director Configuration
Cisco IND provides an easy-to-use interface designed especially for operations staff to be able to get a clear picture of their plant floor network and attached automation endpoints. For additional information, refer to the official product documentation available at:
■![]() Network Management for Operational Technology in Connected Factory Architectures
Network Management for Operational Technology in Connected Factory Architectures
https://www.cisco.com/c/en/us/td/docs/solutions/Verticals/CPwE/5-1/IND/IND_Connected_Factory_CRD/IND_Connected_Factory_CRD.html
This section describes the validated configuration of IND, highlighting the following features:
■![]() Creation of Discovery Profiles for IACS assets and networking devices.
Creation of Discovery Profiles for IACS assets and networking devices.
■![]() Creation of Device Access Profiles that will be used in discovering IACS assets and networking devices.
Creation of Device Access Profiles that will be used in discovering IACS assets and networking devices.
■![]() Creation of Groups for IACS assets and networking devices based on the Cell/Area Zones.
Creation of Groups for IACS assets and networking devices based on the Cell/Area Zones.
Installation
The installation notes for IND can be found at:
https://www.cisco.com/c/en/us/td/docs/switches/ind/install/IND_1-4_install.html
Creating a Discovery Profile
The objective of creating a discovery profile is to define an IP address scope of different IACS assets and networking devices and scan those assets. If the IACS or networking device is reachable, then IND scans the device, discovers the attributes, and moves them to the IND inventory. Figure 9 shows how different asset discovery profiles are defined in IND.
Figure 9 Creating the Asset Discovery Profile
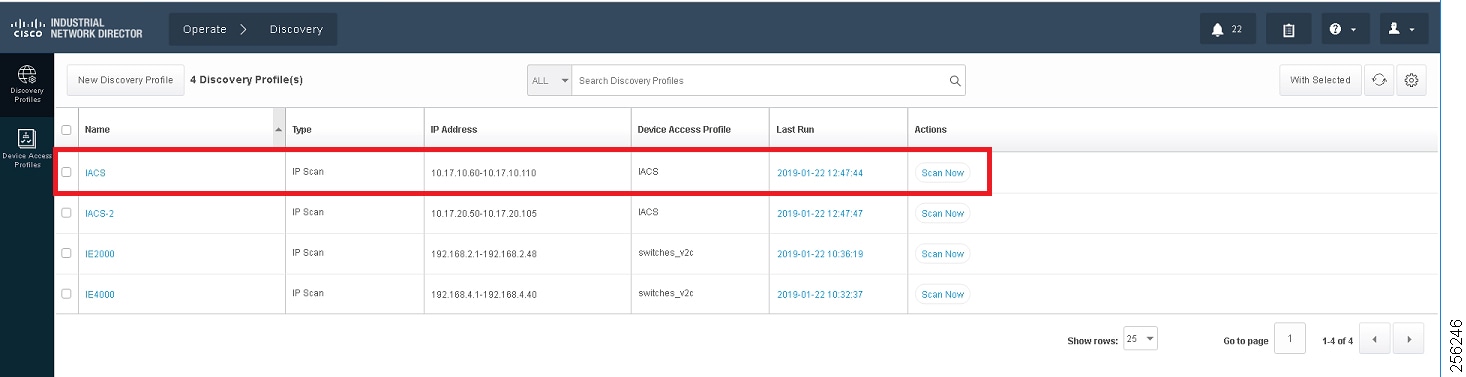
As shown in the first row of Figure 9, the IACS profile is performing an IP scan for the IP address range 10.17.10.1 - 10.17.10.254. The Access_Profile used for this scan is IACS_PROFILE (explained in the next section) and all these devices are attached to a group called IACS_devices (also explained in the section below).
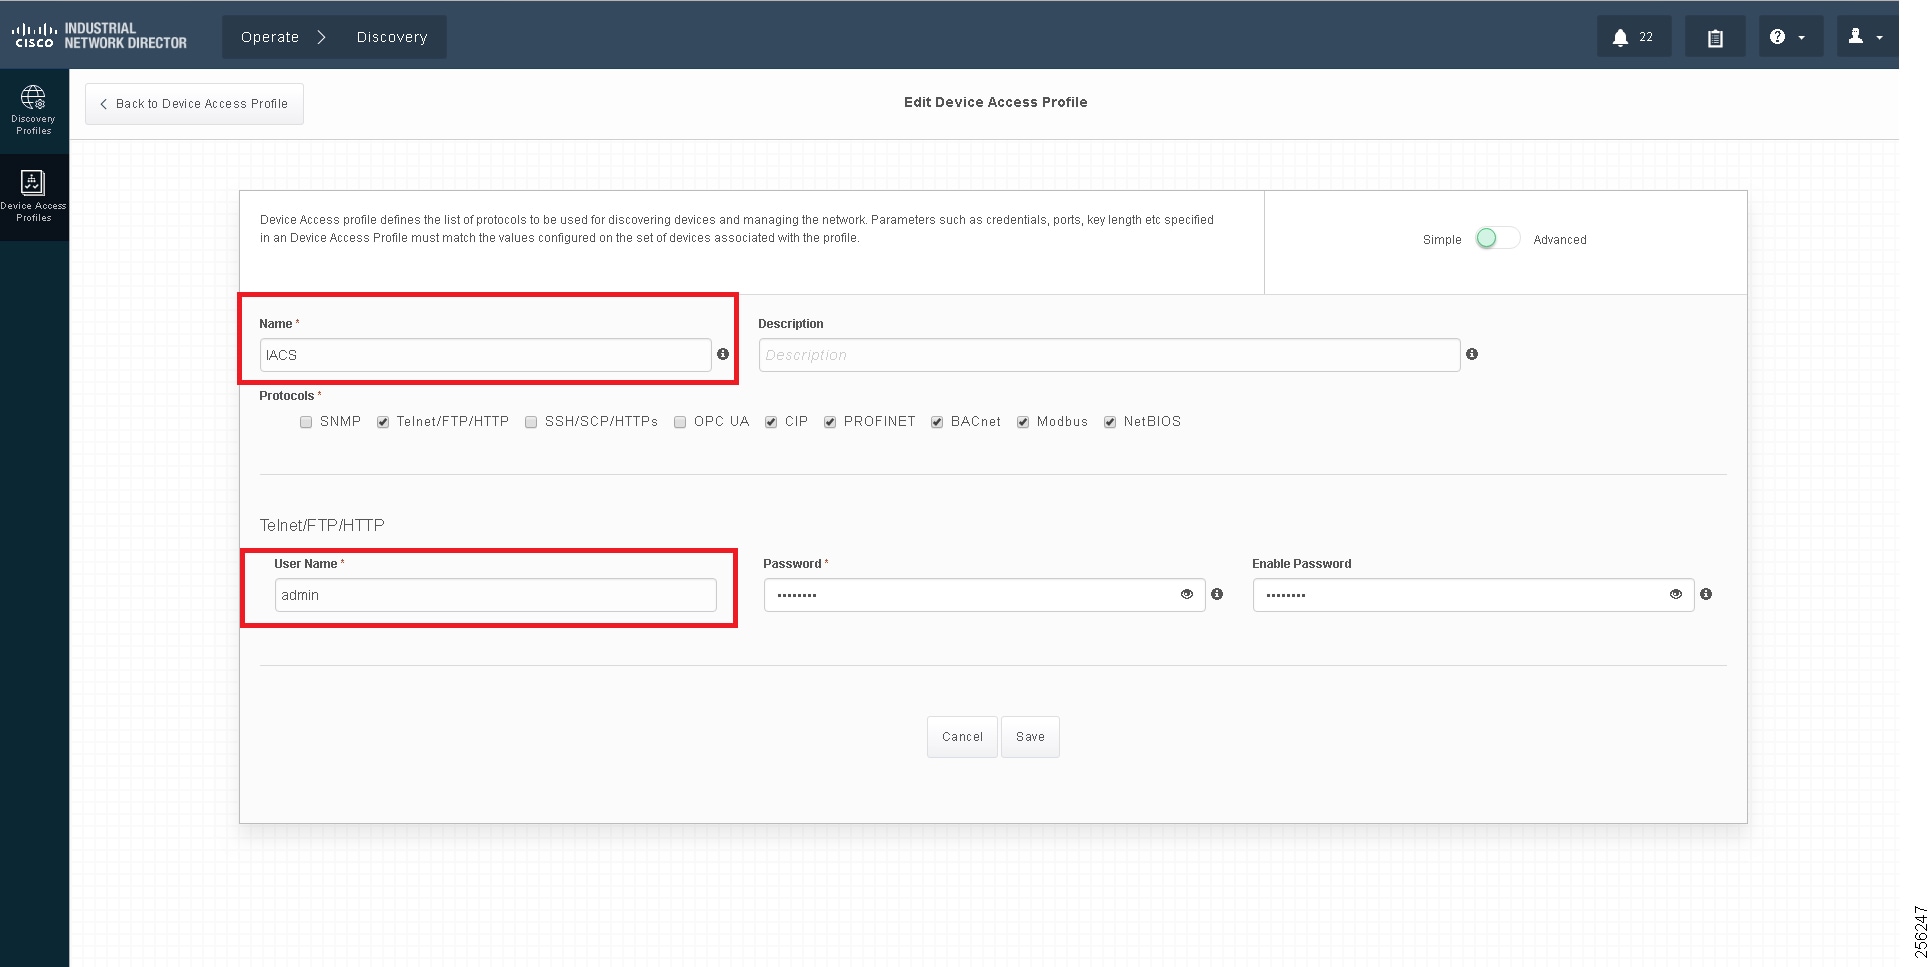
Configuring Access Profiles
The Access Profile is a template that has the common configuration parameters: username, password, and the SNMP community string information. When a group of devices use a different set of parameters, then a separate Access Profile can be defined. The Access Profile created in this section is tied to the Discovery Profile. Figure 10 shows the details of an Access Profile.
Figure 10 Configuring the Access Profile
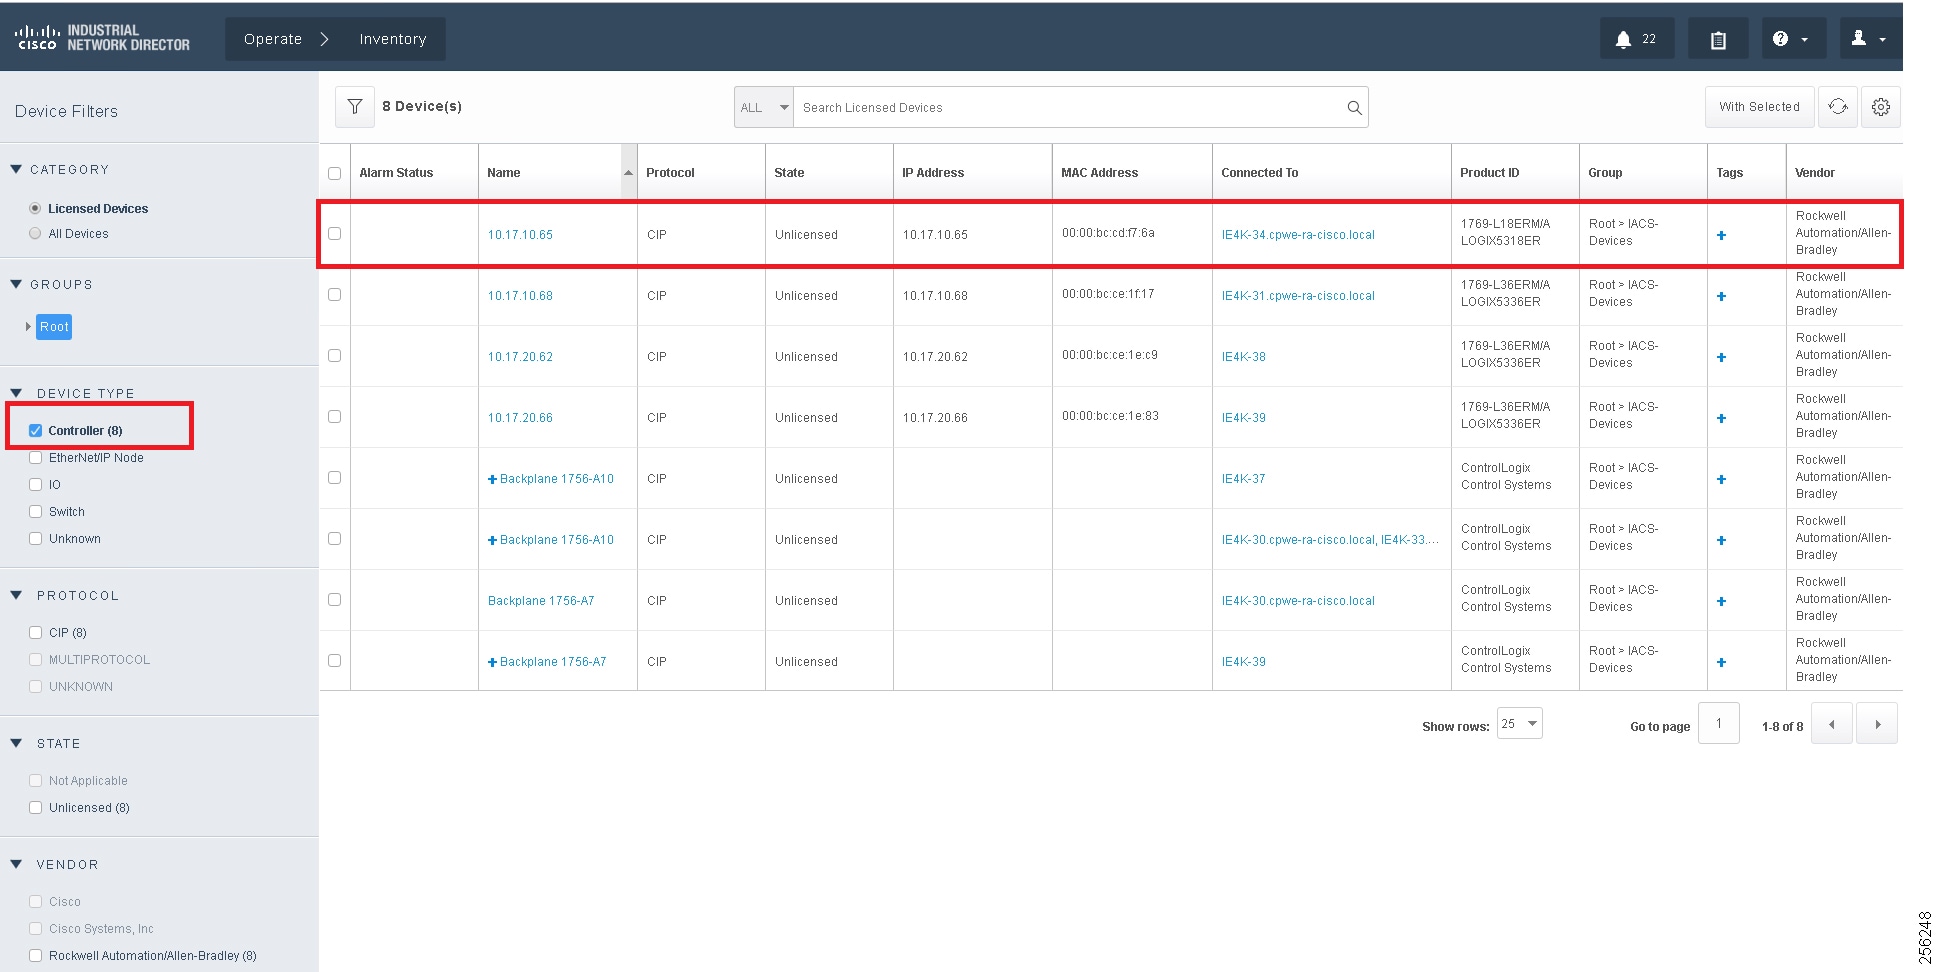
Asset Inventory
IND maintains list of devices that it has discovered in the Inventory. For each Inventory item, details such as uplink device, IACS type (for example, Controller or I/O), the interface between the IACS device and the switch, the protocol used to communicate with the IACS asset, IP address of the IACS asset, Group, vendor information, and so on. There are filters available for OT control system engineers to search for devices based on different criteria. Figure 11 shows a list of controllers that support the CIP protocol. As shown in Figure 11, IND displays important information about the IACS asset.
Figure 11 Asset Inventory of IND
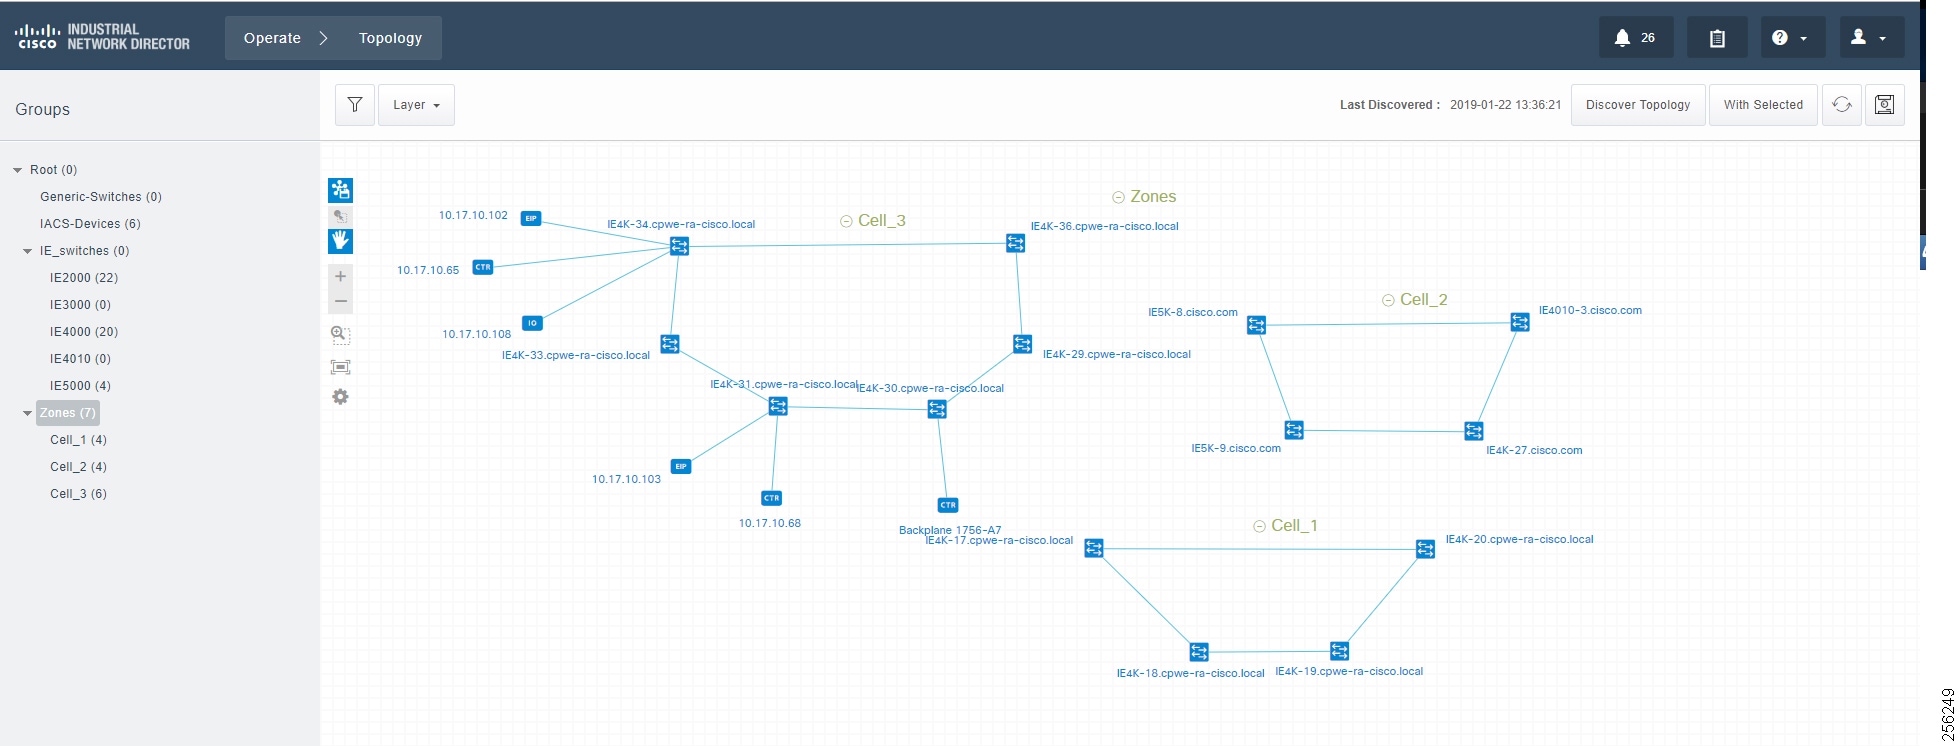
Group Management
Managing devices in separate groups simplifies the management of devices. Figure 12 shows three groups that have been created based on the Cell/Area Zone topology.
Figure 12 Topology Diagram for IND
Licensing
IND comes up with a base license that allows an OT operator to create Discovery Profiles to scan assets as well as use plug-and-play to configure assets. However, certain features of IND for managing IES devices require an additional license purchase.
For more information on IND licensing, see:
https://www.cisco.com/c/dam/en/us/products/collateral/cloud-systems-management/industrial-network-director/datasheet-c78-737848.pdf
IND Configuration for Precision Time Protocol
IND for Precision Time Protocol (PTP) infrastructure discovery and management requires CIP and Simple Network Management Protocol (SNMP) features and begins with IND release 1.7. It includes the following steps:
■![]() Industrial network devices discovery
Industrial network devices discovery
■![]() Industrial network devices inventory and licensing
Industrial network devices inventory and licensing
■![]() Industrial network devices PTP topology and PTP attributes validation
Industrial network devices PTP topology and PTP attributes validation
System Requirements
The IND software package requires:
■![]() No other FTP server is running and listening on port 21.
No other FTP server is running and listening on port 21.
■![]() No other instance of PostgreSQL is installed on port 5432 or any other port on the system.
No other instance of PostgreSQL is installed on port 5432 or any other port on the system.
■![]() The host name of the Windows machine must start with a letter of the alphabet (A-Z or a-z).
The host name of the Windows machine must start with a letter of the alphabet (A-Z or a-z).
–![]() You may use special characters within your password such as digits (0-9), minus sign (-), and period (.) as well as alpha characters.
You may use special characters within your password such as digits (0-9), minus sign (-), and period (.) as well as alpha characters.
■![]() The following ports are open for both inbound traffic on the firewall:
The following ports are open for both inbound traffic on the firewall:
–![]() 21—FTP active port for ODM file transfer in regular mode
21—FTP active port for ODM file transfer in regular mode
–![]() 8443— HTTPS for Web UI and PnP
8443— HTTPS for Web UI and PnP
–![]() 50000-50050—FTP passive ports for ODM file transfer in regular mode
50000-50050—FTP passive ports for ODM file transfer in regular mode
■![]() The following ports are open for outbound traffic on the firewall:
The following ports are open for outbound traffic on the firewall:
–![]() 443—HTTPS for WSMA/JSON-RPC in secure mode
443—HTTPS for WSMA/JSON-RPC in secure mode
–![]() 80—HTTP for WSMA/JSON-RPC in regular mode
80—HTTP for WSMA/JSON-RPC in regular mode
–![]() 67—DHCP server if the IND PnP DHCP helper is being used
67—DHCP server if the IND PnP DHCP helper is being used
■![]() The following ports are open for both inbound and outbound traffic on the firewall:
The following ports are open for both inbound and outbound traffic on the firewall:
■![]() The above listed ports are default ports. If any of the above ports are customized as part of the installation or in an access profile, then the corresponding ports should be open in the firewall.
The above listed ports are default ports. If any of the above ports are customized as part of the installation or in an access profile, then the corresponding ports should be open in the firewall.
■![]() The network device local user needs to have privilege level of 15.
The network device local user needs to have privilege level of 15.
IND Industrial Network Devices Discovery
IND for PTP discovery requires the following features to be enabled in industrial network devices:
■![]() CISCO-PTP-MIB for SNMP supported devices
CISCO-PTP-MIB for SNMP supported devices
■![]() CIP object 43 for CIP supported devices
CIP object 43 for CIP supported devices
In order for Industrial network devices to be discoverable by IND, the following SNMP and CIP related configuration needs to be manually enabled:
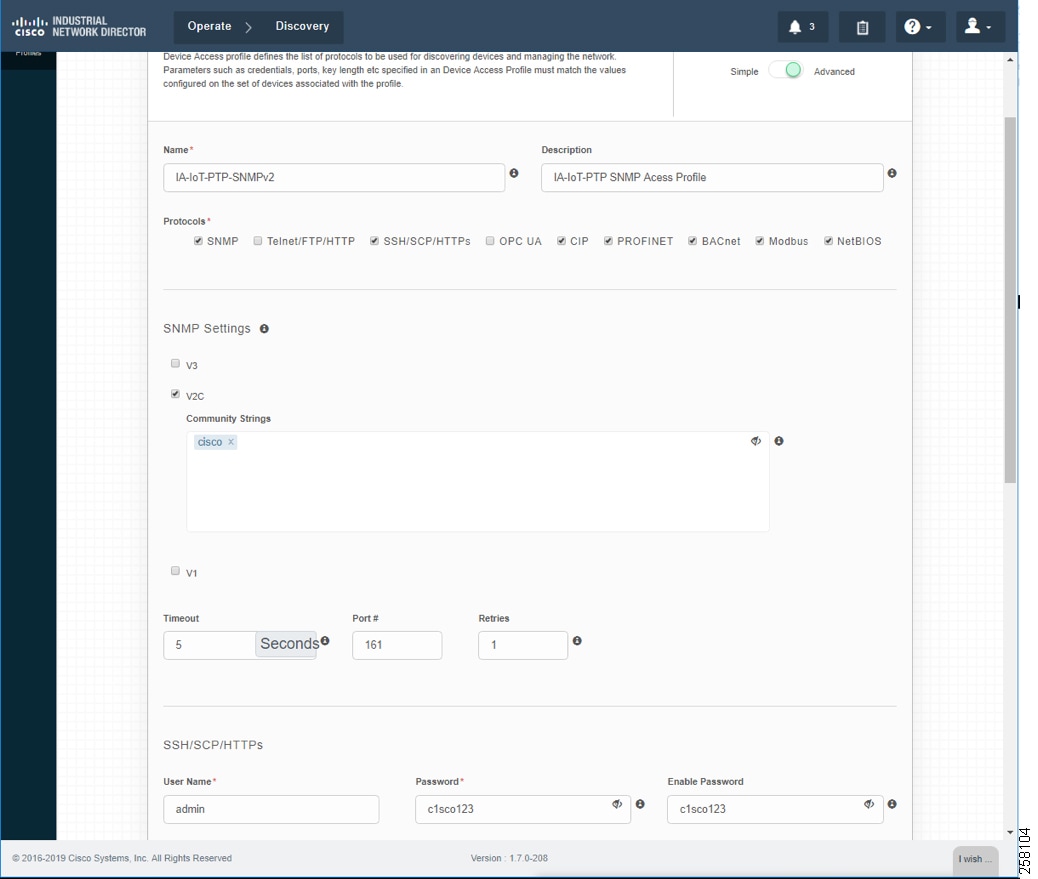
Creating Device Access Profiles
Create a Device Access Profile and provide the corresponding SNMP community string and version setting, Select the Advanced option to provide SSH or Telnet related credentials as shown in Creating Device Access Profile.
Figure 13 Creating Device Access Profile
Creating Device Inventory with IP Scan
Based on the network infrastructure and IP address mapping, create an IP Scan Discovery Profile as shown in Creating Device Inventory with IP Scan.
Figure 14 Creating Device Inventory with IP Scan
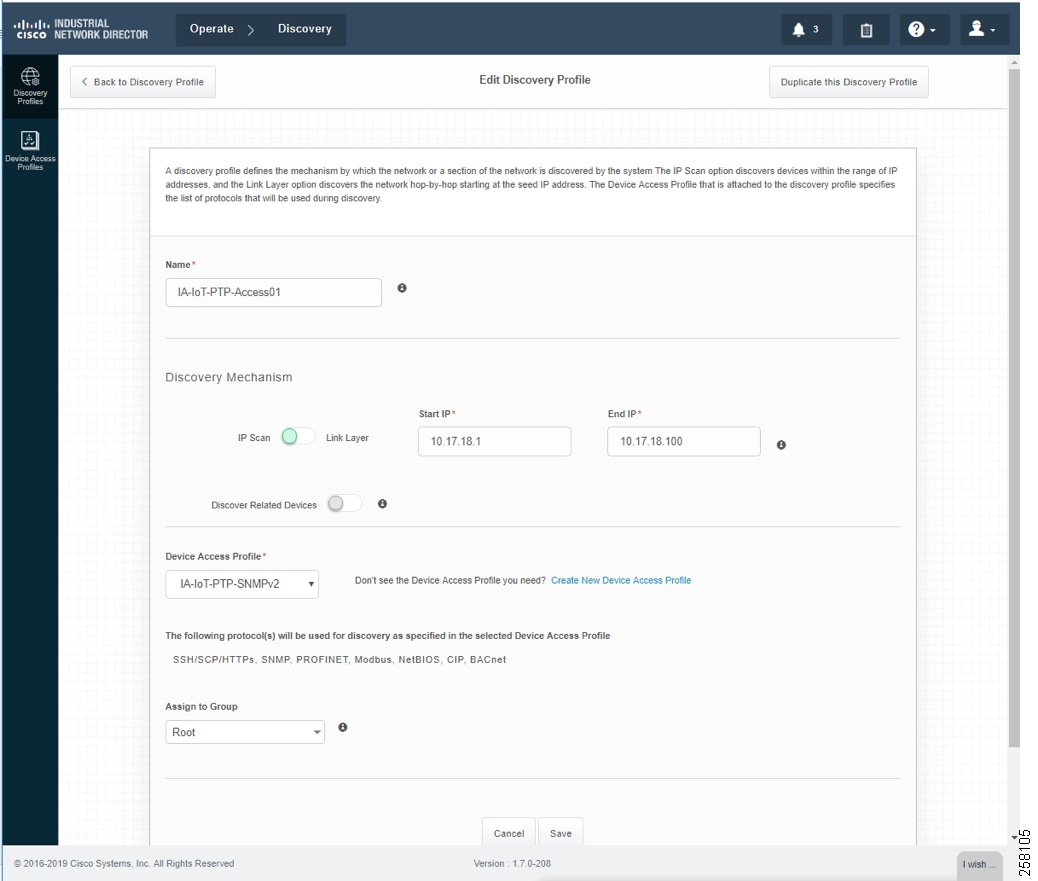
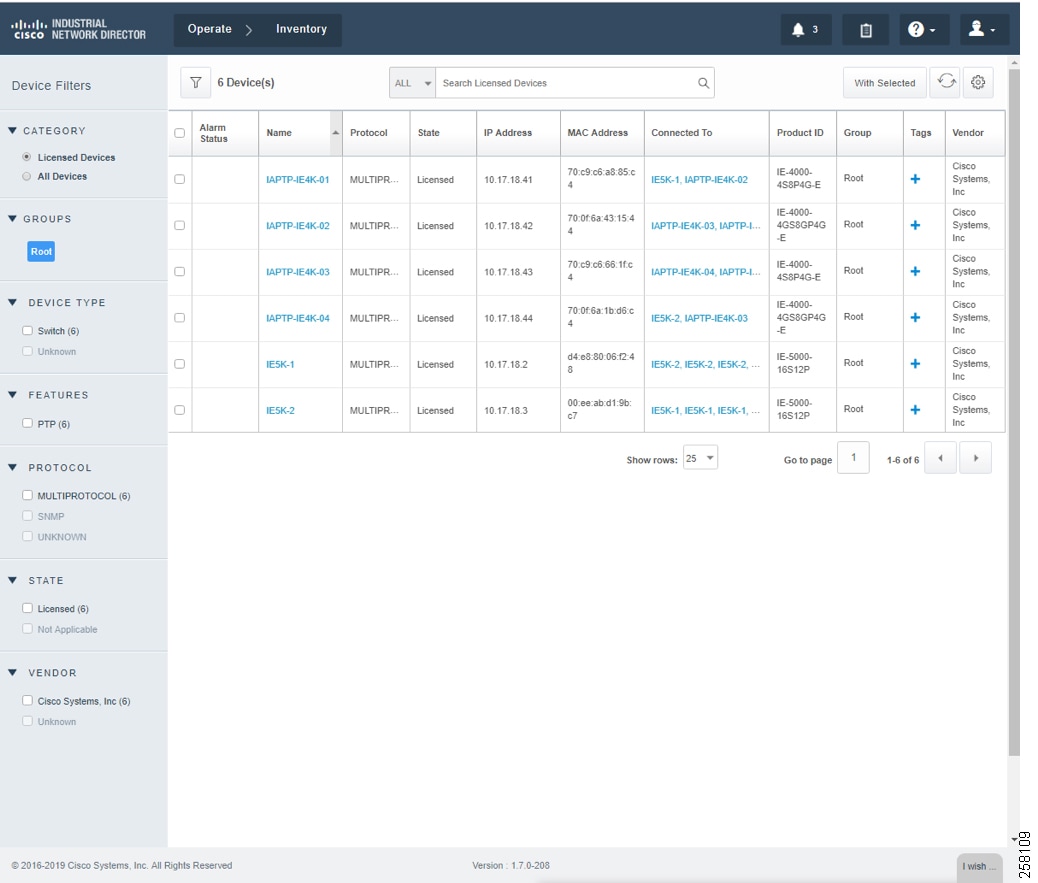
Device Discovery is based on SNMP MIB and related CIP features being enabled inside network devices. IND IP Scan will send an SNMP probe as specified in the Device Discovery Profiles IP address range above and populate Inventory tables and constructs device connectivity in the background. IND in Unlicensed State shows the populated Inventory table; each inventory device reflects its detailed device related information.
Industrial Network Devices are started inside IND in an “Unlicensed” state as shown in IND License Apply into Industrial Devices.
Figure 15 IND in Unlicensed State

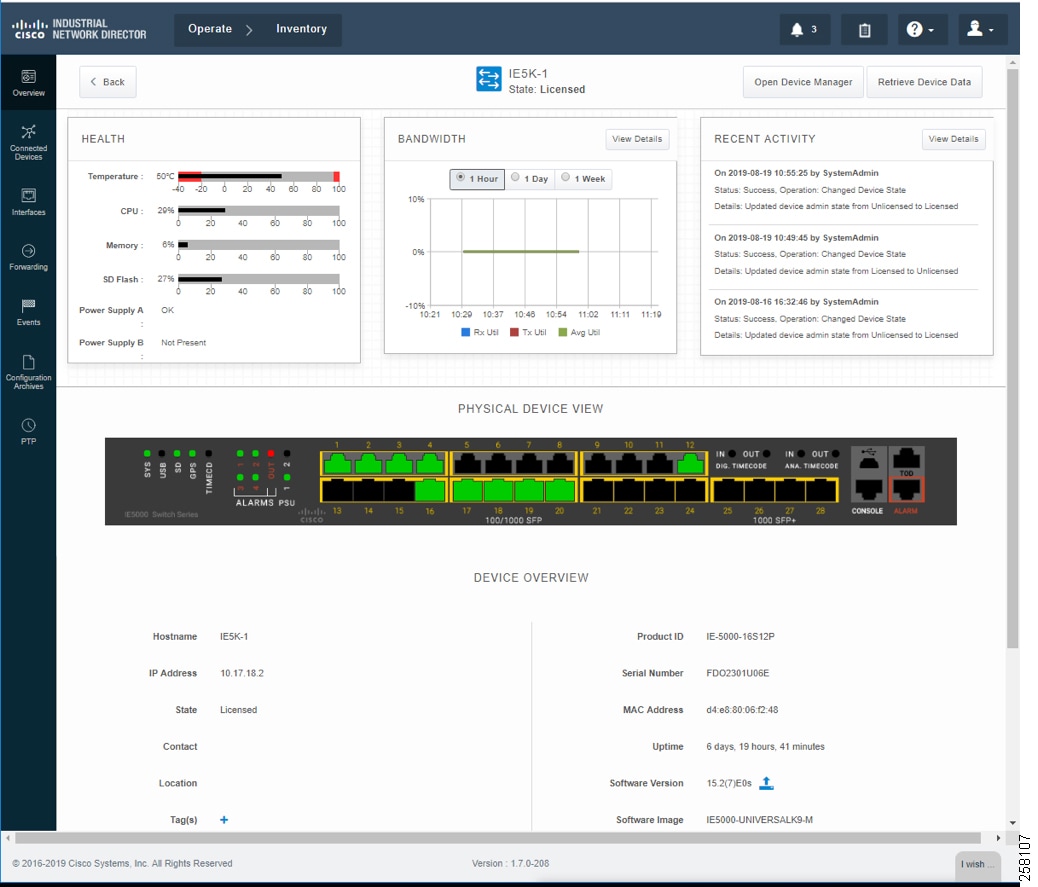
Industrial Network Devices have to be toggled into a “Licensed” state for management PTP related features as shown in IND Inventory Device Detailed Status.
Figure 16 IND Inventory Device Detailed Status
During the license state change, a boostrap configuration is pushed into each of the network devices to enforce license subscription management. The following is a boostrap sample configuration:
Figure 17 IND License Apply into Industrial Devices
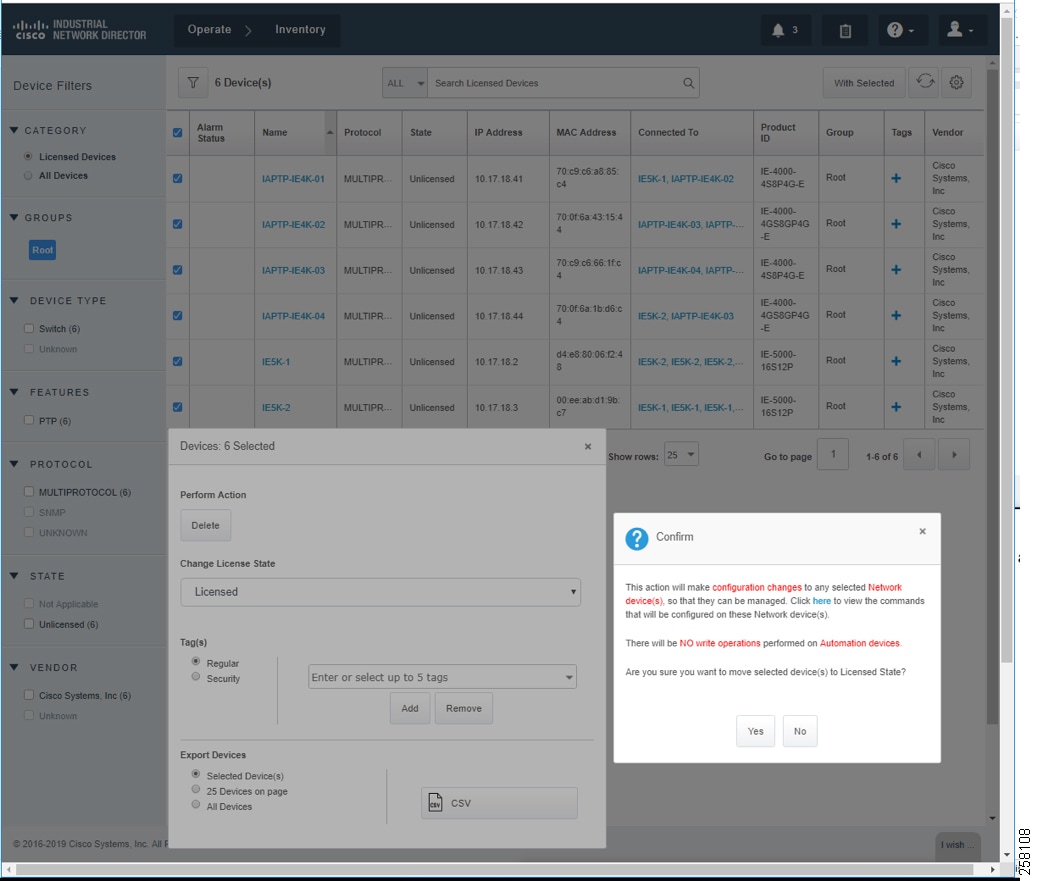
Figure 18 IND Inventory Devices Licensed State
Creating PTP Topology and Display PTP Attributes
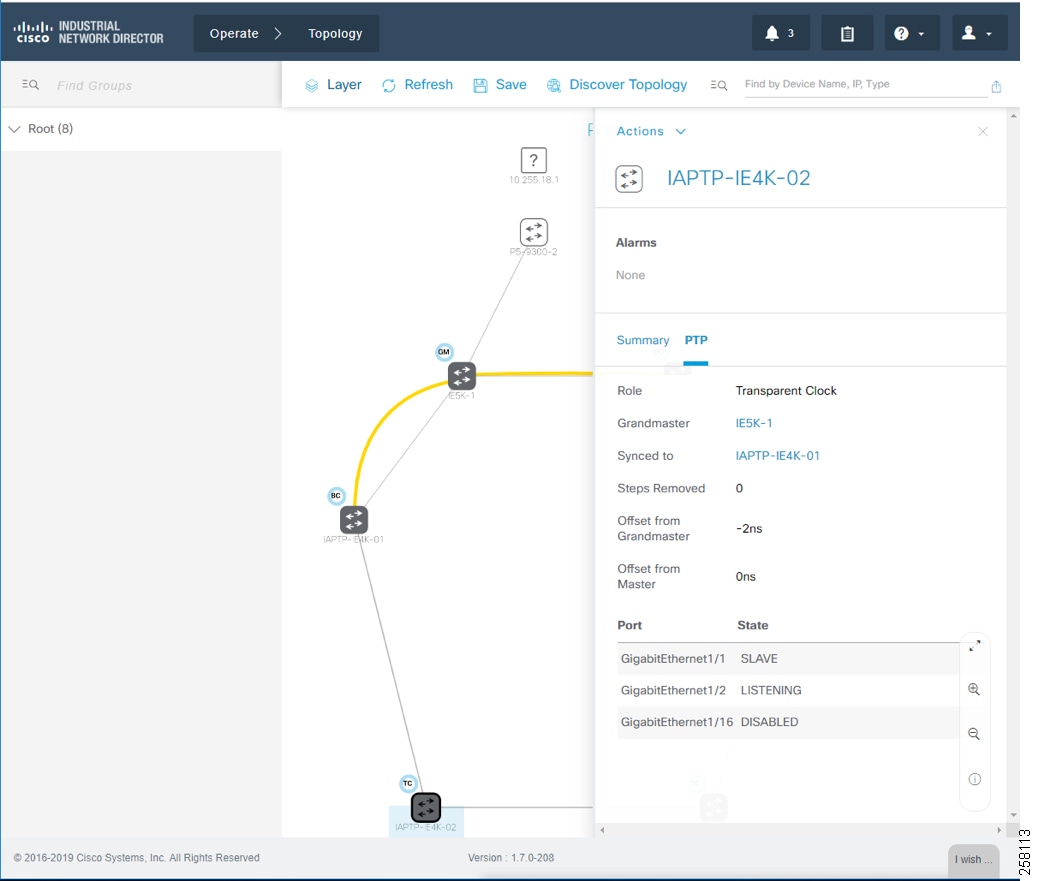
For licensed industrial network devices, the IND topology will enable the PTP layer, which displays the PTP-related topology and each PTP device’s attributes as shown in Topology and Device Attributes—PTP Hierarchy, Topology and Device Attributes—PTP GrandMaster Device, Topology and Device Attributes—PTP Boundary Clock Device, and Topology and Device Attributes—PTP Transparent Device.
Figure 19 Topology and Device Attributes—PTP Hierarchy
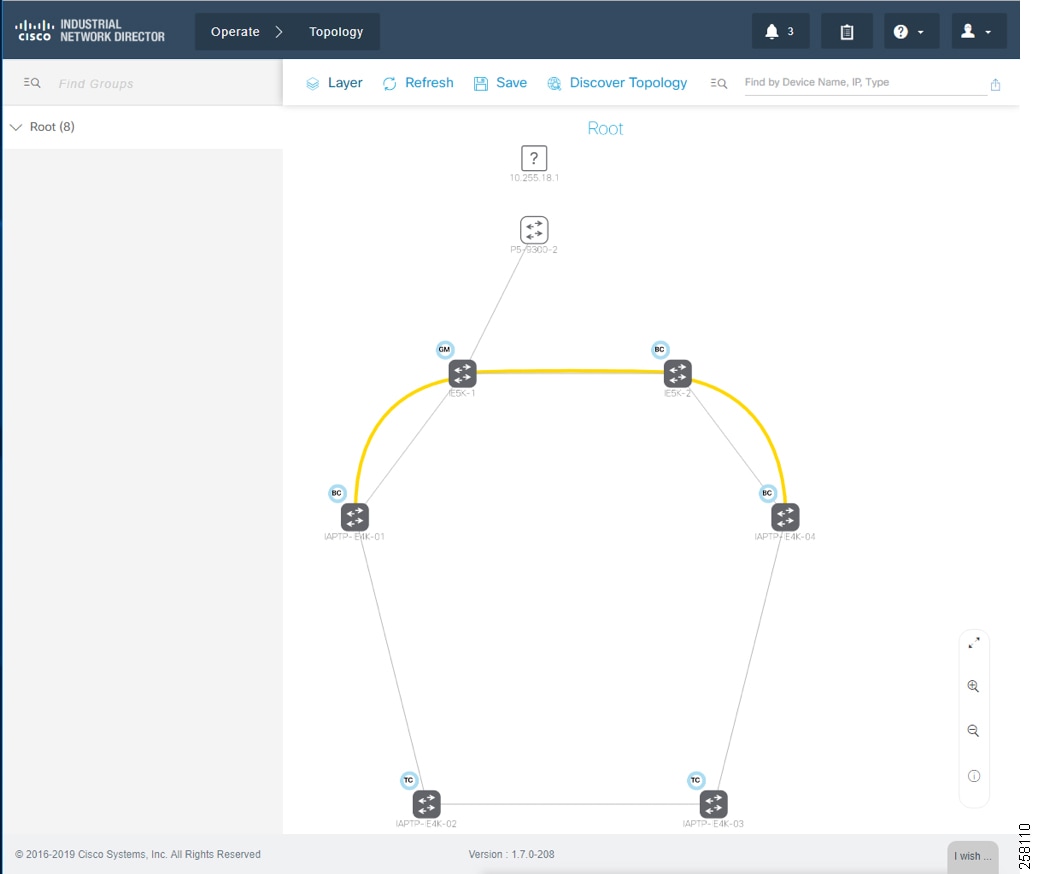
Figure 20 Topology and Device Attributes—PTP GrandMaster Device
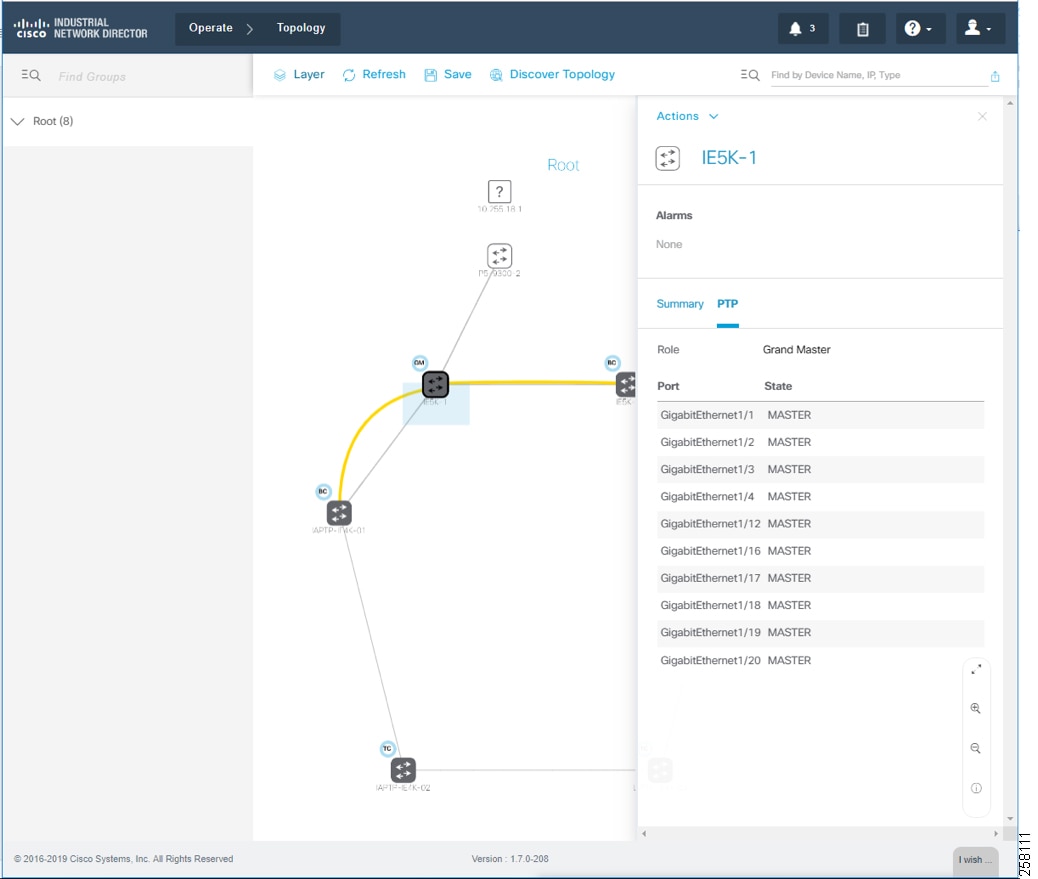
Figure 21 Topology and Device Attributes—PTP Boundary Clock Device
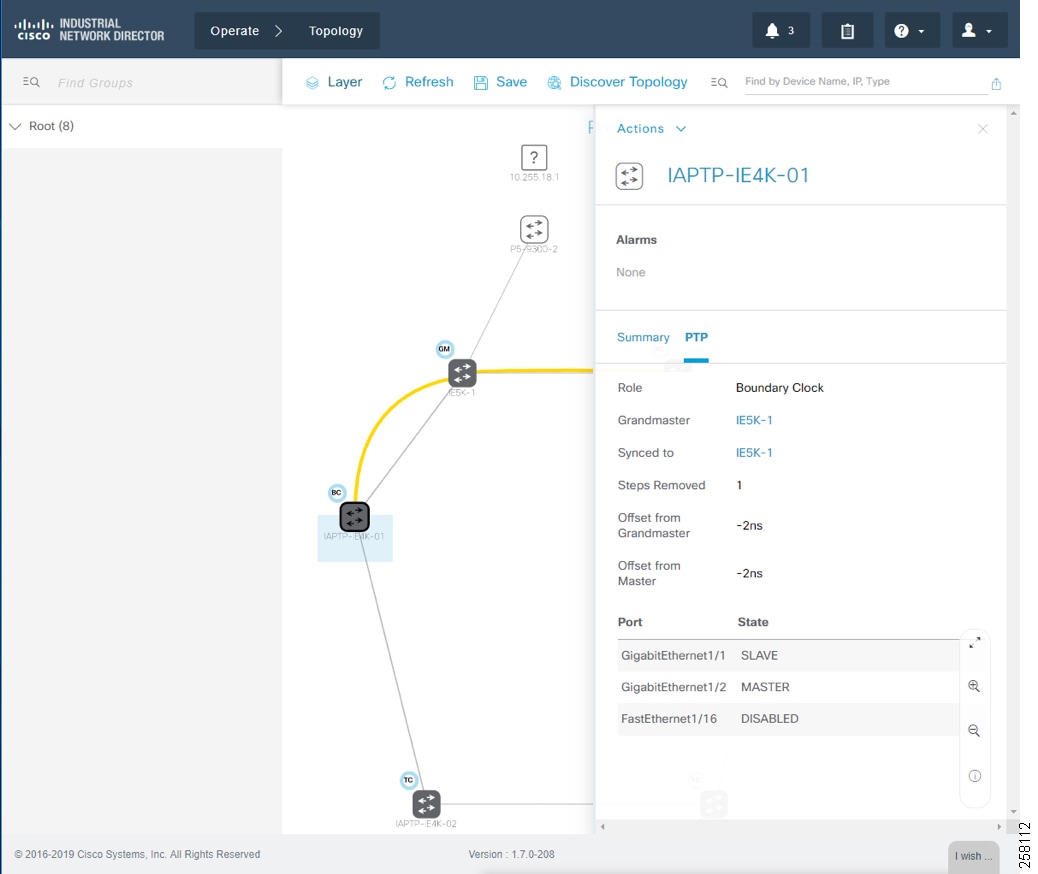
Figure 22 Topology and Device Attributes—PTP Transparent Device
Cisco ISE Configuration
This section gives details on how to configure Cisco ISE for the following components:
■![]() Enabling profiling and configuring different profiling policies
Enabling profiling and configuring different profiling policies
Distributed Deployment
The distributed deployment of ISE was validated for this CVD. Devices Present in Distributed ISE Deployment shows how multiple ISE nodes are configured with various personas to achieve the distributed model.
Figure 23 Devices Present in Distributed ISE Deployment
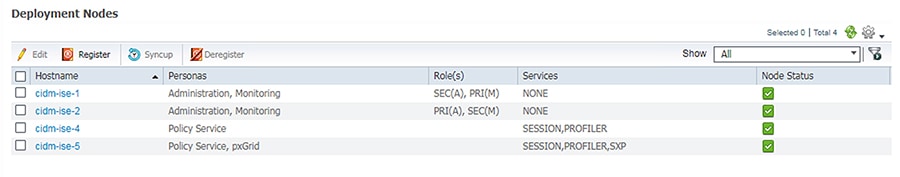
ISE Instance Roles describes the role for each of the ISE instances.
As shown in ISE Instance Roles, cidm-ise-2 is the PAN node for this design, and all the administration tasks such as configuration of network devices, authentication policies, authorization policies, certificate management, checking logs, and all other tasks must be done on this PAN. The PSNs are used for RADIUS and Cisco TrustSec (CTS) communication with the network access devices. In this deployment, since the PAN (cidm-ise-2) is not configured with the Policy Service Node persona, the network access devices must not point to the PAN.
Profiling Policies in Cisco ISE
This section shows how to create different profiling policies based on Industrial Network Access Scheme. The profiling policies shown here are meant as an example and should not be considered a method for the actual deployment.
Industrial Network Access Scheme
ISE profiling uses specific attributes to categorize devices, subsequently enabling authentication and authorization policies based on profile policy criteria. Industrial Network Access Scheme gives an example on different roles for IACS assets in a plant-wide architecture. For example, an Engineering Workstation needs access to all the devices in the plant-wide architecture. Similarly, a device classified as Level_0_IO only has access to devices that are located in the immediate Cell/Area Zone. Based on the access scheme in Industrial Network Access Scheme, we can create profile, authentication, and authorization TrustSec policies to be manifested in a plant-wide network.
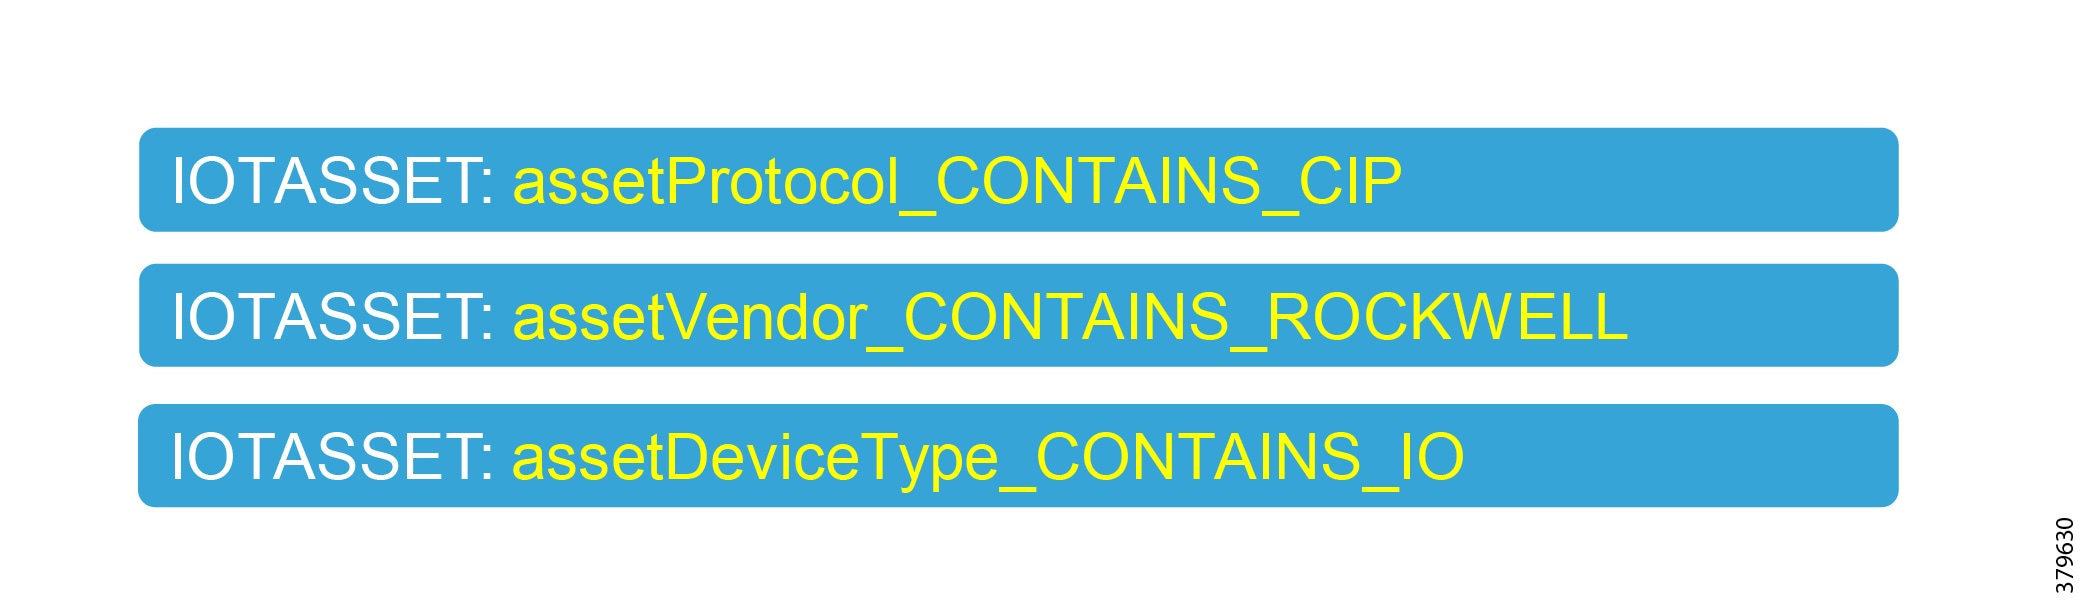
Level_1_controller Policy
This policy is used to profile an IACS asset which is a controller. The key attributes used to profile this device are shown in Figure 24. As shown in Figure 24, the IOTASSET dictionary is used to match different conditions like protocol, assetVendor, and assetDeviceType. The values for the attributes assetVendor and assetDeviceType are obtained by ISE via the pxGrid integration with Cisco Cyber Vision. When a new IACS asset is discovered by Cisco Cyber Vision, it provides the details of the asset to Cisco ISE and this information is used to fill in the attribute values of the IOTASSET dictionary.
Figure 24 Attributes Used to Profile a Controller
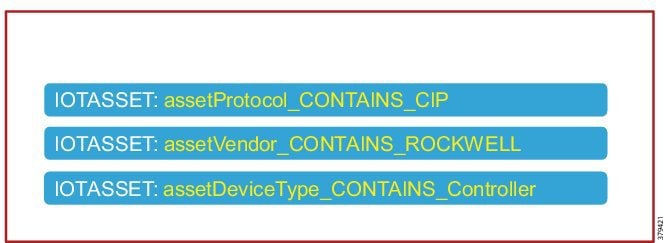
When a match is found for each condition, the certainty of the device matching the profile increases. For example, in Figure 24, if each condition match gives a certainty factor of 10, then if all three conditions match the certainty factor becomes 30. The profiling policy can be tailored to be as strict as necessary; for example, only allowing a profile match if reached a certainty factor of 30, or alternatively profiling by matching at least one condition. In this CVD, the stringent choice was made when classifying a controller. Figure 25 shows the Level_1_controller policy defined in Cisco ISE.
Figure 25 Level_1_controller Policy in Cisco ISE
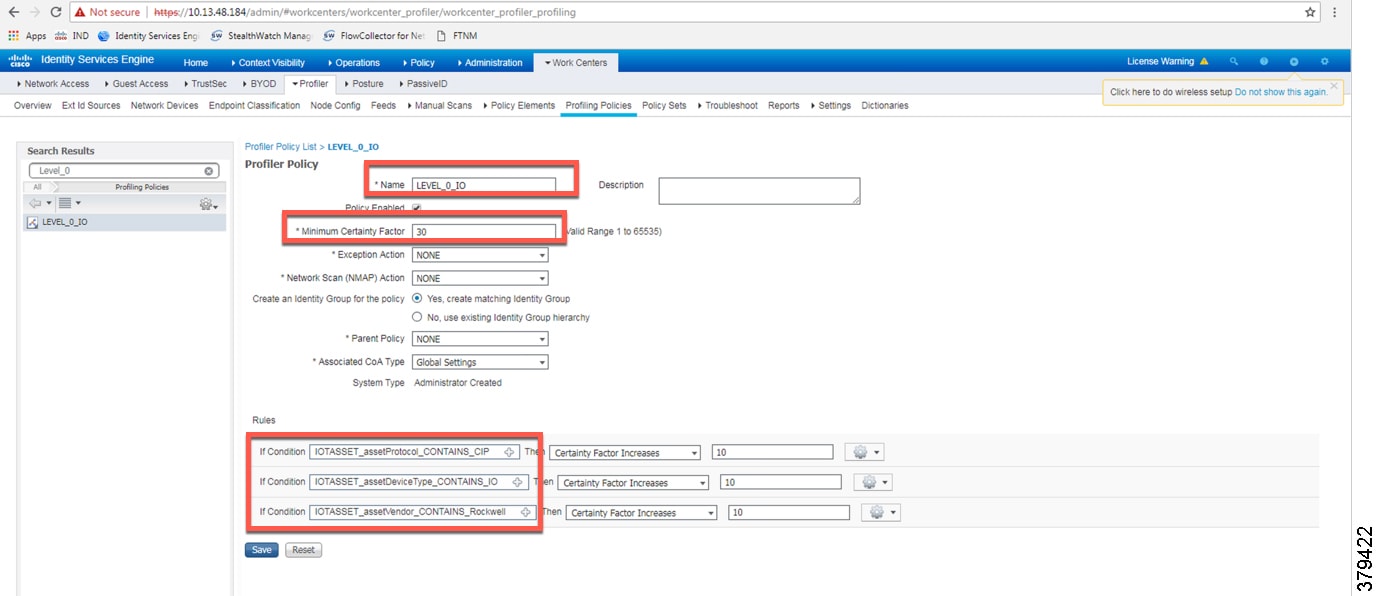
Level_0_IO Policy
The Level_0_IO policy is used to profile I/O assets, which usually only require local Cell/Area Zone communication. Figure 26 shows the profile conditions for Level_0_IO and Figure 27 shows the profiling policy used to profile I/O IACS assets.

Custom Attributes
Cisco ISE uses attributes defined in a dictionary to restrict access to IACS assets and other devices. In Figure 25 and Figure 27, IOTASSET dictionary was used to match attributes that were meant to match IACS assets. In addition, Cisco ISE allows a user to create custom attributes. A combination of pre-defined attributes provided by Cisco ISE along with user attributes allows an IT security architect to create more granular policies. In this CVD, the custom attribute assetGroup was used to create more granular policies. Cisco Cyber Vision provides the value for this attribute, which is then used in conjunction with default ISE attributes. Figure 28 shows how to define custom attributes in the Cisco ISE web UI under Administration -> System -> Settings -> Profiling.
Figure 28 Enabling Custom Attributes in Cisco ISE
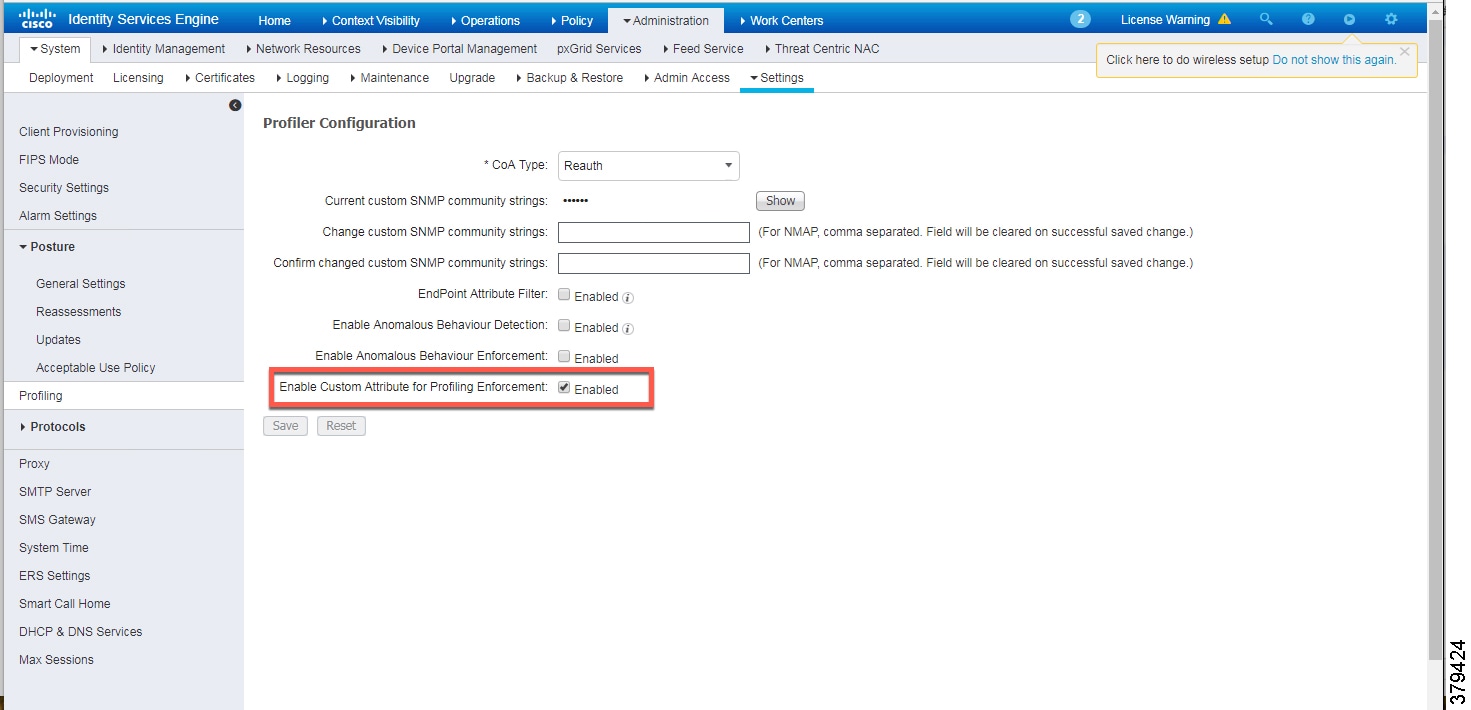
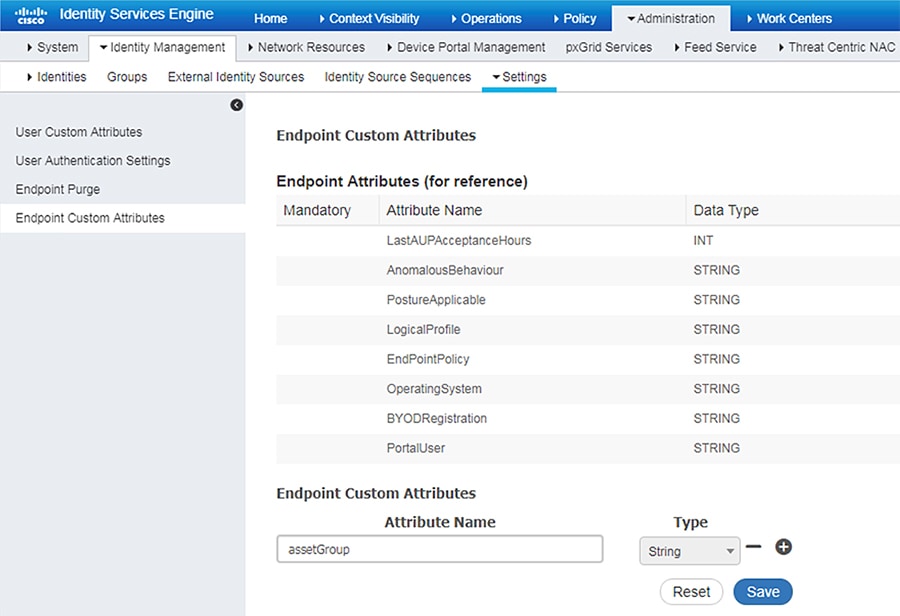
Figure 29 shows how to define the custom attributes by going to Administration -> Identity Management -> Settings -> Endpoint Custom Attributes.
Figure 29 Custom Attribute Examples
Level_3 Policy
The Level_3 policy is used to profile IACS assets that need to access IACS assets across the Cell/Area Zones. For example, a Level_1_Controller in a Cell/Area Zone may need to access another Level_1_Controller in another Cell/Area Zone. This access may not be needed for all the Level_1_Controllers, but only for a few of them. Cisco ISE profiles a device as a Level_1_Controller based on the device attributes defined in the IOTASSET dictionary. In addition, a custom attribute is used to differentiate this device as Level_3. Figure 30 shows the general idea of classifying the device as Level_3.
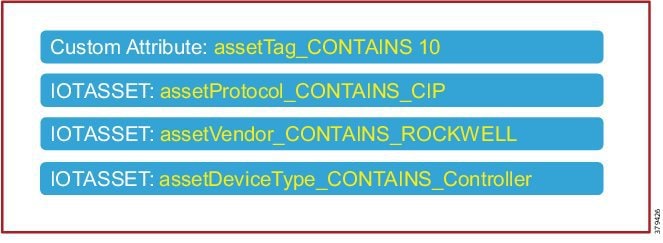
The assetGroup attribute is a custom attribute that was used in addition to the device attributes such as assetProtocol, assetVendor, and assetDeviceType. The minimum certainty factor now increases to 40 because four attributes are used to match an IACS asset as Level_3 and each attribute has certainty factor of 10.
Remote_Access
This profiling access policy is used to classify IACS assets that are made temporarily accessible by a remote user for support and maintenance. For example, an IACS asset in the Cell/Area Zone currently classified as a Level_1_Controller needs to be accessed by the remote desktop server in the Industrial Zone. The current policy is that no IACS asset can be accessed by the remote desktop server unless the IACS asset is classified as Remote_Access. To allow this remote access, the asset’s Security Group Tag (SGT) must be updated by a Change of Authorization (CoA). To initiate the update, the custom attribute must be updated by changing the Group value for the asset in Cisco Cyber Vision. The change is propagated over pxGrid and the device is reprofiled. Based on the updated attribute, ISE determines that the endpoint should be profiled as Remote_Access. When the device is profiled as Remote_Access, ISE sends a CoA (CoA type based on the configured “Associated CoA Type” setting (Port Bounce, Reauth, or Global Setting) for that profile. The CoA is sent to the network device which will signal the network device to Port Bounce or Reauthenticate the port where the IACS asset is connected. Upon reauthenticating with ISE, the device should satisfy a different authorization rule which applies the Remote_Access SGT. Profiling Rule for Remote Access illustrates the profiling policy used to match Remote_Access.
Note: When a new SGT is assigned to an IACS asset, there is a loss of connectivity for a few seconds, during which time no application is able to access the IACS asset.
Figure 31 Profiling Rule for Remote Access

Configuring TrustSec in Cisco ISE
This section provides configuration details for TrustSec communication between ISE and networking devices.
■![]() Configuring Security Group Tag Exchange Protocol (SXP)
Configuring Security Group Tag Exchange Protocol (SXP)
■![]() Configuring Authentication Policies
Configuring Authentication Policies
Adding Switches to Cisco ISE
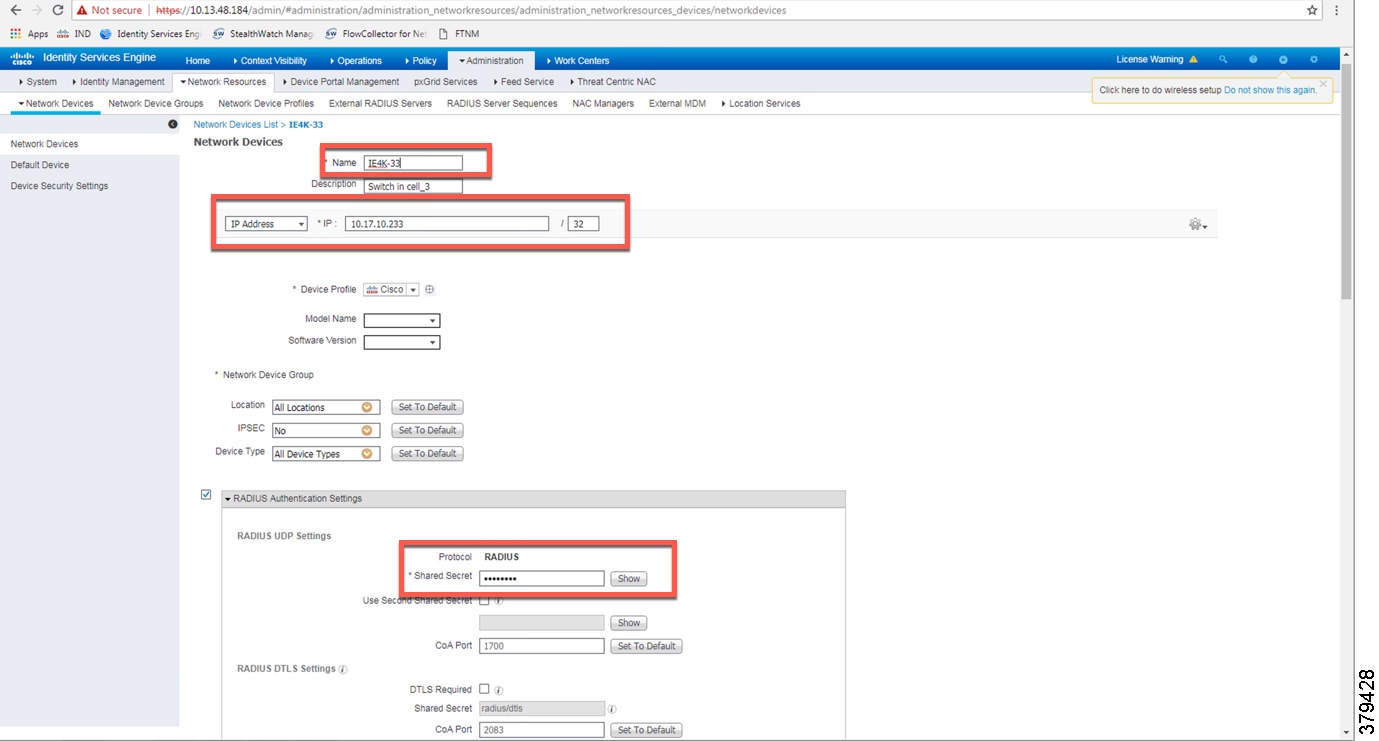
For Cisco ISE to assign SGTs to IACS assets, switch details such as the IP address and RADIUS pre-shared secret key must be defined in Cisco ISE. From the ISE web UI, navigate to Administration —> Network Resources -> Network Devices to configure device details. Figure 32 shows the information needed to establish a successful RADIUS connection Cisco ISE and a switch.
Figure 32 RADIUS Configuration
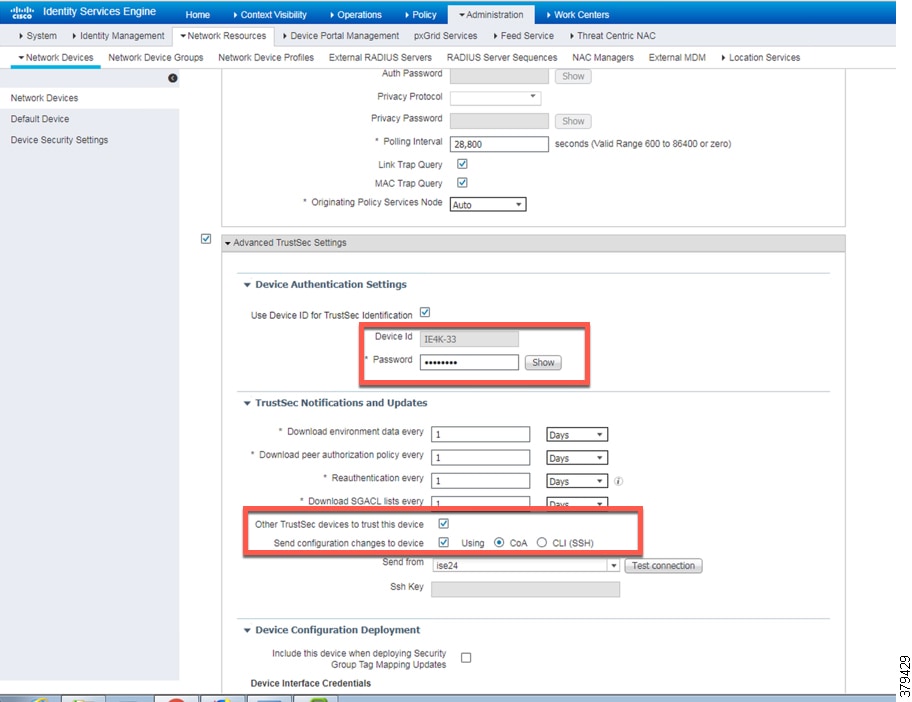
Details must also be configured for TrustSec updates, as shown in CTS Configuration for IES.
Figure 33 CTS Configuration for IES
Configuring SXP in Cisco ISE
This section describes how to enable SXP and configure SXP peers in Cisco ISE.
Enabling SXP Service in Cisco ISE
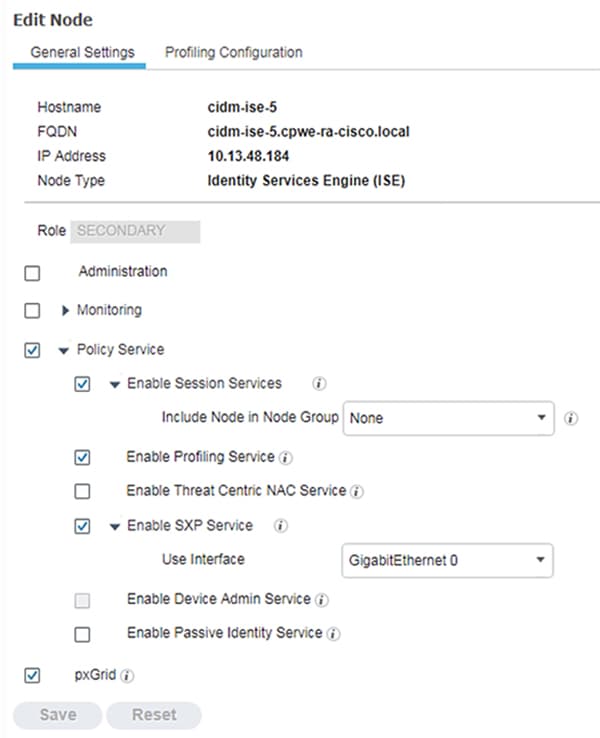
The SXP service must be enabled on the PSN. From the ISE web UI, navigate to Administration -> System -> Deployment. Check the check box for the appropriate PSN and click Edit. Under General Settings, check the Enable SXP Service check box and then click Save.
Figure 34 Enabling SXP Service in Cisco ISE
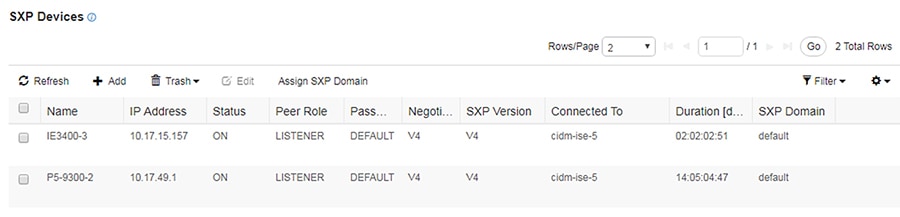
SXP allows ISE and access devices to pass SGT information across networking devices that do not support inline tagging. For the Cell/Area Zone, the distribution switch is configured as the Listener, and Cisco ISE is enabled as a Speaker. To configure SXP, from the ISE web UI navigate to Work Centers —> TrustSec -> SXP.
Figure 35 Configuring SXP Peers in Cisco ISE
Configuring Authentication Policies
802.1x authentication policy involves three parties:
■![]() The supplicant—A client device that wishes to attach to the network.
The supplicant—A client device that wishes to attach to the network.
■![]() The authenticator—A networking device that accepts authentication requests from the client and sends them to the RADIUS authentication server.
The authenticator—A networking device that accepts authentication requests from the client and sends them to the RADIUS authentication server.
■![]() The authentication server—The device that validates a client’s identity and sends back the success or failure RADIUS message.
The authentication server—The device that validates a client’s identity and sends back the success or failure RADIUS message.
In this CVD, the supplicant is the IACS asset, the authenticator is the Cisco IE switch, and the authentication server is an ISE node configured with the Policy Service Node (PSN) persona.
Authentication policies are used to define the protocols used by Cisco ISE to communicate with the IACS assets and the identity sources to be used for authentication. Cisco ISE evaluates the conditionsand applies the respective access. The authentication protocol tested in this CVD s called MAC Authentication Bypass (MAB). MAB uses the MAC address of a device to determine what kind of network access to provide. This protocol is used to authenticate end devices that do not support 802.1x.
For more information about MAB, see: https://www.cisco.com/c/en/us/products/collateral/ios-nx-os-software/identity-based-networking-services/config_guide_c17-663759.html
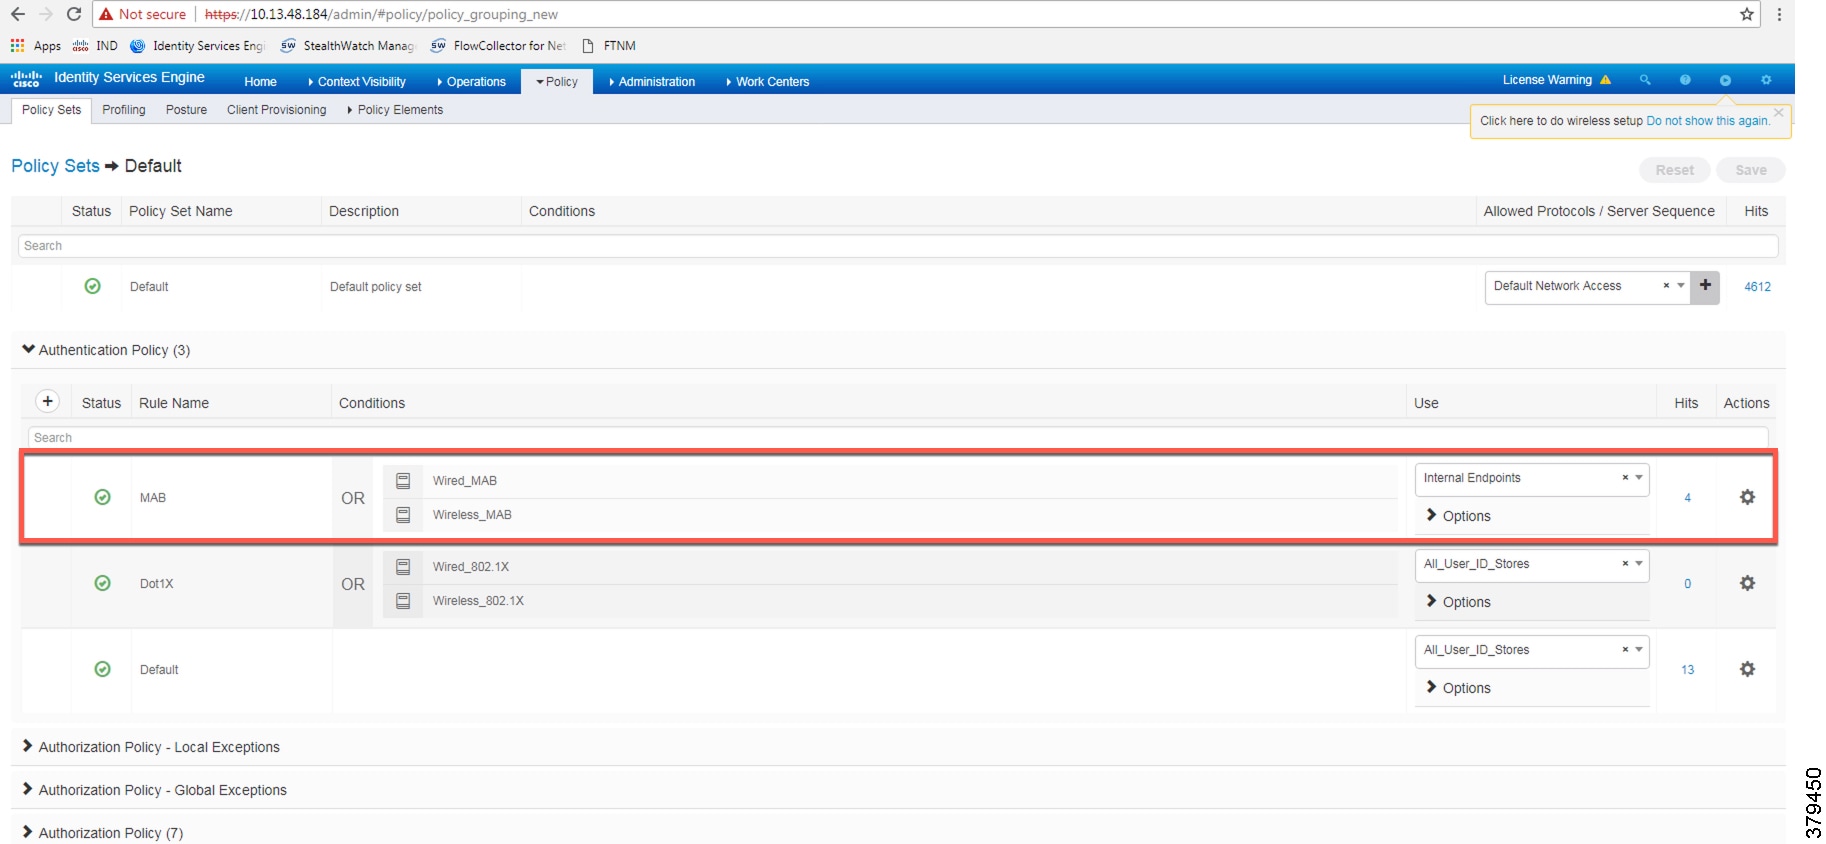
The authentication policy used in the Cisco ISE for this CVD checks wired or wireless MAB is being used and that the endpoint is present in the Internal Endpoints identity store. To configure the authentication policy, navigate to Policy -> Policy Sets. For the Default Policy Set, click the arrow button under the View column, as shown in Figure 38.
Configuring Authorization Policies
Authorization policies are critical to determine what a user or device is allowed to access within the network. Authorization policies are a set of rules. Each rule contains one or more conditions and a set of pre-defined results to be applied when the conditions are met. In ISE, the result of a rule is called an Authorization Profile.
Authorization profiles group the specific permissions granted to a user or a device and can include attributes such as an associated VLAN, Downlloadable ACL, or SGT. This CVD uses SGT to grant permissions to an IACS asset. Configuring TrustSec Policy Matrix describes how the Policy Matrix was designed. When an IACS asset is authenticated it is matched to an authorization policy which assigns the appropriate SGT to the asset. The TrustSec Policy Matrix determines the permissions associated with each SGT. Figure 36 shows the high-level steps when an IACS asset is connected to the network. To configure the authorization policy, navigate to Policy -> Policy Sets. For the Default policy set, click the arrow button in the View column. Click the Authorization Policy button to expand the authorization rules.
Figure 36 AAA for an IACS Asset
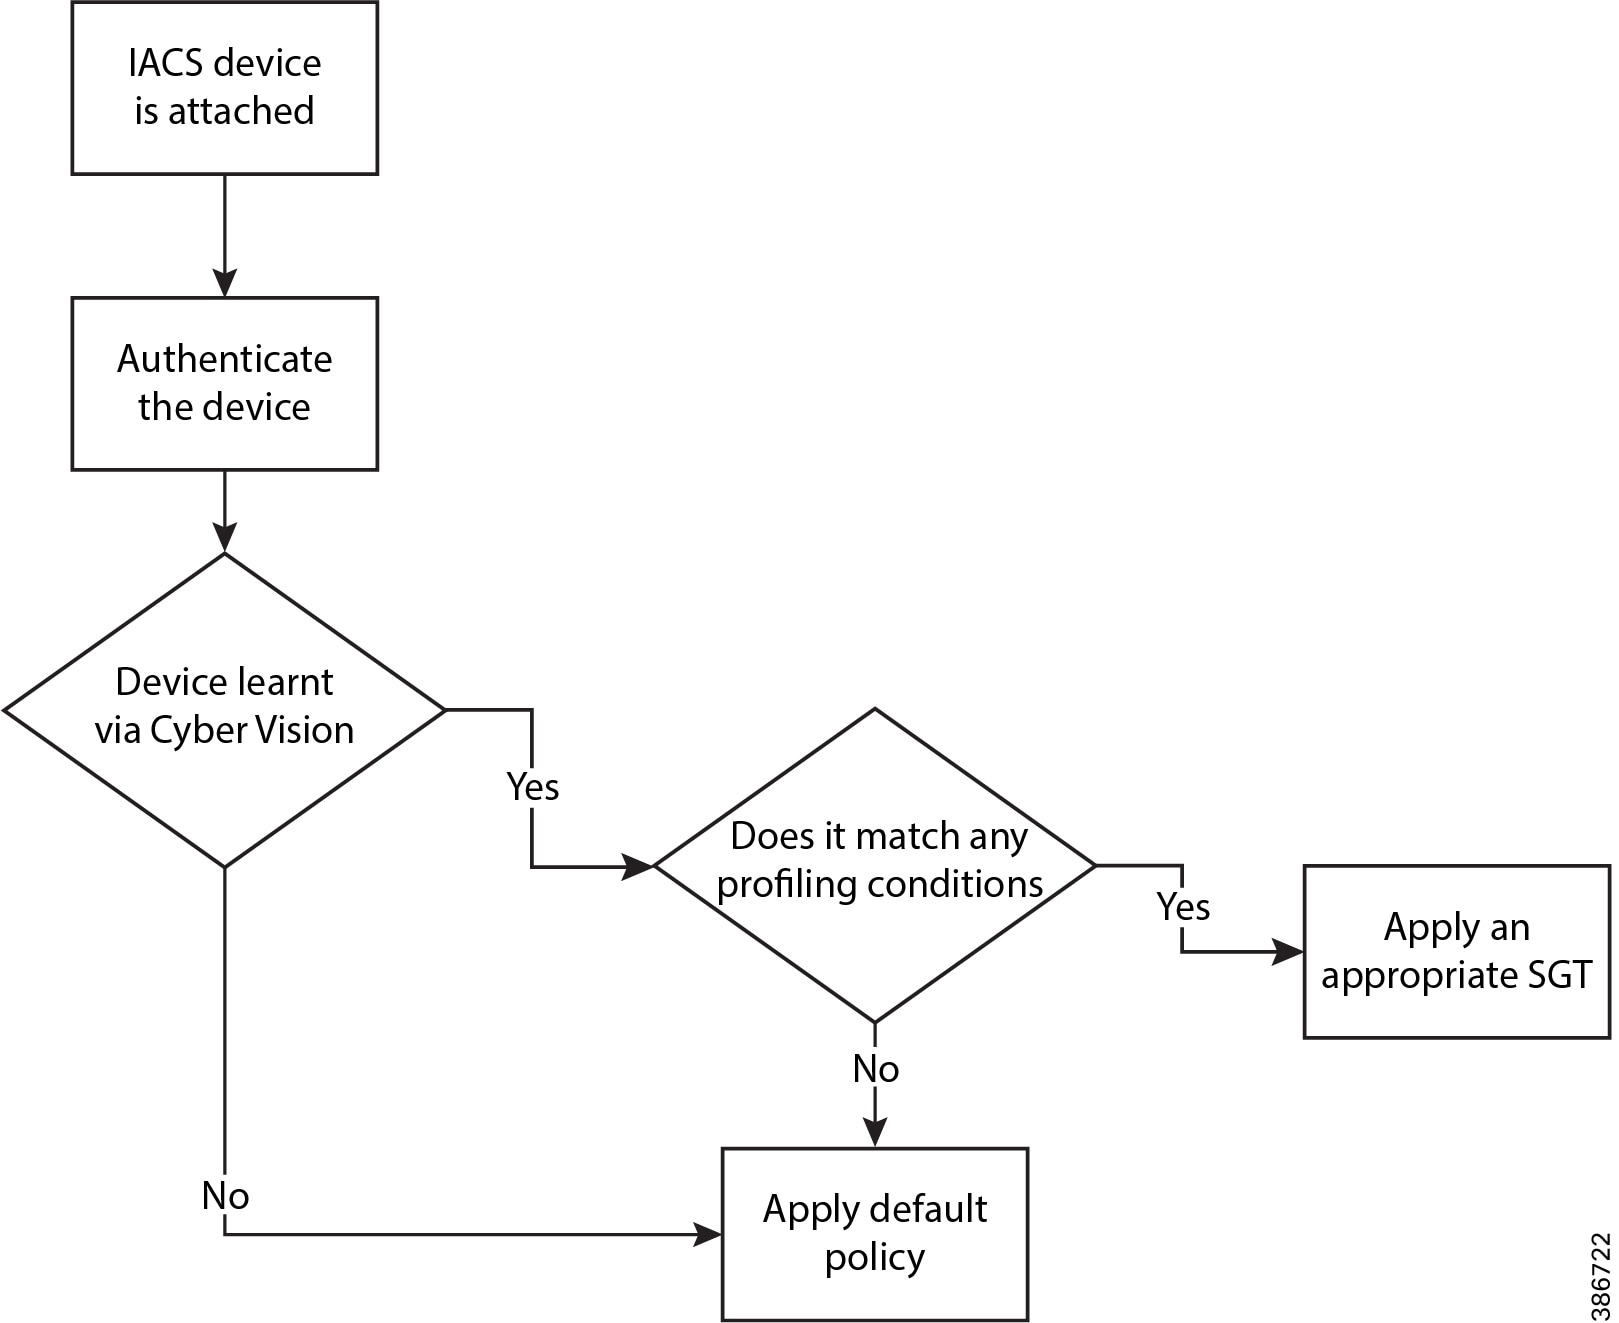
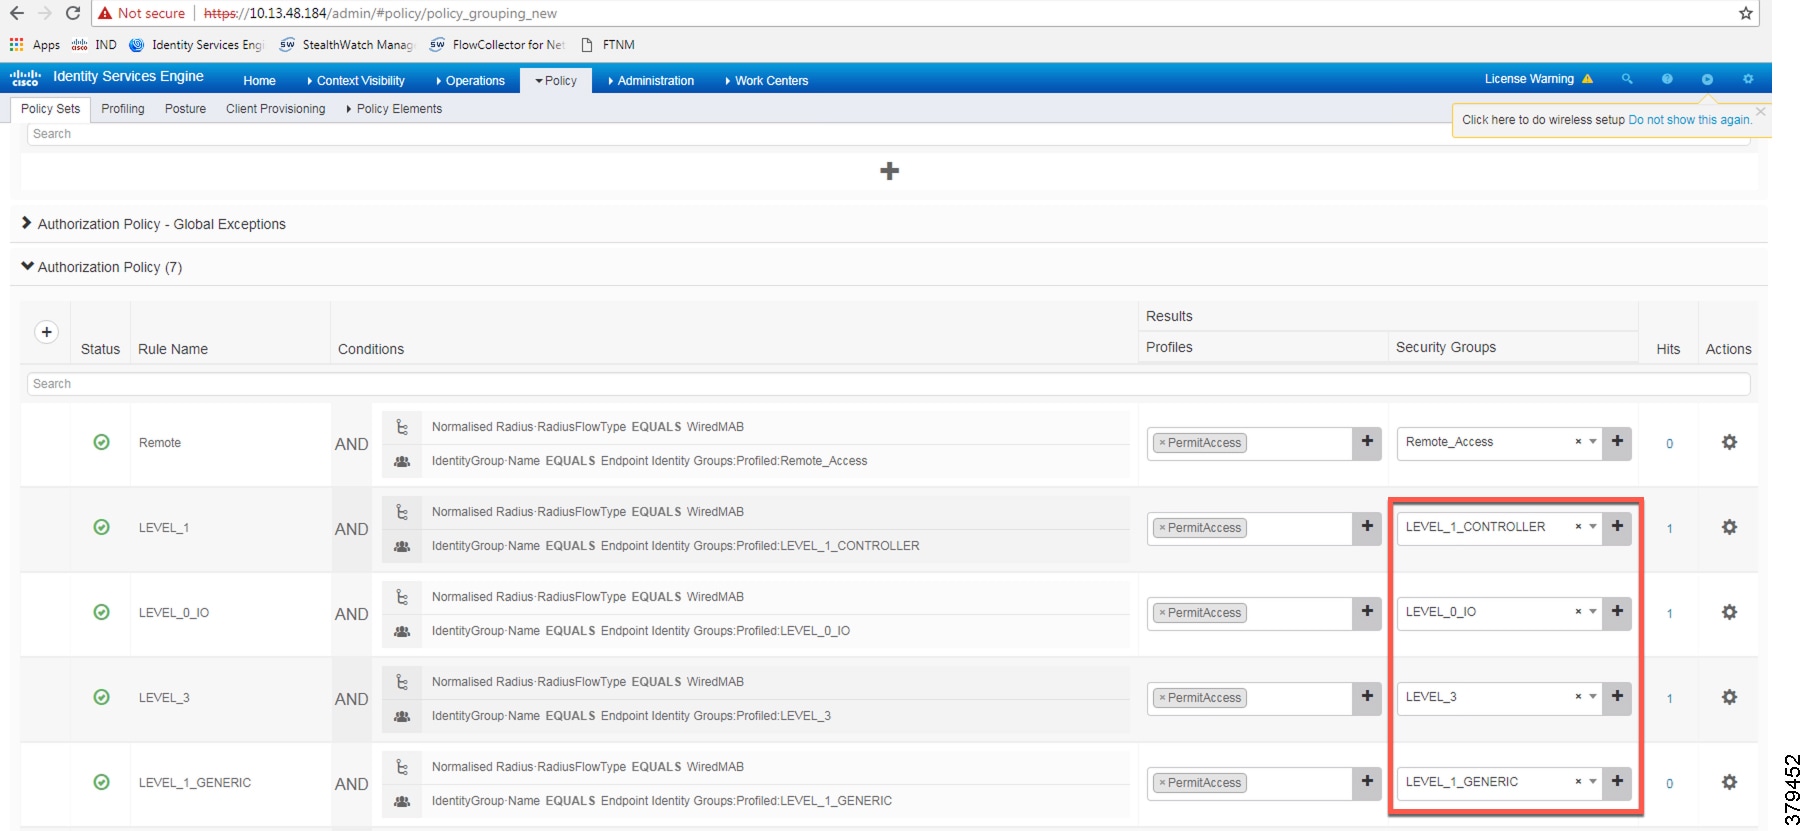
The authorization rules can be tailored to fit varying security policies; much like ACLs, there can be a default rule to apply if no other rules match and that rule can give basic or no access. Figure 37 shows the authorization policies for this CVD.
Figure 37 Authorization Policy Conditions
Note: In the example shown in Figure 39, the default authentication policy set was used. In case the real deployment has a different authentication policy set, then the IT Security Architect must select the correct authentication policy set.
Figure 38 Navigation to Configure Authentication/Authorization Policy
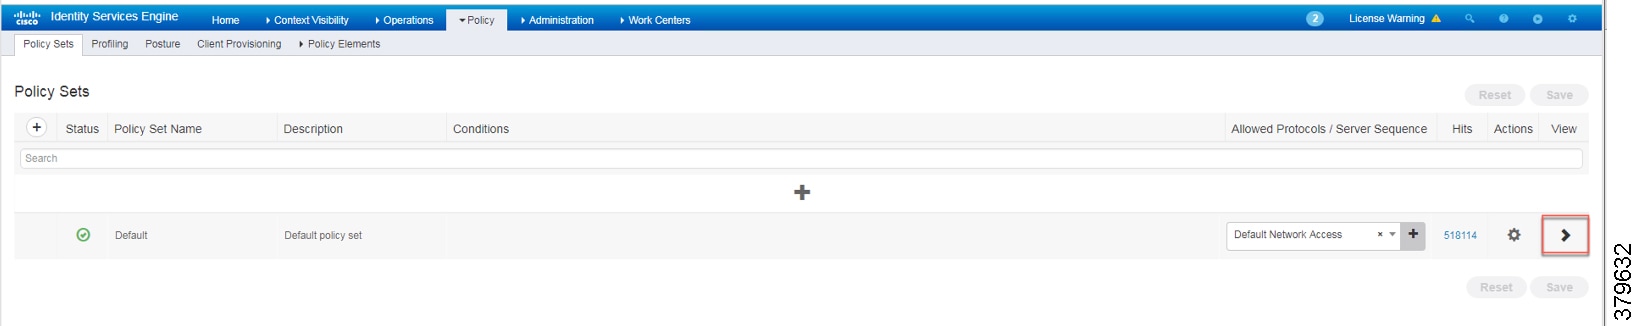
Figure 39 ISE Authentication Policy
Configuring SGT Components
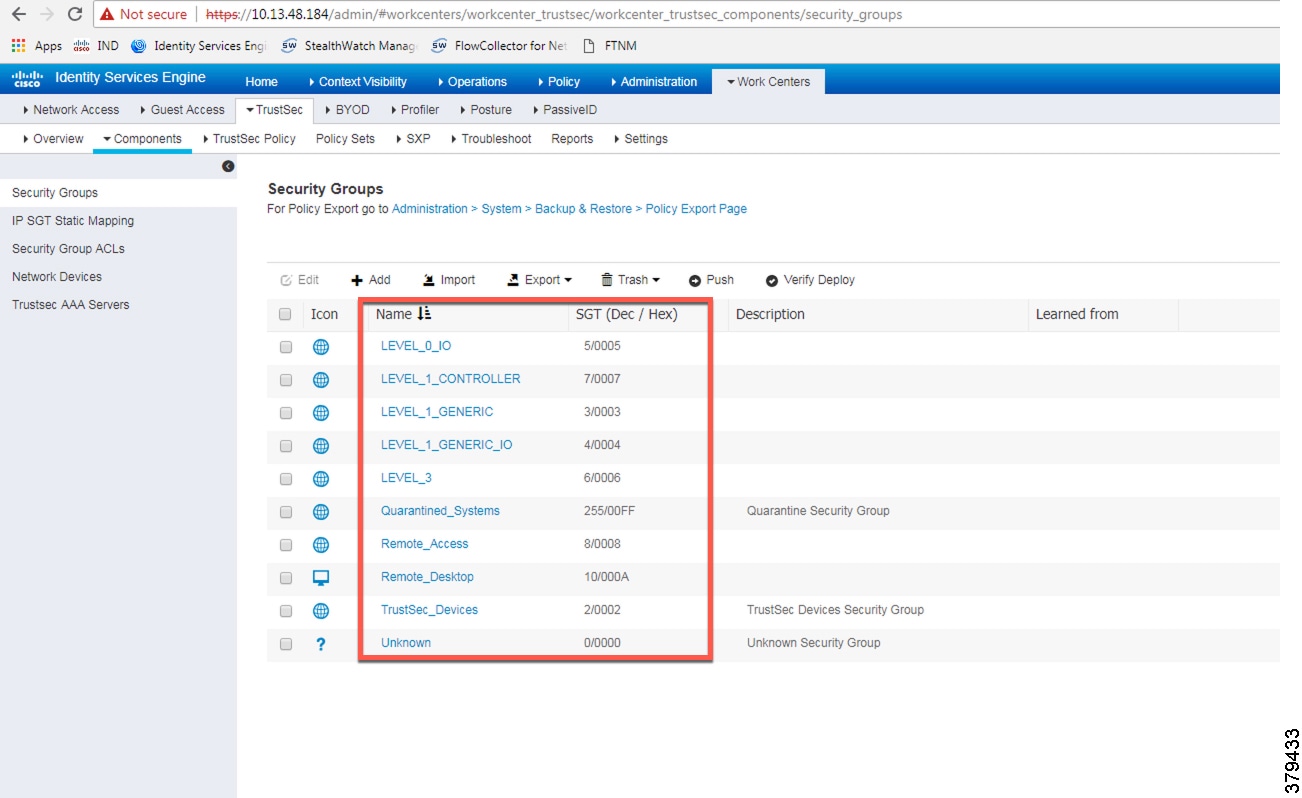
Once an IACS asset is profiled, it is matched to an authorization policy which assigns an SGT to the device. Figure 40 shows an example of SGTs created in Cisco ISE to segment the network, which is located at Work Centers —> TrustSec —> Components.
Figure 40 Configuring SGT Components in Cisco ISE
Configuring TrustSec Policy Matrix
This section describes how to design a policy matrix for Cisco ISE. Based on the example illustrated in Table 3, the following are policy matrix rules:
■![]() IACS assets or any other devices that are assigned with the SGT group of Level_3 are allowed to access all the devices in the plant-wide network.
IACS assets or any other devices that are assigned with the SGT group of Level_3 are allowed to access all the devices in the plant-wide network.
■![]() IACS assets with SGT value of Level_1_Controller are allowed to access only the devices in the same Cell/Area Zone.
IACS assets with SGT value of Level_1_Controller are allowed to access only the devices in the same Cell/Area Zone.
■![]() IACS assets with SGT value of Level_0_IO are allowed to access only the devices in the same Cell/Area Zone.
IACS assets with SGT value of Level_0_IO are allowed to access only the devices in the same Cell/Area Zone.
■![]() IACS assets with Remote_Access are allowed to communicate with another device assigned with SGT value of Remote_Desktop and Level_3 (because Level_3 has access to all the devices).
IACS assets with Remote_Access are allowed to communicate with another device assigned with SGT value of Remote_Desktop and Level_3 (because Level_3 has access to all the devices).
Figure 41 shows the TrustSec Access Policy Matrix.
Figure 41 TrustSec Access Policy Matrix
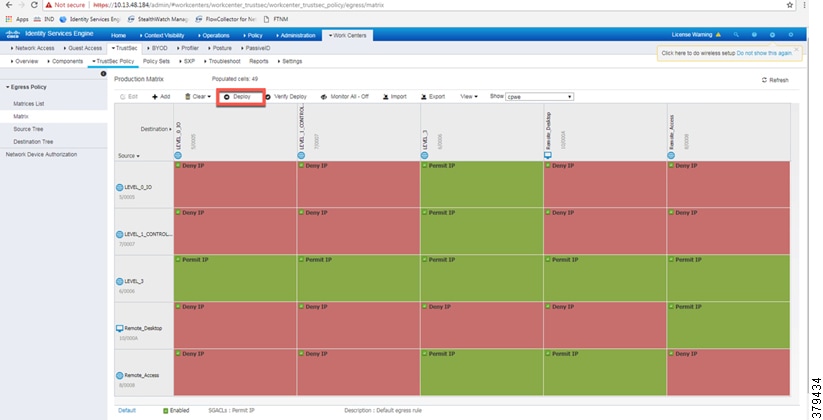
As shown in Figure 41, a Level_3 controller is allowed to communicate with all the IACS assets, however Level_1_Controller and Level_0_IO can only communicate if they are present in the same Cell/Area Zone. After defining the TrustSec Policy in the ISE, it is downloaded to all networking devices by clicking Deploy, as shown in Figure 41.
Access Level Switch Configuration
This section provides the configuration details for the Cisco IE switches in the Cell/Area Zone. The configuration of key features, such as TrustSec, NetFlow, and RADIUS, are described below.
Configuring RADIUS AAA
Each switch must be configured to communicate with the Cisco ISE AAA server for authorizing IoT devices, users, and other systems. The AAA server shown in this configuration is pointing to the ISE PSN. The following configurations are performed via the switch CLI.
1.![]() In configuration mode, designate the switch source interface or VLAN that will be used to communicate with the ISE PSN.
In configuration mode, designate the switch source interface or VLAN that will be used to communicate with the ISE PSN.
2.![]() Configure AAA parameters and the AAA group name.
Configure AAA parameters and the AAA group name.
3.![]() Configure Change of Authorization (CoA):
Configure Change of Authorization (CoA):
Note: This configuration must match the configuration done on Cisco ISE. Refer to Figure 37.
4.![]() Configure the RADIUS server for TrustSec. The list name should be tied to the aaa authorization network command shown in Step 2:
Configure the RADIUS server for TrustSec. The list name should be tied to the aaa authorization network command shown in Step 2:
5.![]() Configure the following RADIUS server attributes:
Configure the following RADIUS server attributes:
6.![]() Configure the RADIUS server, IP address, and shared secret that was entered in Cisco ISE:
Configure the RADIUS server, IP address, and shared secret that was entered in Cisco ISE:
7.![]() Globally enable port-based authentication:
Globally enable port-based authentication:
Configuring Port-based Authentication
On the access switch, the following configurations enable port-based authentication. Configure each interface that will have an endpoint device connected. For MAB and Dot1x methods to co-exist and function as expected, the order and priority must be properly specified as referenced in this application note Configuring MAB:
http://www.cisco.com/c/en/us/products/collateral/ios-nx-os-software/identity-based-networking-service/application_note_c27-573287.html
In this CVD, the authentication open command was applied to the port to ensure that the device remains connected even if the port is unable to authenticate to the RADIUS server.
Configuring SDM Templates
SDM templates will allow an OT control system engineer to prioritize resources for different features enabled on an IE switch. In this CVD, the routing template is required to support SGT assignment.
Configuring CTS Credentials
Specify the Cisco TrustSec device ID and password for the switch to use when authenticating with Cisco ISE and establishing the PAC file. This password and ID must match the Cisco ISE Network Devices configuration for the respective switch.
Configuring NetFlow
The NetFlow configuration has three components: Flow Record, Flow Exporter, and Flow Monitor. After the three components (explained below) have been configured, the Flow Monitor is applied to a physical interface.
Flow Record
A Flow Record defines the information that will be gathered by the NetFlow process, such as packets in the flow and the types of counters gathered per flow. Custom flow records specify a series of match and collect commands that the switch includes in the outgoing NetFlow record.
The match fields are the key fields, meaning that they are used to determine the uniqueness of the flow. The collect fields are extra information that is included in the record in order to provide more detail to the collector for reporting and analysis. When a Flow Record is defined, all of the flow data traffic that enters (ingress) or leaves (egress) the device is captured.
This configuration example includes required as well as optional flow record fields needed by Stealthwatch.
Flow Exporter
The Flow Exporter defines where and how to send the NetFlow records. The Exporter configuration defines a recipient IP address and port; in this CVD the Stealthwatch Flow Collector is the destination.
Flow Monitor
A Flow Monitor defines the NetFlow cache timeout parameters, as well as linking the Flow Record with the Flow Exporter. As network traffic traverses the Cisco device, flows are continuously created and tracked. As the flows expire, they are exported from the NetFlow cache to the Stealthwatch Flow Collector. A flow is ready for export when it is inactive for a certain time (for example, no new packets received for the flow) or if the flow is long-lived (active) and lasts greater than the active timer (for example, long FTP download and standard CIP I/O connections).
1.![]() Configure the Flow Monitor:
Configure the Flow Monitor:
2.![]() Once the flow monitor has been created, it can be applied to switch interfaces. In this example we apply the Flow Monitor on the ingress traffic, as denoted by the input keyword:
Once the flow monitor has been created, it can be applied to switch interfaces. In this example we apply the Flow Monitor on the ingress traffic, as denoted by the input keyword:
Configuring Distribution Switch—Cisco Catalyst 9300
As described in the design guide, TrustSec enforcement is applied at the distribution switch (Catalyst 9300). The RADIUS and CTS configurations for the Catalyst 9300 follow the same guidelines as the IE switch configurations. Three additional TrustSec features are required for the distribution switch:
Configuring IPDT
On the Cisco Catalyst 9300, the device tracking feature must be enabled, a device tracking policy must be created, and this policy must be applied to the interface where the IP device tracking needs to be enabled. In this CVD, IP device tracking is enabled on interfaces connected to access switches.
Configuring SXP Tunnel
The SXP tunnel between the distribution switch and ISE must be established to populate the distribution switch with endpoint SGT information for enforcement.
Enforcement
To enable policy enforcement, enter the following commands:
Cisco Cyber Vision Center Configuration
Installation
For this implementation, the Cisco Cyber Vision Center was deployed as a VM in the Level 3 Site Operations Zone. For VM installation instructions refer to:
https://www.cisco.com/c/dam/en/us/td/docs/security/cyber_vision/Cisco_Cyber_Vision_Center_VM_Installation_Guide_Release_3_0_1.pdf.
Cisco Cyber Vision Center Interfaces
The Cisco Cyber Vision Center system has two interfaces: eth0 and eth1. Eth0 is used for web UI access as well as pxGrid communication. Eth1 is used for Cisco Cyber Vision Sensor communication. Therefore, appropriate network settings should be configured to suit these communication schemes. Please refer to the installation guide for the configuration of these interfaces.
Joining Sensors to Cisco Cyber Vision Center
The Cisco Cyber Vision Sensors provide all of the monitored traffic to the Cisco Cyber Vision Center for user analysis, and they securely communicate with the Cisco Cyber Vision Center using trusted certificates. To connect the Cisco Cyber Vision Sensors to the Cisco Cyber Vision Center, do the following:
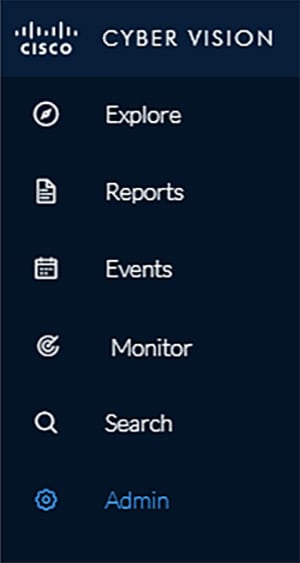
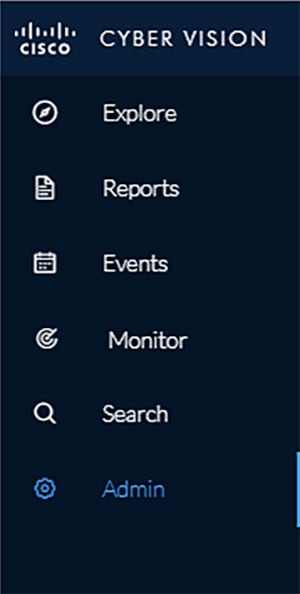
1.![]() From the Cisco Cyber Vision Center web UI, choose Admin on the left menu pane.
From the Cisco Cyber Vision Center web UI, choose Admin on the left menu pane.
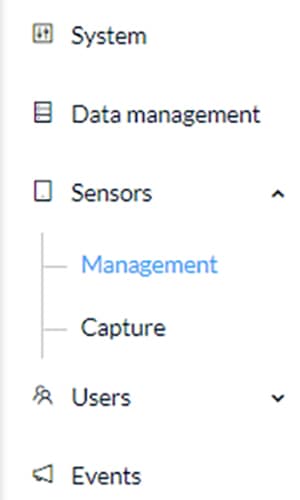
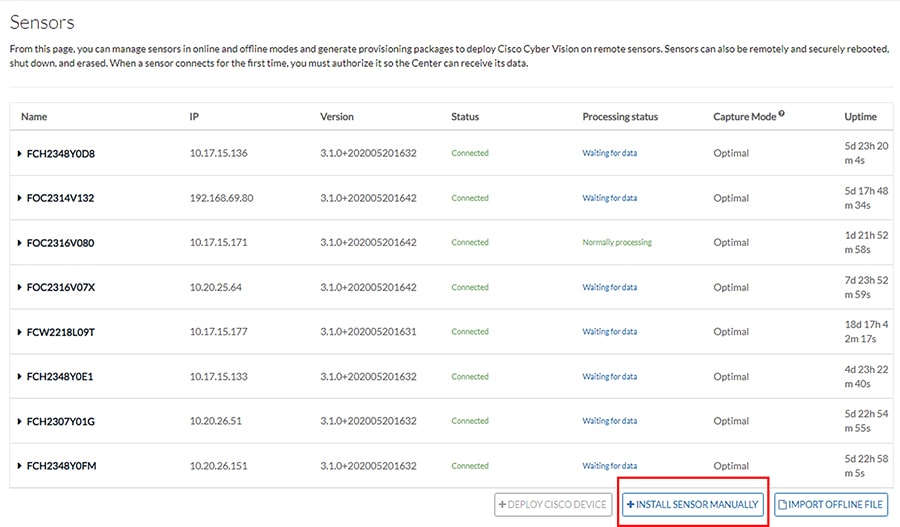
2.![]() Choose Sensors from the Admin menu. By default, it will load the Management page.
Choose Sensors from the Admin menu. By default, it will load the Management page.
3.![]() Click the Install Sensor Manually button at the bottom of the Sensors list.
Click the Install Sensor Manually button at the bottom of the Sensors list.
4.![]() Select a hardware model from the Hardware Model drop-down list. The resulting configuration options will be different for each device type.
Select a hardware model from the Hardware Model drop-down list. The resulting configuration options will be different for each device type.
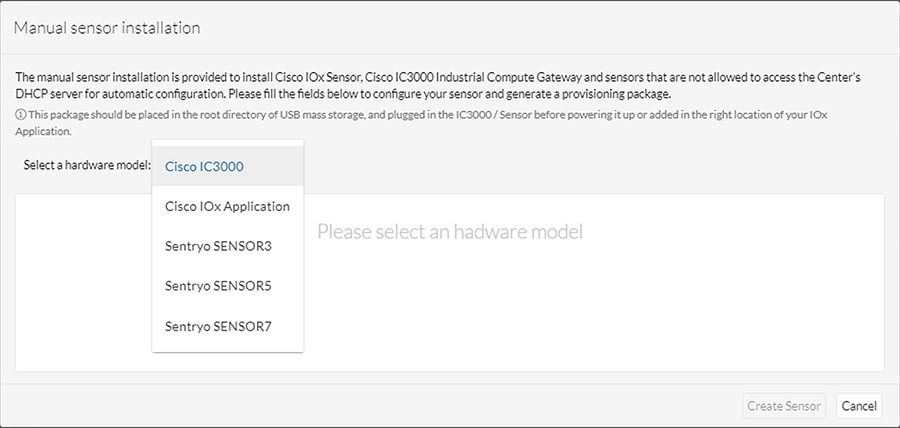
5.![]() Enter the required information, such as serial number, IP address of the Cisco Cyber Vision Center for the Cisco Cyber Vision Sensor to use, and so on. The IC3000 will require network configuration for both the IC3000 Local Manager and the Cisco Cyber Vision Sensor application.
Enter the required information, such as serial number, IP address of the Cisco Cyber Vision Center for the Cisco Cyber Vision Sensor to use, and so on. The IC3000 will require network configuration for both the IC3000 Local Manager and the Cisco Cyber Vision Sensor application.
6.![]() After entering the details, click the Create Sensor button.
After entering the details, click the Create Sensor button.
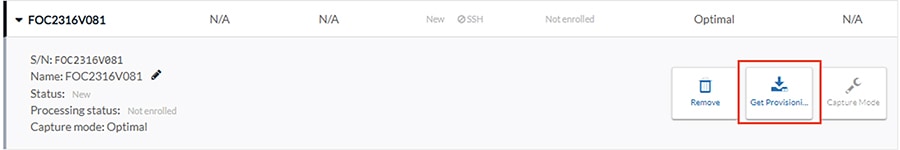
7.![]() On the Sensors page, click the newly created sensor to expand for more details. Click the Get Provisioning Package button to download the zipped files to be used in configuring the sensor. This package includes certificate, password, network, and other configuration details.
On the Sensors page, click the newly created sensor to expand for more details. Click the Get Provisioning Package button to download the zipped files to be used in configuring the sensor. This package includes certificate, password, network, and other configuration details.
8.![]() Once subsequent sensor installation procedures are complete, the Status column on the Sensors page will show the newly installed sensor as “Connected”.
Once subsequent sensor installation procedures are complete, the Status column on the Sensors page will show the newly installed sensor as “Connected”.
Configuring Presets
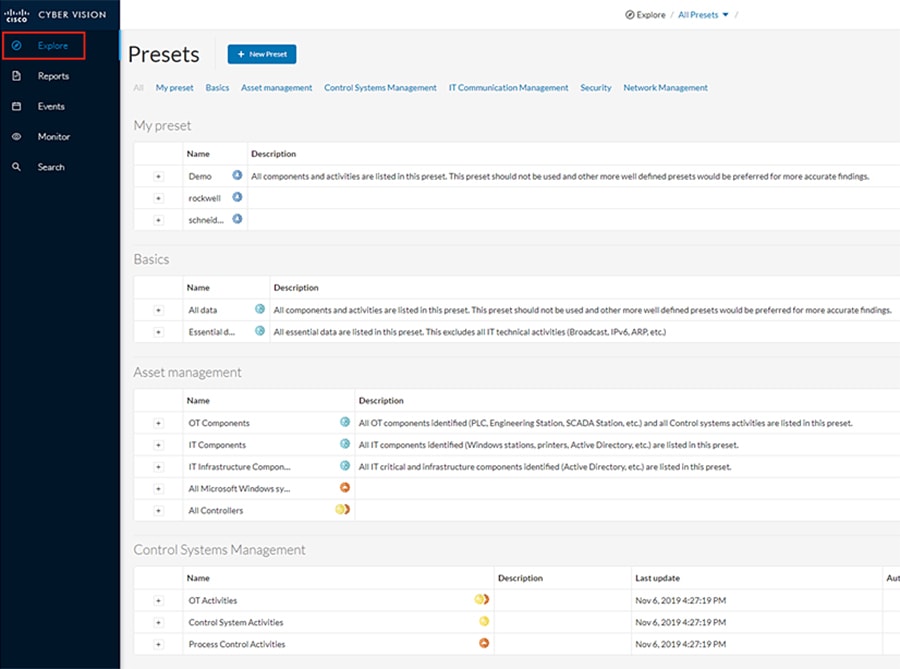
Presets allow the user to customize how components are displayed and grouped. In addition, the presets allow the user to quickly navigate to device activity, vulnerability, and event information. The Cisco Cyber Vision Center comes with default presets, such as Control Systems Management, but the user can create their own by doing the following:
1.![]() Choose Explore in the left menu pane to display all of the current presets:
Choose Explore in the left menu pane to display all of the current presets:
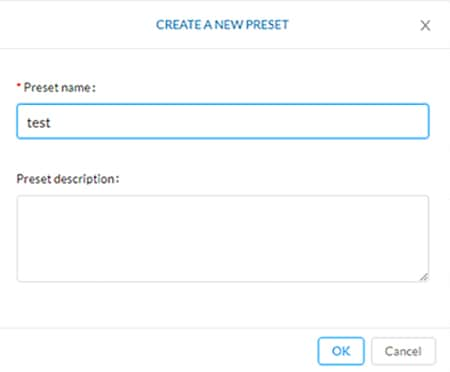
2.![]() At the top, click the New Preset button. Provide a name and an optional description:
At the top, click the New Preset button. Provide a name and an optional description:
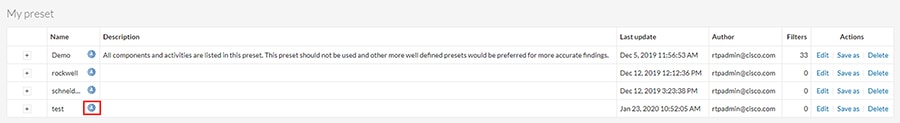
3.![]() The new preset will now show in the My preset list. Click the
The new preset will now show in the My preset list. Click the  icon next to the preset name to configure the preset options:
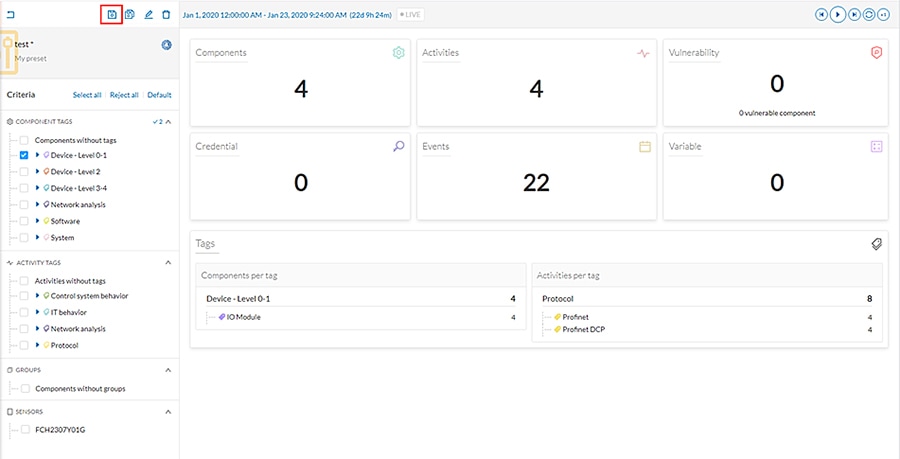
4.![]() Select desired preset criteria and click the
Select desired preset criteria and click the  icon above the preset name to save the changes:
Viewing Assets
As described in the previous section, Presets allow the user to view specific components and their details based on saved filters. To view a list of assets from a Preset, do the following:
1.![]() Choose Explore in the left menu pane to display all of the current presets.
Choose Explore in the left menu pane to display all of the current presets.
2.![]() Click the name of the desired Preset.
Click the name of the desired Preset.
3.![]() From the Dashboard pane, click the Components button.
From the Dashboard pane, click the Components button.
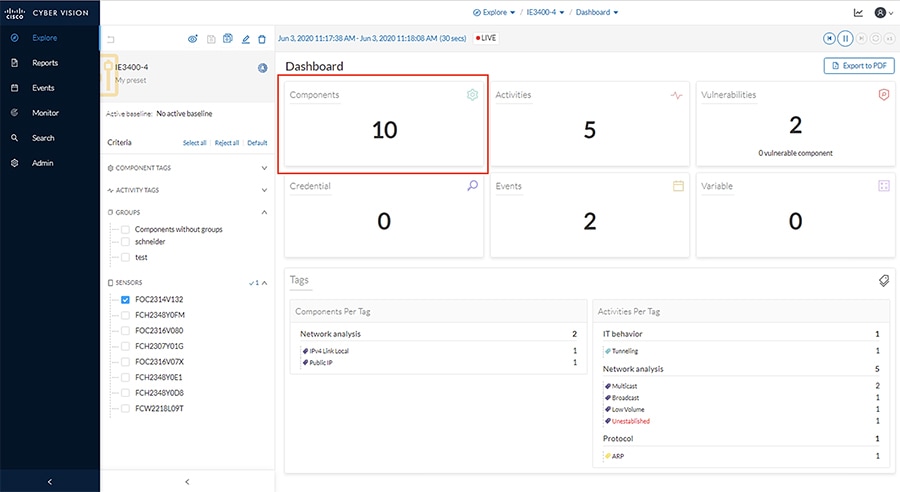
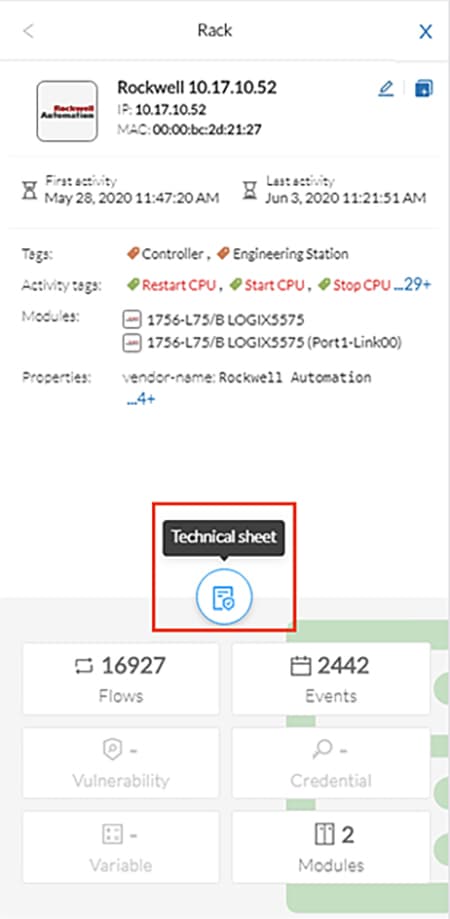
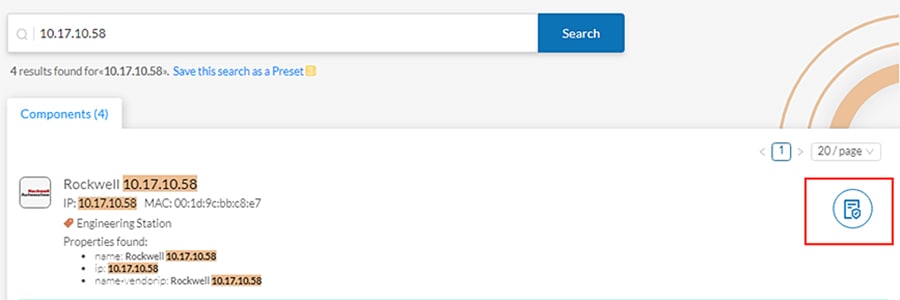
4.![]() The list of components matching the Preset criteria will be displayed in a list. Clicking one of the components will load a pane on the right displaying more details.
The list of components matching the Preset criteria will be displayed in a list. Clicking one of the components will load a pane on the right displaying more details.
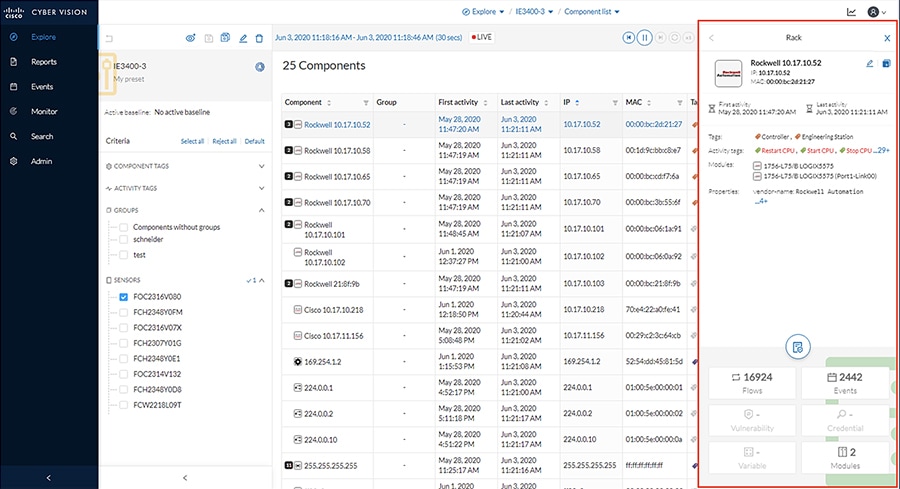
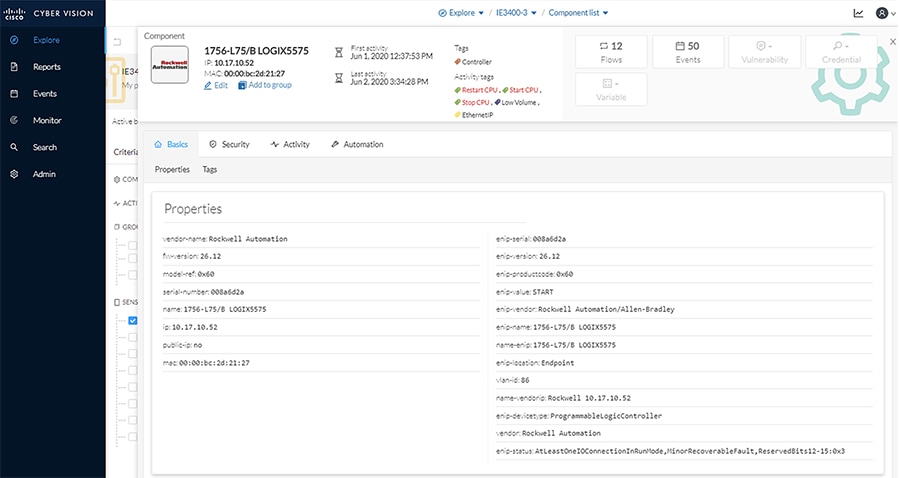
5.![]() Click the Technical Sheet icon to give asset attributes such as vendor, model, device type, and more.
Click the Technical Sheet icon to give asset attributes such as vendor, model, device type, and more.
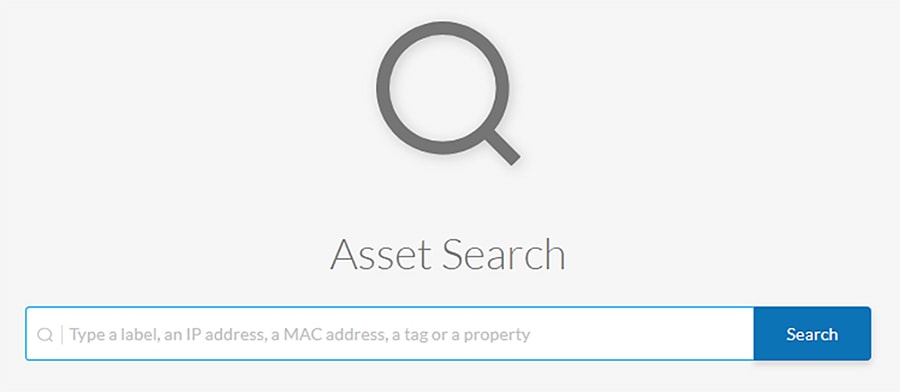
The Search option on the left pane can also be used to display component details.
1.![]() In the Asset Search field, enter an IP address, MAC address, or other device attribute.
In the Asset Search field, enter an IP address, MAC address, or other device attribute.
2.![]() By hovering over the desired result, the Technical Sheet icon appears on the right. Click the icon to view the asset details.
By hovering over the desired result, the Technical Sheet icon appears on the right. Click the icon to view the asset details.
Viewing Asset Activity
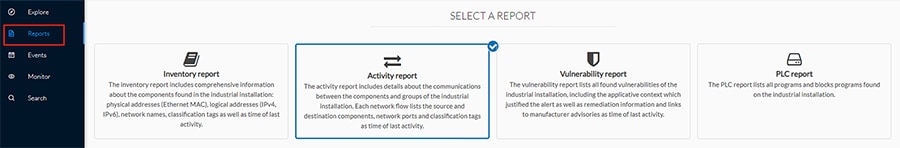
Asset activity can be viewed in two ways: Reports and Presets.
An activity report includes asset flow information, highlighting communication between devices with details such as IP addresses, ports, and tags. To view an activity report, do the following:
1.![]() Click the Reports option in the left menu pane, and click the Activity report button:
Click the Reports option in the left menu pane, and click the Activity report button:
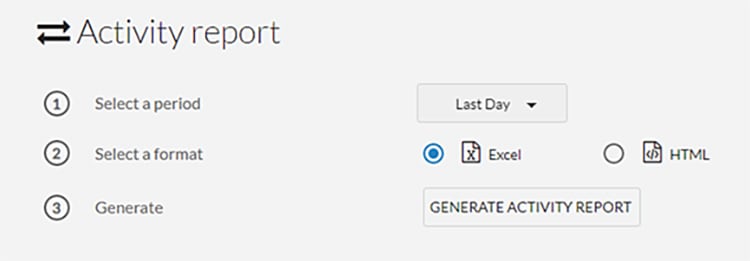
2.![]() Choose a time range for the activity and select an output format:
Choose a time range for the activity and select an output format:
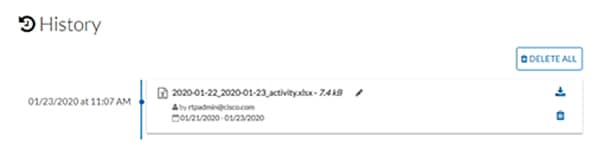
3.![]() The generated report will show in the History pane for the user to download
The generated report will show in the History pane for the user to download
The second way to view activity is to use Presets, which allows the user to look at specific assets. To view activity for a particular device or all devices in a Preset, do the following:
1.![]() Click the Explore option in the left menu pane to display all of the current Presets. Click the
Click the Explore option in the left menu pane to display all of the current Presets. Click the  icon next to the desired Preset name. To view activity for all devices included in the Preset, click the Activities button:
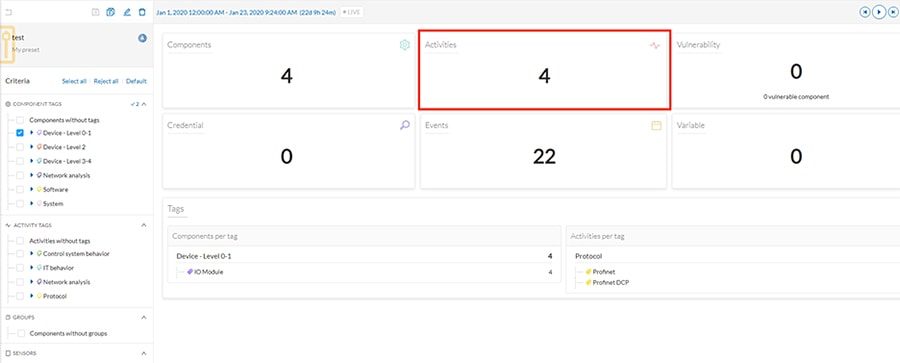
2.![]() A table will be displayed showing the communication flows between devices, including time frames and any events associated with the communication.
A table will be displayed showing the communication flows between devices, including time frames and any events associated with the communication.
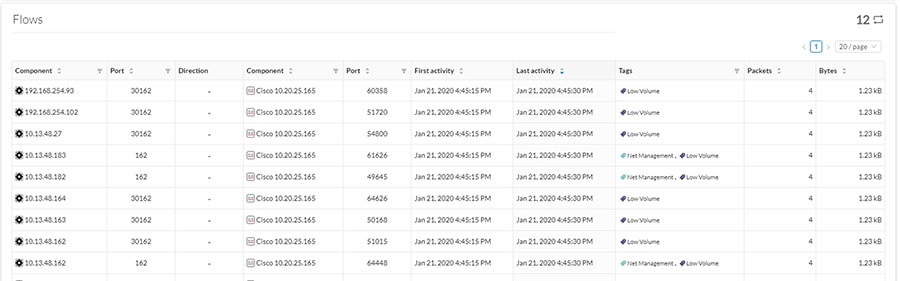
3.![]() Alternatively, clicking the Components button in the preset window will display all devices included in that preset. Select a component and choose the Flows button in the pane on the right:
Alternatively, clicking the Components button in the preset window will display all devices included in that preset. Select a component and choose the Flows button in the pane on the right:
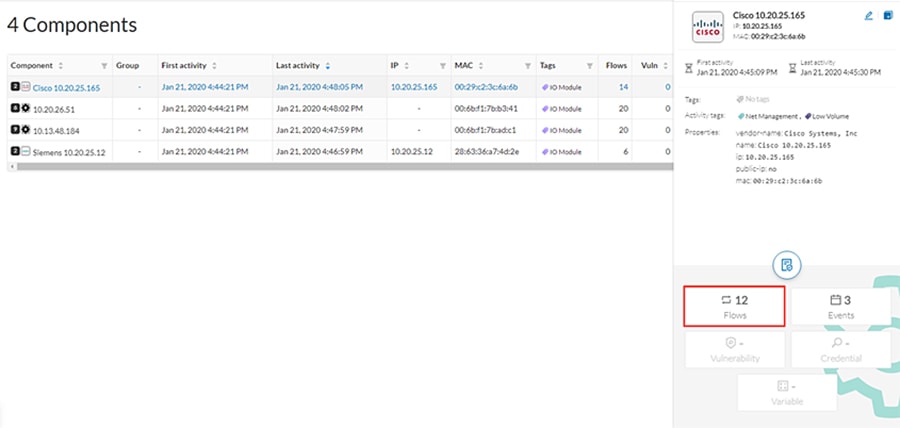
4.![]() A table showing the activity information will be displayed:
A table showing the activity information will be displayed:
Performing a Packet Capture on a Sensor
The packet capture feature is useful for both troubleshooting data propagation issues and retrieving underlying details of network communications for investigation purposes. To perform a packet capture on a Cisco Cyber Vision Sensor, do the following:
1.![]() From the Cisco Cyber Vision Center web UI, choose Admin on the left menu pane.
From the Cisco Cyber Vision Center web UI, choose Admin on the left menu pane.
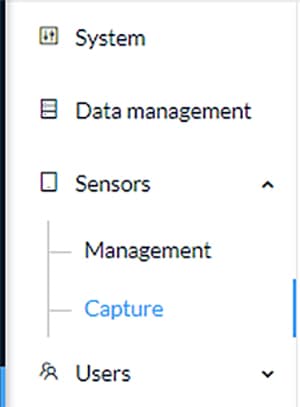
2.![]() Choose Sensors from the Admin menu, then choose Capture from the submenu.
Choose Sensors from the Admin menu, then choose Capture from the submenu.
3.![]() Click the Start Recording link for the desired sensor.
Click the Start Recording link for the desired sensor.

While it is recording, the Status column indicates the recording activity with a red icon.
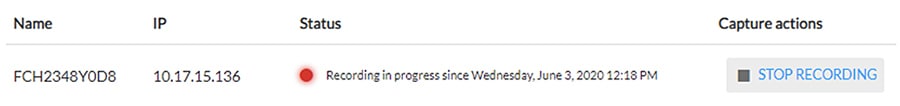
4.![]() Click the Stop Recording link in the Capture Actions column after the desired amount of time has elapsed.
Click the Stop Recording link in the Capture Actions column after the desired amount of time has elapsed.
5.![]() A Download link will appear for the desired sensor. Clicking this link will initiate download of the packet capture file.
A Download link will appear for the desired sensor. Clicking this link will initiate download of the packet capture file.

Integrating Cisco Cyber Vision Center with Cisco ISE pxGrid
Cisco Cyber Vision Center can share several asset details with ISE using the pxGrid feature. These attributes provide context for more accurate profiling of devices, which further enhances the TrustSec scheme in the architecture. Cisco Cyber Vision Center and ISE communicate securely by exchanging certificates. To configure the pxGrid connection, do the following:
Enable pxGrid in ISE
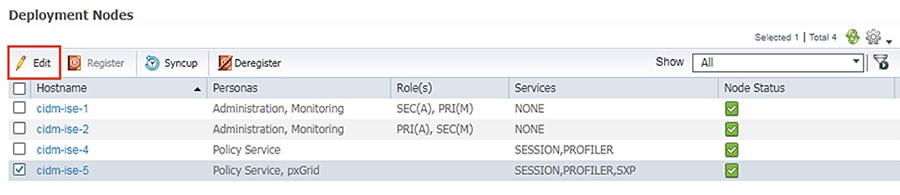
1.![]() In the ISE web UI, navigate to Administration -> System -> Deployment. Check the box next to the appropriate PSN and click the Edit button.
In the ISE web UI, navigate to Administration -> System -> Deployment. Check the box next to the appropriate PSN and click the Edit button.
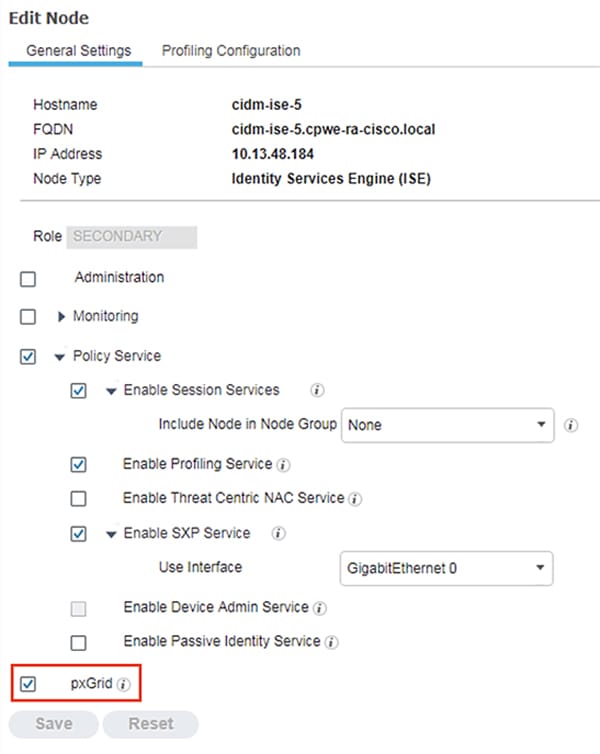
2.![]() Under the General Settings tab, check the pxGrid checkbox.
Under the General Settings tab, check the pxGrid checkbox.
3.![]() Under the Profiling Configuration tab, check the pxGrid checkbox.
Under the Profiling Configuration tab, check the pxGrid checkbox.
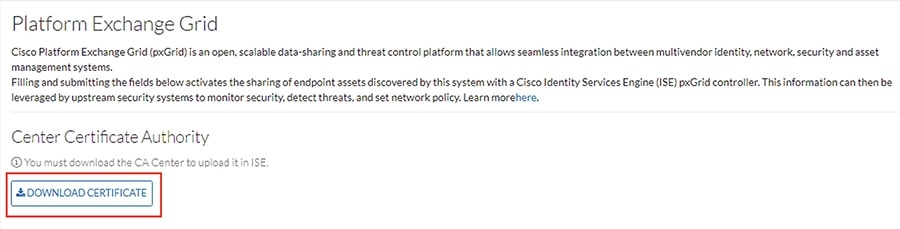
Download the Cisco Cyber Vision Center Certificate
1.![]() From the Cisco Cyber Vision Center web UI, choose Admin on the left menu pane.
From the Cisco Cyber Vision Center web UI, choose Admin on the left menu pane.
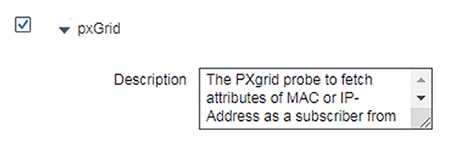
2.![]() Choose PxGrid from the Admin menu.
Choose PxGrid from the Admin menu.
3.![]() Click the Download Certificate button.
Click the Download Certificate button.
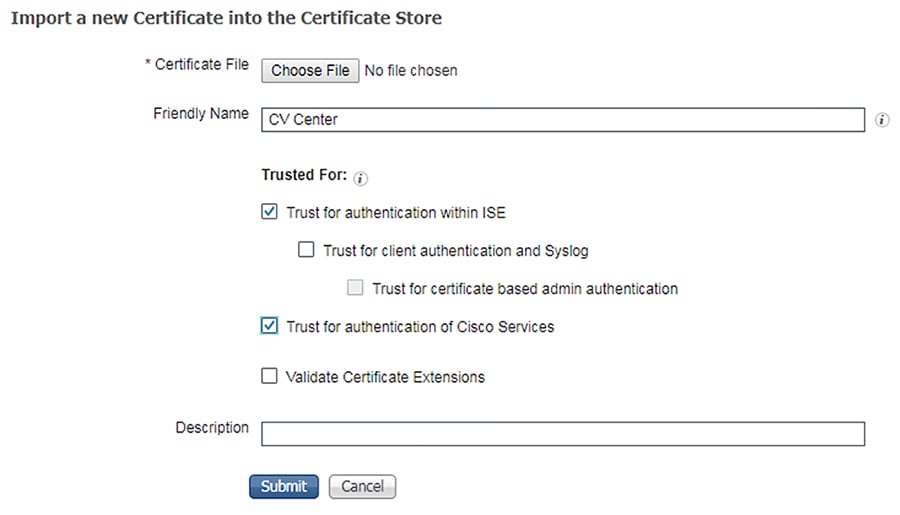
Import the Cisco Cyber Vision Center Certificate into ISE
1.![]() In the ISE web UI, navigate to Administration -> System -> Certificates -> Trusted Certificates.
In the ISE web UI, navigate to Administration -> System -> Certificates -> Trusted Certificates.

3.![]() Click the Choose File button to upload the Cisco Cyber Vision Center certificate.
Click the Choose File button to upload the Cisco Cyber Vision Center certificate.
4.![]() Enter a Friendly Name if desired, and check the Trust for authentication within ISE and Trust for authentication of Cisco Services check boxes. Click the Submit button when finished.
Enter a Friendly Name if desired, and check the Trust for authentication within ISE and Trust for authentication of Cisco Services check boxes. Click the Submit button when finished.
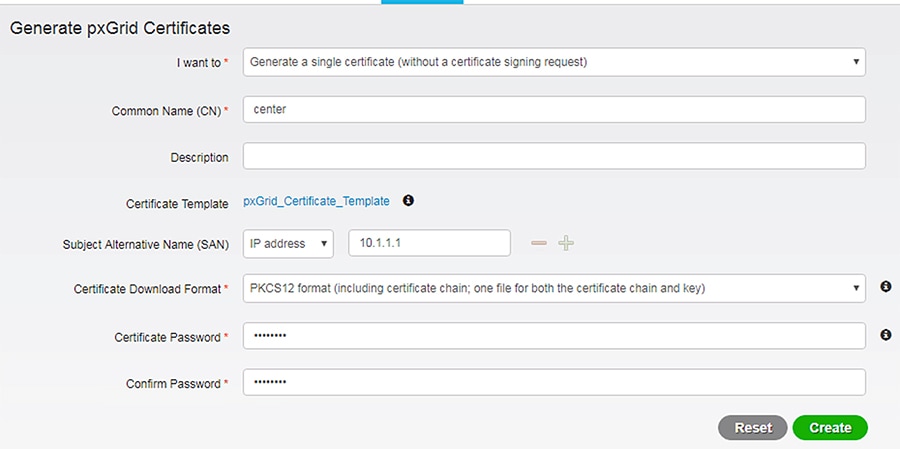
Generate a pxGrid Certificate for Cisco Cyber Vision Center
1.![]() In the ISE web UI, navigate to Administration -> pxGrid Services -> Certificates.
In the ISE web UI, navigate to Administration -> pxGrid Services -> Certificates.
2.![]() From the I want to drop-down list, choose Generate a single certificate (without a certificate signing request).
From the I want to drop-down list, choose Generate a single certificate (without a certificate signing request).
3.![]() In the Common Name (CN) field, enter a name to indicate this certificate is used for Cisco Cyber Vision Center.
In the Common Name (CN) field, enter a name to indicate this certificate is used for Cisco Cyber Vision Center.
4.![]() From the Subject Alternative (SAN) drop-down list, choose IP address and enter the Cisco Cyber Vision Center IP address in the field to the right.
From the Subject Alternative (SAN) drop-down list, choose IP address and enter the Cisco Cyber Vision Center IP address in the field to the right.
5.![]() From the Certificate Download Format drop-down list, choose PKCS12 format.
From the Certificate Download Format drop-down list, choose PKCS12 format.
6.![]() Enter a certificate password in the two remaining fields, then click the Create button.
Enter a certificate password in the two remaining fields, then click the Create button.
7.![]() The certificate will automatically download to the user’s system.
The certificate will automatically download to the user’s system.
Configure the pxGrid Connection in Cisco Cyber Vision Center
1.![]() From the Cisco Cyber Vision Center web UI, choose Admin on the left menu pane.
From the Cisco Cyber Vision Center web UI, choose Admin on the left menu pane.
2.![]() Choose PxGrid from the Admin menu.
Choose PxGrid from the Admin menu.
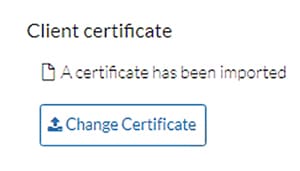
3.![]() Under Client Certificate, click the Change Certificate button, and upload the certificate downloaded from ISE.
Under Client Certificate, click the Change Certificate button, and upload the certificate downloaded from ISE.
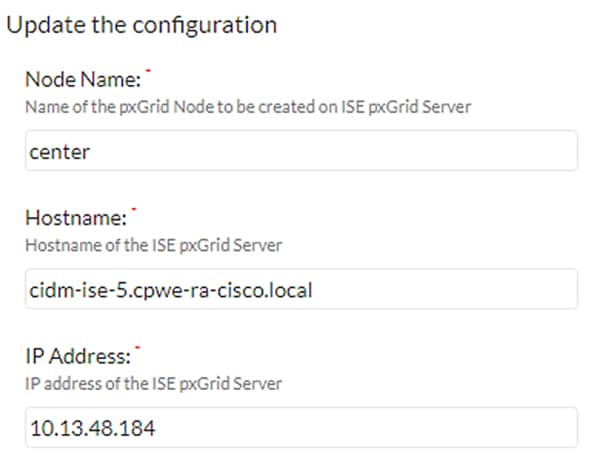
4.![]() In the Node Name field, enter the common name used when generating the pxGrid certificate in ISE.
In the Node Name field, enter the common name used when generating the pxGrid certificate in ISE.
5.![]() In the Hostname field, enter the fully-qualified domain name (FQDN) of the ISE pxGrid server.
In the Hostname field, enter the fully-qualified domain name (FQDN) of the ISE pxGrid server.
6.![]() In the IP Address field, enter the IP address of the ISE pxGrid server.
In the IP Address field, enter the IP address of the ISE pxGrid server.
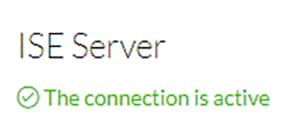
7.![]() Click the Update button. A status message will be displayed on the page.
Click the Update button. A status message will be displayed on the page.
Integrating Cisco Cyber Vision Center with Cisco Stealthwatch
As with the ISE integration, Cisco Cyber Vision Center data can be used to augment Cisco Stealthwatch contextual information. Components in Cisco Cyber Vision Center can be grouped together, which can then be passed to Stealthwatch, forming or updating a Host Group; this integration associates asset IP addresses to intuitive group membership, which helps to accelerate attribution during network traffic analysis and threat investigation.
For more information on the Cisco Cyber Vision Center integration with Stealthwatch, see:
■![]() https://www.cisco.com/c/dam/en/us/products/collateral/security/stealthwatch/at-a-glance-c45-736855.pdf.
https://www.cisco.com/c/dam/en/us/products/collateral/security/stealthwatch/at-a-glance-c45-736855.pdf.
Cisco Cyber Vision Sensor Configuration
The Cisco Cyber Vision Sensor application performs deep packet inspection on network traffic to glean information about devices, software vulnerabilities, traffic protocols, and so on, particularly those of the industrial realm. Several hardware platforms and Cisco IOx software support the Cisco Cyber Vision Sensor application; the Cisco Catalyst 9300 and IE 3400 switches as well as the Industrial Compute 3000 (IC3000) gateway were validated with the Cisco Cyber Vision Sensor in this implementation.
Cisco Cyber Vision Sensor on the IC3000
Data Configuration
The Switched Port Analyzer (SPAN) feature in Cisco IOS sends data to the interface connected to the IC3000. The data from the source interface or VLAN is copied and sent to a destination interface, thus providing a full traffic stream for the IC3000 Cisco Cyber Vision Sensor deep packet inspection. To configure the SPAN on the switch, enter the following commands in enable mode:
Application Installation
Refer to the following for installing the Cisco Cyber Vision Sensor IOx application on the IC 3000:
https://www.cisco.com/c/en/us/td/docs/routers/ic3000/deployment/guide/DeploymentGuide-Cyber.html
Cisco Cyber Vision Sensor on the IE 3400
Data Configuration
The Encapsulated Remote Switched Port Analyzer (ERSPAN) feature in Cisco IOS sends data to the Cisco Cyber Vision Sensor application within the switch. ERSPAN creates copy of specified source traffic from a port or VLAN and sends it to an IP address, making use of generic routing encapsulation (GRE) allowing it to traverse to a remote destination across the Layer 3 network. The Cisco Cyber Vision Sensor interface that captures traffic is given an IP address in order to receive the data sent from the ERSPAN instance on the switch. To configure the ERSPAN on the switch, enter the following commands in enable mode:
The IE 3400 switch requires a 4GB SD card to be used for IOx applications. To format the SD card, enter the following command in enable mode:
To enable IOx, enter the following commands in enable mode:
The Cisco Cyber Vision Sensor application communicates over IP to the Cisco Cyber Vision Center, therefore at least one interface (SVI or physical) must be configured with an IP address that is able to communicate through the network to the Cisco Cyber Vision Center. A VLAN interface was used in this implementation:
In addition, the AppGigabitEthernet interface must be configured as a trunk to transfer data to and from the Cisco Cyber Vision Sensor application:
Application Installation
The IE 3400 switch hosts the Cisco Cyber Vision Sensor in Cisco IOx and can be installed and managed from the CLI or the web GUI. This guide will cover the web GUI installation steps.
Note: IOS upgrades may affect the sensor application, requiring a reinstall.
1.![]() In a web browser, navigate to the switch over HTTPS and log in with administrator credentials.
In a web browser, navigate to the switch over HTTPS and log in with administrator credentials.
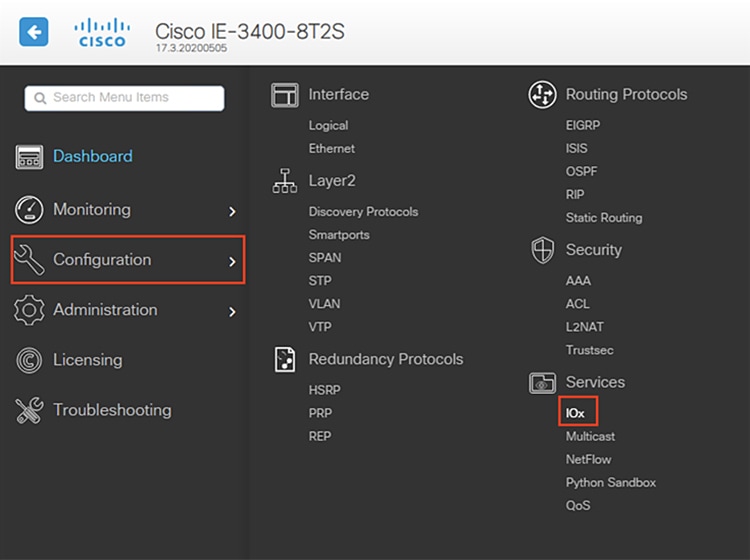
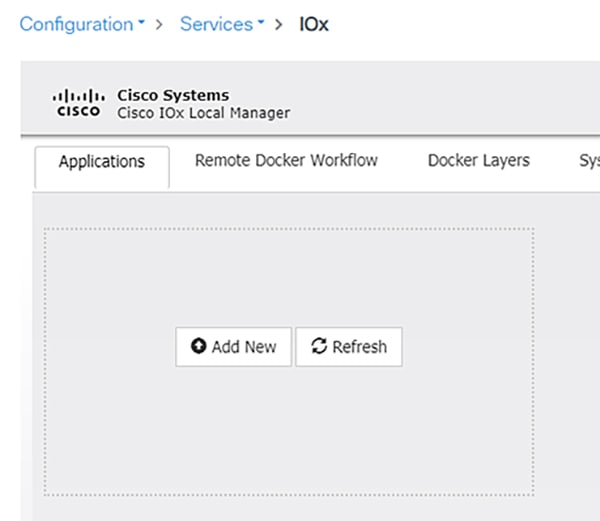
2.![]() From the left menu, navigate to Configuration -> Services -> IOx.
From the left menu, navigate to Configuration -> Services -> IOx.
3.![]() Log in to the Cisco IOx Local Manager with the same administrator credentials.
Log in to the Cisco IOx Local Manager with the same administrator credentials.
4.![]() From the Applications tab, click the Add New button.
From the Applications tab, click the Add New button.
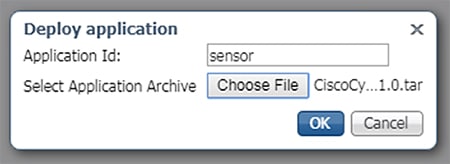
5.![]() In the Deploy application dialog box, enter a name for the Cisco Cyber Vision Sensor application and click the Browse button to upload the.tar file for the IE 3400 Cisco Cyber Vision Sensor application. When finished, click the OK button.
In the Deploy application dialog box, enter a name for the Cisco Cyber Vision Sensor application and click the Browse button to upload the.tar file for the IE 3400 Cisco Cyber Vision Sensor application. When finished, click the OK button.
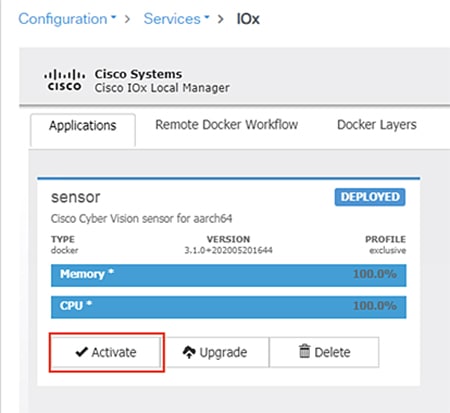
6.![]() When the installation finishes, the application status will show as “DEPLOYED”. Click the Activate button.
When the installation finishes, the application status will show as “DEPLOYED”. Click the Activate button.
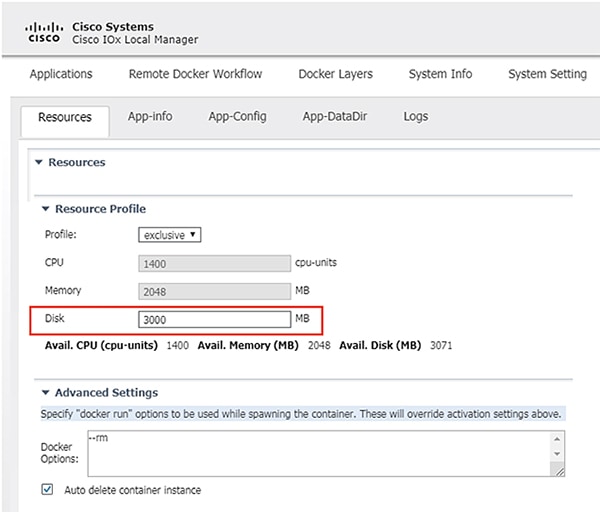
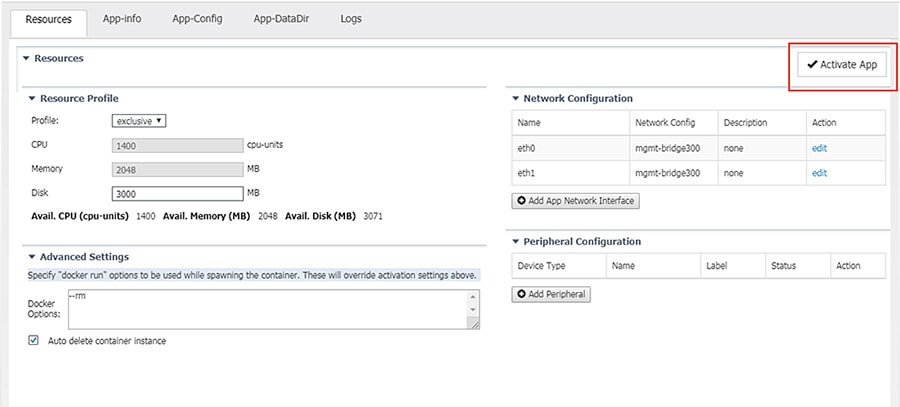
7.![]() From the Sensor -> Resources tab, under Resource Profile, enter 3000 in the Disk field.
From the Sensor -> Resources tab, under Resource Profile, enter 3000 in the Disk field.
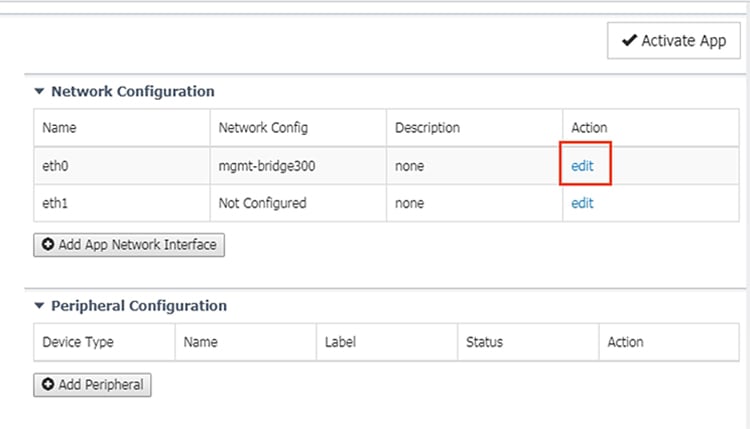
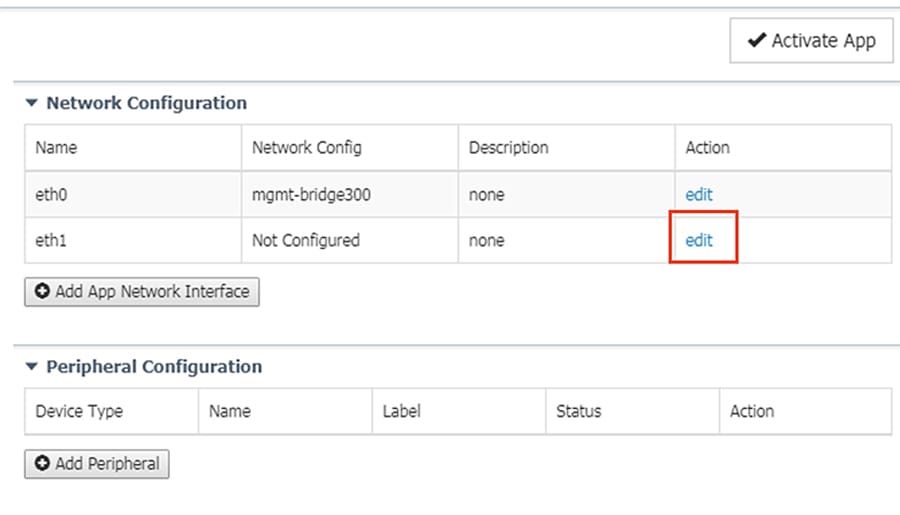
8.![]() Under Network Configuration, click the Edit link for the eth0 interface.
Under Network Configuration, click the Edit link for the eth0 interface.
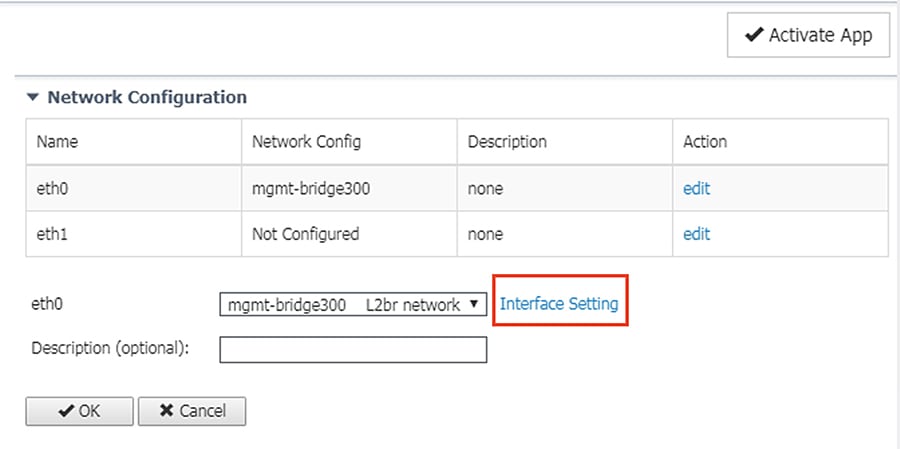
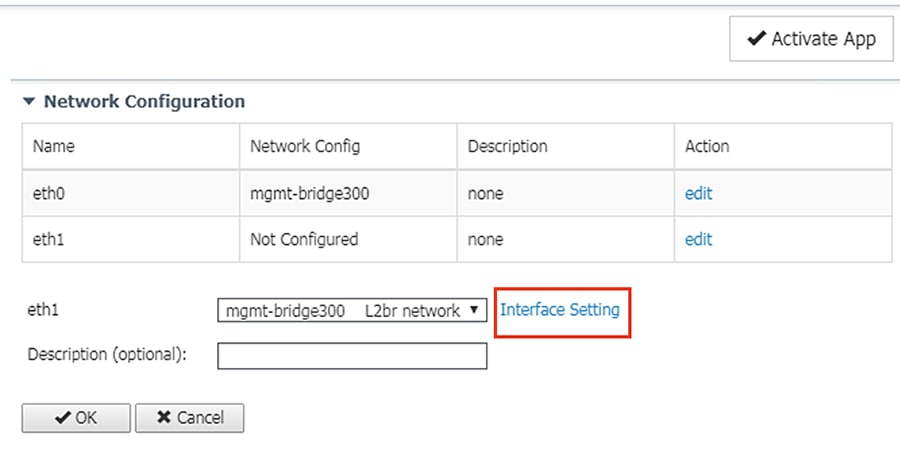
9.![]() Click the Interface Setting link for eth0.
Click the Interface Setting link for eth0.
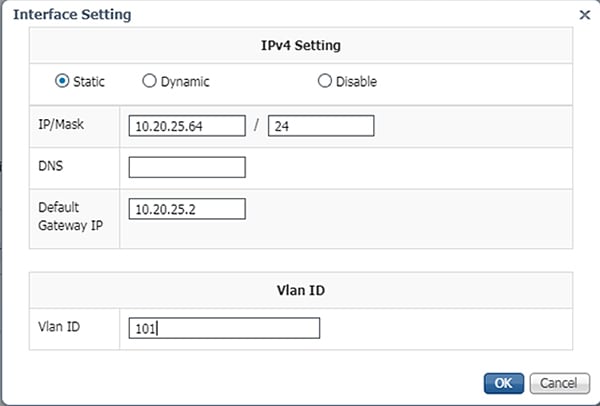
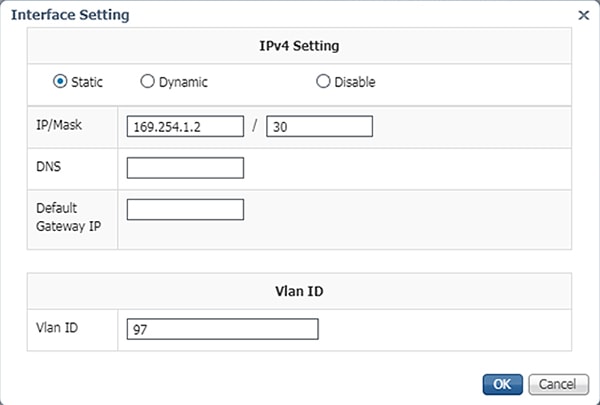
10.![]() In the Interface Setting dialog box, click the Static radio button. Then enter values in the IP, Mask, Default Gateway IP, and VLAN ID fields. This information will be used for the Cisco Cyber Vision Sensor application communication to the Cisco Cyber Vision Center. When finished, click the OK button.
In the Interface Setting dialog box, click the Static radio button. Then enter values in the IP, Mask, Default Gateway IP, and VLAN ID fields. This information will be used for the Cisco Cyber Vision Sensor application communication to the Cisco Cyber Vision Center. When finished, click the OK button.
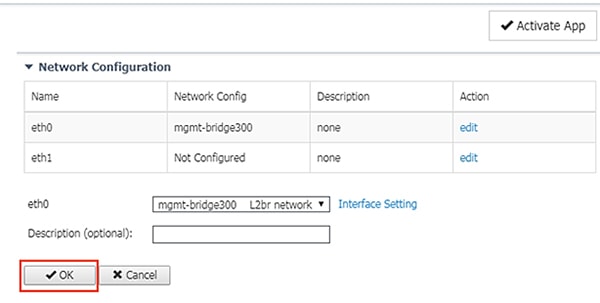
11.![]() Click the OK button underneath the interface details, then click the OK button in the notification dialog box.
Click the OK button underneath the interface details, then click the OK button in the notification dialog box.

12.![]() Under Network Configuration, click the Edit link for the eth1 interface.
Under Network Configuration, click the Edit link for the eth1 interface.
13.![]() Click the Interface Setting link for eth1.
Click the Interface Setting link for eth1.
14.![]() In the Interface Setting dialog box, click the Static radio button. Then enter values in the IP, Mask, and VLAN ID fields. This information should align with the ERSPAN destination configured on the switch. When finished, click the OK button.
In the Interface Setting dialog box, click the Static radio button. Then enter values in the IP, Mask, and VLAN ID fields. This information should align with the ERSPAN destination configured on the switch. When finished, click the OK button.
15.![]() Click the OK button underneath the interface details, then click the OK button in the notification dialog box.
Click the OK button underneath the interface details, then click the OK button in the notification dialog box.
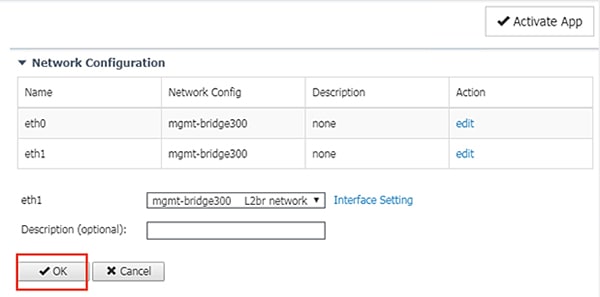

16.![]() Click the Activate App button at the top right of the Resources tab page.
Click the Activate App button at the top right of the Resources tab page.
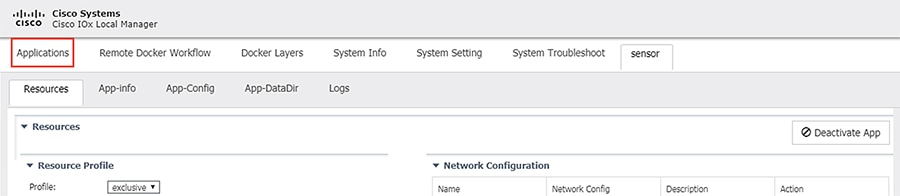
17.![]() Once it is activated, click the Applications tab.
Once it is activated, click the Applications tab.
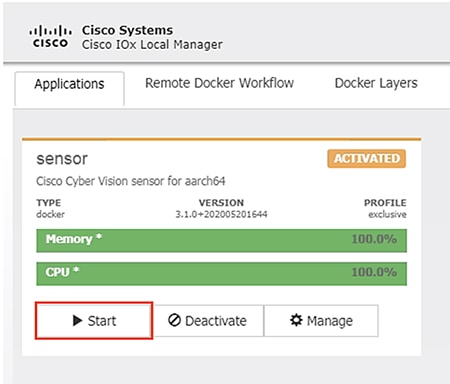
18.![]() The application status will now show as “Activated”. Click the Start button.
The application status will now show as “Activated”. Click the Start button.
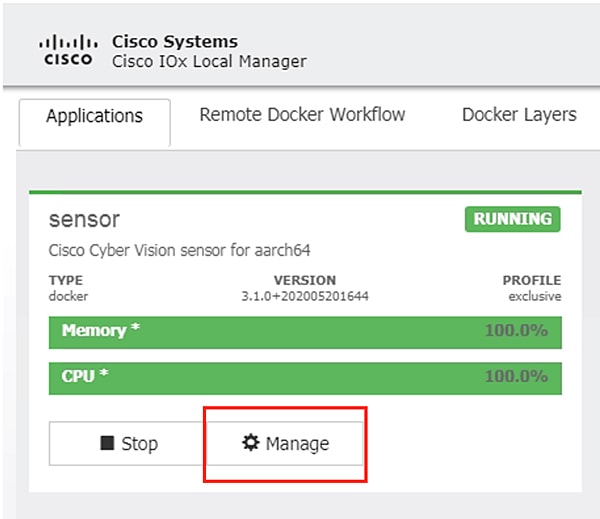
19.![]() After it starts, the application status will show as “Running”. Click the Manage button.
After it starts, the application status will show as “Running”. Click the Manage button.
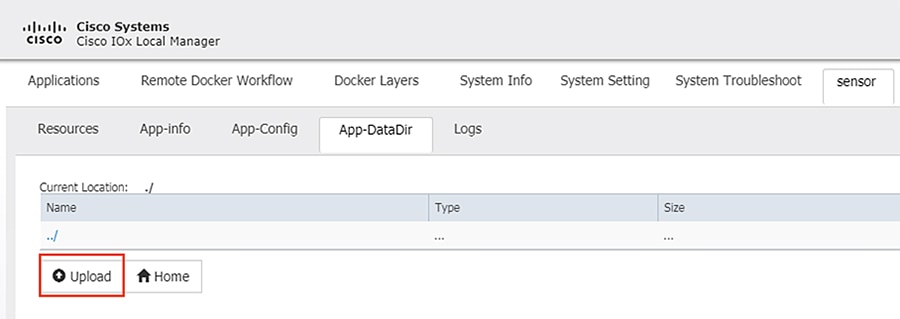
20.![]() Navigate to the Sensor -> App-DataDir tab. Click the Upload button.
Navigate to the Sensor -> App-DataDir tab. Click the Upload button.
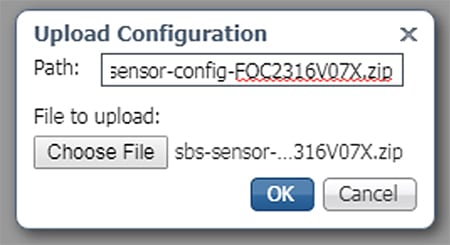
21.![]() Click the Choose File button to upload the provisioning package for the sensor specific to this switch (see Cisco Cyber Vision Center Configuration). In the Path field, enter the filename of the provisioning package, including the.zip extension. When finished, click the OK button.
Click the Choose File button to upload the provisioning package for the sensor specific to this switch (see Cisco Cyber Vision Center Configuration). In the Path field, enter the filename of the provisioning package, including the.zip extension. When finished, click the OK button.
22.![]() Click the OK button in the notification dialog box.
Click the OK button in the notification dialog box.
Cisco Cyber Vision Sensor on the Cisco Catalyst 9300
Data Configuration
As with the IE 3400 switch, the Cisco Catalyst 9300 switch uses ERSPAN to copy traffic to the Cisco Cyber Vision Sensor application. To configure the ERSPAN on the switch, enter the following commands in enable mode:
The Cisco Catalyst 9300 switch requires a Solid State Drive (SSD) for IOx applications. For more information about installing the SSD, see:
https://www.cisco.com/c/en/us/td/docs/switches/lan/catalyst9300/hardware/install/b_c9300_hig/b_c9300_hig_chapter_01010.html.
If the Cisco Catalyst 9300 is in a StackWise-480 configuration, the switch with the SSD must be in the “active” role. To format the SSD, enter the following command in enable mode:
To enable IOx, enter the following commands in enable mode:
The Cisco Cyber Vision Sensor application communicates over IP to the Cisco Cyber Vision Center, therefore at least one interface (SVI or physical) must be configured with an IP address that is able to communicate through the network to the Cisco Cyber Vision Center. A VLAN interface was used in this implementation:
Application Installation
The Cisco Catalyst 9300 switch hosts the Cisco Cyber Vision Sensor in Cisco IOx and can be installed and managed from the CLI or the web GUI. This guide will cover the CLI installation steps.
1.![]() Configure the application name.
Configure the application name.
2.![]() Configure the AppGigabitEthernet interface as a trunk.
Configure the AppGigabitEthernet interface as a trunk.
3.![]() Configure the Cisco Cyber Vision Sensor management interface.
Configure the Cisco Cyber Vision Sensor management interface.
4.![]() Configure the Cisco Cyber Vision Sensor capture interface.
Configure the Cisco Cyber Vision Sensor capture interface.
5.![]() Configure gateway for the Cisco Cyber Vision Sensor management interface to use.
Configure gateway for the Cisco Cyber Vision Sensor management interface to use.
6.![]() Configure gateway for the Cisco Cyber Vision Sensor application resources.
Configure gateway for the Cisco Cyber Vision Sensor application resources.
7.![]() Copy the.tar file for the Cisco Catalyst 9300 Cisco Cyber Vision Sensor to the SSD. Next, install the application.
Copy the.tar file for the Cisco Catalyst 9300 Cisco Cyber Vision Sensor to the SSD. Next, install the application.
10.![]() Copy the provisioning package for the sensor specific to this switch to the application (see Cisco Cyber Vision Center Configuration).
Copy the provisioning package for the sensor specific to this switch to the application (see Cisco Cyber Vision Center Configuration).
Cisco Stealthwatch Configuration
Installation
For this implementation, the SMC was deployed as a VM in the Enterprise Zone, and the FCs were deployed as VMs in the Level 3 Site Operations Zone. For VM installation instructions refer to:
https://www.cisco.com/c/dam/en/us/td/docs/security/stealthwatch/system_installation_configuration/SW_7_2_Installation_and_Configuration_Guide_DV_2_0.pdf.
Java Client and Web UI
The SMC can be accessed two ways: Java client and web UI. Many of the features and functions of the traditional Java client have been ported to the web UI, however, some features are not yet available on the web UI (for example, Response Management). Alternatively, there are newer features only available to the web UI (for example, Custom Security Events). In this guide we have prioritized web UI configuration where possible.
Host Groups
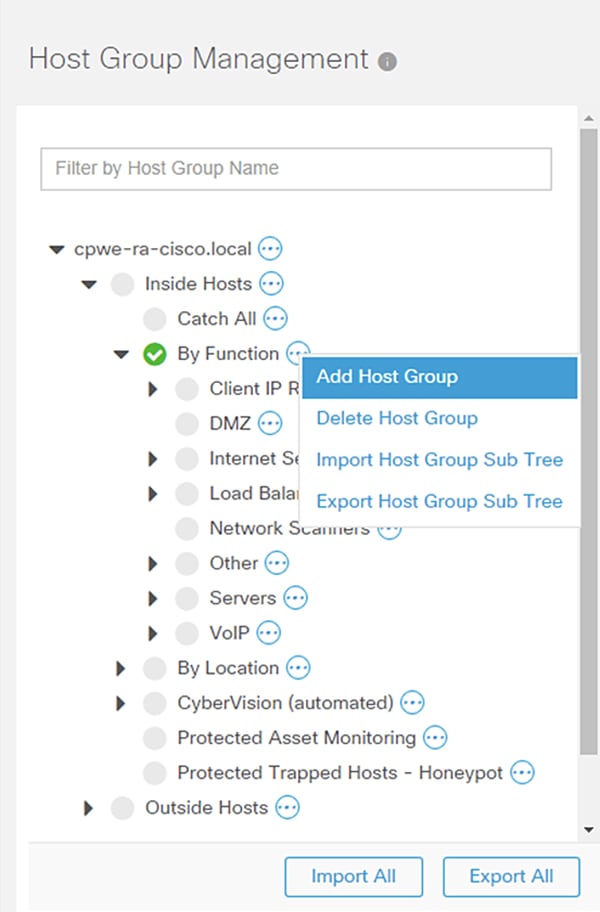
Stealthwatch Host Groups allow the user to organize IP addresses into intuitive groupings for ease of searching, alarm tuning, and host attribution. The preferred method of arranging addresses is to group by function; by grouping like devices that have similar behaviors, alarms and security events can be more easily refined for those entities. To create a Host Group in the SMC web UI, do the following:
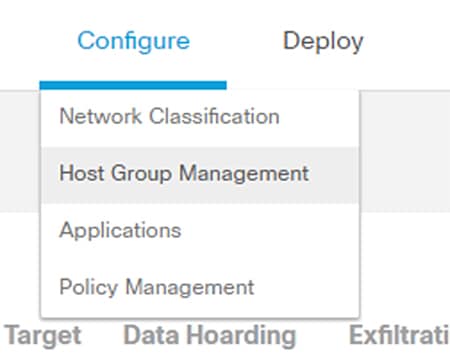
1.![]() Navigate to Configure -> Host Group Management.
Navigate to Configure -> Host Group Management.
2.![]() Click the ellipses button to the right of the Host Group for which you would like to create a nested Host Group. Choose Add Host Group from the list.
Click the ellipses button to the right of the Host Group for which you would like to create a nested Host Group. Choose Add Host Group from the list.
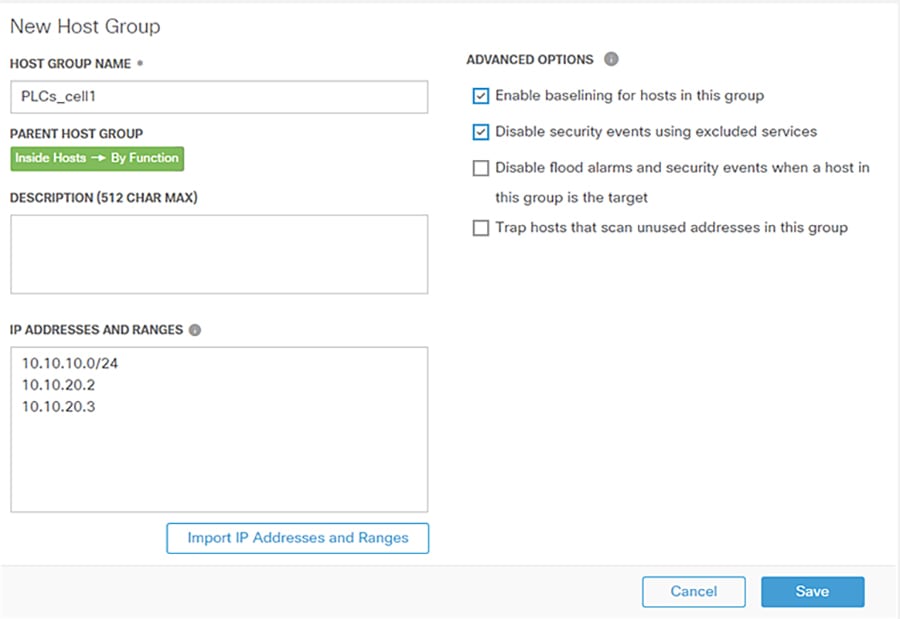
3.![]() Enter information in the Host Group Name and IP Addresses and Ranges fields. Check the Advanced Options check boxes as needed.
Enter information in the Host Group Name and IP Addresses and Ranges fields. Check the Advanced Options check boxes as needed.
Host Policy
Host Policy allows the user to tailor the security events and alarm categories applied for a particular host or Host Group. Most security events have a configurable threshold to meet specific requirements for a given entity. To create or edit a Host Policy in the SMC web UI, do the following:
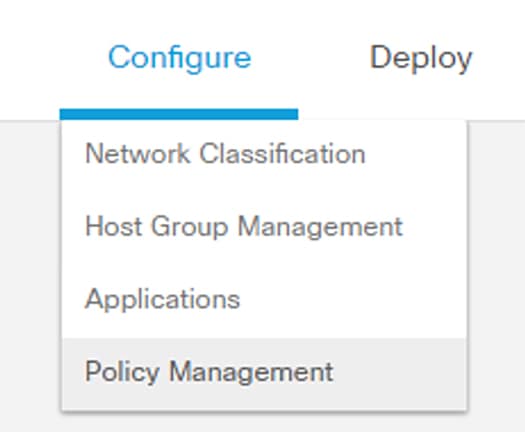
1.![]() Navigate to Configure > Policy Management.
Navigate to Configure > Policy Management.
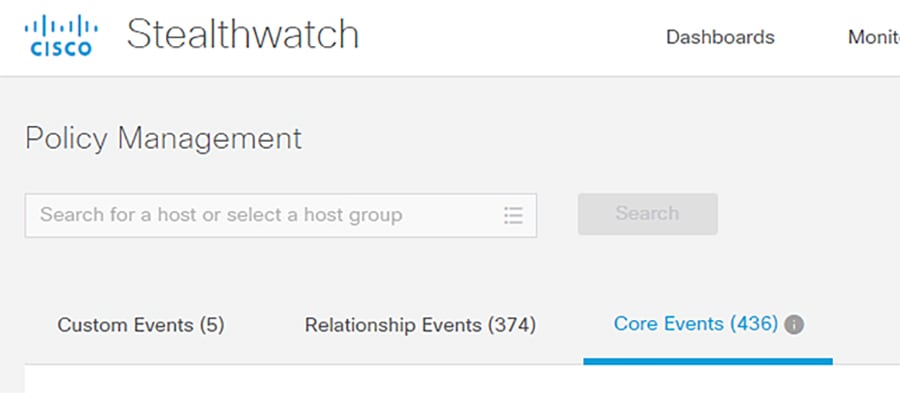
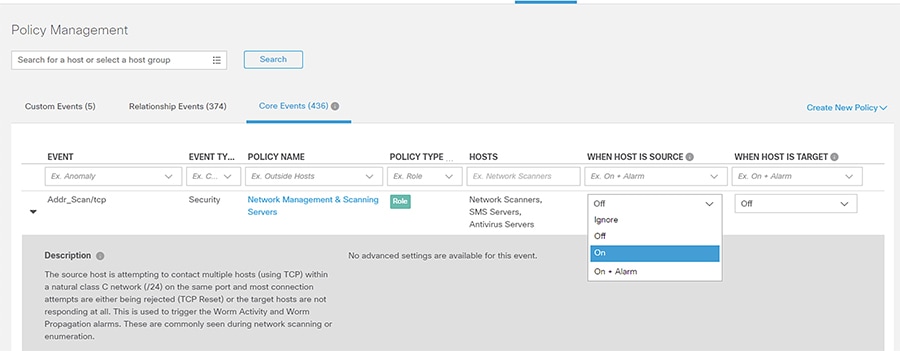
2.![]() Click the Core Events link to view current global security events and their settings.
Click the Core Events link to view current global security events and their settings.
3.![]() Turn global security events or categories on or off using the When Host is Source and When Host is Target drop-down lists.
Turn global security events or categories on or off using the When Host is Source and When Host is Target drop-down lists.
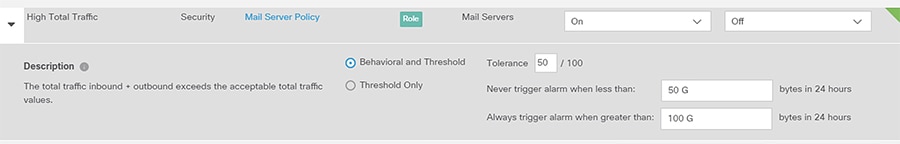
4.![]() Update the thresholds for necessary events or categories by clicking the Behavioral and Threshold or Threshold Only radio button.
Update the thresholds for necessary events or categories by clicking the Behavioral and Threshold or Threshold Only radio button.

To create a custom policy for IP address(es), Host Group(s), or both, do the following:
1.![]() Navigate to Configure -> Policy Management.
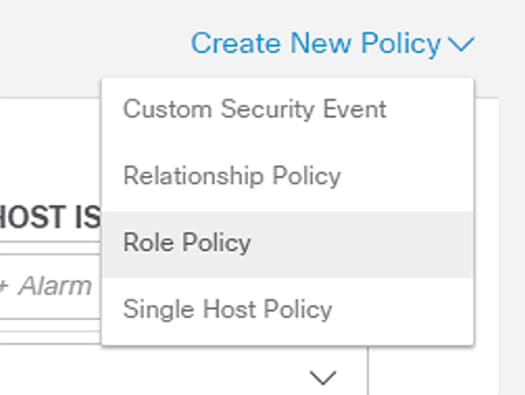
Navigate to Configure -> Policy Management.
2.![]() From the Create New Policy drop-down list, choose Role Policy.
From the Create New Policy drop-down list, choose Role Policy.
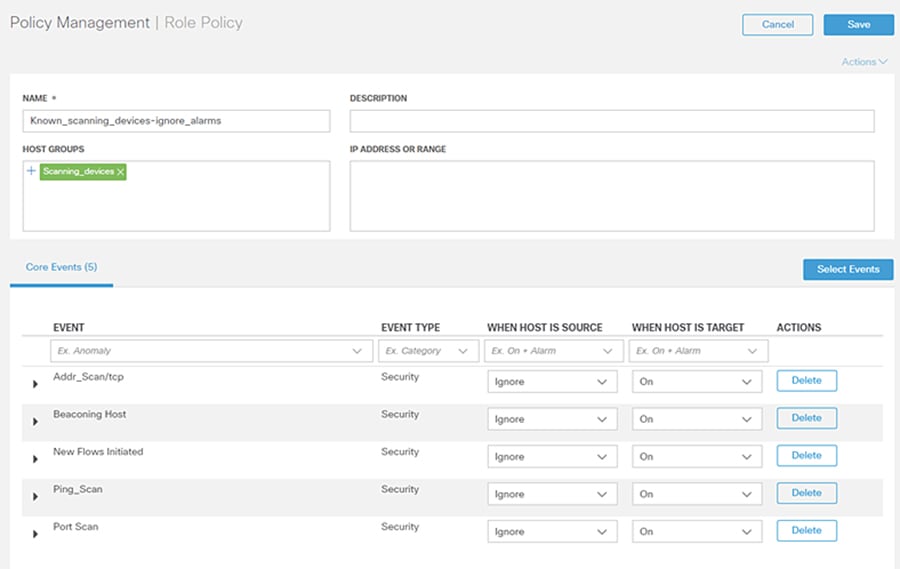
3.![]() Enter a name for the policy and add Host Groups, IP address(es), or both.
Enter a name for the policy and add Host Groups, IP address(es), or both.
4.![]() Click the Select Events button to add events. Use the When Host is Source and When Host is Target drop-down lists to enable or disable the events for the specified entities.
Click the Select Events button to add events. Use the When Host is Source and When Host is Target drop-down lists to enable or disable the events for the specified entities.
Alarm Notifications
Alarms can be viewed in the SMC, but also sent from the SMC as email notifications or syslog messages. To configure alarm notifications from the SMC Java UI, do the following:
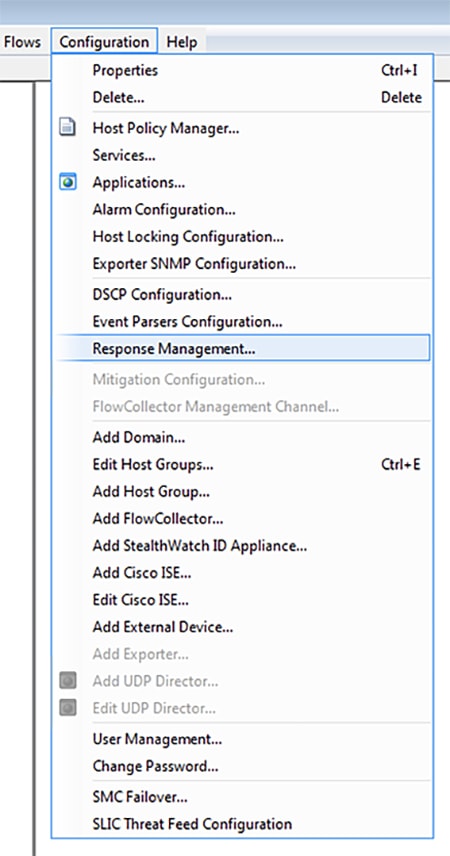
1.![]() Navigate to Configuration -> Response Management.
Navigate to Configuration -> Response Management.
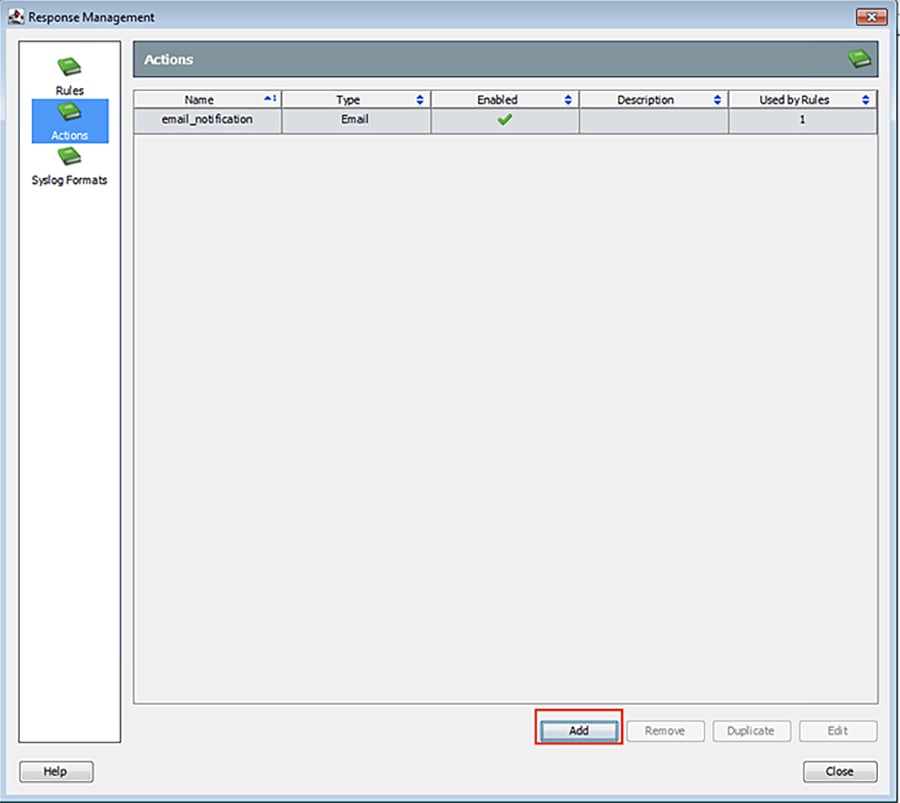
2.![]() From the Response Management window Actions pane, click the Add button.
From the Response Management window Actions pane, click the Add button.
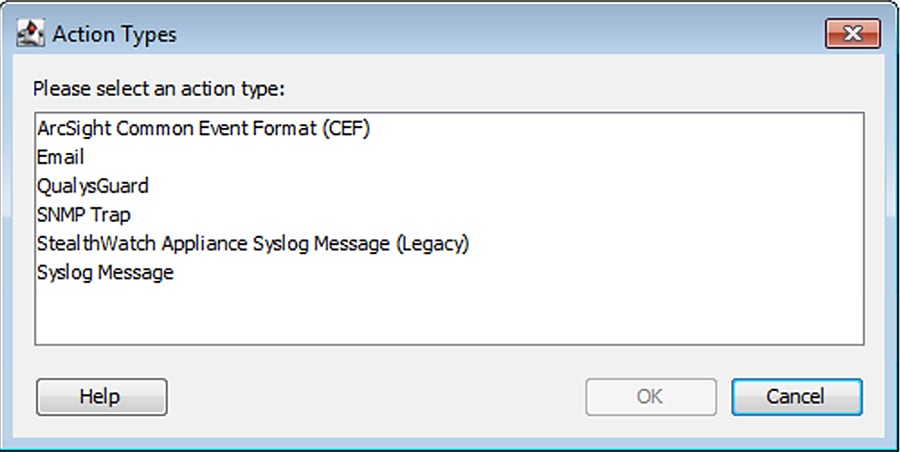
3.![]() In the Action Types dialog box, choose the appropriate action.
In the Action Types dialog box, choose the appropriate action.
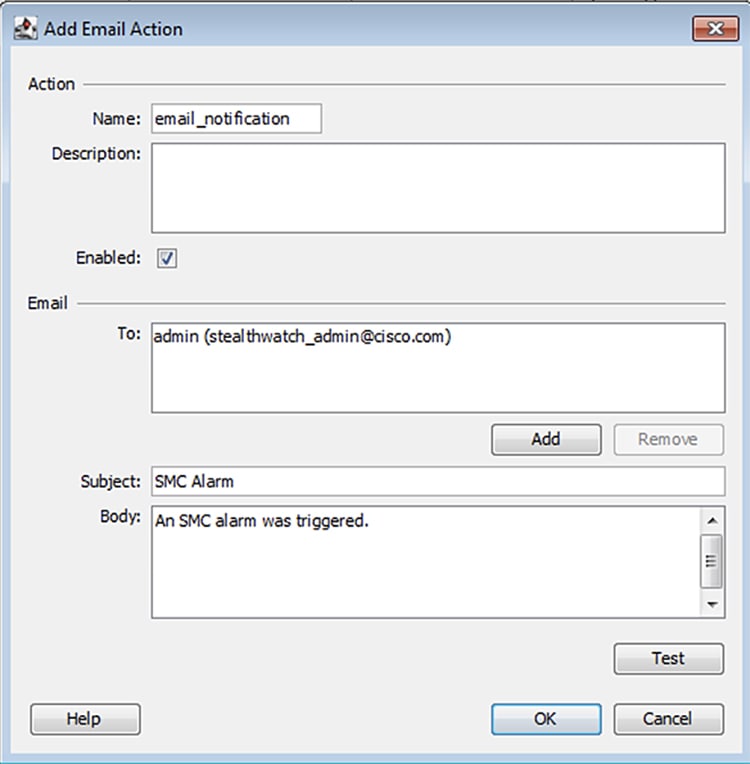
4.![]() If choosing the Email action type, in the Add Email Action window enter the action name, recipient, email subject, and email body. Click the OK button when finished.
If choosing the Email action type, in the Add Email Action window enter the action name, recipient, email subject, and email body. Click the OK button when finished.
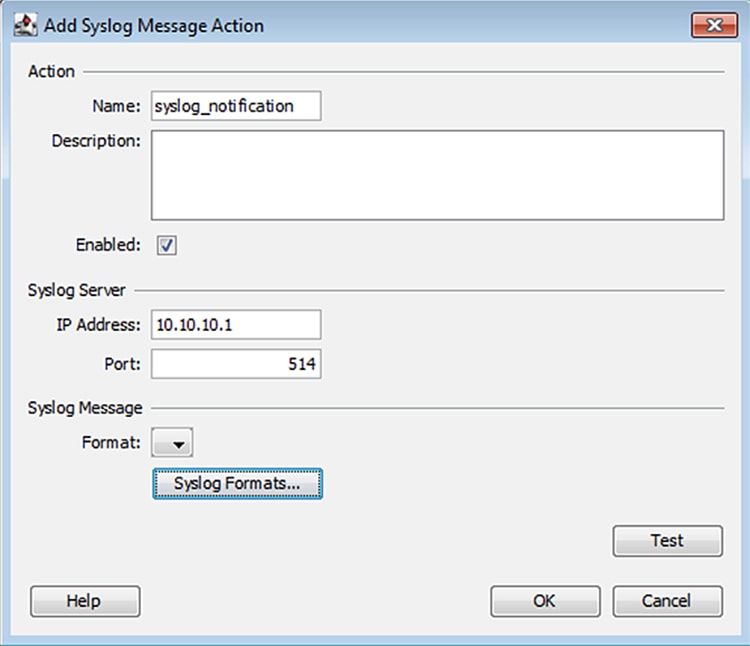
5.![]() If choosing the Syslog Message action type, in the Add Syslog Message Action window enter the action name, syslog server IP address, and syslog server port. Click the Syslog Formats button to create a Syslog Format if none have been previously configured. Otherwise, choose a format from the Format drop-down list and click the OK button.
If choosing the Syslog Message action type, in the Add Syslog Message Action window enter the action name, syslog server IP address, and syslog server port. Click the Syslog Formats button to create a Syslog Format if none have been previously configured. Otherwise, choose a format from the Format drop-down list and click the OK button.
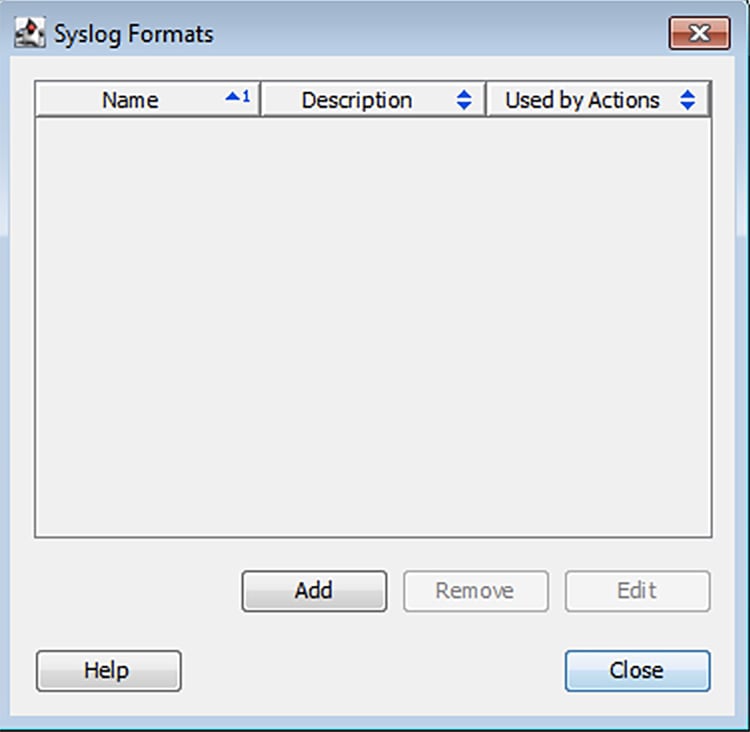
6.![]() If no syslog format has been created and you have clicked the Syslog Formats button, in the Syslog Formats window, click the Add button.
If no syslog format has been created and you have clicked the Syslog Formats button, in the Syslog Formats window, click the Add button.
7.![]() In the Add Syslog Format window, enter a name, choose the facility and severity, and update the message content as desired.
In the Add Syslog Format window, enter a name, choose the facility and severity, and update the message content as desired.
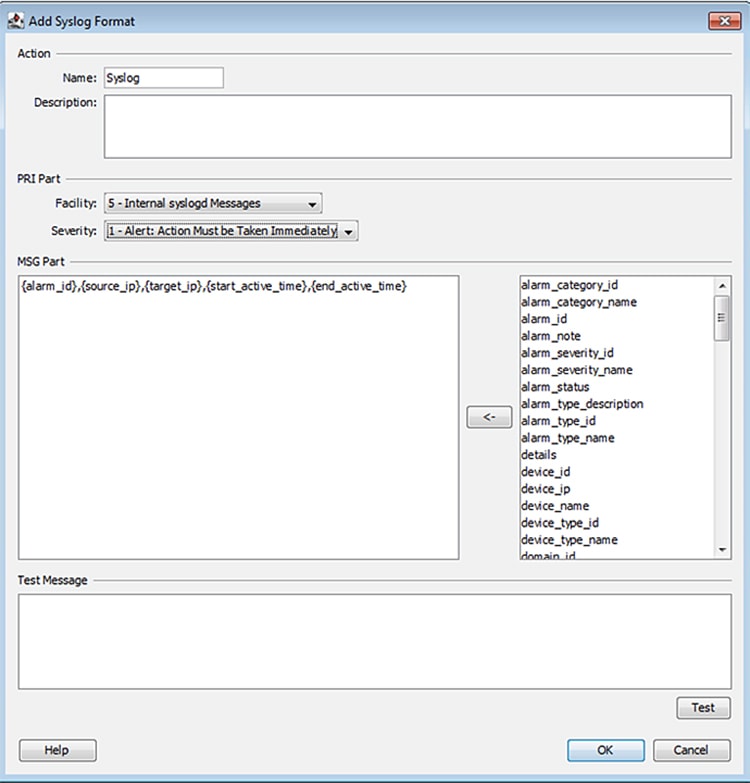
Click the OK button when finished.
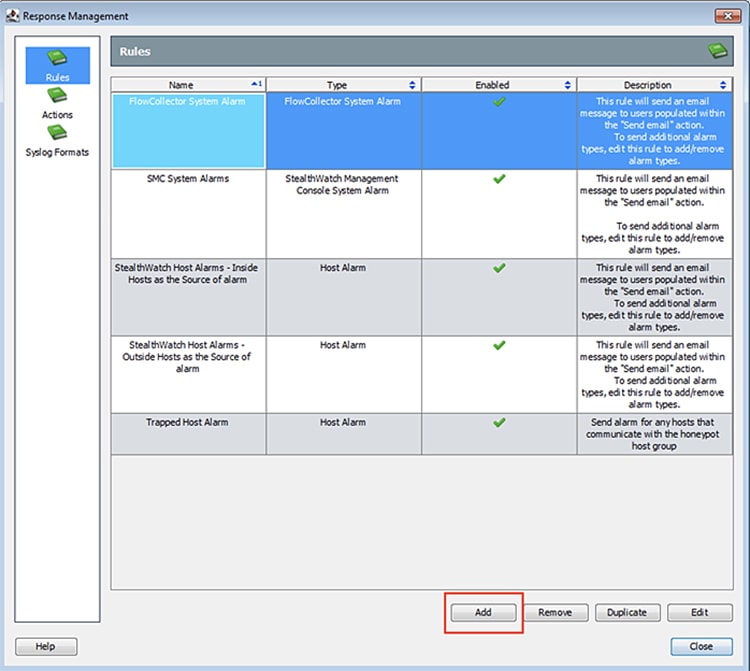
8.![]() From the Response Management window Rules pane, click the Add button.
From the Response Management window Rules pane, click the Add button.
9.![]() Choose Host Alarm from the Rule Types dialog box.
Choose Host Alarm from the Rule Types dialog box.
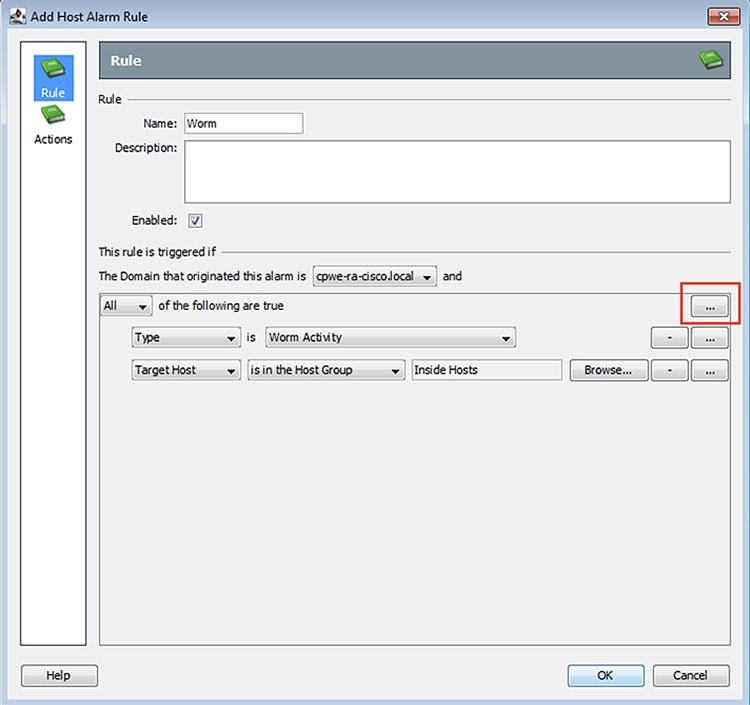
10.![]() In the Add Host Alarm Rule window, in the Rule pane enter a name and the use the ellipses button to add alarm conditions.
In the Add Host Alarm Rule window, in the Rule pane enter a name and the use the ellipses button to add alarm conditions.
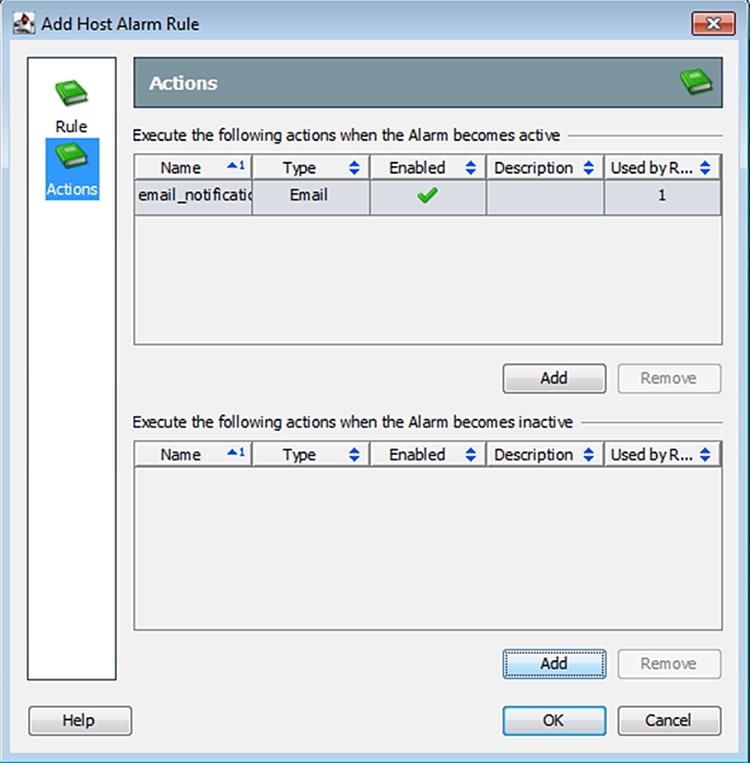
11.![]() In the Actions pane, click the Add buttons to update the actions for the active and inactive Alarm states. Click the OK button when finished.
In the Actions pane, click the Add buttons to update the actions for the active and inactive Alarm states. Click the OK button when finished.
Precision Time Protocol Configuration
This section describes the implementation of site-wide Precision Time Protocol (PTP) for Industrial Automation environments.
There are three deployment options based on customer precision requirements:
■![]() High Precision site-wide time distribution using a dedicated grandmaster clock
High Precision site-wide time distribution using a dedicated grandmaster clock
The plantwide high precision grandmaster clock time distribution architecture provides a plantwide, highly accurate time feed forward tree to facilitate inter-cell loop or plantwide motion drive cooperation. It normally requires high accuracy oscillators to synchronize with a GNSS source.
Grandmaster clock source redundancy, transport network device box-level redundancy (for example stack-wise, HSRP over industrial zone), Cell/Area Zone resilient network topology, etc., all provide redundant PTP message source and transport path. This highly resilient network design reduces the possibility that any network element will lose its clock source. If, in a very extreme case, the clock source become unavailable, a multi-level boundary clock will enter into a “HOLDOVER” state to assume the primary clock role for its lower stratum clock element to maintain normal industrial operations.
Plantwide High Precision GPS Backed PTPv2 Architecture shows the plantwide high precision grandmaster clock architecture.
Figure 42 Plantwide High Precision GPS Backed PTPv2 Architecture
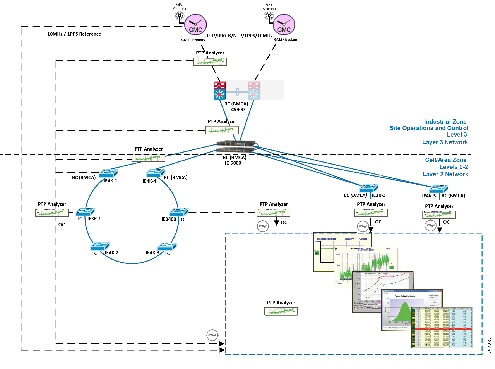
–![]() Meinberg LANTIME M600 provides redundant plant-wide grandmaster clocks.
Meinberg LANTIME M600 provides redundant plant-wide grandmaster clocks.
–![]() Cisco Catalyst 9300 core switch is configured as Boundary Clock (BC) over industrial zone.
Cisco Catalyst 9300 core switch is configured as Boundary Clock (BC) over industrial zone.
–![]() Cisco IE 5000 pair switches are configured as BC over distribution layer.
Cisco IE 5000 pair switches are configured as BC over distribution layer.
–![]() Cisco IE 4000 pair switches are configured as BC on the top of each ring or start to dual-home to distribution switch pairs.
Cisco IE 4000 pair switches are configured as BC on the top of each ring or start to dual-home to distribution switch pairs.
–![]() Cisco IE 4000 is configured as end-to-end Transparent Clock (TC) inside ring.
Cisco IE 4000 is configured as end-to-end Transparent Clock (TC) inside ring.
–![]() Cisco IE 3000 is configured as end-to-end TC inside ring.
Cisco IE 3000 is configured as end-to-end TC inside ring.
–![]() Cisco IE 3400 is configured as end-to-end TC inside ring.
Cisco IE 3400 is configured as end-to-end TC inside ring.
–![]() Customer PLC controller IP module is configured as Ordinary Clock (OC) to recover clock.
Customer PLC controller IP module is configured as Ordinary Clock (OC) to recover clock.
–![]() Underlying resilience protocols vary with MSTP, REP, etc. deployed transport protocols.
Underlying resilience protocols vary with MSTP, REP, etc. deployed transport protocols.
–![]() Industrial Ethernet Switch is enabled with PTP-aware QoS for classifying and policing PTP messages.
Industrial Ethernet Switch is enabled with PTP-aware QoS for classifying and policing PTP messages.
Note: The Cisco Catalyst 9300 will support PTPv2 over VSS stacking in the future. Cisco IE 5000 stack-wise does not currently support PTP. In the topology in Plantwide High Precision GPS Backed PTPv2 Architecture, Cisco IE 5000 pairs are configured with HSRP over a Layer 2 trunk link.
■![]() Site-wide time distribution using Cisco IE 5000 as grandmaster
Site-wide time distribution using Cisco IE 5000 as grandmaster
Intermediate precision with distributed grandmaster clock design uses Cisco IE 5000 switch to directly connect to a GNSS source over industrial zone distribution switch. This design is targeted for general industrial operation where motion-related operation is not the main consideration when designing time synchronization distribution architecture.
Intermediate precision with distributed grandmaster clock design inherits most of the high precision time distribution design by only removing the high precision dedicate grandmaster clock source located on the core network. The Cisco IE 5000 can either connect to a GNSS source or use the Cisco proprietary NTP-to-PTP (Flywheel) feature to assume the grandmaster clock role. It is not recommended to use an external internet NTP server if NTP-to-PTP grandmaster is a consideration in the PTP network design.
Plantwide Intermediate Precision GPS Backed PTPv2 Architecture shows the intermediate precision plantwide grandmaster clock architecture.
Figure 43 Plantwide Intermediate Precision GPS Backed PTPv2 Architecture
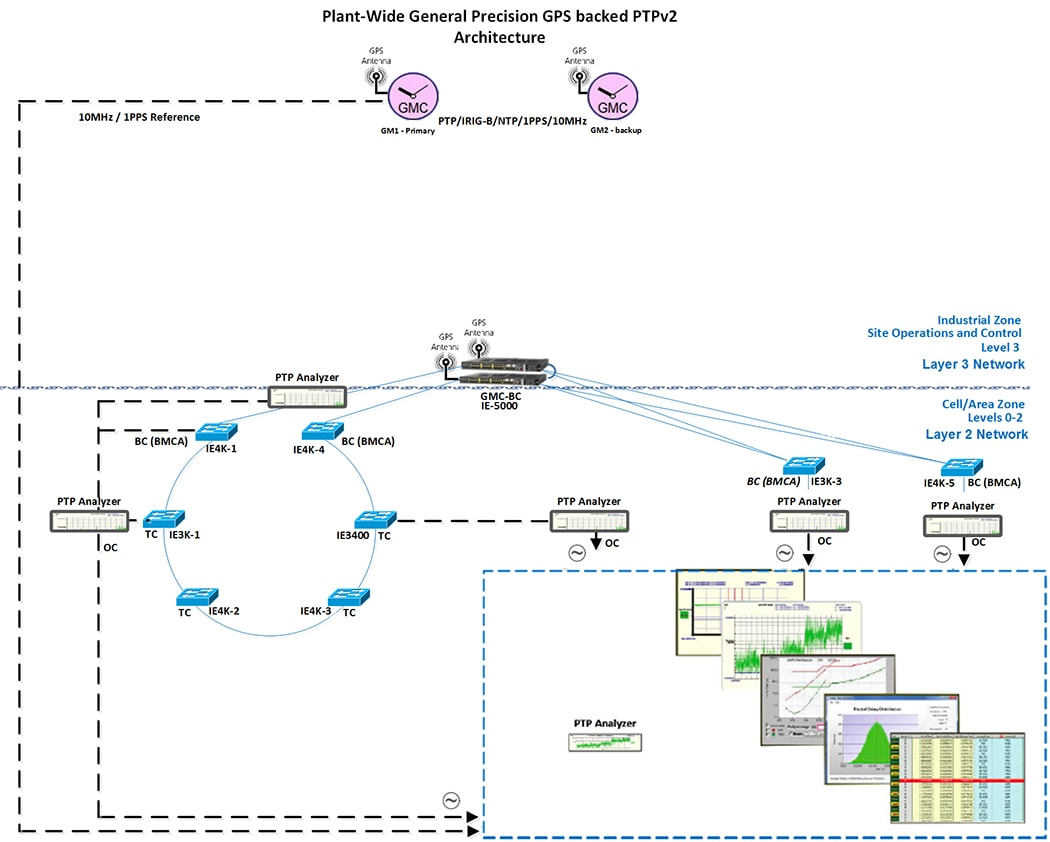
–![]() Cisco IE 5000 pair switches connect to GNSS providing redundant plant-wide grandmaster clock.
Cisco IE 5000 pair switches connect to GNSS providing redundant plant-wide grandmaster clock.
–![]() Cisco IE 4000 pair switches are configured as Boundary Clock (BC) on the top of each ring or start to dual-home to distribution switch pairs.
Cisco IE 4000 pair switches are configured as Boundary Clock (BC) on the top of each ring or start to dual-home to distribution switch pairs.
–![]() Cisco IE 4000 is configured as end-to-end Transparent Clock (TC) inside ring.
Cisco IE 4000 is configured as end-to-end Transparent Clock (TC) inside ring.
–![]() Cisco IE 3000 is configured as end-to-end TC inside ring.
Cisco IE 3000 is configured as end-to-end TC inside ring.
–![]() Cisco IE 3400 is configured as end-to-end TC inside ring.
Cisco IE 3400 is configured as end-to-end TC inside ring.
–![]() Customer PLC controller IP module is configured as Ordinary Clock (OC) to recover clock.
Customer PLC controller IP module is configured as Ordinary Clock (OC) to recover clock.
–![]() Underlying resilience protocols vary with MSTP, REP, etc.
Underlying resilience protocols vary with MSTP, REP, etc.
–![]() Industrial Ethernet Switch is enabled with PTP-aware QoS for classifying and policing PTP messages.
Industrial Ethernet Switch is enabled with PTP-aware QoS for classifying and policing PTP messages.
Note: The Cisco Catalyst 9300 will support PTPv2 over VSS stacking in the future. Cisco IE 5000 stack-wise does not currently support PTP. In the topology in Plantwide Intermediate Precision GPS Backed PTPv2 Architecture, Cisco IE 5000 pairs are configured with HSRP over a Layer 2 trunk link.
The Cisco IE 5000 switch incorporated with stratum 3e Oven Controlled Crystal Oscillator (OCXO) can provide superior frequency stability in short term and high accuracy when in holdover state. High-precision Emerald OCXOs offer ±5 to ±8 ppb stability, 1 to 220 MHz frequency. It can be used as a drop-in replacement of legacy quartz OCXOs in emerging 5G and IEEE 1588 synchronization applications while improving overall system performance and robustness.
■![]() Site-wide time distribution using IACS Time Module
Site-wide time distribution using IACS Time Module
Refer to site-wide time distribution using Rockwell Automation PLCs:
–![]() Deploying Scalable Time Distribution within a Converged Plantwide Ethernet Architecture Design Guide
Deploying Scalable Time Distribution within a Converged Plantwide Ethernet Architecture Design Guide
https://www.cisco.com/c/en/us/td/docs/solutions/Verticals/CPwE/5-1/STD/DIG/CPwE-5-1-STD-DIG.html
–![]() Scalable Time Distribution within a Converged Plantwide Ethernet Architecture White Paper
Scalable Time Distribution within a Converged Plantwide Ethernet Architecture White Paper
https://www.cisco.com/c/en/us/td/docs/solutions/Verticals/CPwE/5-1/STD/WP/CPwE-5-1-STD-WP.html
The following section provides a detailed configuration and limitation example for a third-party grandmaster clock and Industrial Ethernet switch (IES).
Configuring Meinberg LANTIME M600
Meinberg LANTIME M600 will provision PTP/NTP service from the core network (Purdue model level 3 above) as close as possible to the distribution network (Purdue model level 3) which connects the Cell/Area Zone. This can reduce PTP hop count and possible routing asymmetry. M600 is configure with IPv4/UDP multicast master with End-to-End(E2E) default profile, where UDP port 319/320 pairs will be used for PTP Event messages (for example: E2E default Profile: Sync/Delay_Req) and PTP general messages (Delay_Resp/Follow_UP):
https://www.meinbergglobal.com/download/docs/manuals/english/ltos_6-24.pdf
Meinberg LANTIME M600 PTP Timestamping for Grandmaster Clock
M600 consists of three functional blocks: GPS reference time source will integrate with single board PTP computer via internal USB (169 NET) to get timestamping, PTP messages will be advertised via PTP timestamp unit via IP.
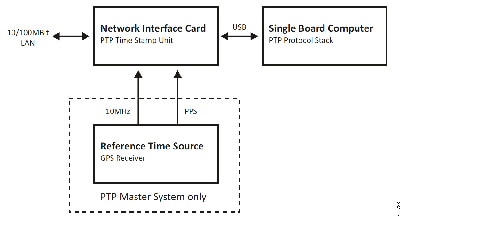
M600 PTP Timestamping
PTP messages transport over UDP port 319 and 320 via multicast addresses 224.0.0.107 and 224.0.0.129. This is handled via M600 single onboard computer. PTP messages advertise through manually configured 10 NET via external Fast Ethernet port as shown in M600 Timestamping.
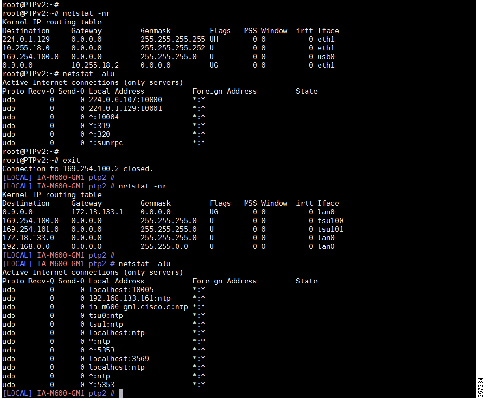
M600 PTP User Interface Configuration
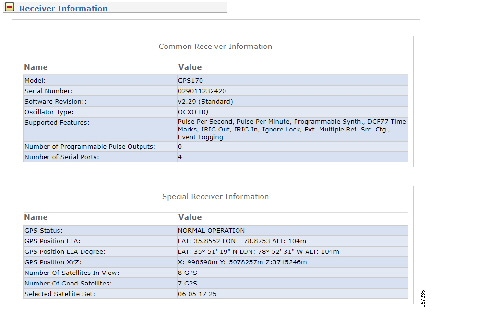
Figure 47 PTP Input Source Priority
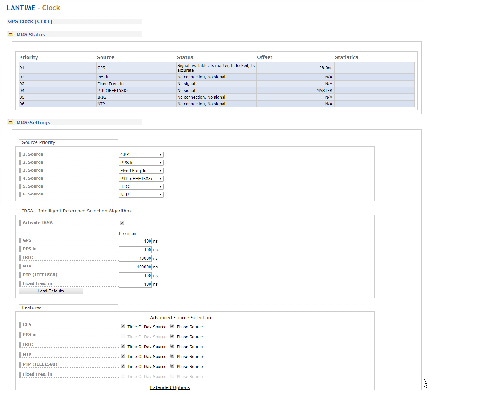
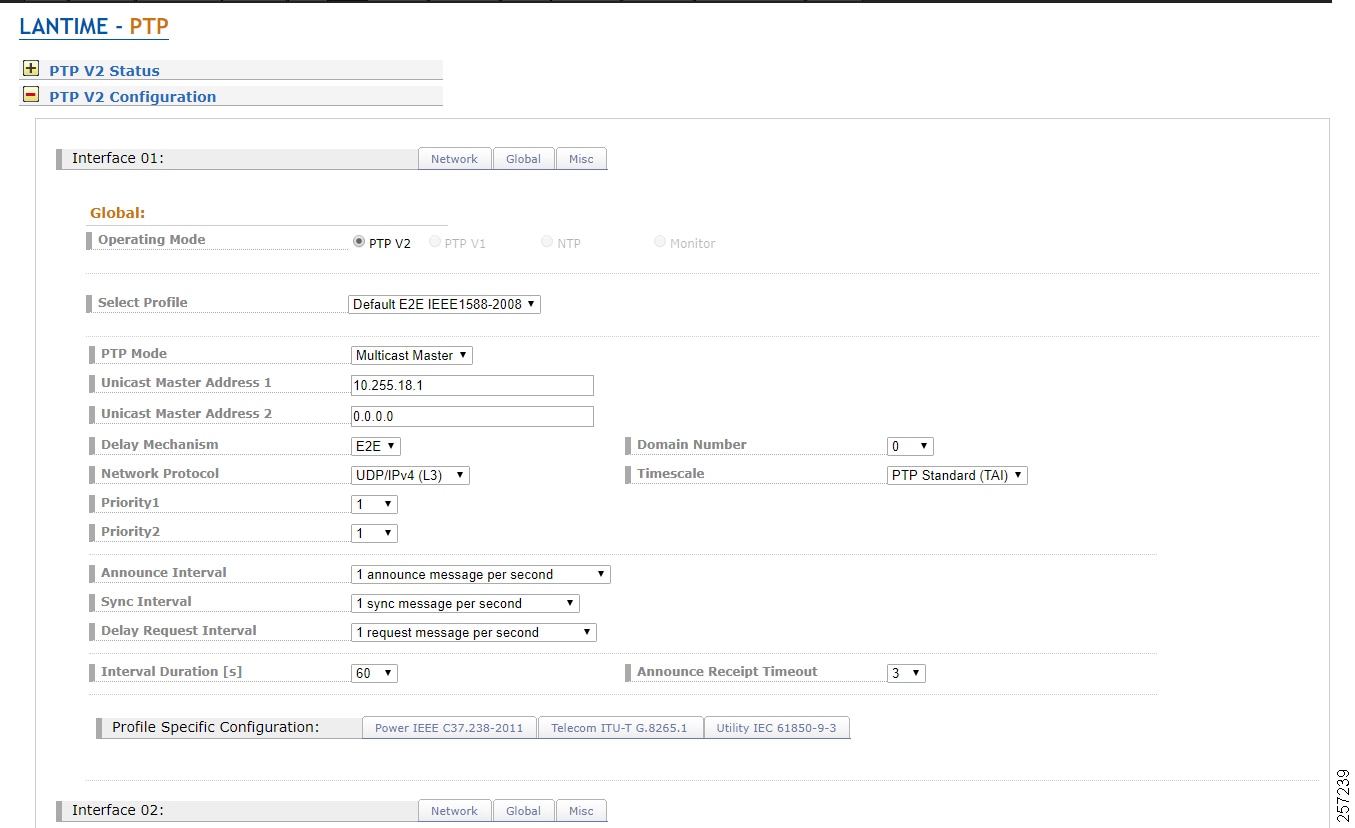
Configuring Cisco Catalyst 9300
Cisco Catalyst 9300 PTP Configuration Guide:
https://www.cisco.com/c/en/us/td/docs/switches/lan/catalyst9300/software/release/16-9/configuration_guide/lyr2/b_169_lyr2_9300_cg/configuring_precision_time_protocol__ptp_.pdf
Restrictions and Limitations for PTP
■![]() The output of show clock on the device and PTP servo clock displayed in show platform software fed switch active PTP domain 0 are not synchronized to each other. These are two different clocks used on the switch.
The output of show clock on the device and PTP servo clock displayed in show platform software fed switch active PTP domain 0 are not synchronized to each other. These are two different clocks used on the switch.
■![]() Inter-VLAN is not supported in PTP Transparent Clock Mode.
Inter-VLAN is not supported in PTP Transparent Clock Mode.
■![]() PTP is supported only on the first 16 downlink ports and on all the uplink ports of the C9300-48UXM switch model.
PTP is supported only on the first 16 downlink ports and on all the uplink ports of the C9300-48UXM switch model.
■![]() PTP is not supported in stacked systems.
PTP is not supported in stacked systems.
■![]() PTP is not supported on Layer 3 interface (support will be on release 16.12); currently SVI interface will be supported.
PTP is not supported on Layer 3 interface (support will be on release 16.12); currently SVI interface will be supported.
■![]() The switch supports IEEE802.1AS and IEEE1588 default profile and they are mutually exclusive. Only one profile can be enabled on the switch at a time.
The switch supports IEEE802.1AS and IEEE1588 default profile and they are mutually exclusive. Only one profile can be enabled on the switch at a time.
■![]() We do not recommend having non-PTP enabled devices in the PTP network since it decreases clock synchronization accuracy.
We do not recommend having non-PTP enabled devices in the PTP network since it decreases clock synchronization accuracy.
■![]() Management and signaling messages are not supported in Cisco IOS XE Fuji 16.8.1a. These messages are dropped in the switch without being processed.
Management and signaling messages are not supported in Cisco IOS XE Fuji 16.8.1a. These messages are dropped in the switch without being processed.
■![]() Moving from one PTP mode to the other is not recommended. Clear the existing mode using no PTP mode and then configure a new mode.
Moving from one PTP mode to the other is not recommended. Clear the existing mode using no PTP mode and then configure a new mode.
■![]() IPv6, VRF, EtherChannel interface, and native Layer 3 ports are not supported
IPv6, VRF, EtherChannel interface, and native Layer 3 ports are not supported
Cisco Catalyst 9300 PTP Default Profile Boundary Clock Configuration
The Cisco Catalyst 9300 is deployed on the enterprise core network to facilitate plantwide high precision grandmaster clock delivering time synchronization services across whole plant, where GM1 and backup GM2 are directly connected to a Cisco Catalyst 9300 core switch. The Cisco Catalyst 9300 will be configured in Boundary Clock (BC) mode to recover clock and regenerate clock for downstream PTP devices.
Cisco Catalyst 9300 PTP Default Profile Boundary Clock Configuration Example
Note: The Cisco Catalyst 9300 PTP default profile only supports Layer 2 in the released software, adding SVI configure.
Configuring Cisco IE 5000
Cisco IE 5000 PTP Configuration Guide:
■![]() https://www.cisco.com/c/en/us/td/docs/switches/lan/cisco_ie4000/software/release/15-2_4_e/b_ptp_ie4k.pdf
https://www.cisco.com/c/en/us/td/docs/switches/lan/cisco_ie4000/software/release/15-2_4_e/b_ptp_ie4k.pdf
■![]() https://www.cisco.com/c/en/us/td/docs/switches/connectedgrid/cg-switch-sw-master/software/configuration/guide/gnss/b_gnss.html
https://www.cisco.com/c/en/us/td/docs/switches/connectedgrid/cg-switch-sw-master/software/configuration/guide/gnss/b_gnss.html
Restrictions and Limitations for PTP
■![]() The Cisco PTP implementation supports only the two-step clock and not the one-step clock. If the switch receives a one-step message from the grandmaster clock, it will convert it into a two-step message.
The Cisco PTP implementation supports only the two-step clock and not the one-step clock. If the switch receives a one-step message from the grandmaster clock, it will convert it into a two-step message.
■![]() Cisco PTP supports multicast PTP messages only.
Cisco PTP supports multicast PTP messages only.
■![]() The switch and the grandmaster clock must be in the same PTP domain.
The switch and the grandmaster clock must be in the same PTP domain.
■![]() In Default Profile mode, only the delay_request mechanism is supported. To change to Boundary Clock Mode with the delay_request mechanism, enter the ptp mode boundary delay-req command.
In Default Profile mode, only the delay_request mechanism is supported. To change to Boundary Clock Mode with the delay_request mechanism, enter the ptp mode boundary delay-req command.
■![]() The packet format for PTP messages can be 802.1q tagged packets or untagged packets.
The packet format for PTP messages can be 802.1q tagged packets or untagged packets.
■![]() The switch does not support 802.1q QinQ tunneling.
The switch does not support 802.1q QinQ tunneling.
■![]() Subordinate IEDs must support tagged and untagged packets.
Subordinate IEDs must support tagged and untagged packets.
■![]() When PTP packets are sent on the native VLAN in E2E Transparent Clock Mode, they are sent as untagged packets. To configure the switch to send them as tagged packets, enter the global vlan dot1q tag native command.
When PTP packets are sent on the native VLAN in E2E Transparent Clock Mode, they are sent as untagged packets. To configure the switch to send them as tagged packets, enter the global vlan dot1q tag native command.
■![]() Set the PTP VLAN on a trunk port. The range is from 1 to 4094. The default is the native VLAN of the trunk port.
Set the PTP VLAN on a trunk port. The range is from 1 to 4094. The default is the native VLAN of the trunk port.
■![]() In boundary mode, only PTP packets in PTP VLAN will be processed. PTP packets from other VLANs will be dropped.
In boundary mode, only PTP packets in PTP VLAN will be processed. PTP packets from other VLANs will be dropped.
■![]() Before configuring the PTP VLAN on an interface, the PTP VLAN must be created and allowed on the trunk port.
Before configuring the PTP VLAN on an interface, the PTP VLAN must be created and allowed on the trunk port.
■![]() Most grandmaster clocks use the default VLAN 0. In Power Profile mode, the switch default VLAN is VLAN 1 and VLAN 0 is reserved. When you change the default grandmaster clock VLAN, it must be changed to a VLAN other than 0.
Most grandmaster clocks use the default VLAN 0. In Power Profile mode, the switch default VLAN is VLAN 1 and VLAN 0 is reserved. When you change the default grandmaster clock VLAN, it must be changed to a VLAN other than 0.
■![]() When VLAN is disabled on the grandmaster clock, the PTP interface must be configured as an access port.
When VLAN is disabled on the grandmaster clock, the PTP interface must be configured as an access port.
■![]() All PHY PTP clocks are synchronized to the grandmaster clock. The switch system clock is not synchronized as part of PTP configuration and processes.
All PHY PTP clocks are synchronized to the grandmaster clock. The switch system clock is not synchronized as part of PTP configuration and processes.
■![]() When VLAN is enabled on the grandmaster clock, it must be in the same VLAN as the native VLAN of the PTP port on the switch.
When VLAN is enabled on the grandmaster clock, it must be in the same VLAN as the native VLAN of the PTP port on the switch.
■![]() Grandmaster clocks can drop untagged PTP messages when a VLAN is configured on the grandmaster clock. To force the switch to send tagged packets to the grandmaster clock, enter the global vlan dot1q tag native command.
Grandmaster clocks can drop untagged PTP messages when a VLAN is configured on the grandmaster clock. To force the switch to send tagged packets to the grandmaster clock, enter the global vlan dot1q tag native command.
–![]() You can enable this mode when the switch is in Power Profile Mode (Layer 2) or in Default Profile Mode (Layer 3).
You can enable this mode when the switch is in Power Profile Mode (Layer 2) or in Default Profile Mode (Layer 3).
–![]() You can enable this mode when the switch is in Power Profile Mode (Layer 2) or in Default Profile Mode (Layer 3).
You can enable this mode when the switch is in Power Profile Mode (Layer 2) or in Default Profile Mode (Layer 3).
–![]() When the switch is in Forward mode, the only global configuration available is the CLI command to switch to a different PTP mode (that is, boundary, e2etransparent, or p2ptransparent).
When the switch is in Forward mode, the only global configuration available is the CLI command to switch to a different PTP mode (that is, boundary, e2etransparent, or p2ptransparent).
–![]() You can enable this mode only when the switch is in Default Profile Mode (Layer 3).
You can enable this mode only when the switch is in Default Profile Mode (Layer 3).
–![]() When the switch is in E2E Transparent mode, the only global configuration available is the CLI command to switch to a different PTP mode (that is, boundary, p2ptransparent, or forward).
When the switch is in E2E Transparent mode, the only global configuration available is the CLI command to switch to a different PTP mode (that is, boundary, p2ptransparent, or forward).
–![]() You can enable this mode only when the switch is in Power Profile Mode (Layer 2).
You can enable this mode only when the switch is in Power Profile Mode (Layer 2).
–![]() When the switch is in P2P Transparent mode, the only global configuration available is the CLI command to switch to a different PTP mode (that is, boundary, e2etransparent, or forward).
When the switch is in P2P Transparent mode, the only global configuration available is the CLI command to switch to a different PTP mode (that is, boundary, e2etransparent, or forward).
–![]() You can enable this mode only when the switch is in Default Profile Mode.
You can enable this mode only when the switch is in Default Profile Mode.
■![]() Adaptive mode (ptp transfer filter adaptive) is not available in Power Profile mode or 802.1AS profile mode.
Adaptive mode (ptp transfer filter adaptive) is not available in Power Profile mode or 802.1AS profile mode.
PTP Interaction with Other Features
■![]() The following PTP clock modes do not support EtherChannels:
The following PTP clock modes do not support EtherChannels:
■![]() The following PTP clock modes only operate on a single VLAN:
The following PTP clock modes only operate on a single VLAN:
■![]() The NTP to PTP feature supports the Default E2E Profile only.
The NTP to PTP feature supports the Default E2E Profile only.
■![]() PTP is enabled on the switch by default.
PTP is enabled on the switch by default.
■![]() By default, the switch uses configuration values defined in the Default Profile (Default Profile mode is enabled).
By default, the switch uses configuration values defined in the Default Profile (Default Profile mode is enabled).
■![]() The switch default PTP clock mode is E2E Transparent Clock Mode.
The switch default PTP clock mode is E2E Transparent Clock Mode.
■![]() The default BC synchronization algorithm is linear filter.
The default BC synchronization algorithm is linear filter.
The Cisco IE 5000 uses a GNSS receiver with precise frequency and phase outputs for the host system. When connected to an external GNSS antenna, the receiver contains all the circuitry necessary to automatically acquire GNSS satellite signals, track up to 32 GNSS satellites, and compute location, speed, heading, and time. It provides an accurate one pulse-per-second (PPS) and stable 10 MHz frequency output.
The GNSS chip supports the following frequency bands:
■![]() GPS/NAVSTAR—Global Positioning System-USA: L1
GPS/NAVSTAR—Global Positioning System-USA: L1
■![]() GLONASS—Global'naya Navigatsionnaya Sputnikovaya Sistema-Russia: L1/G1
GLONASS—Global'naya Navigatsionnaya Sputnikovaya Sistema-Russia: L1/G1
■![]() BeiDou—China (including B1-2)
BeiDou—China (including B1-2)
Note: The Galileo satellite system is not currently supported in the released software.
Cisco IE 5000 PTP Default Profile Grandmaster Clock Configuration Example
Cisco IE 5000 PTP Default Profile Boundary Clock Configuration Example
Note: The Cisco Catalyst 9300 PTP default profile only supports Layer 2 in the released software, adding SVI configure.
Configuring Cisco IE 4000
For the Cisco IE 4000 PTP Configuration Guide and Restrictions and Limitations for PTP, refer to Configuring Cisco IE 5000.
Cisco IE 4000 PTP Default Profile Boundary Clock Configuration Example
Configuring Cisco IE 3000
For the Cisco IE 3000 PTP Configuration Guide and Restrictions and Limitations for PTP, refer to Configuring Cisco IE 5000.
Cisco IE 3000 PTP Default Profile Boundary Clock
Note: The Cisco IE 3000 PTP default profile uses End-to-End Transparent Clock, so no configuration is required.
Cisco IE 3000 PTP Default Profile Boundary Clock Configuration Example
Note: The Cisco IE 3000 PTP default profile uses End-to-End Transparent Clock, so no configuration is required.
Configuring Cisco IE 3400
For the Cisco IE 3400 PTP Configuration Guide and Restrictions and Limitations for PTP, refer to Configuring Cisco IE 5000.
Cisco IE 3400 PTP Default Profile Boundary Clock
Note: The Cisco IE 3400 PTP default profile uses End-to-End Transparent Clock, so no configuration is required.
Cisco IE 3400 PTP Default Profile Boundary Clock Configuration Example
Note: The Cisco IE 3400 PTP default profile uses End-to-End Transparent Clock, so no configuration is required.
Performance
This section describes the performance characterization results of Cisco products for site-wide precision time. Tests were performed for 24 hours to validate product stability. Table 8 through Intermediate Precision Site-wide Grandmaster Clock Time Distribution Model—Cisco IE 3400 provide the time accuracy values by products.
|
|
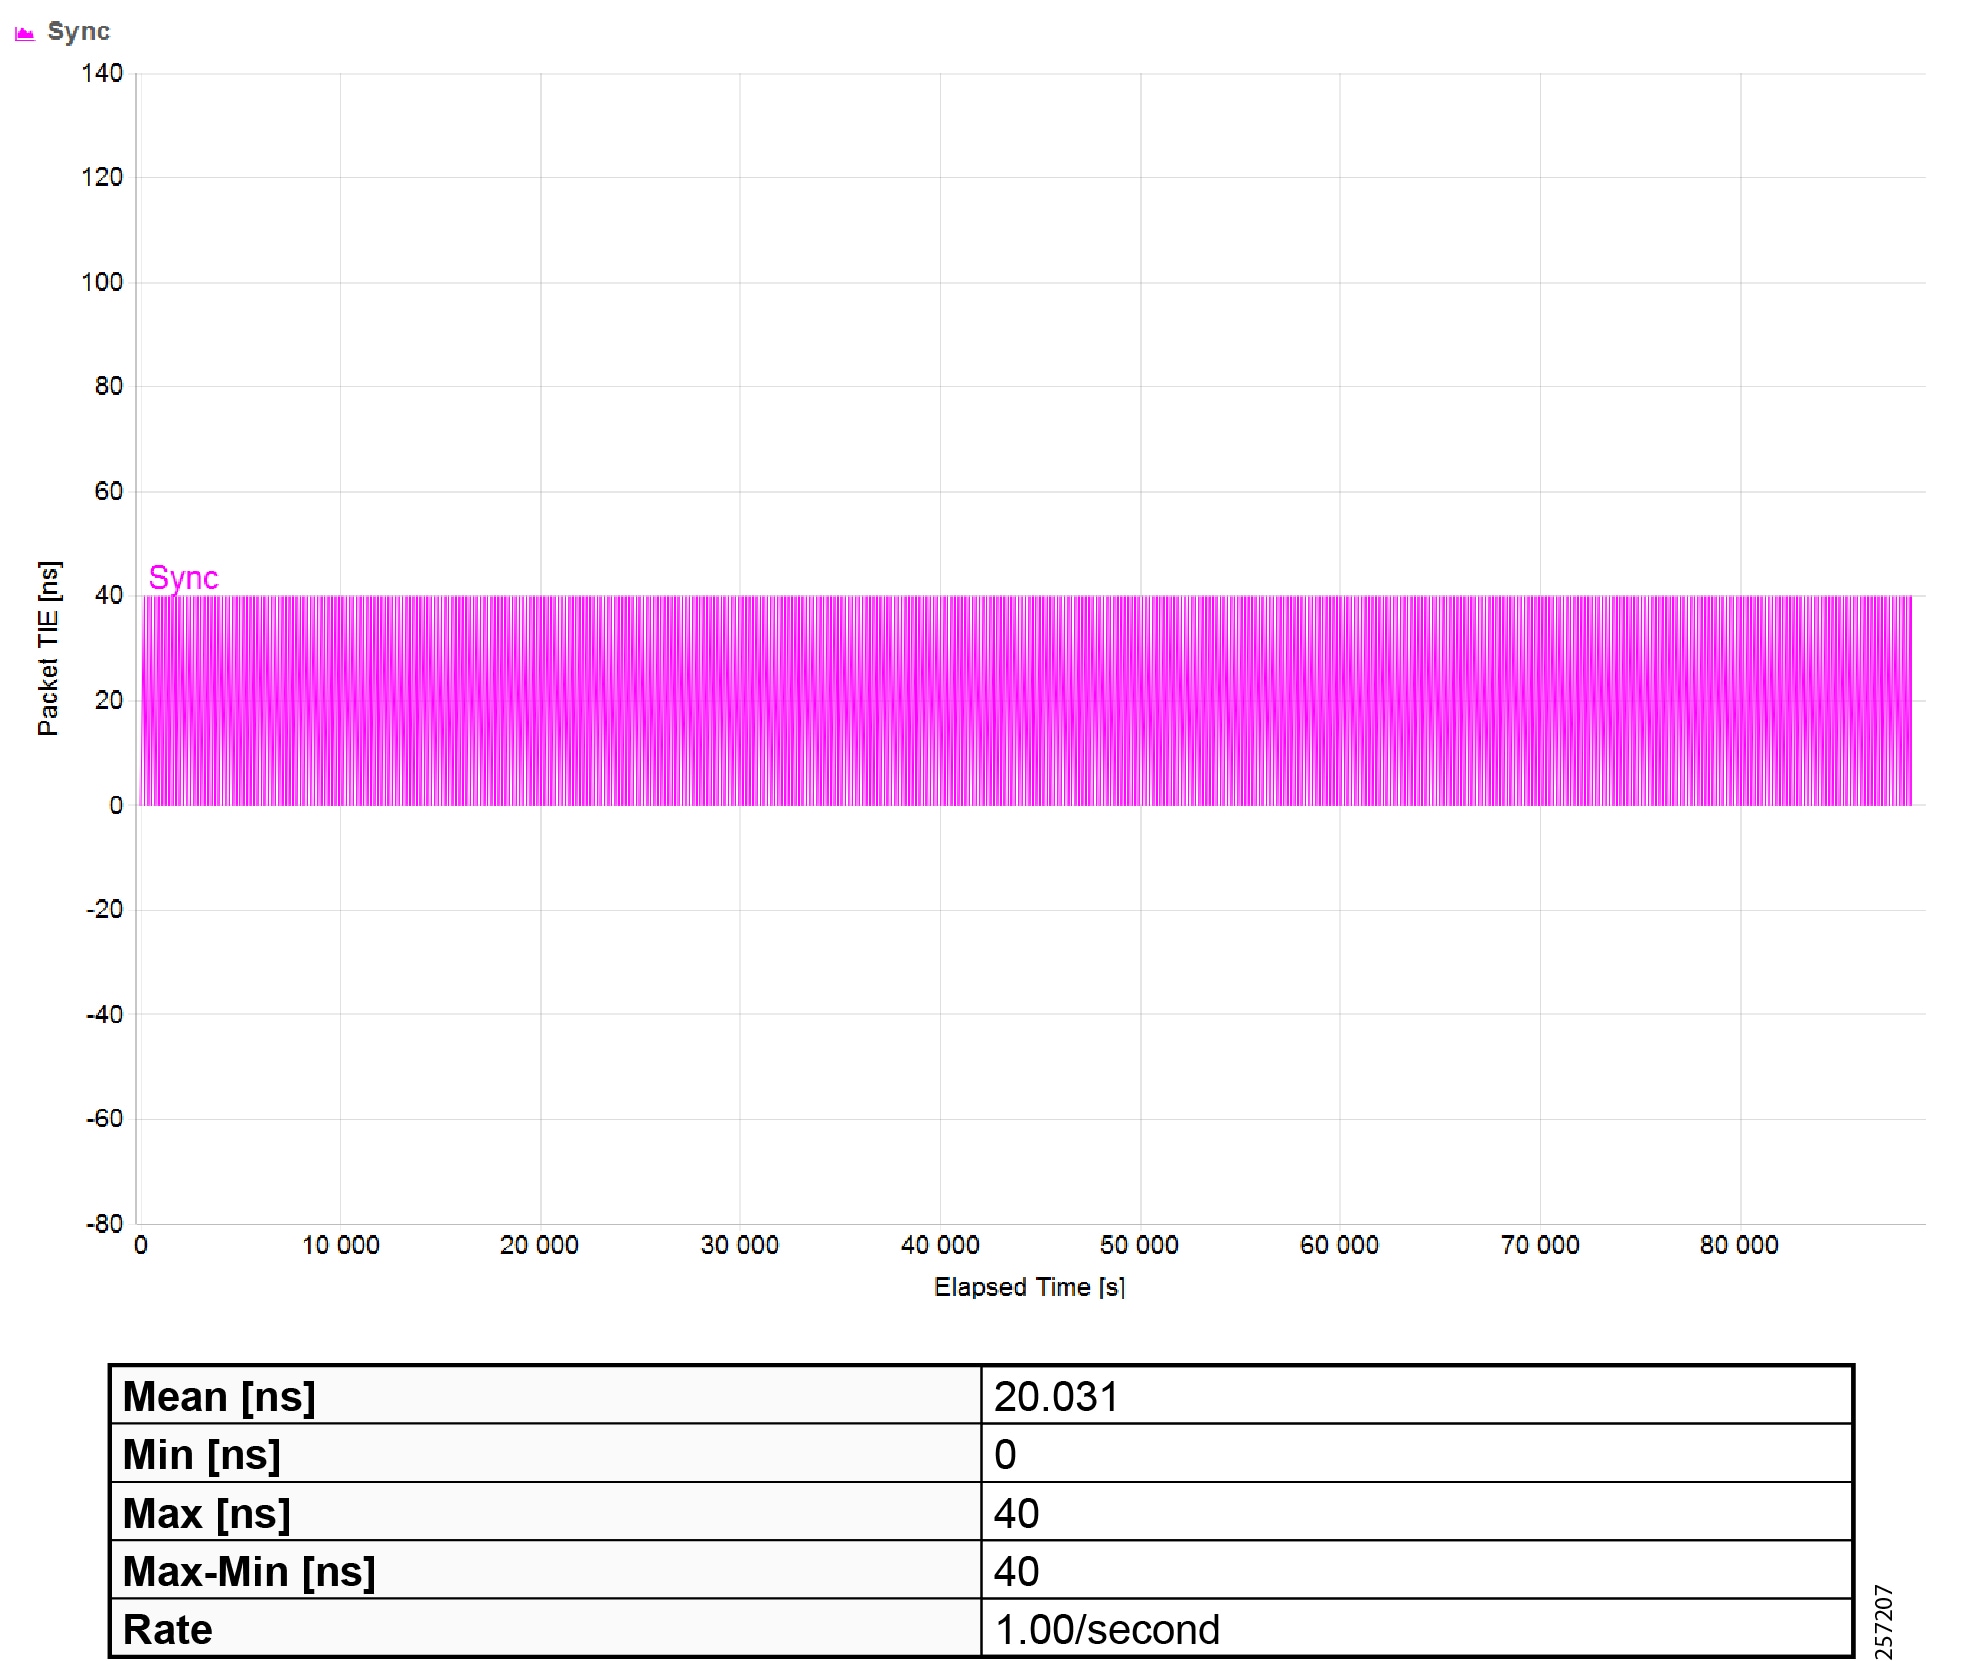
|
|
Maximum Time Interval Error (MTIE) |
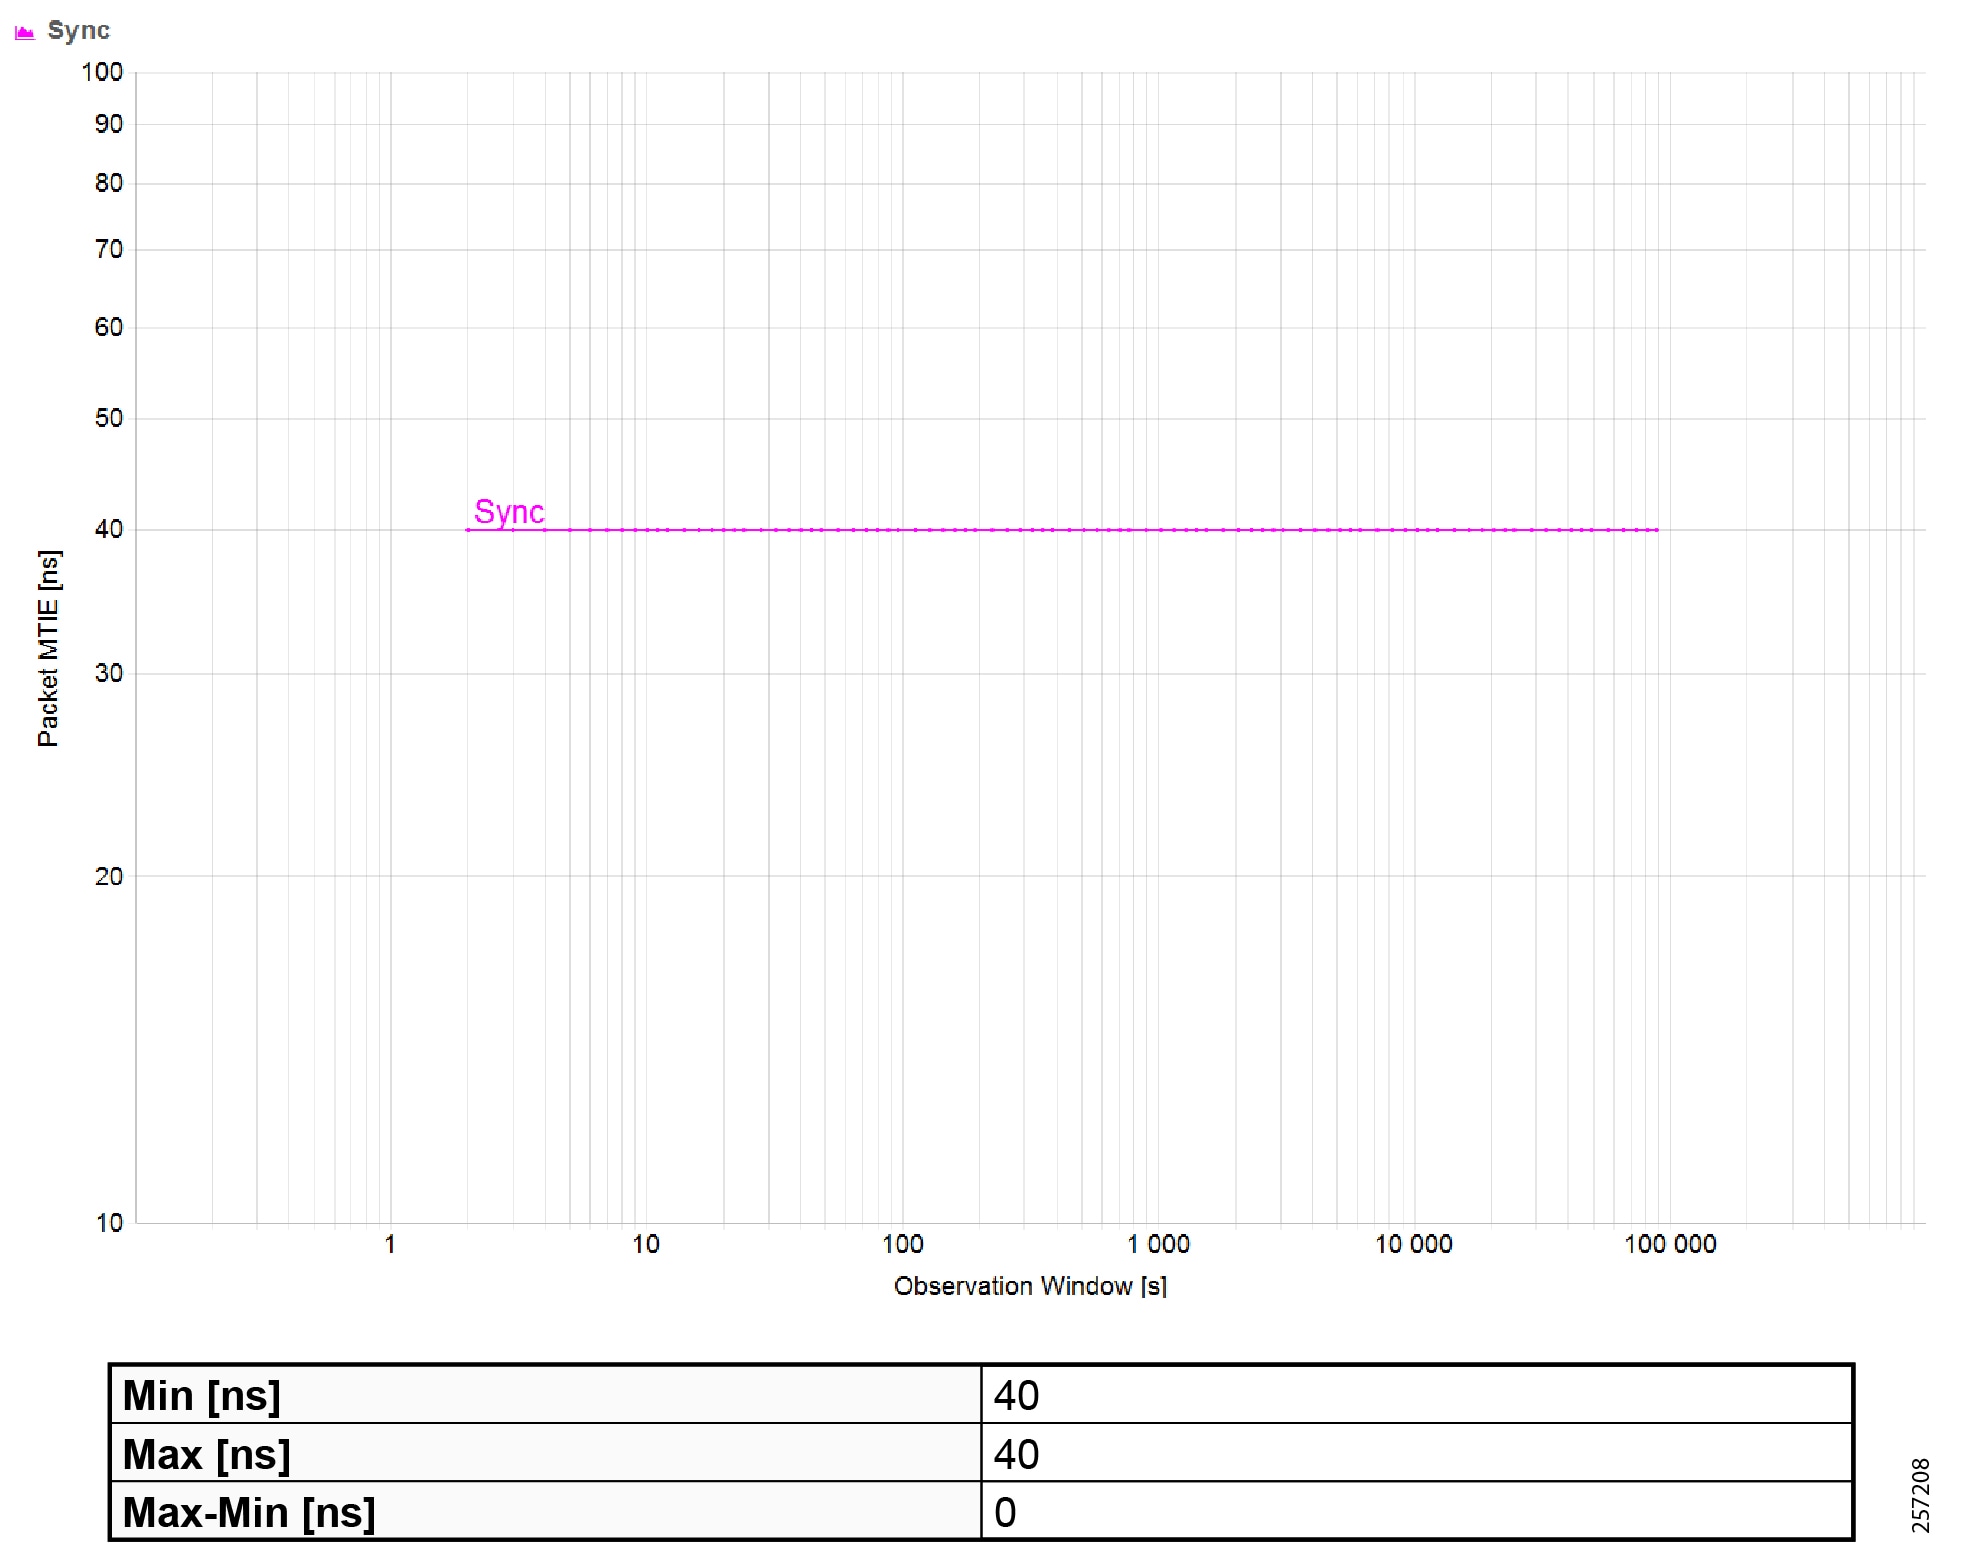
|
|
|
|
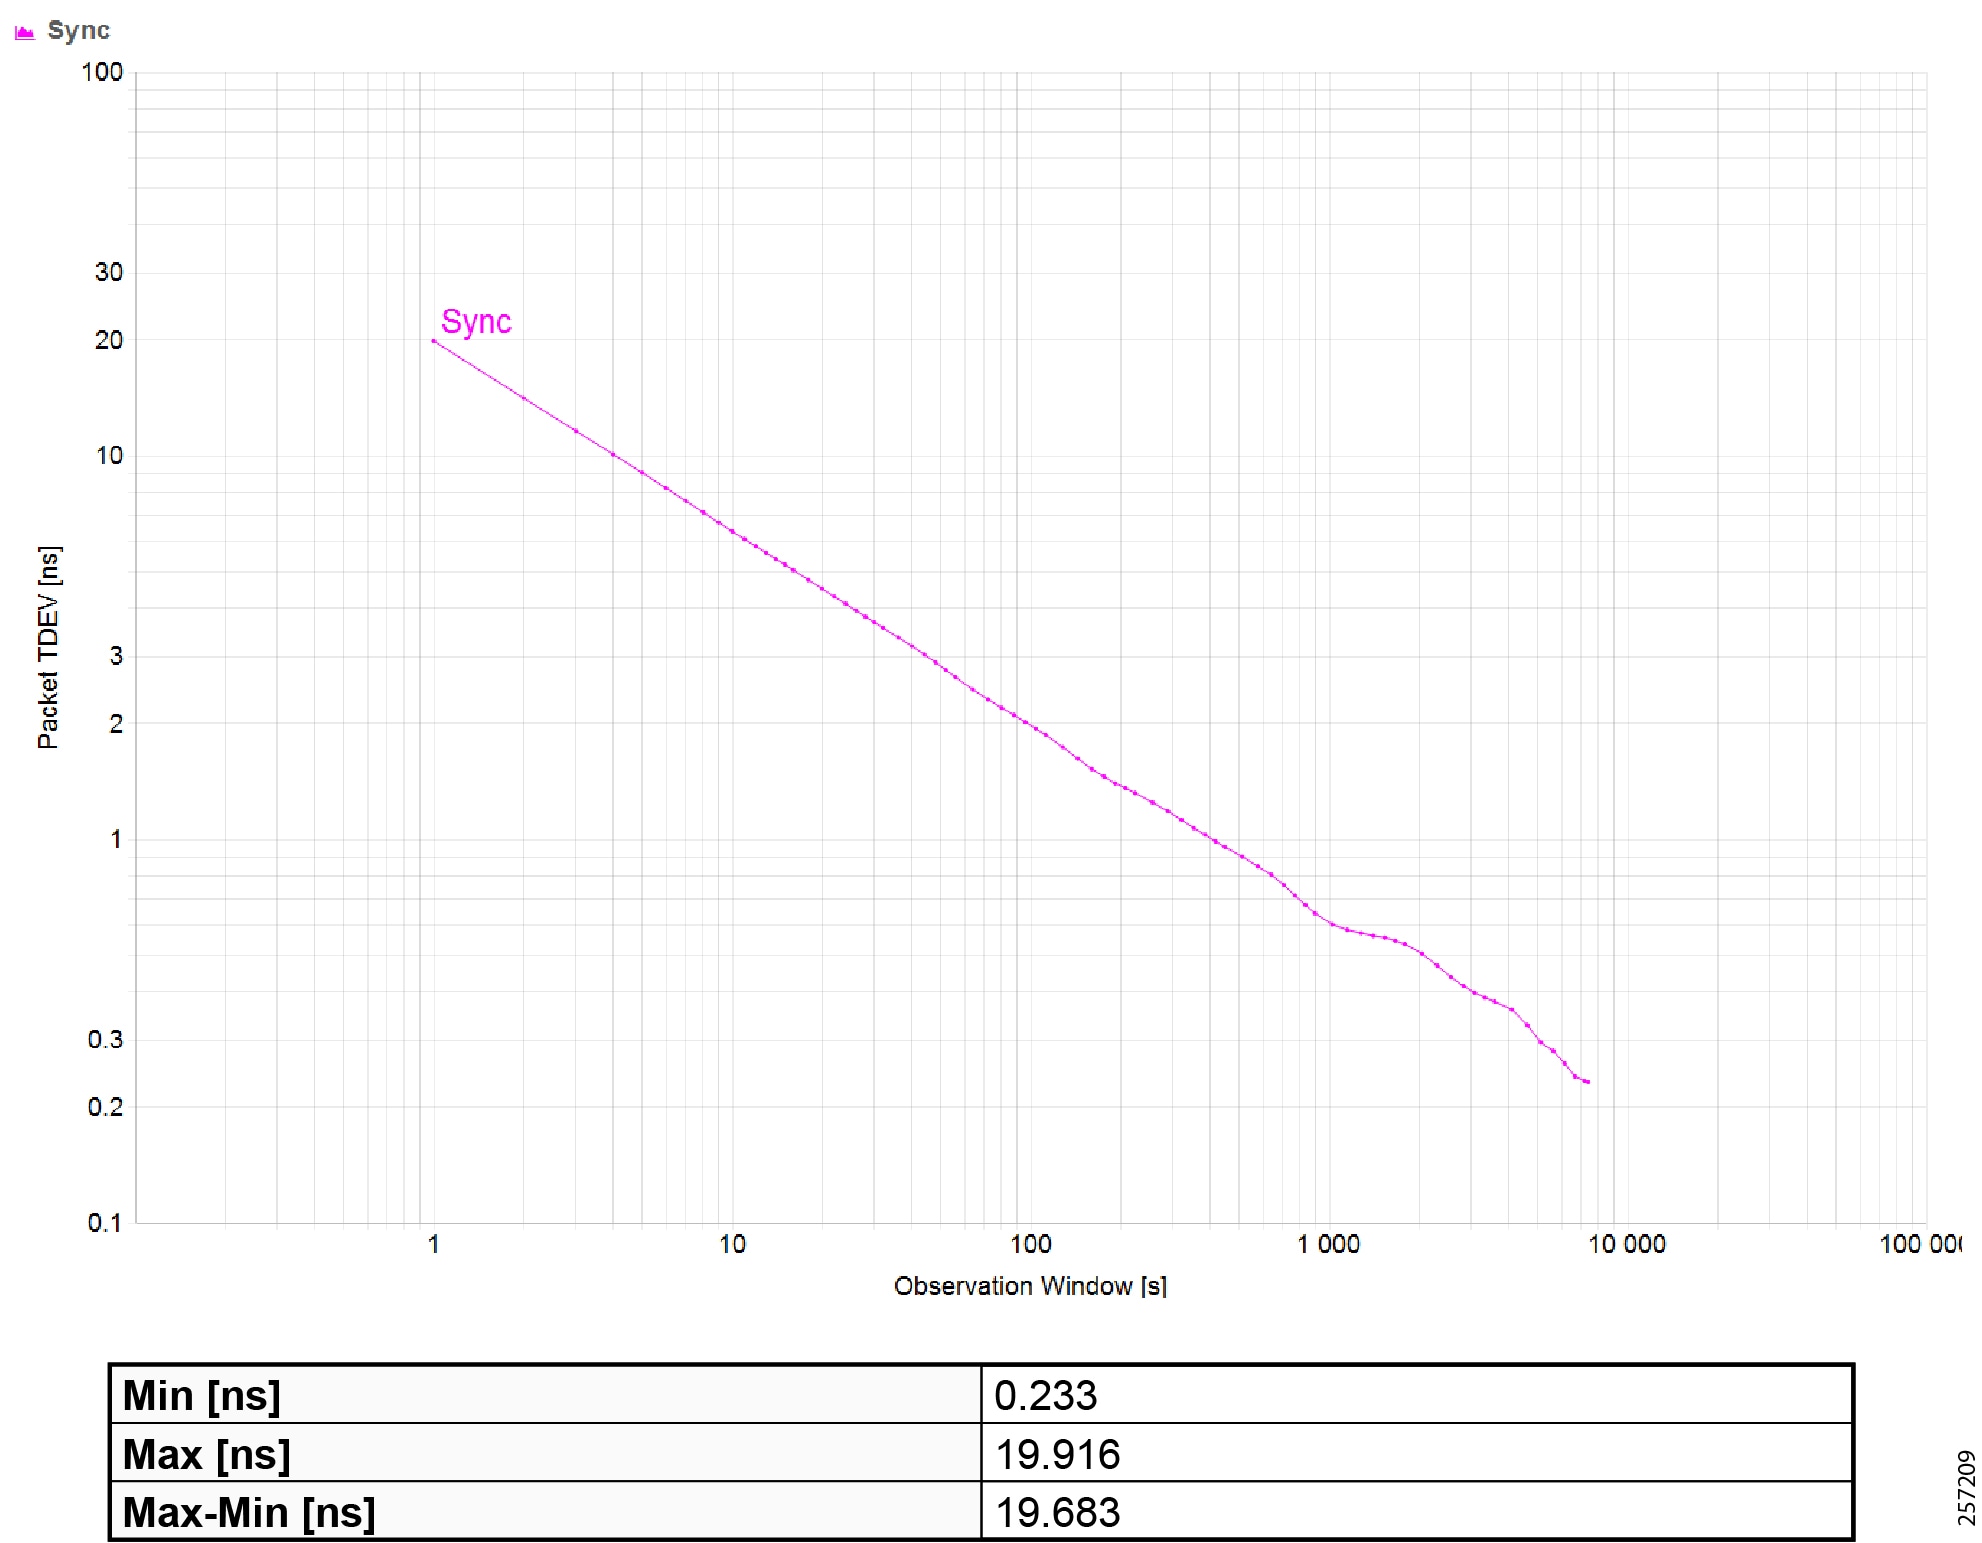
|
|
|
|
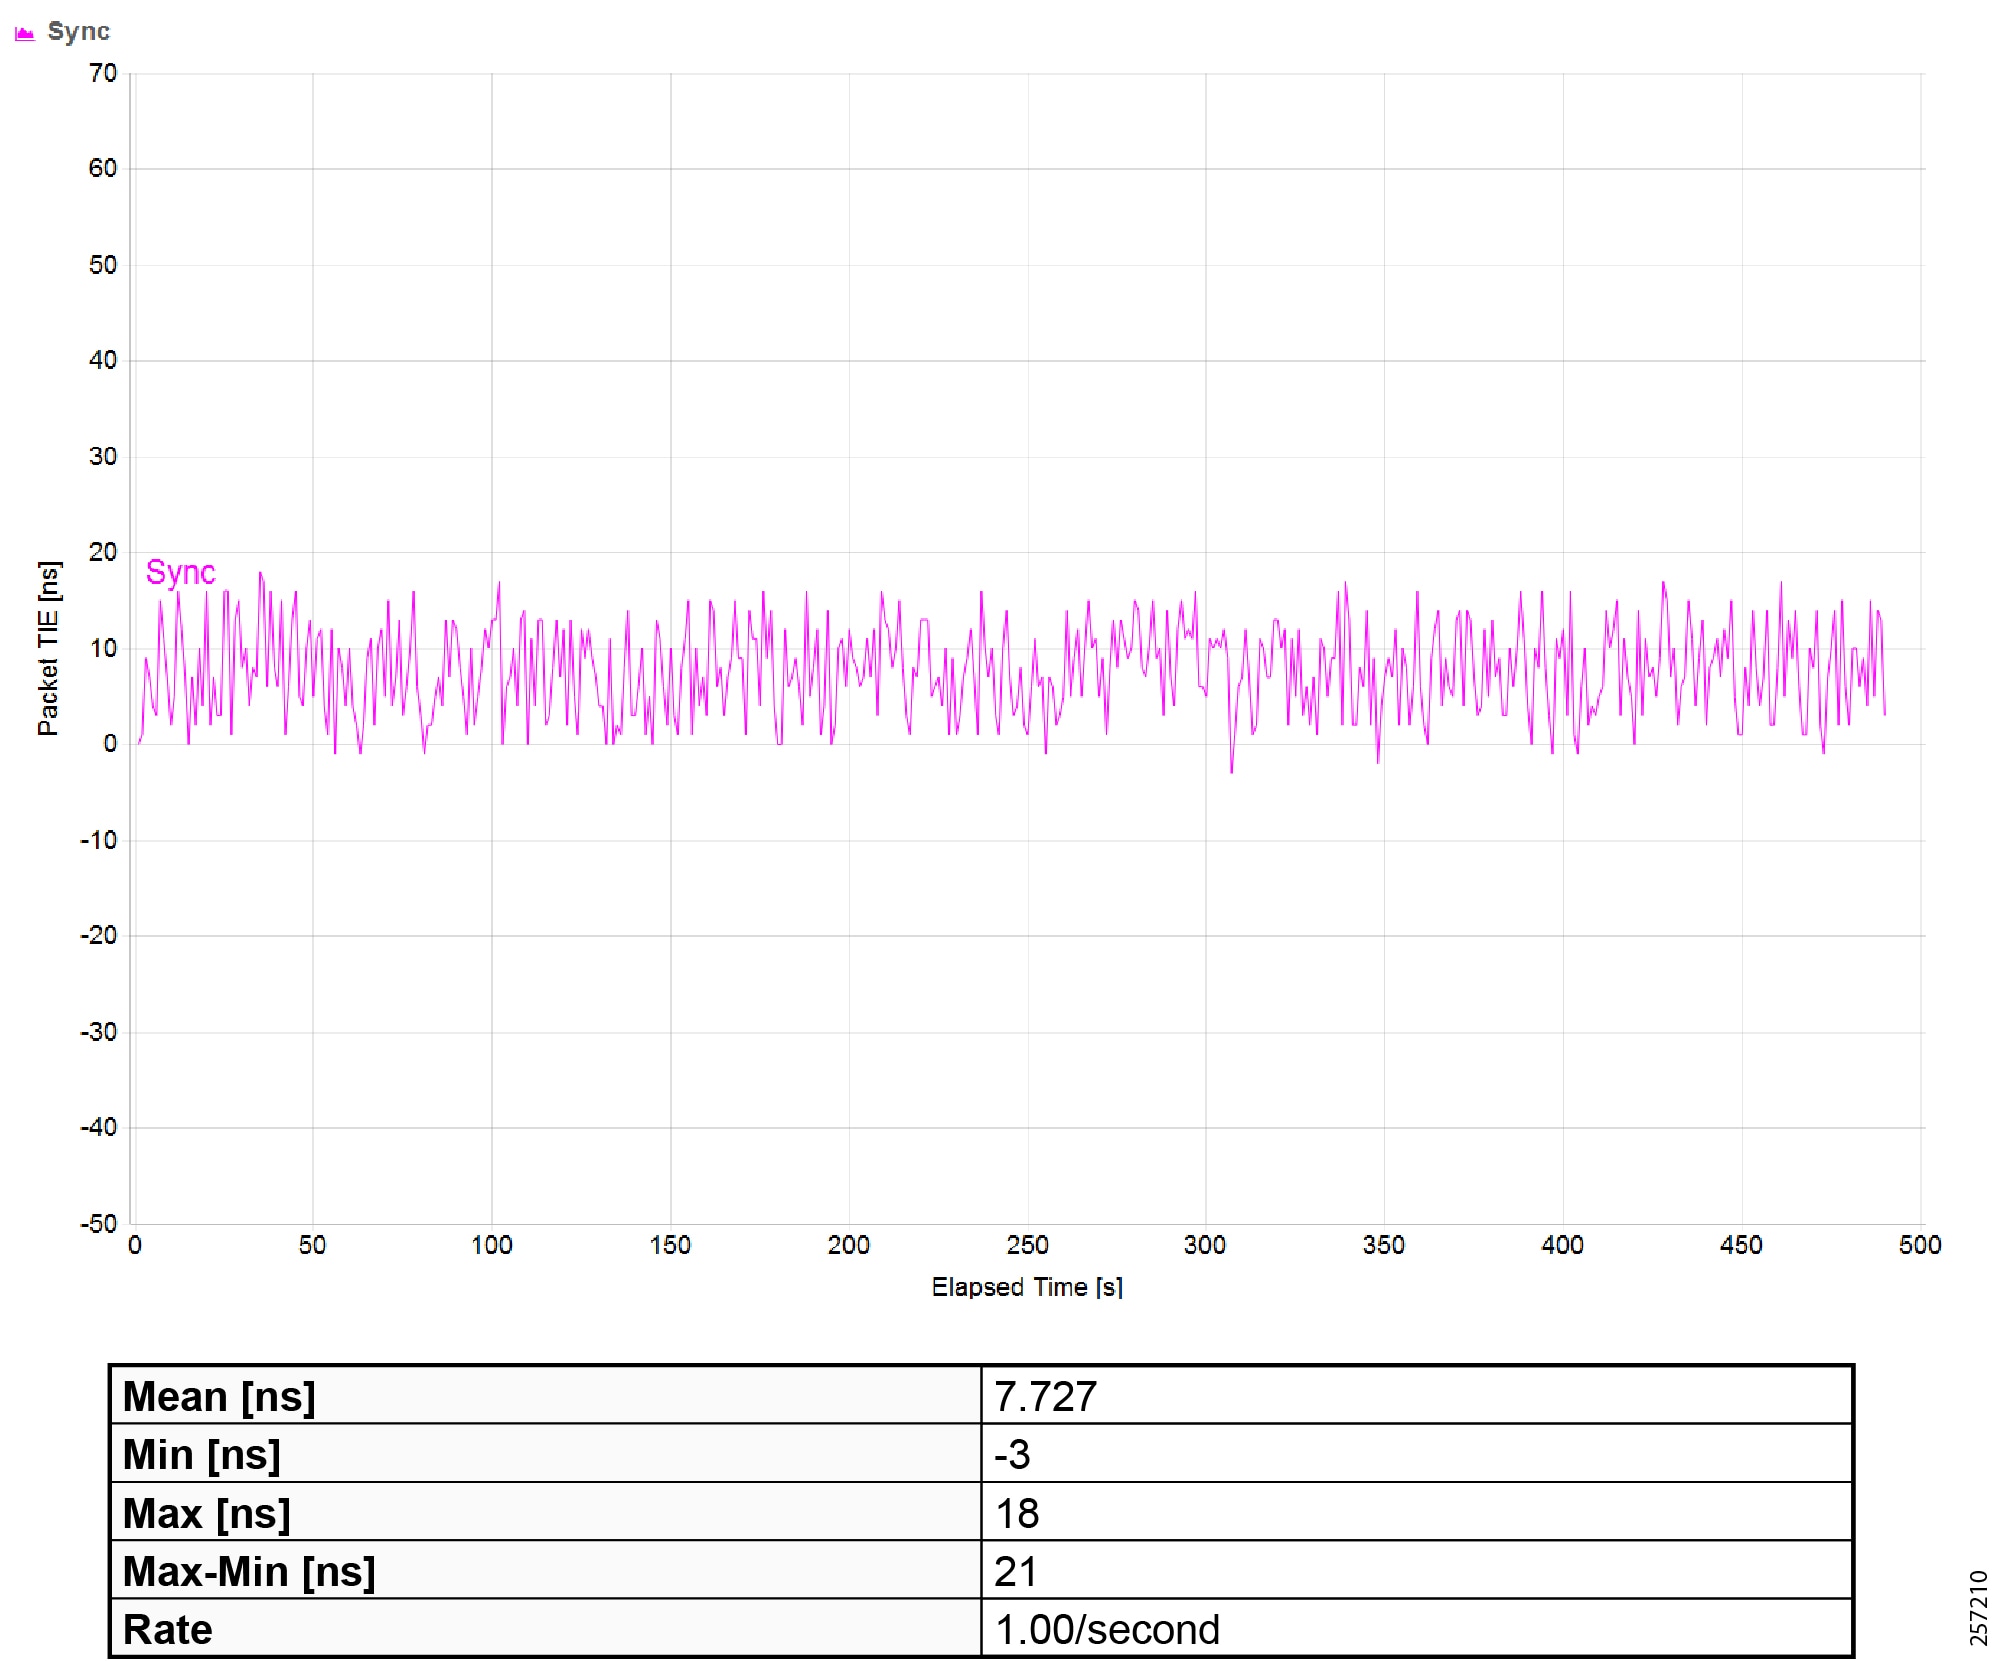
|
|
Maximum Time Interval Error (MTIE) |
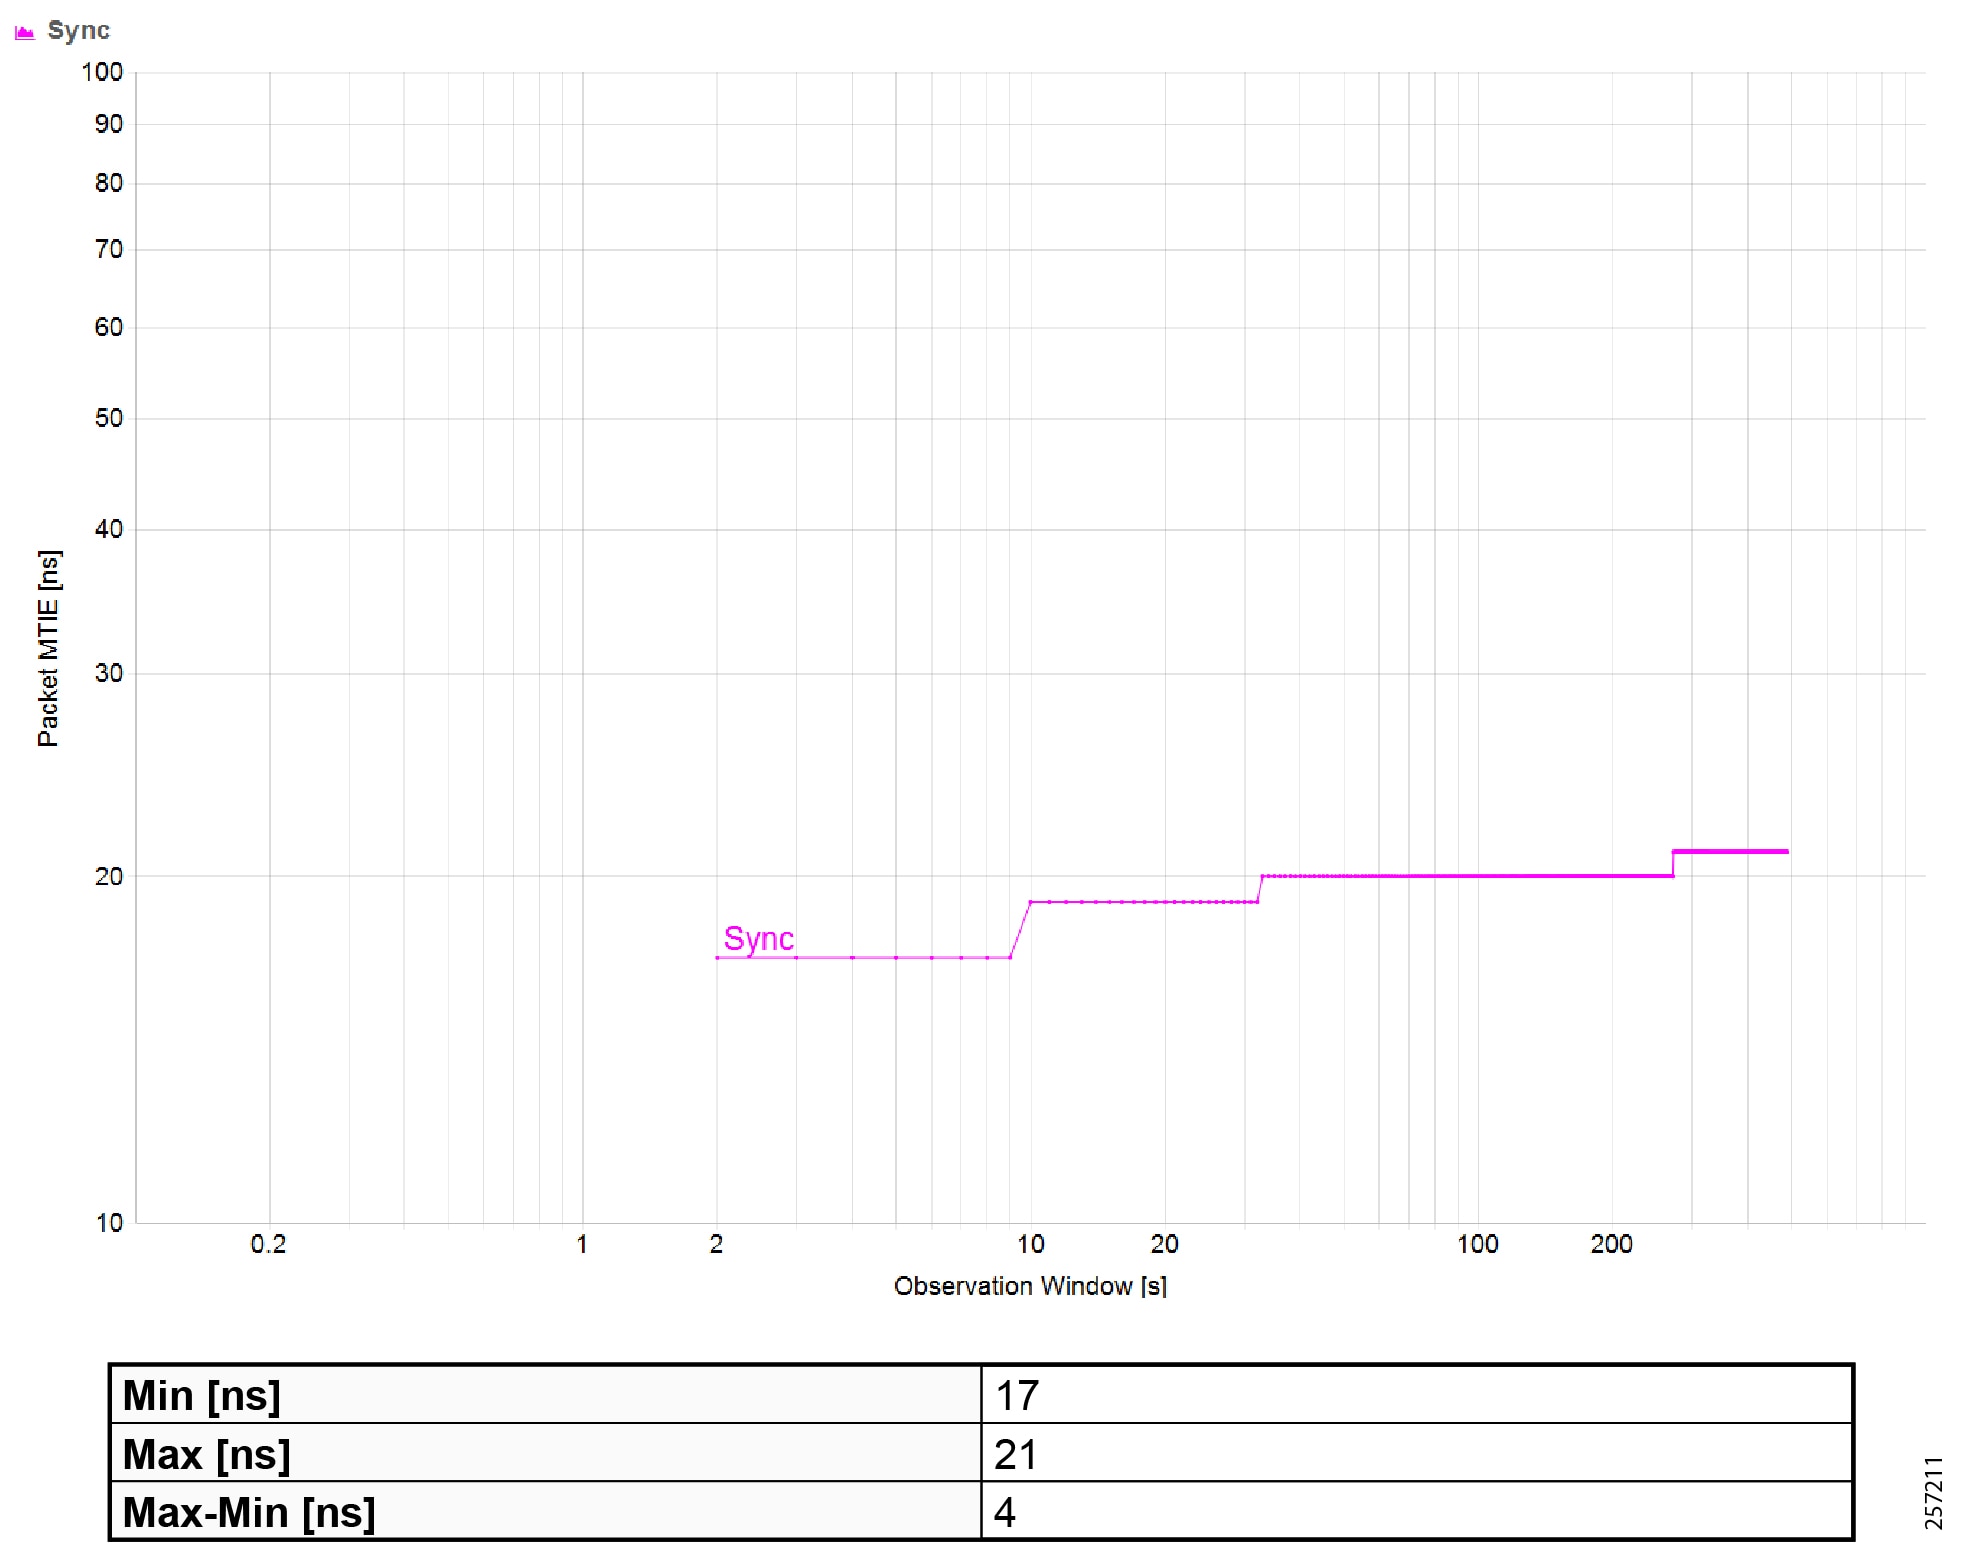
|
|
|
|
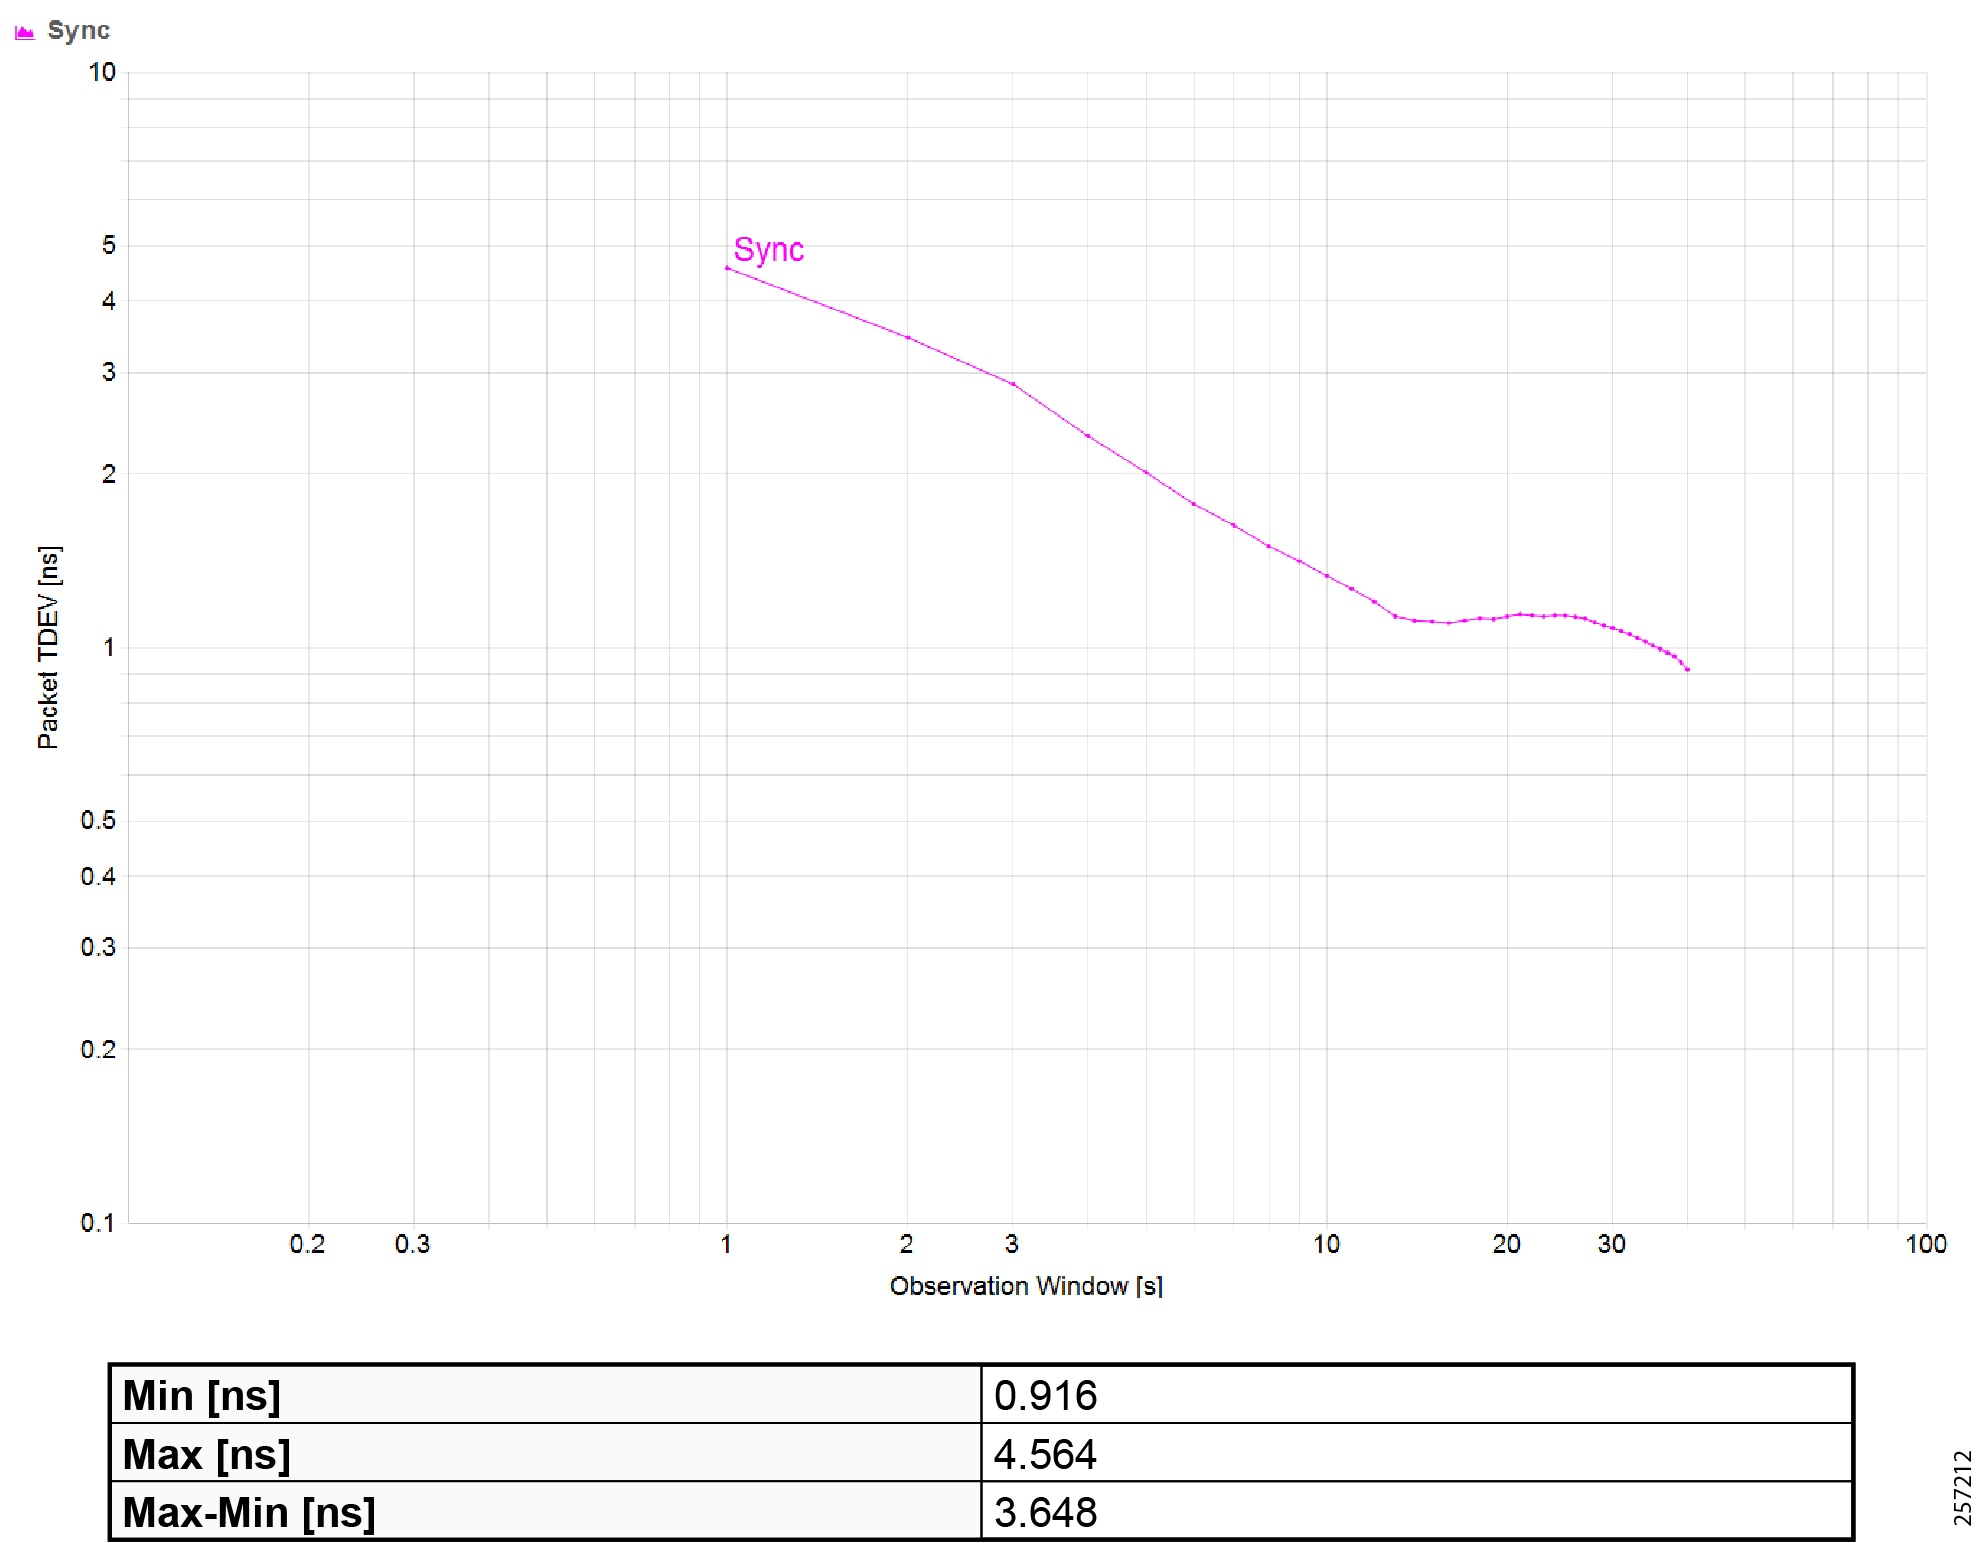
|
|
|
|
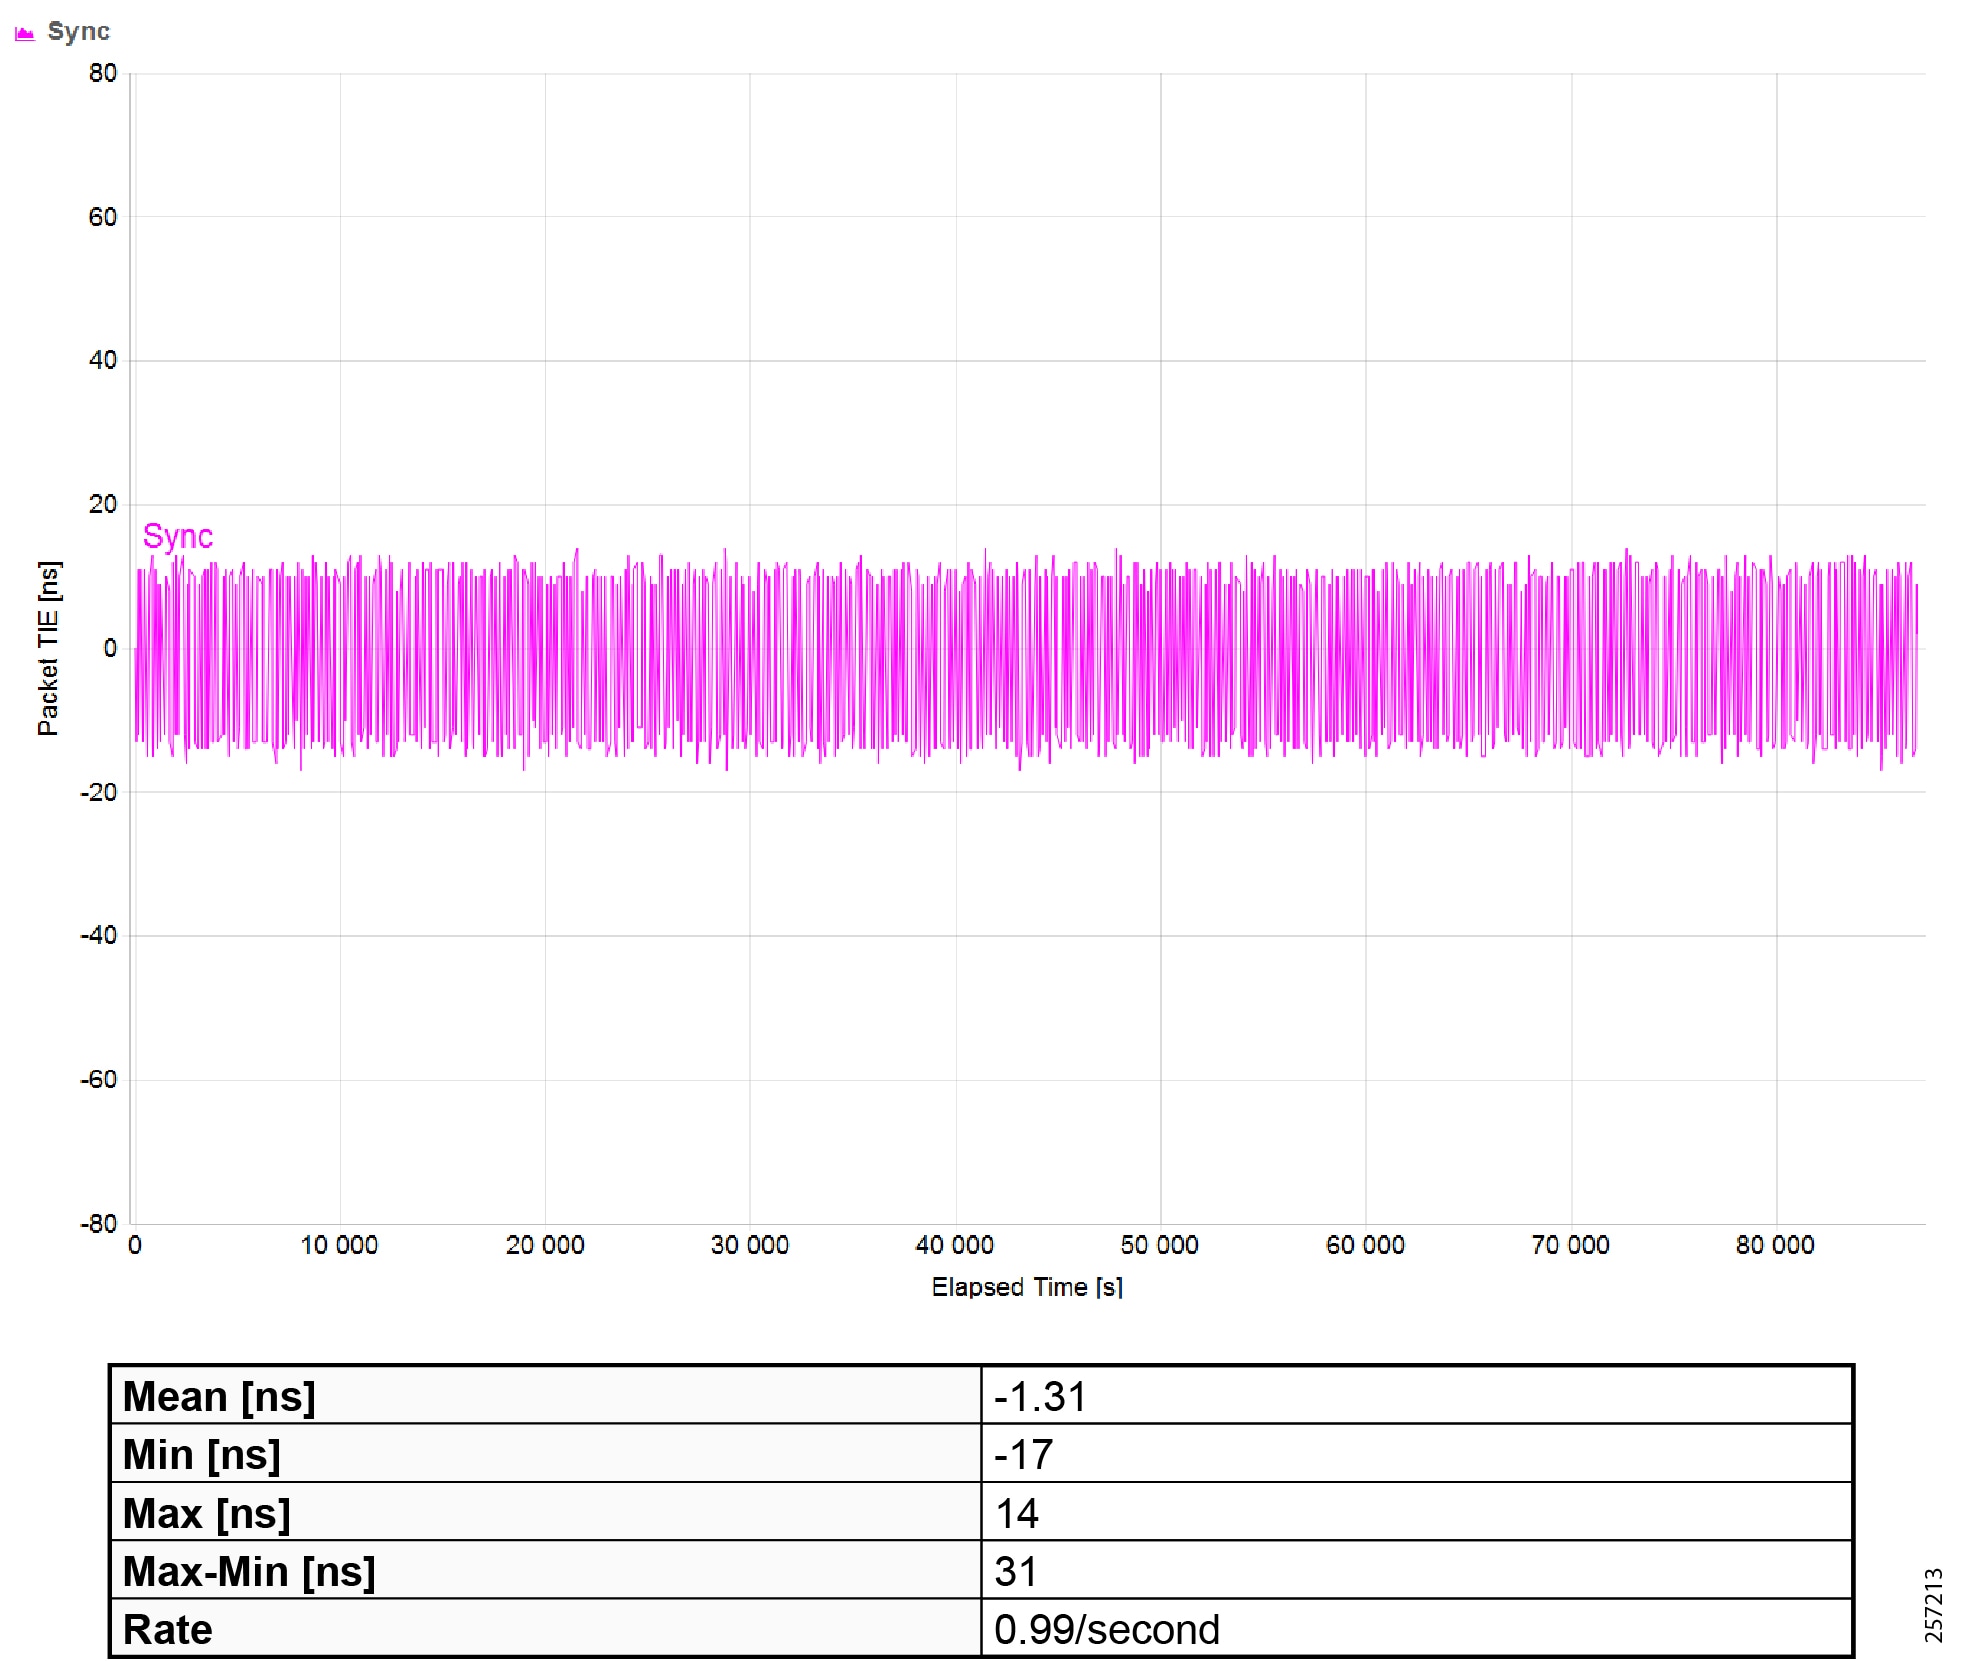
|
|
Maximum Time Interval Error (MTIE) |
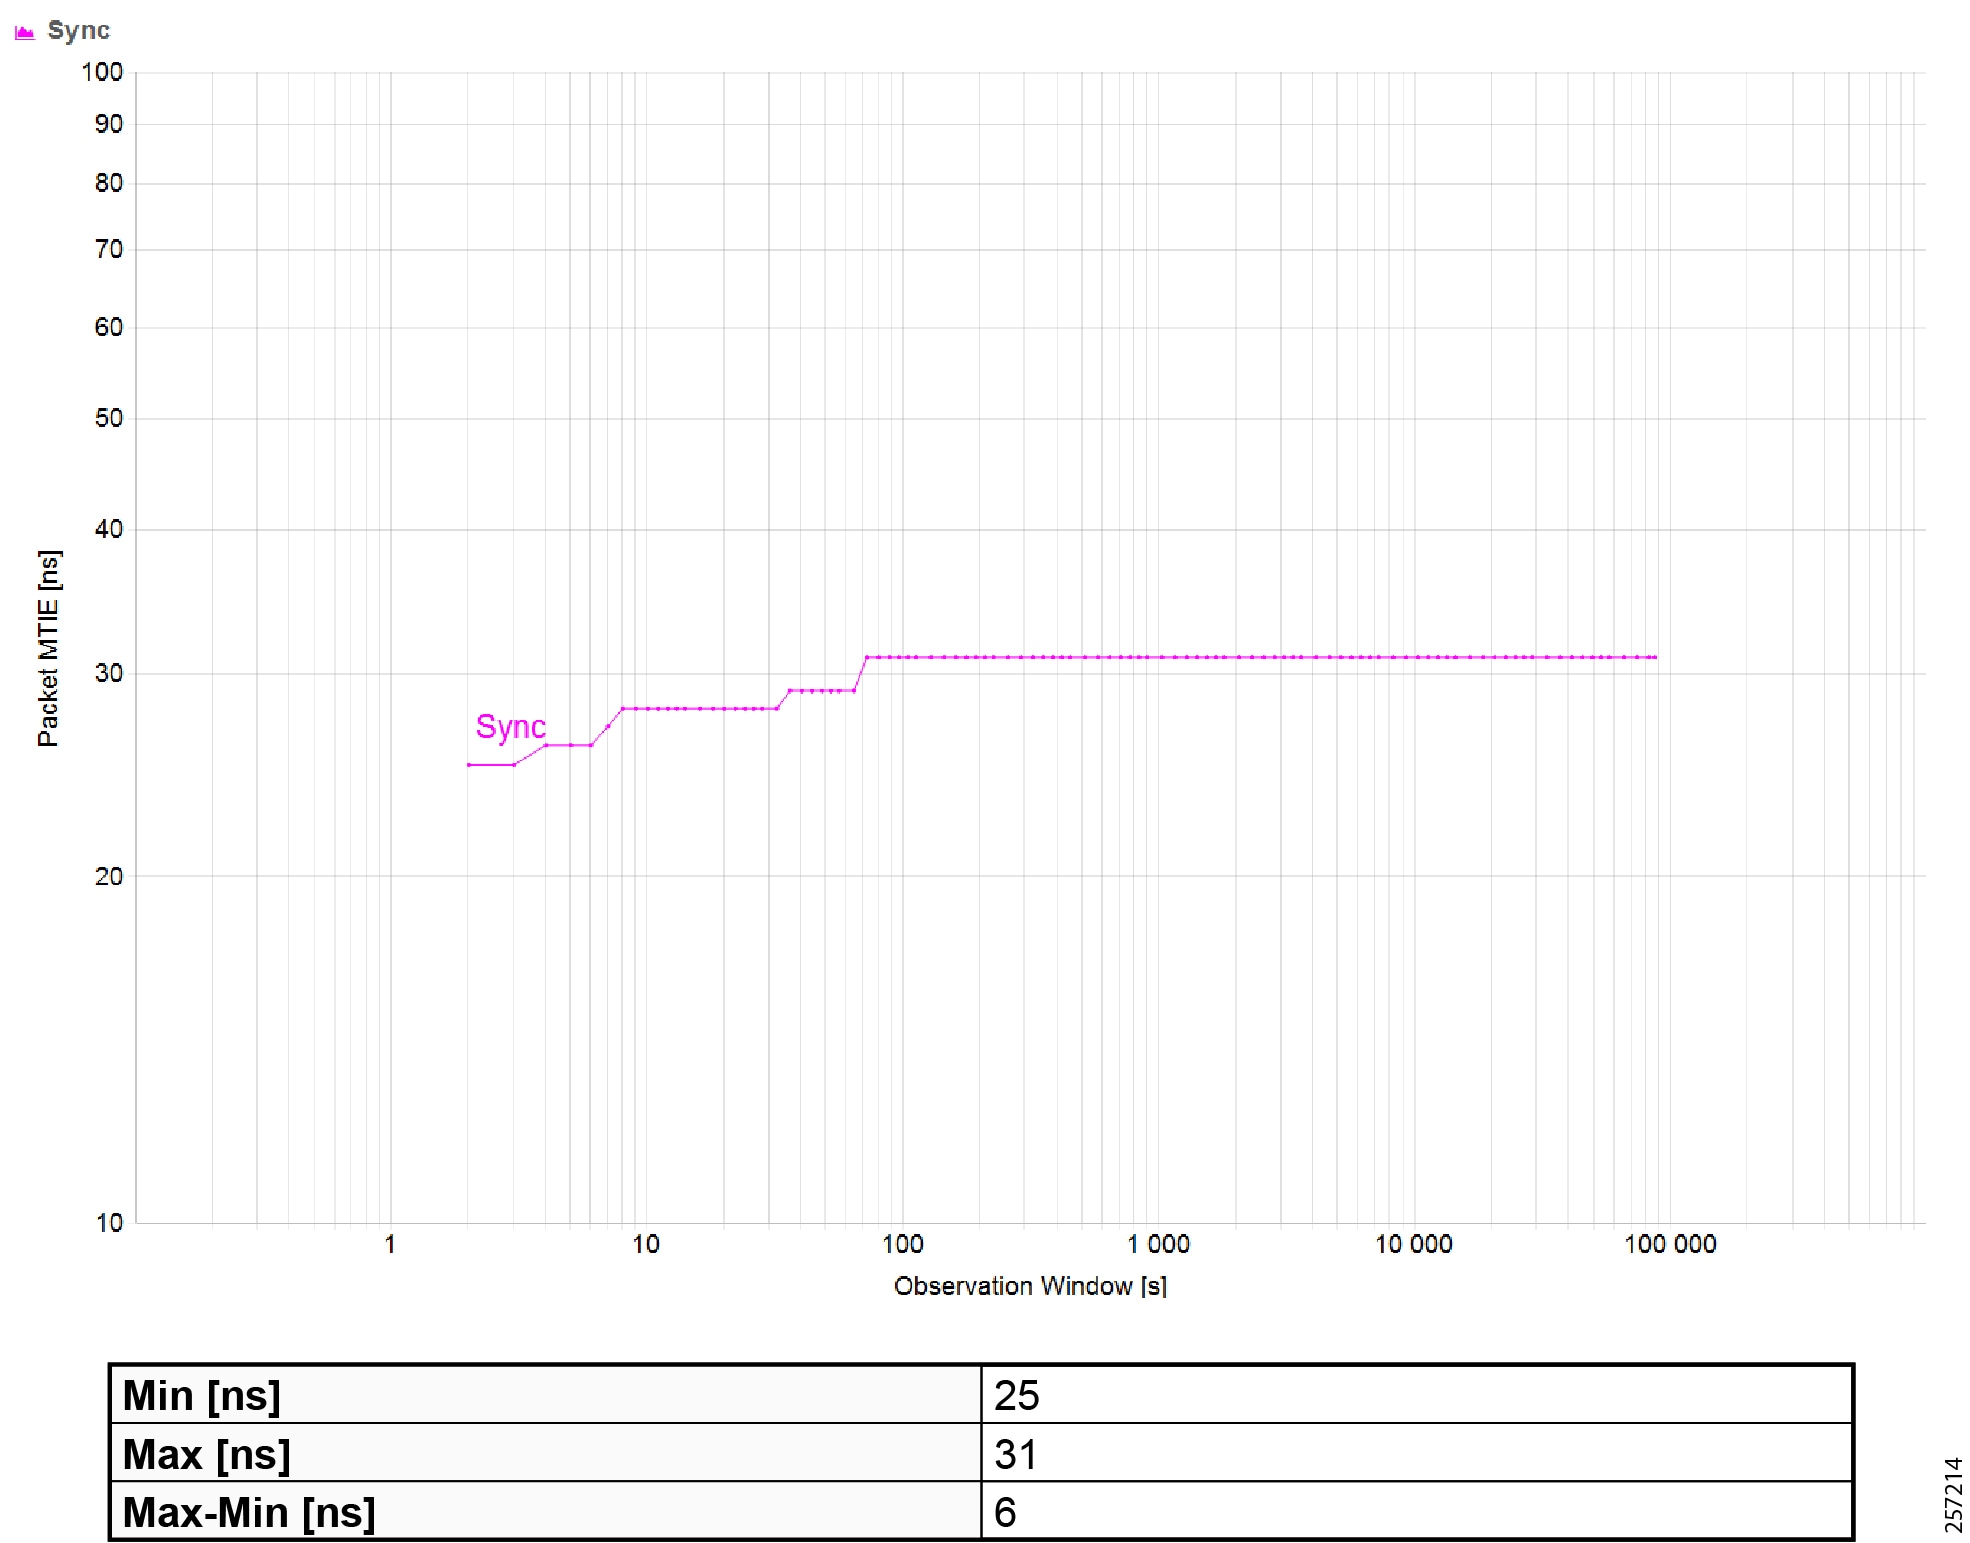
|
|
|
|
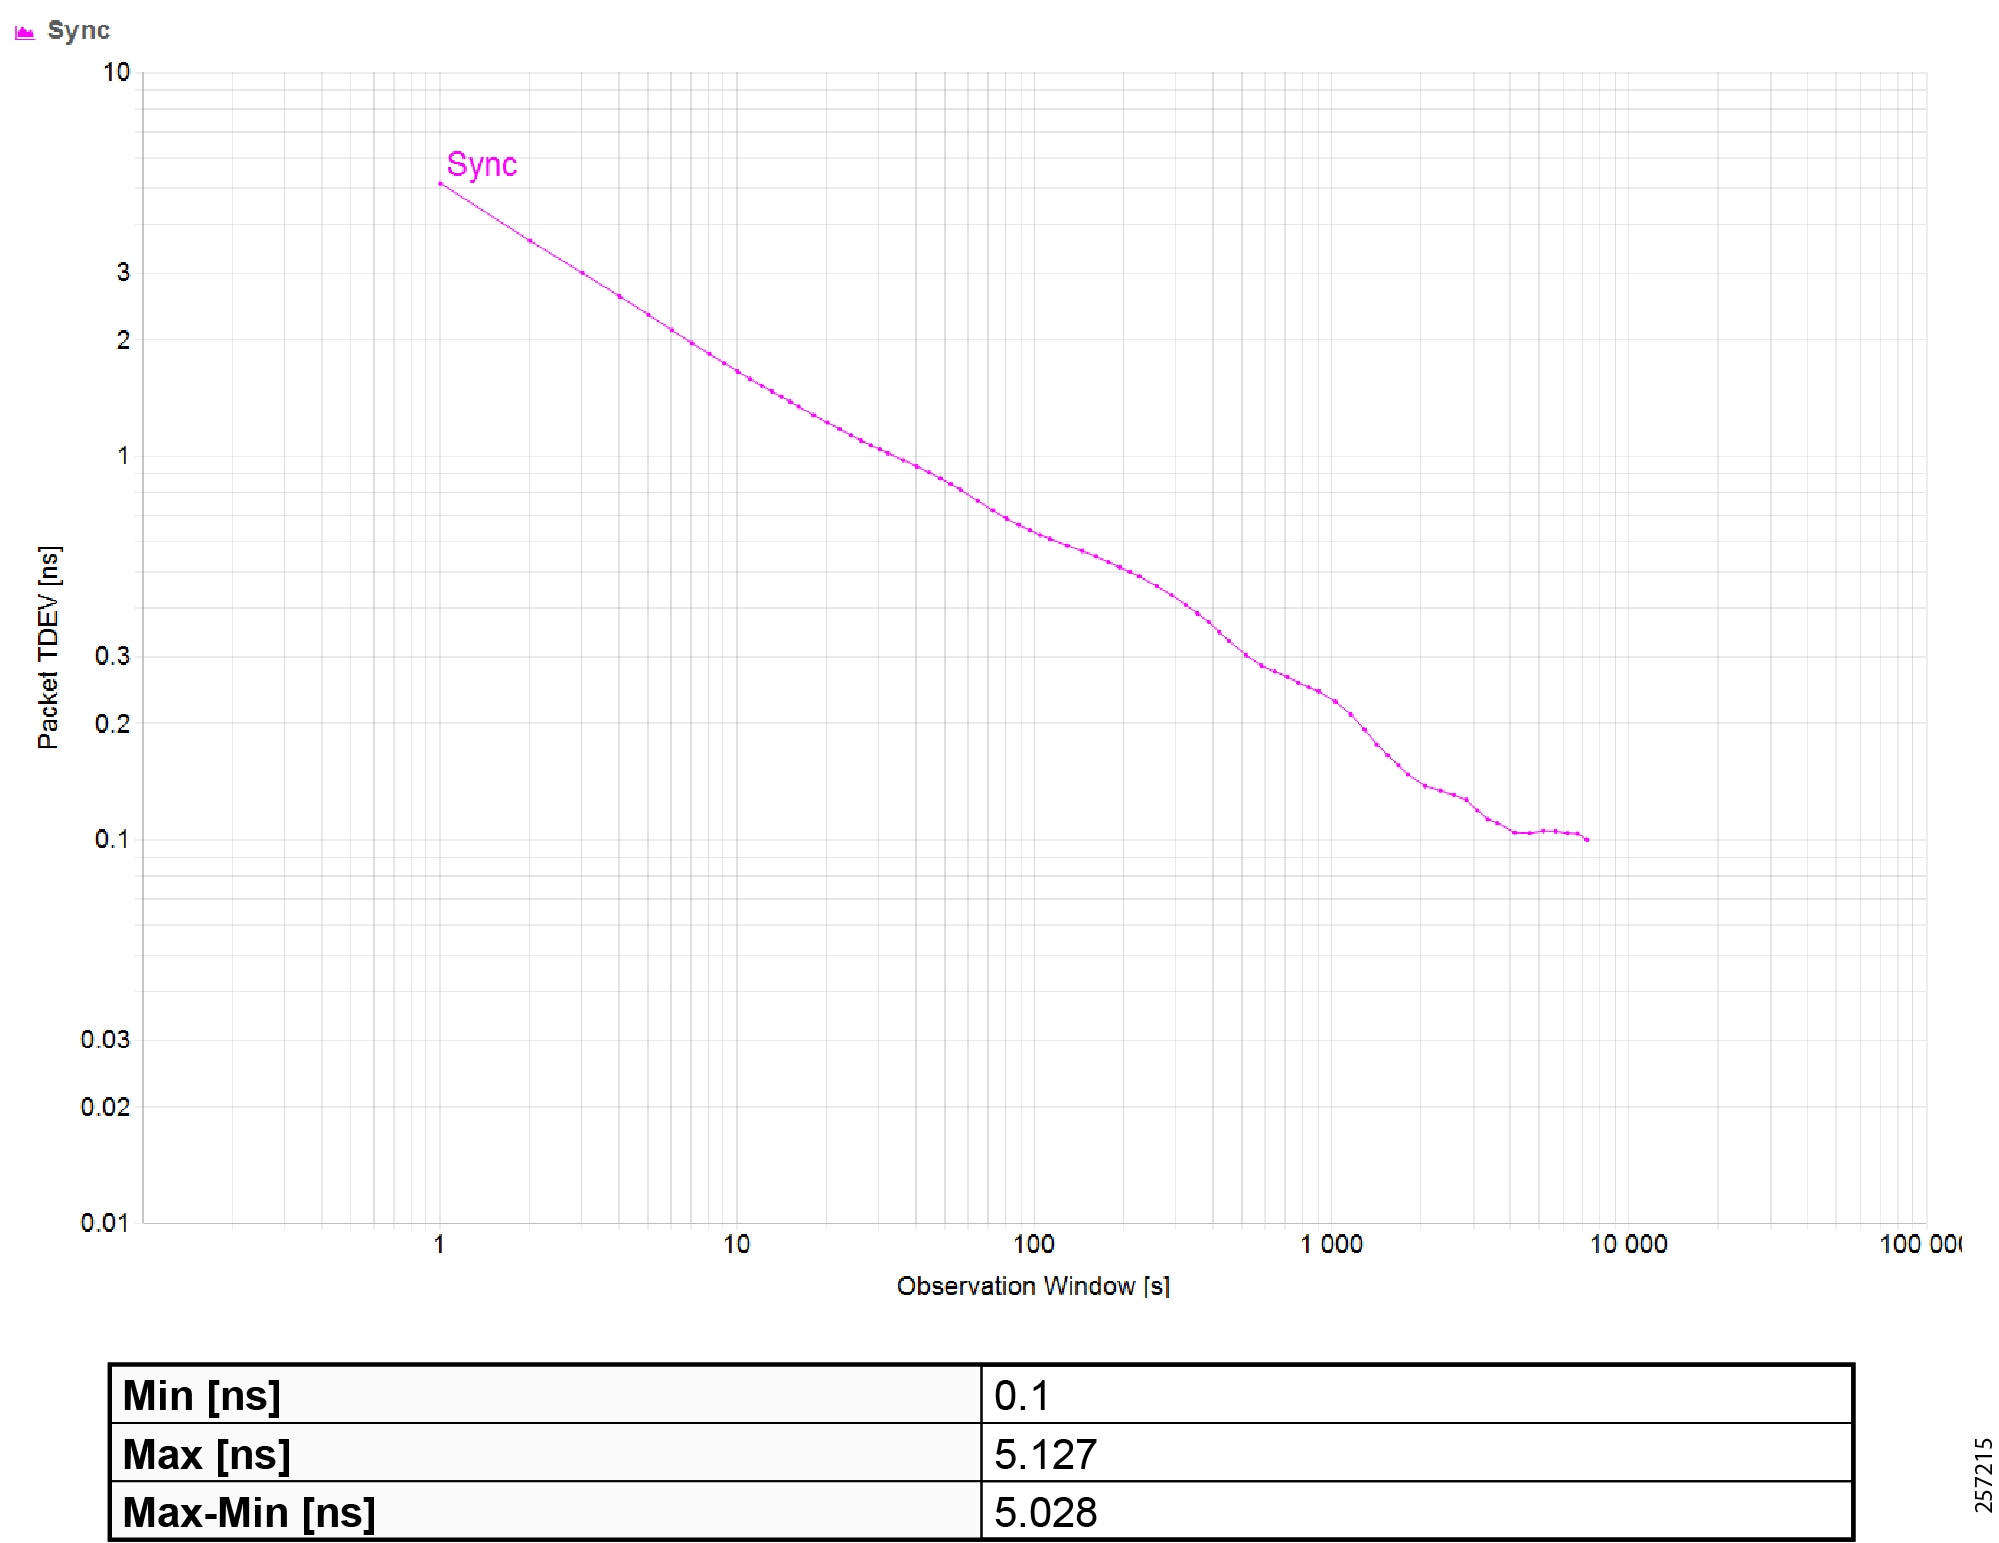
|
|
|
|
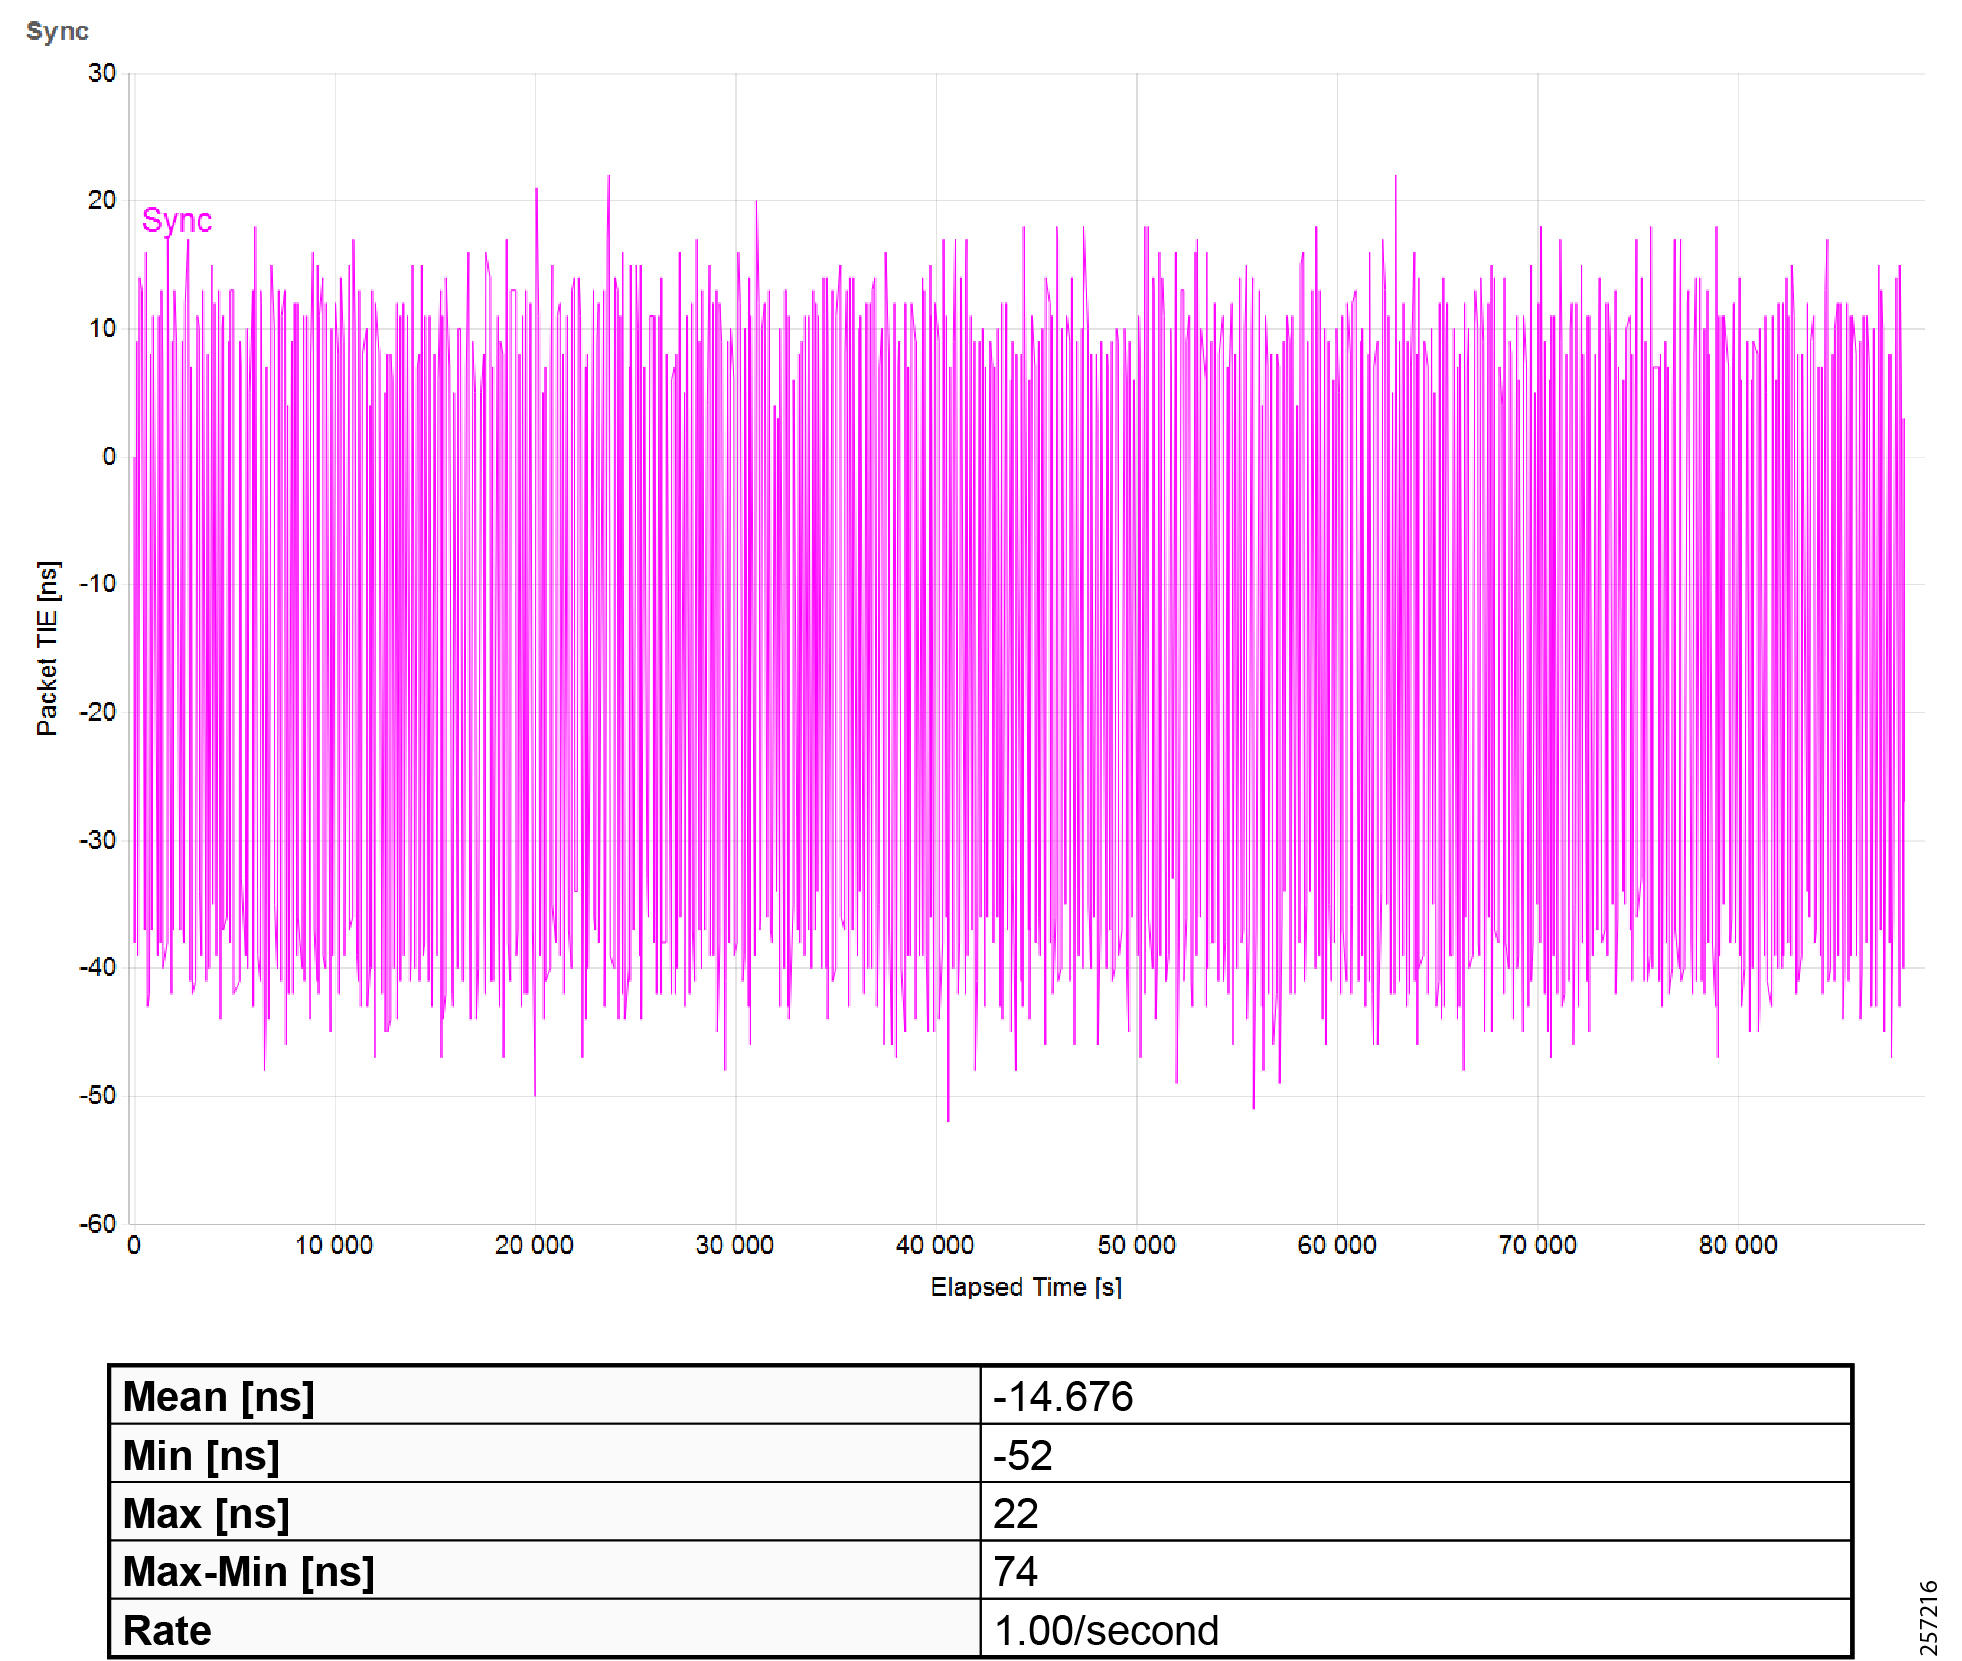
|
|
Maximum Time Interval Error (MTIE) |
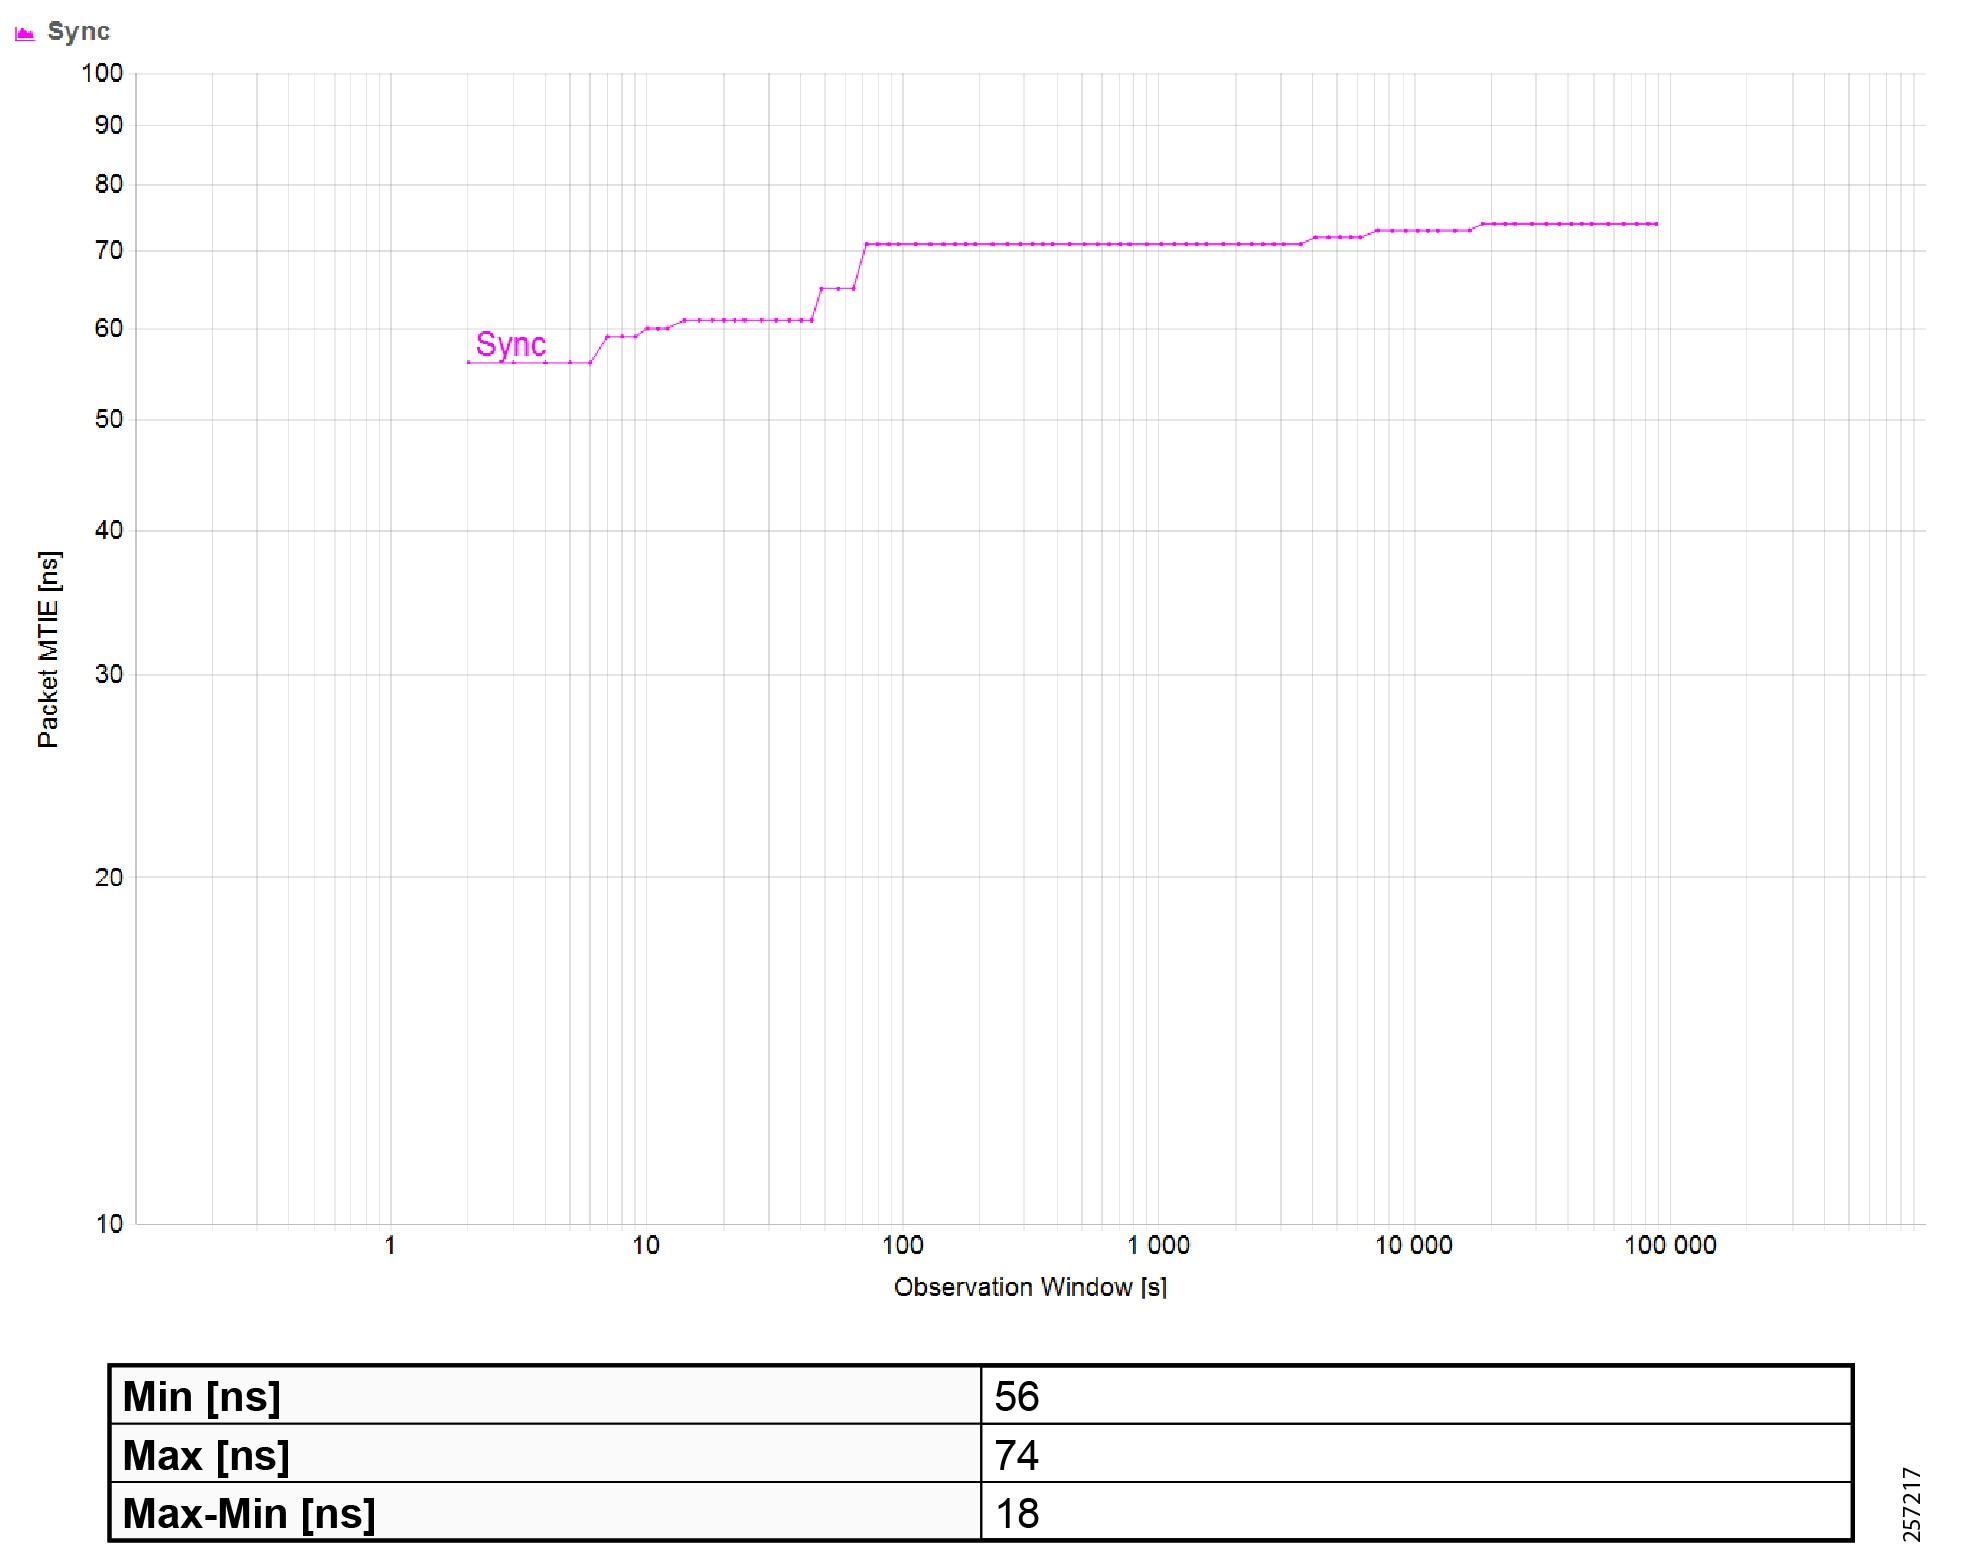
|
|
|
|
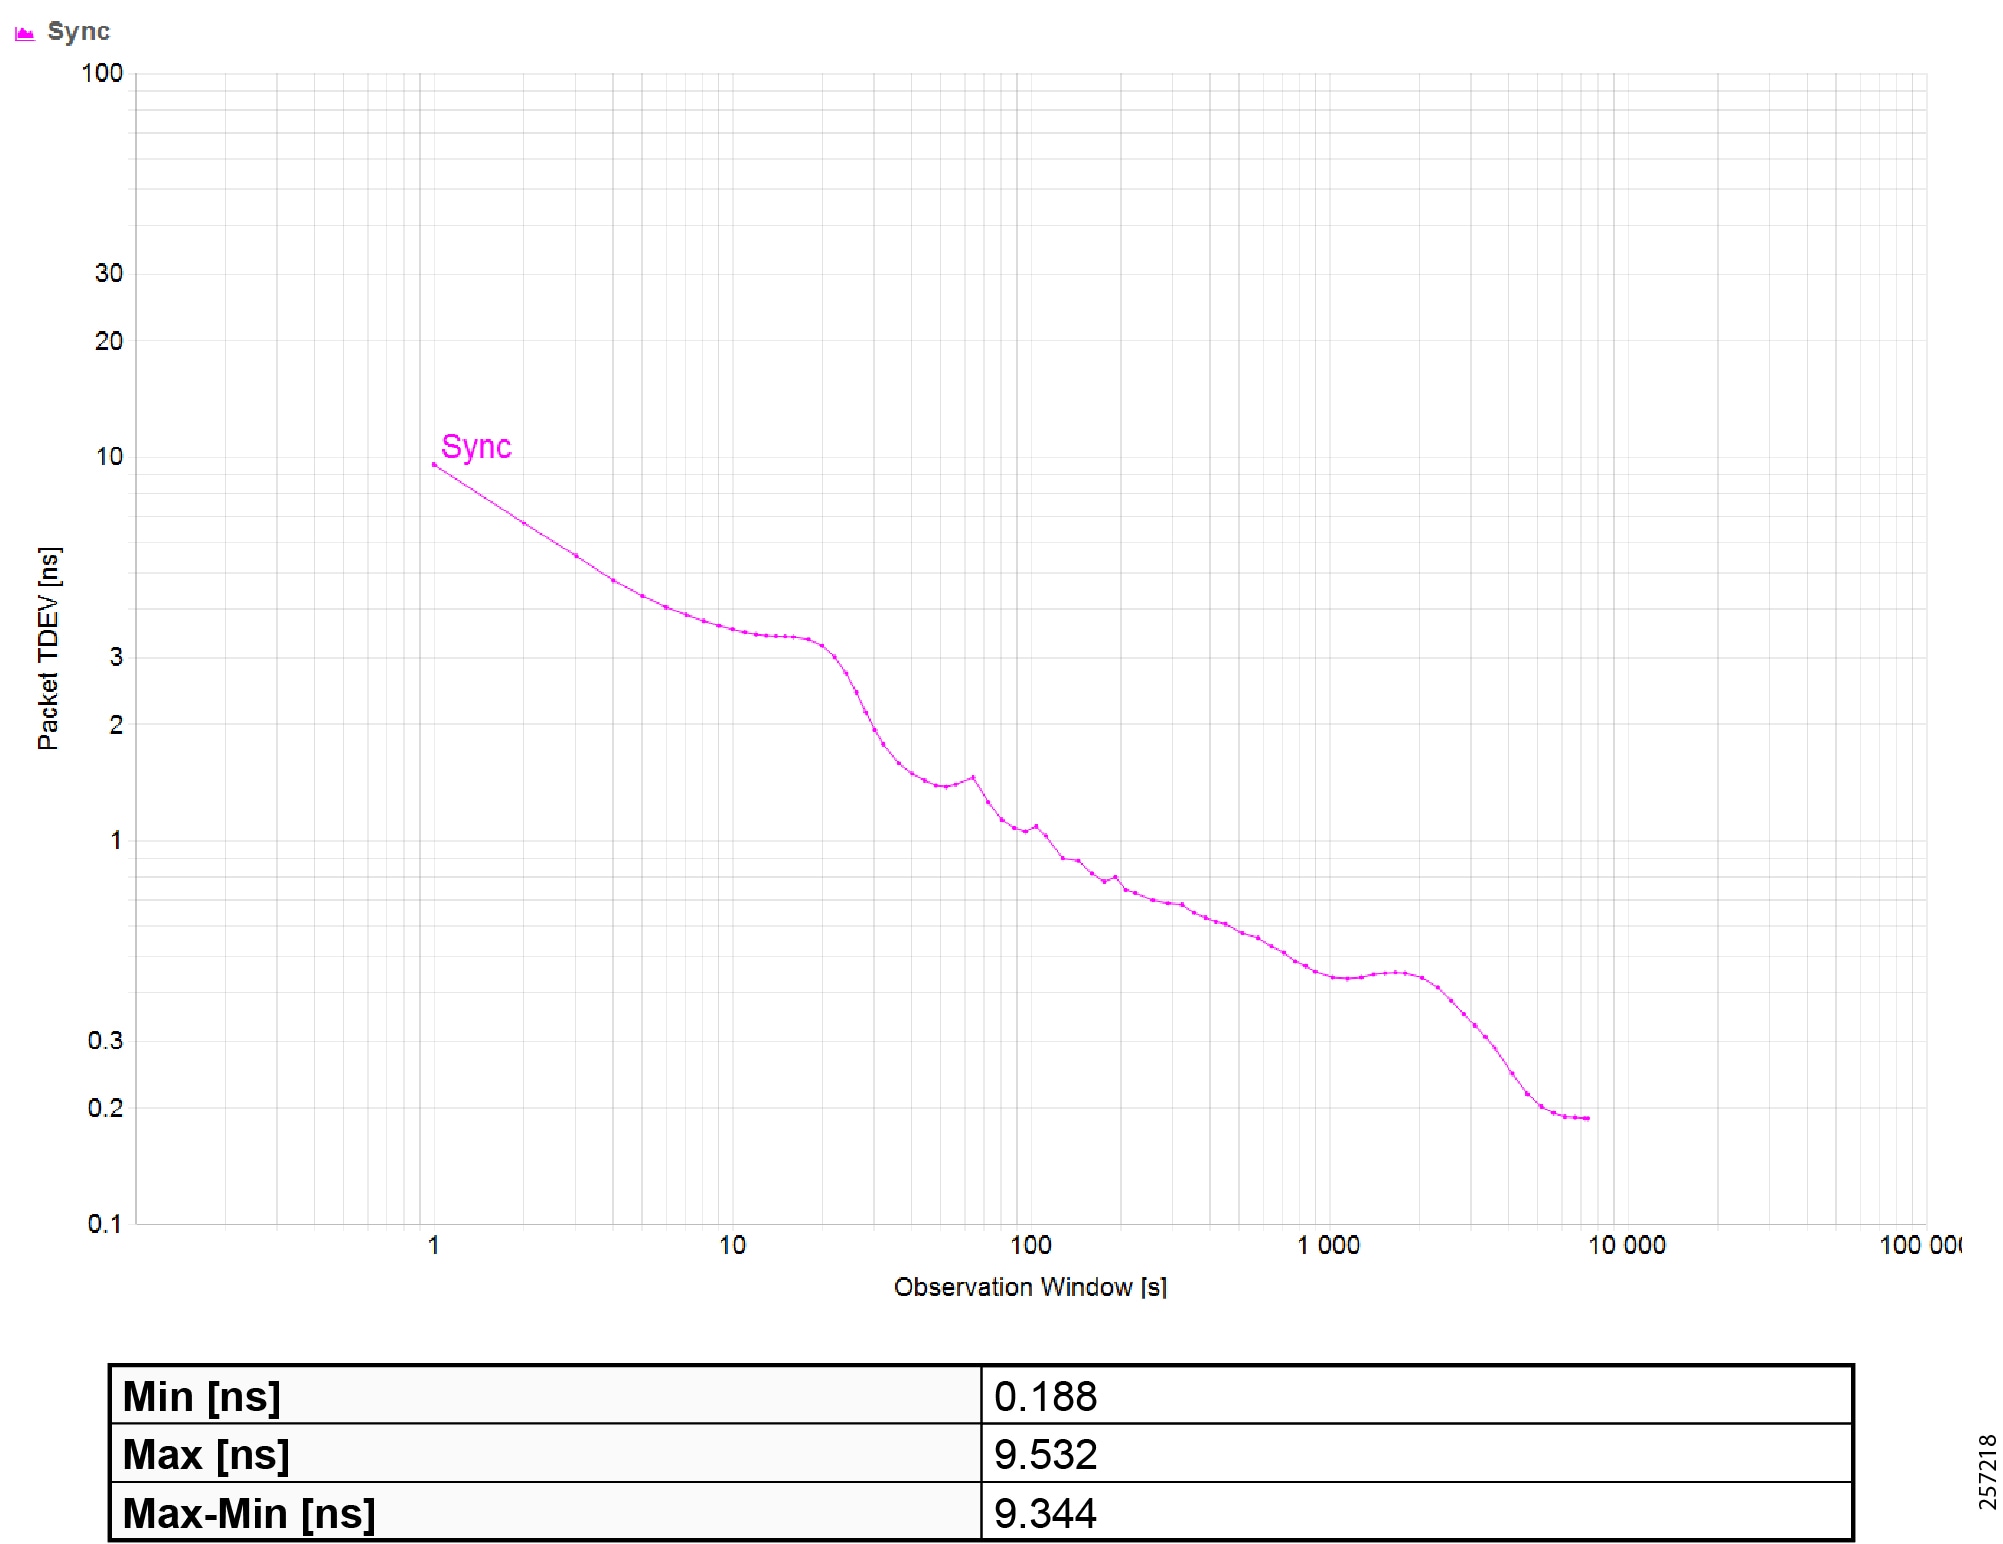
|
|
|
|
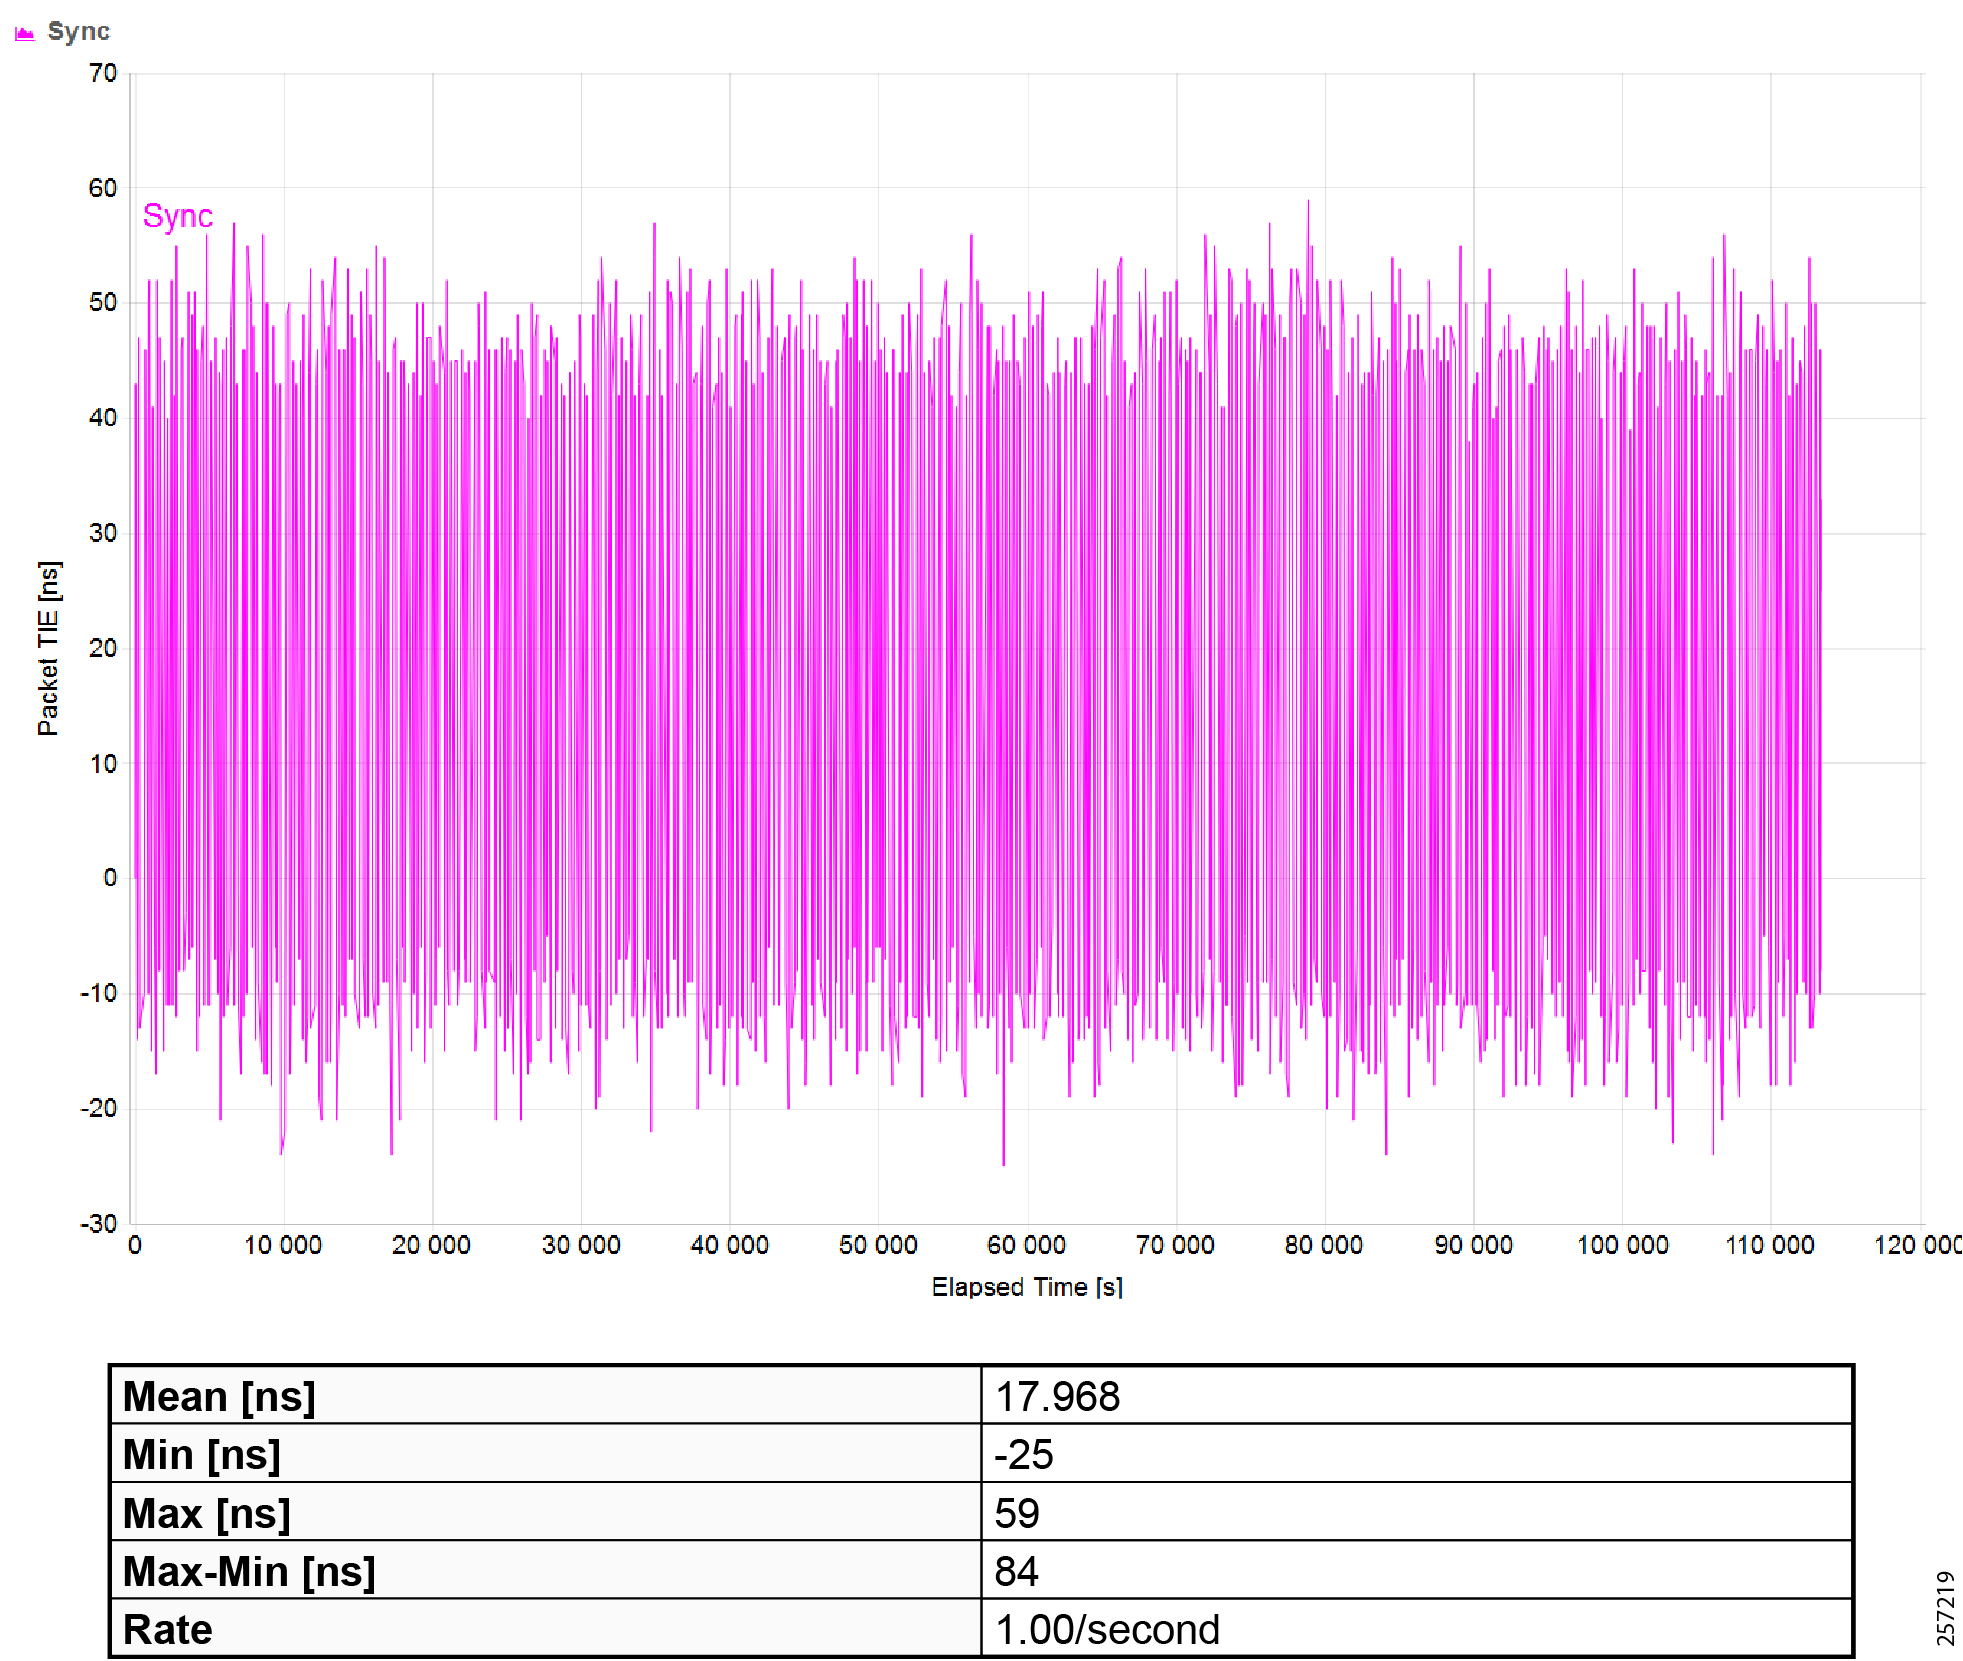
|
|
Maximum Time Interval Error (MTIE) |
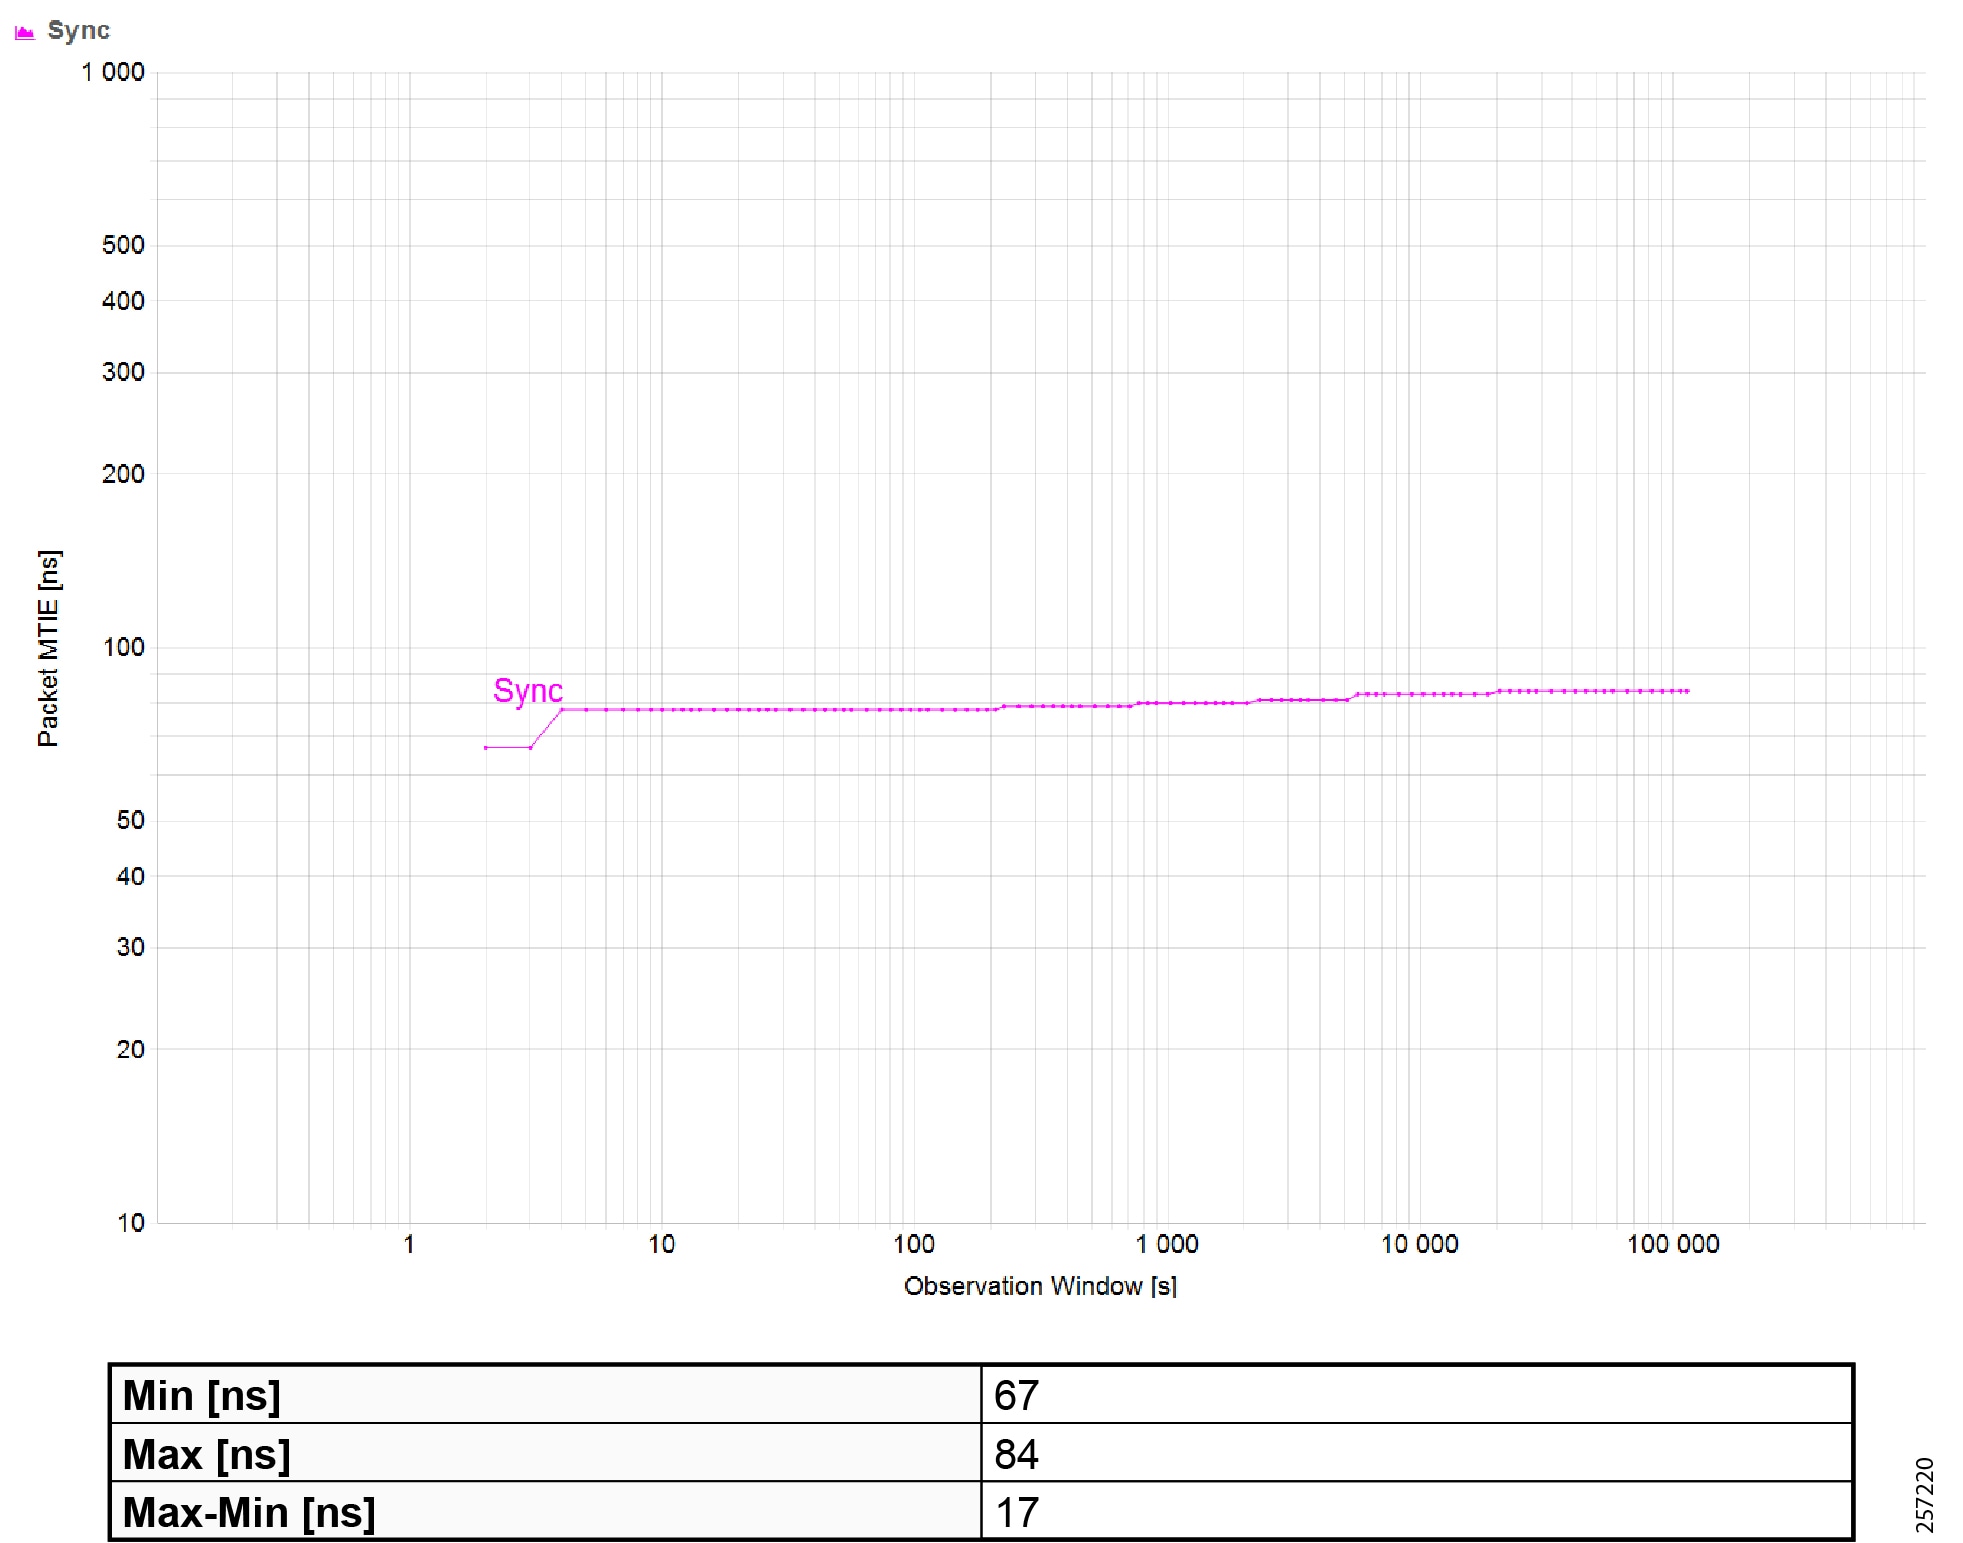
|
|
|
|
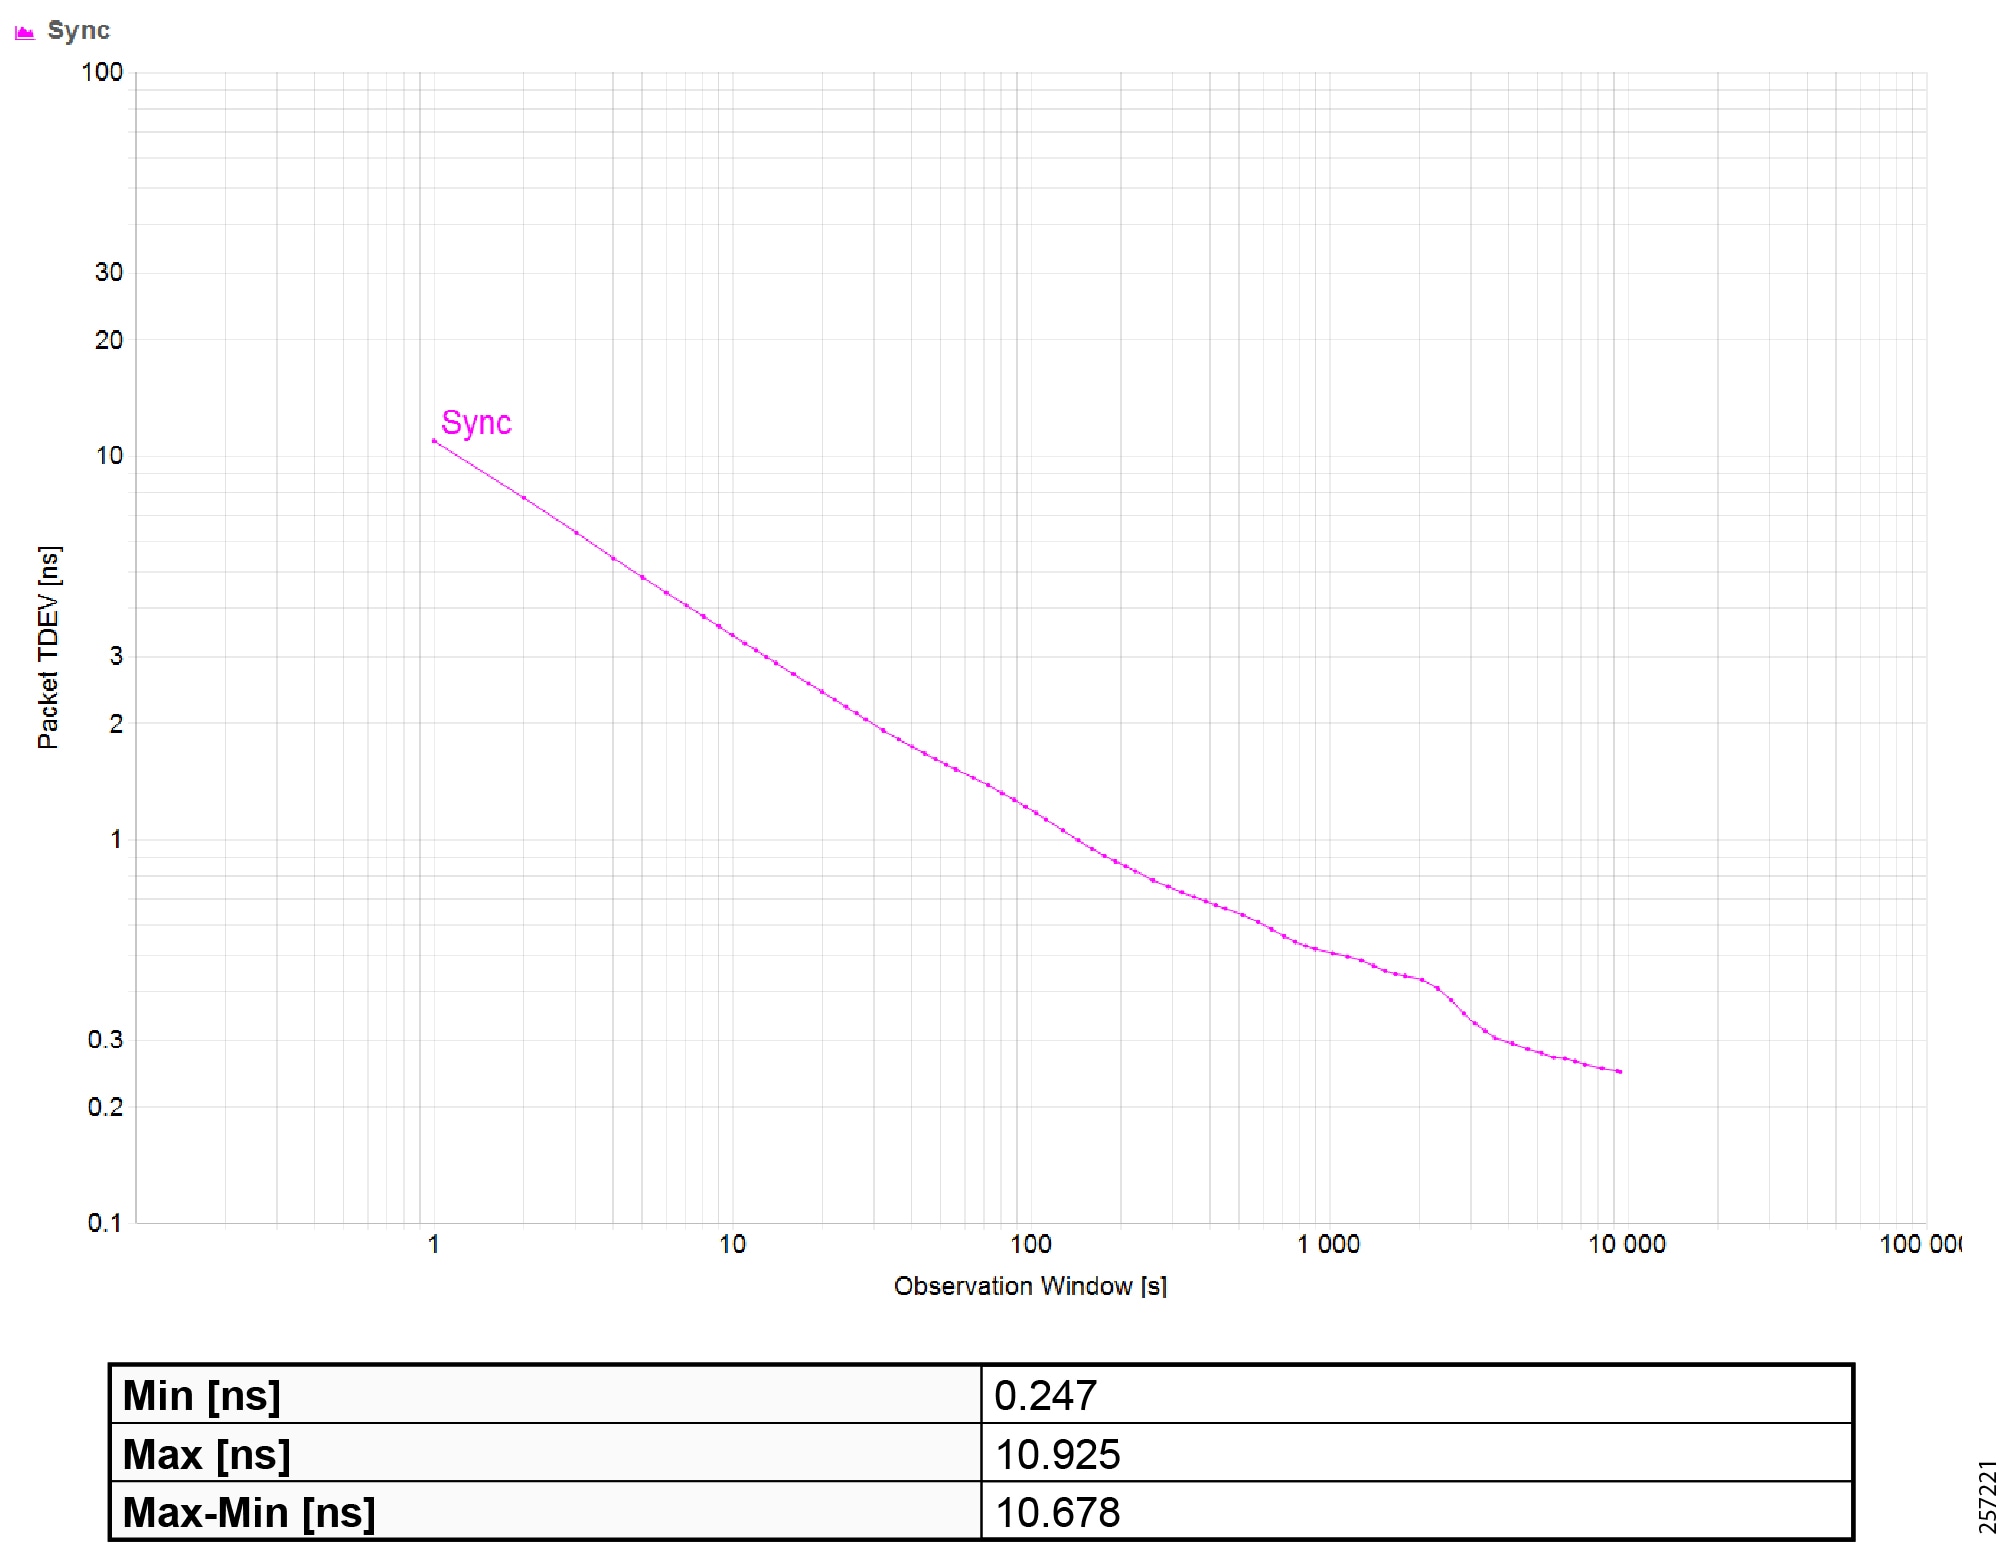
|
|
|
|
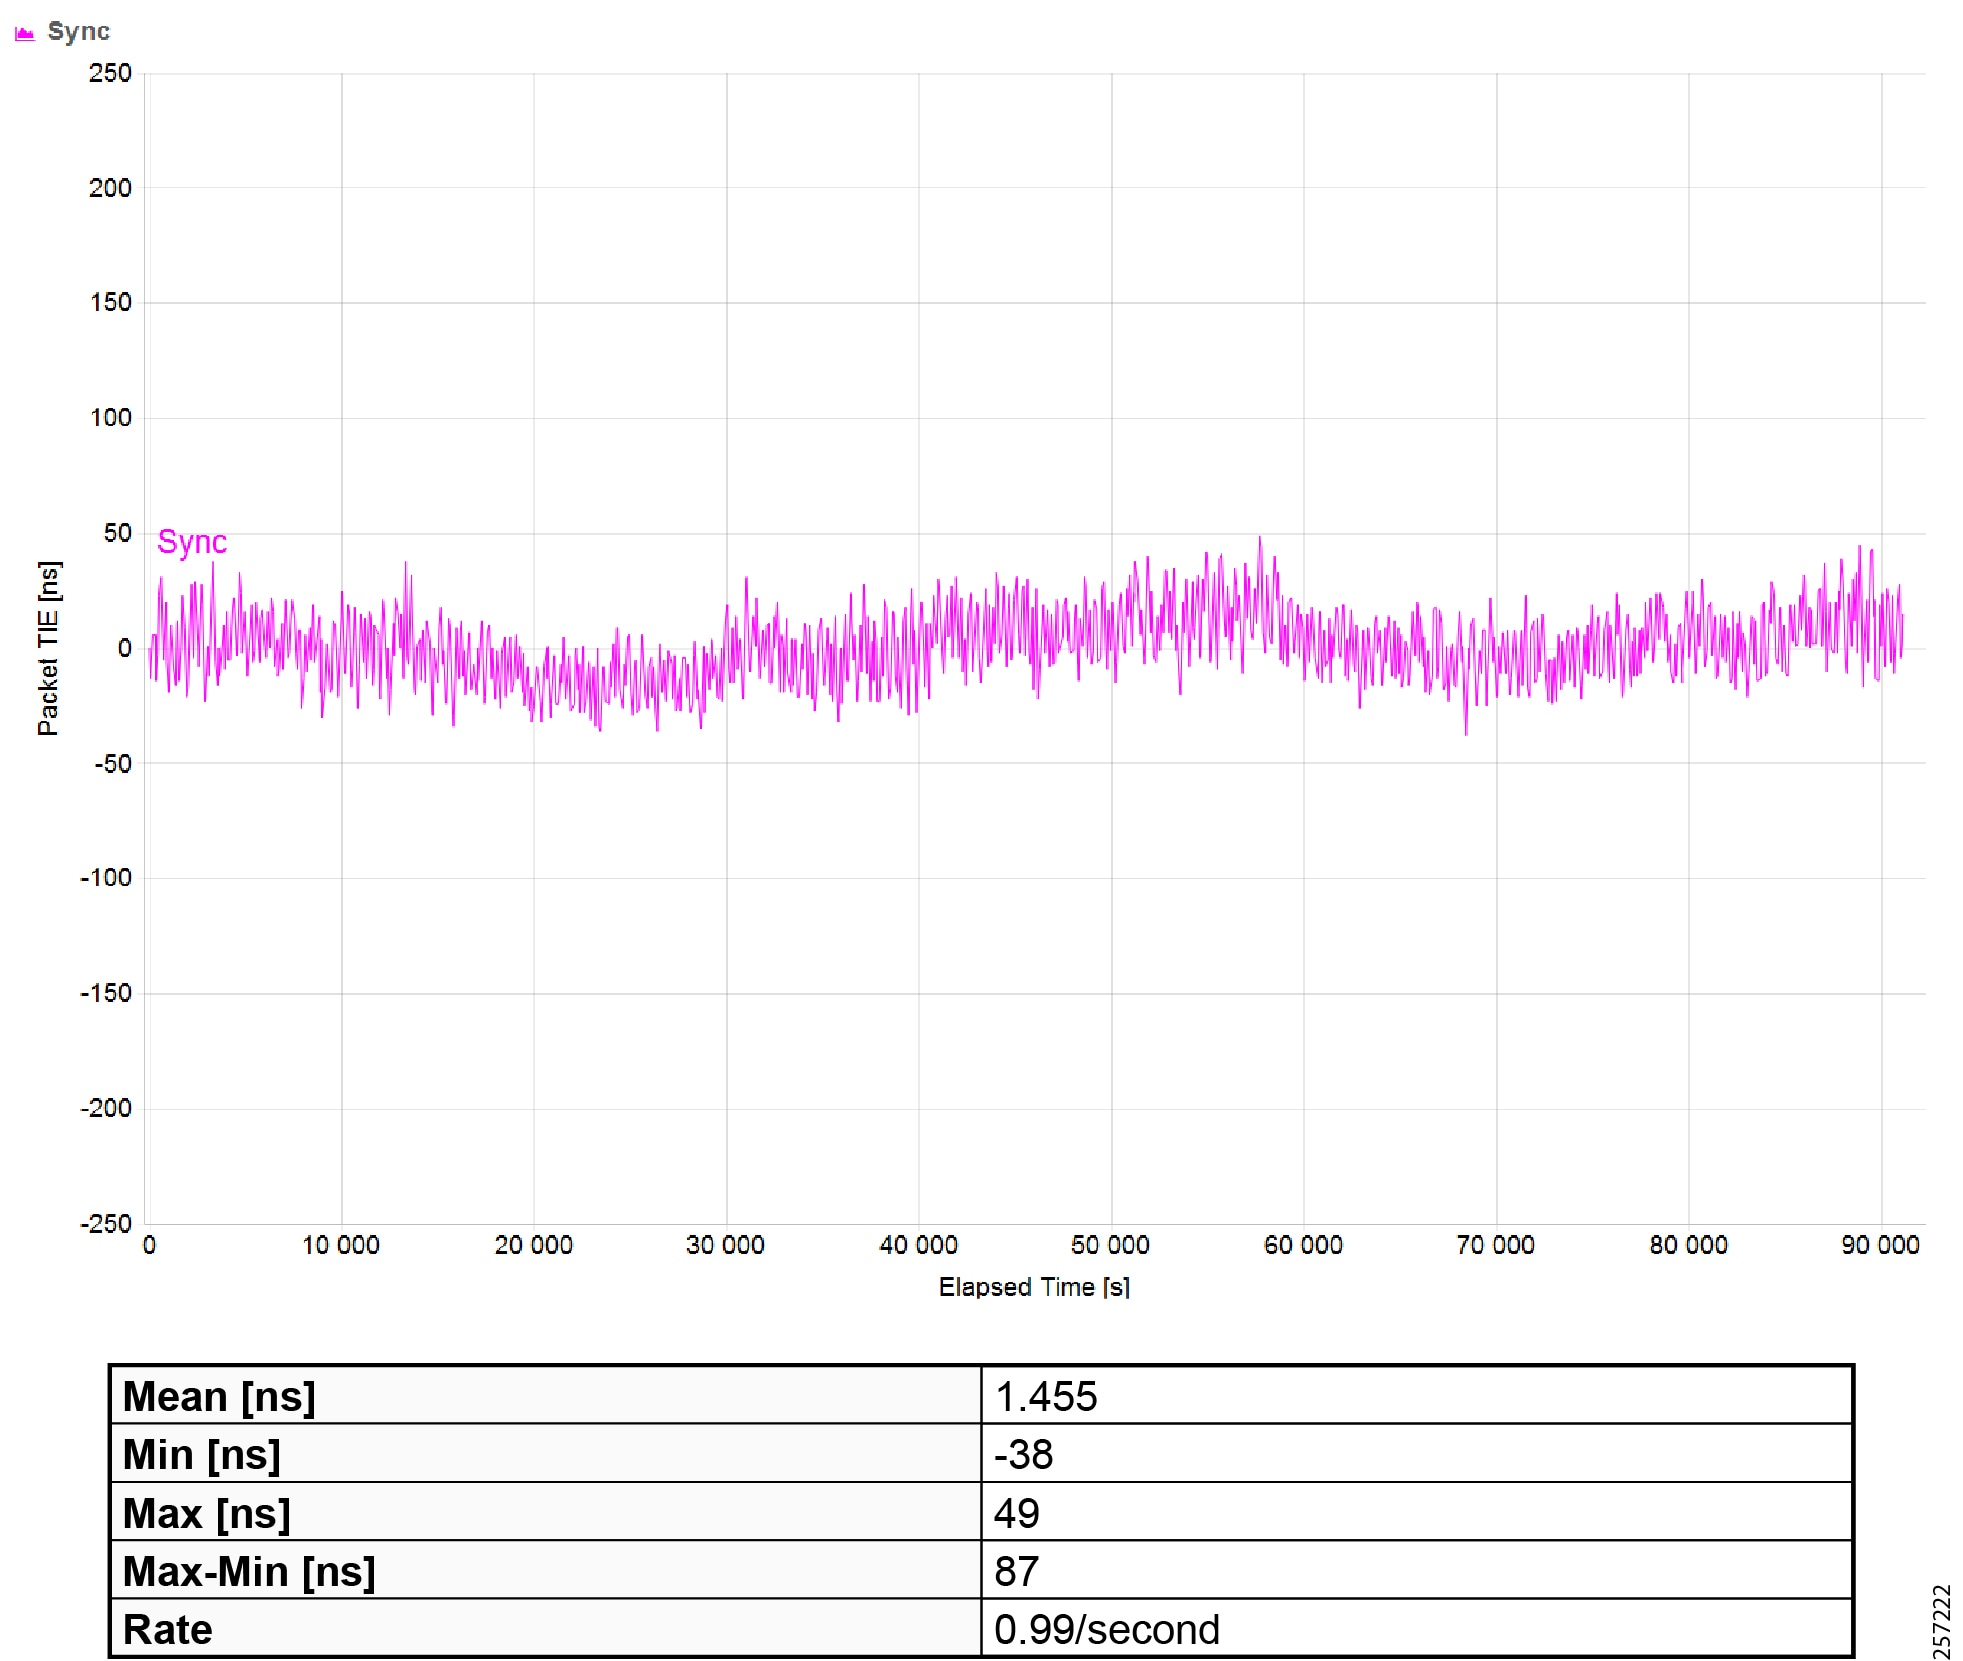
|
|
Maximum Time Interval Error (MTIE) |

|
|
|
|
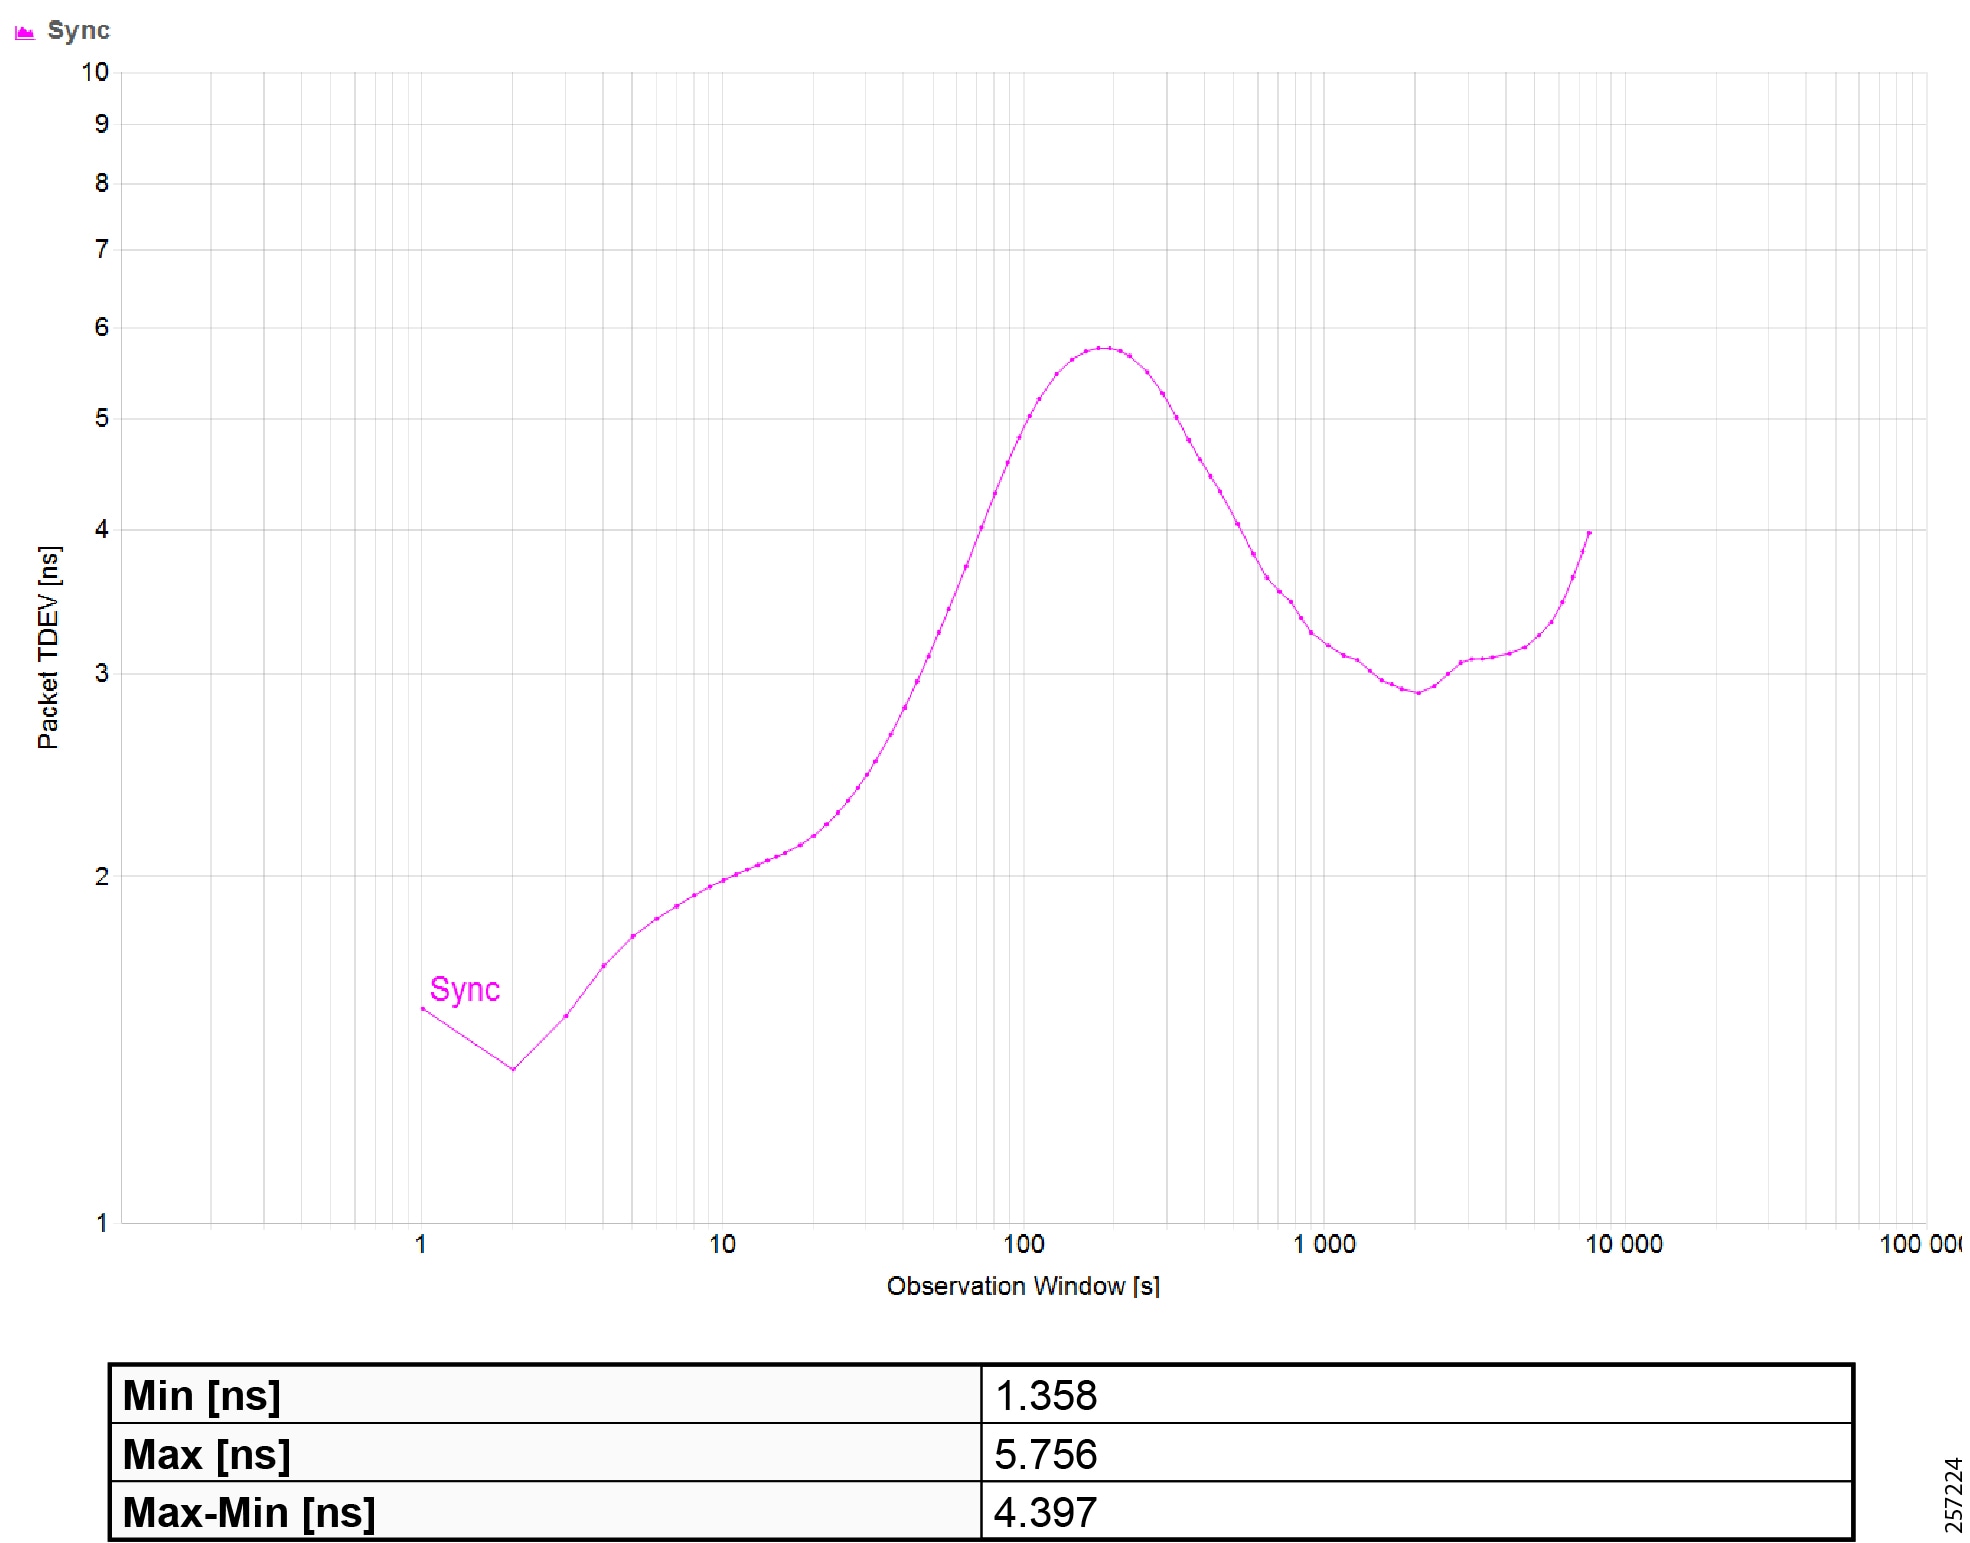
|
|
|
|
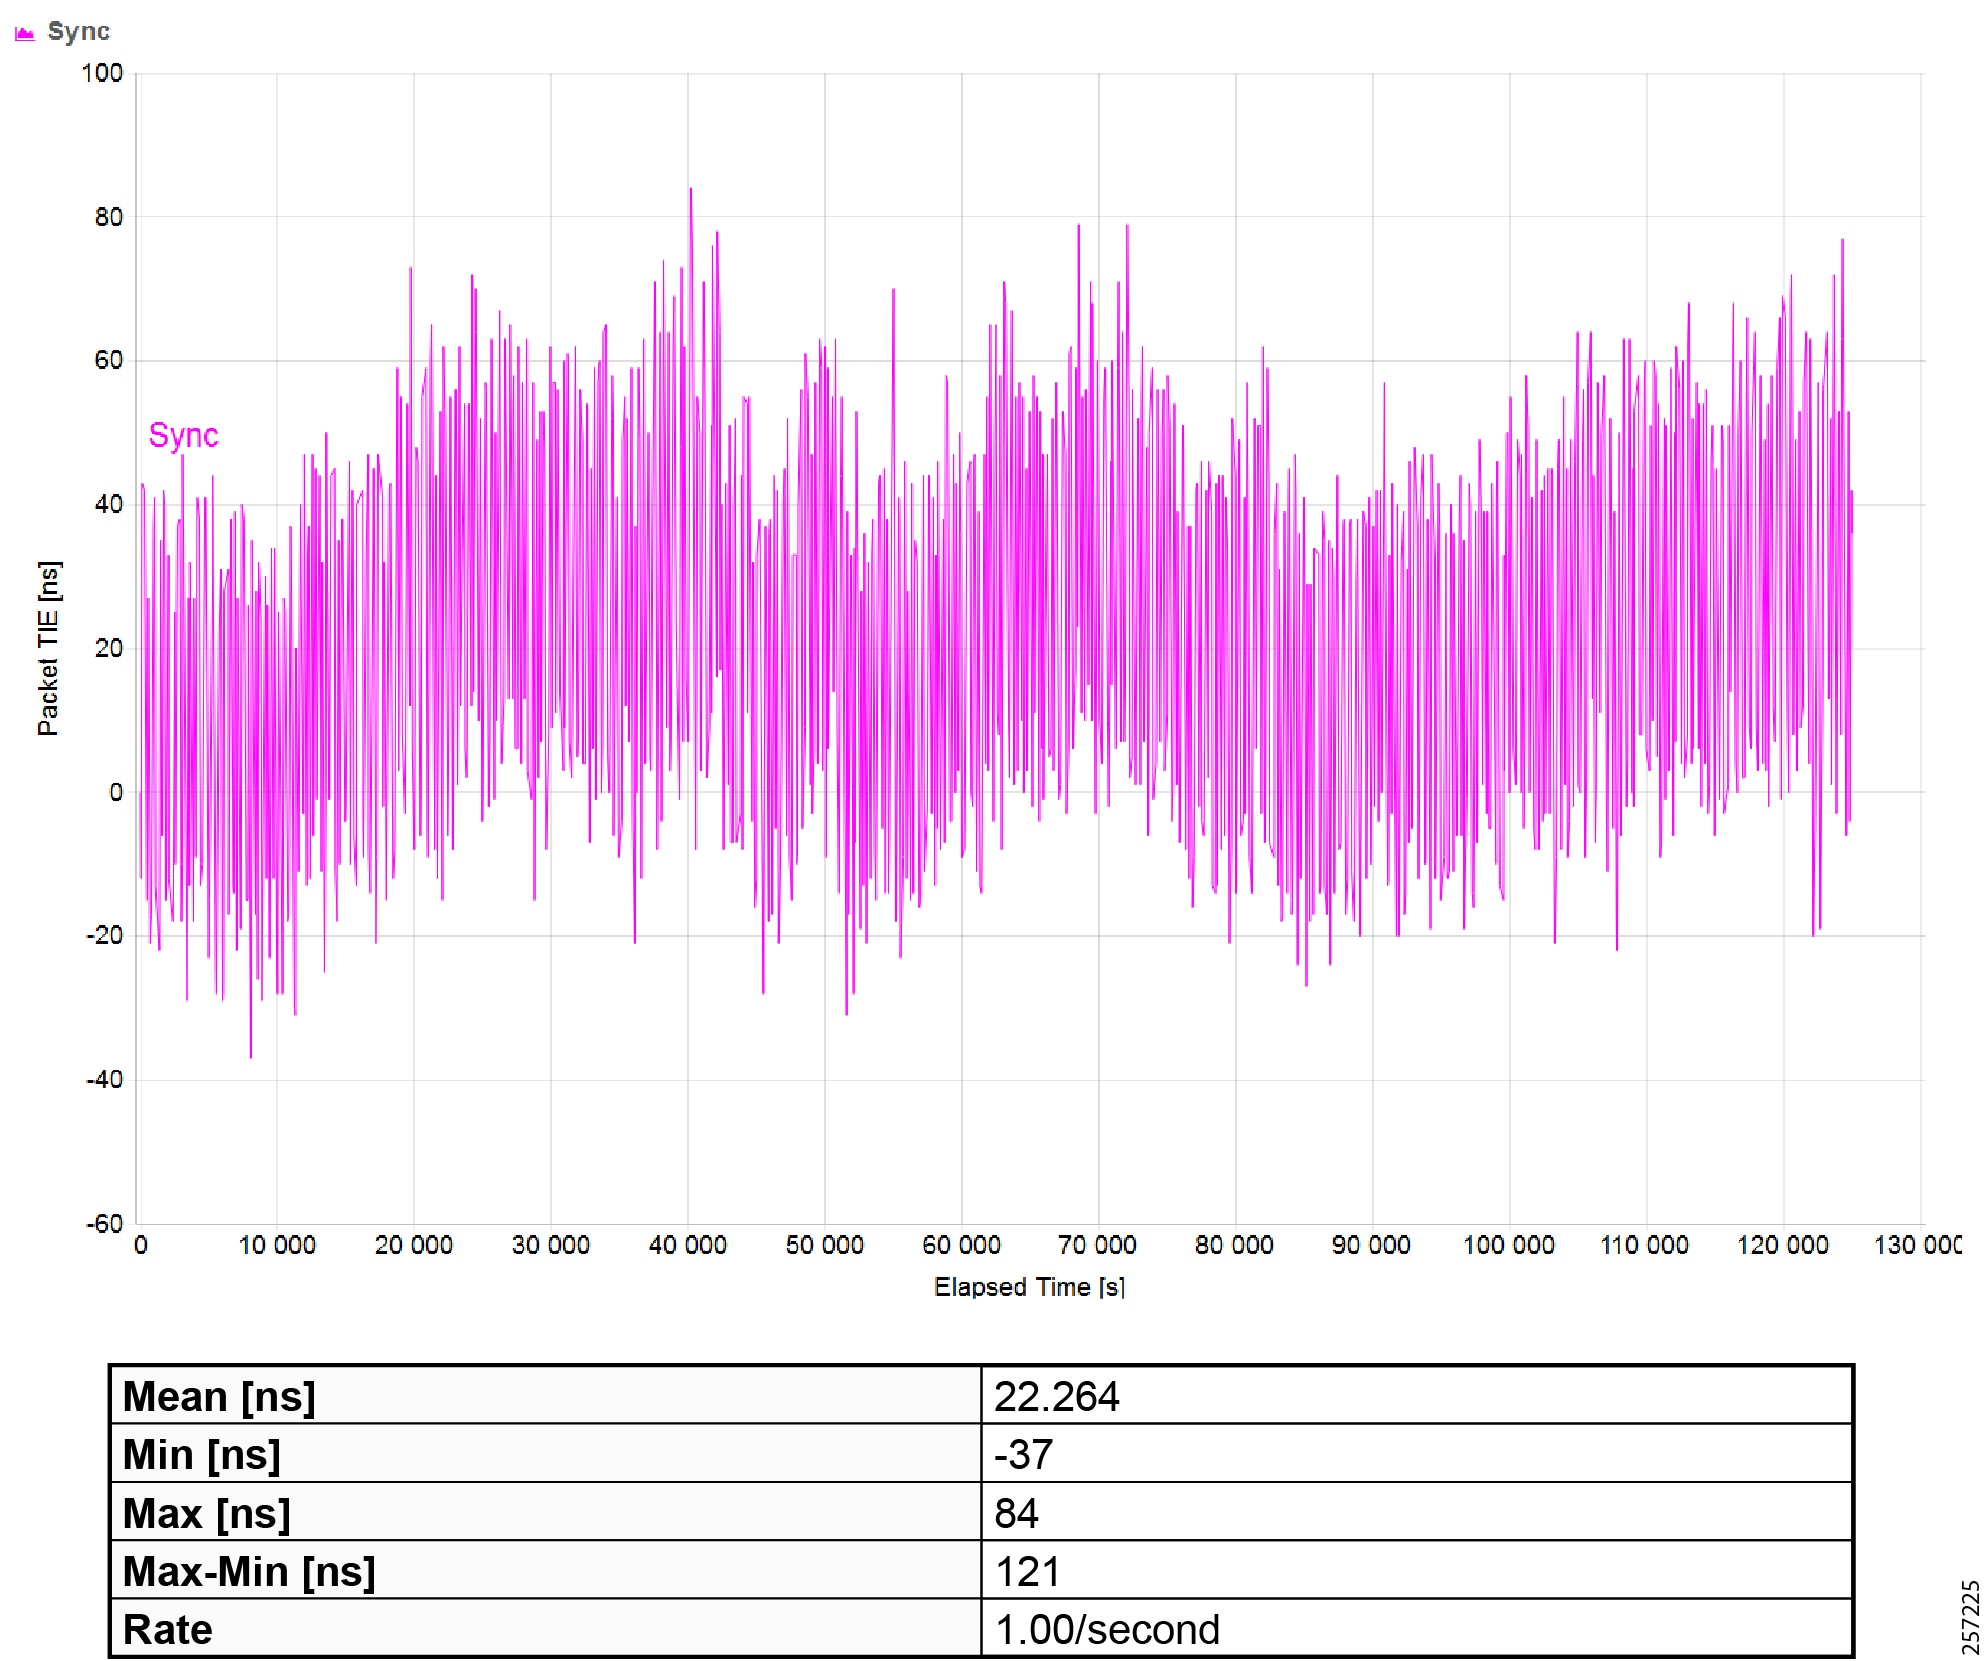
|
|
Maximum Time Interval Error (MTIE) |
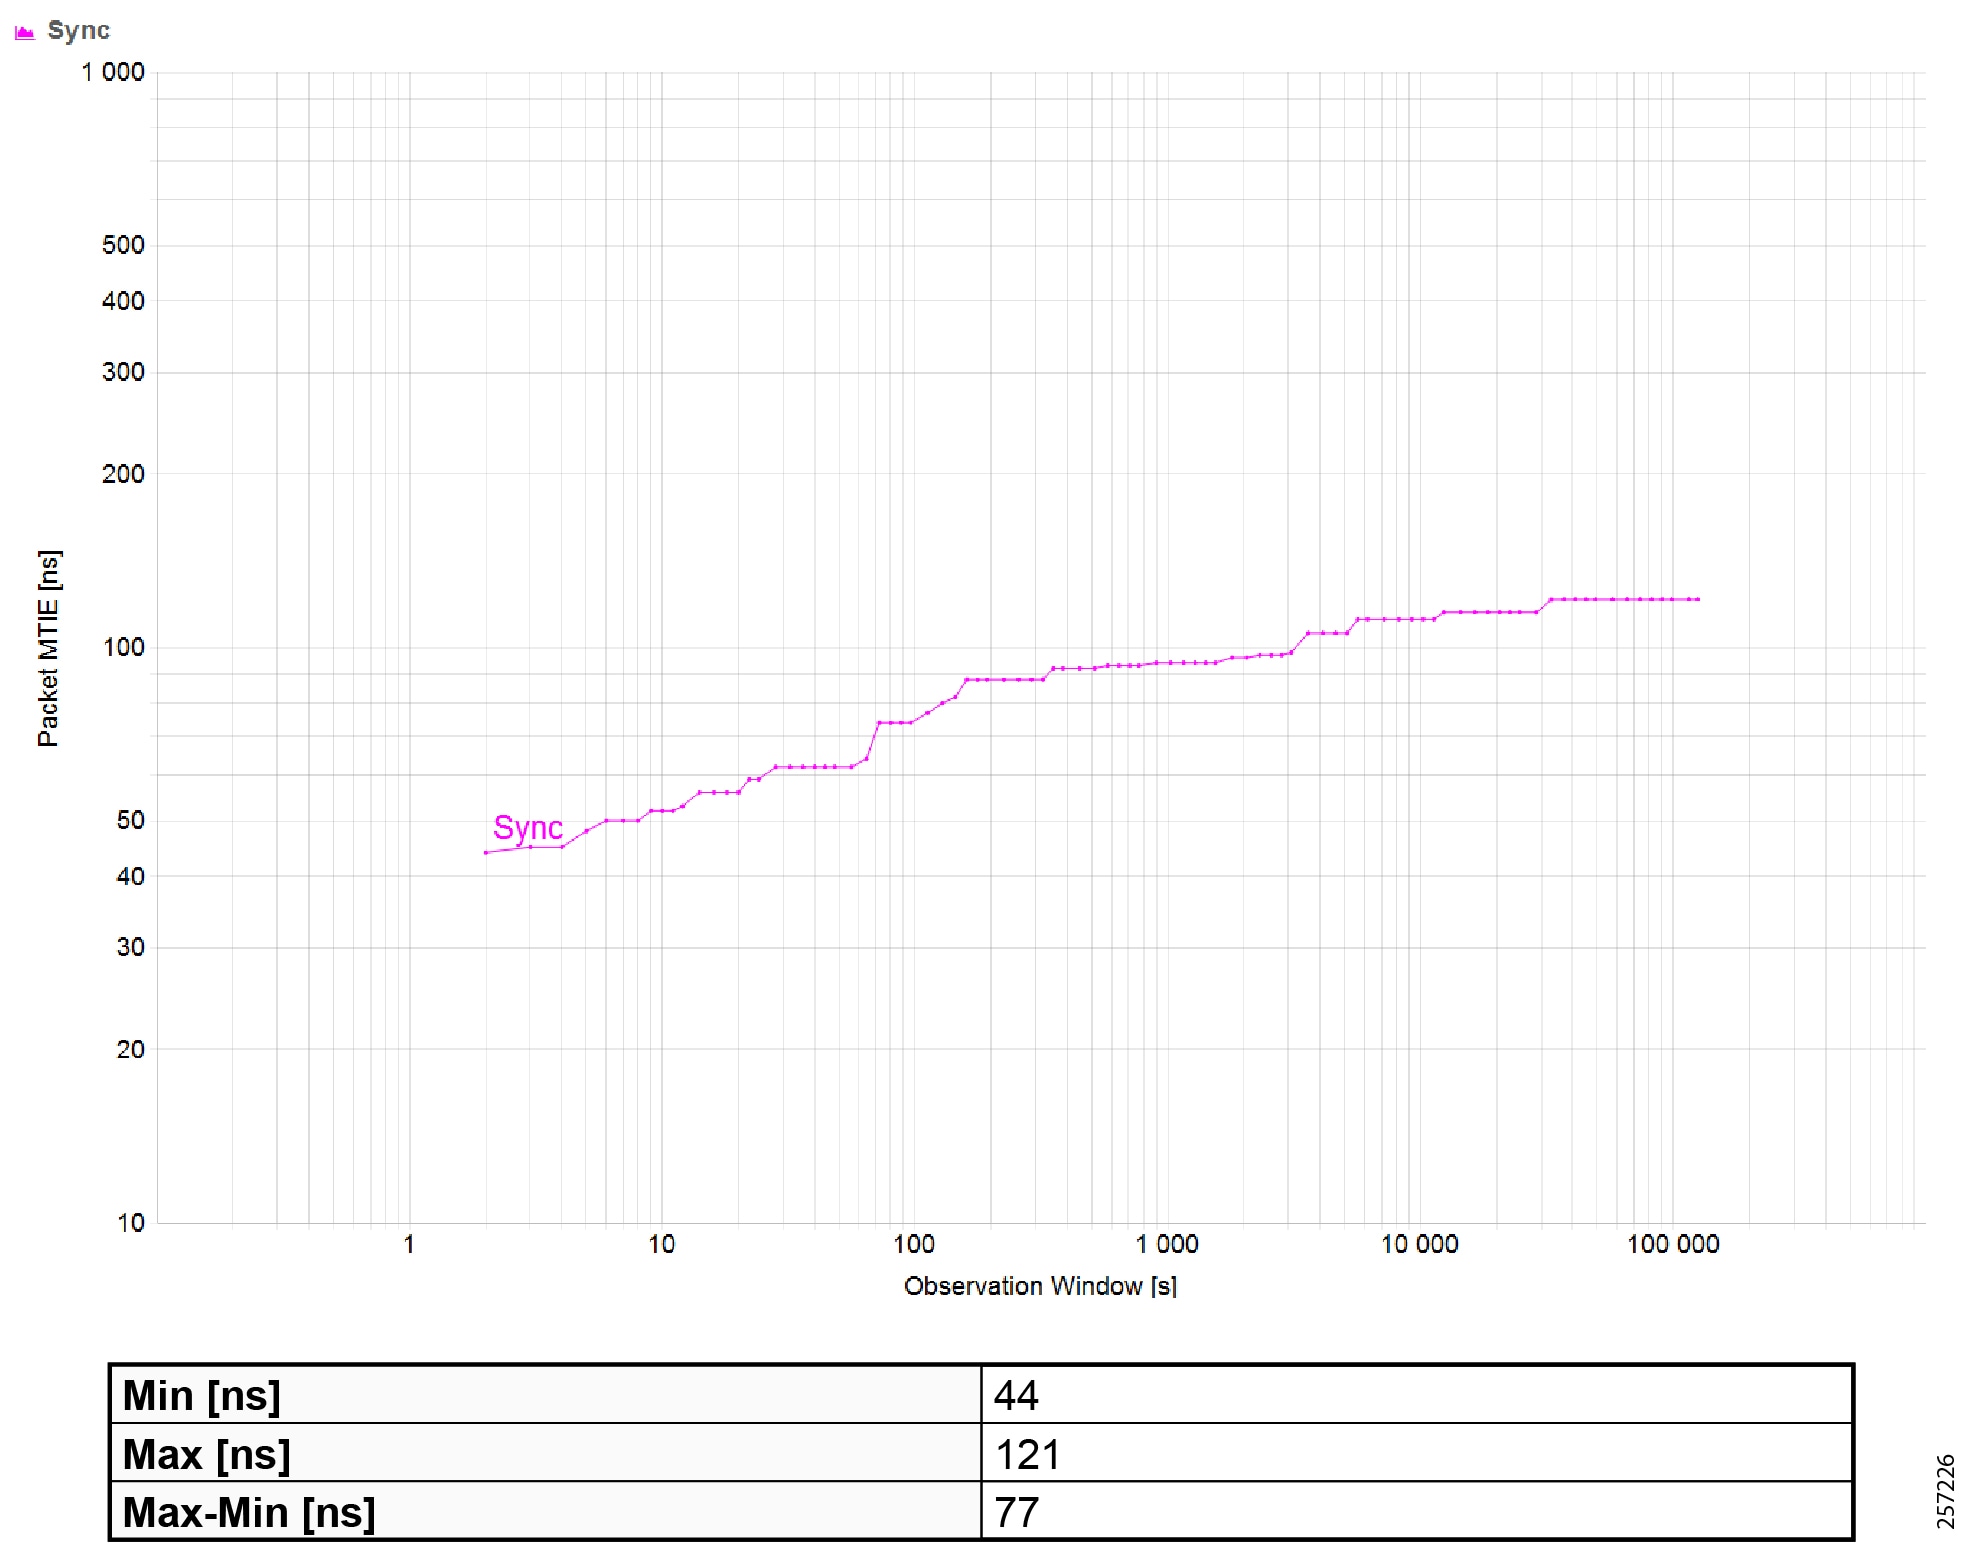
|
|
|
|
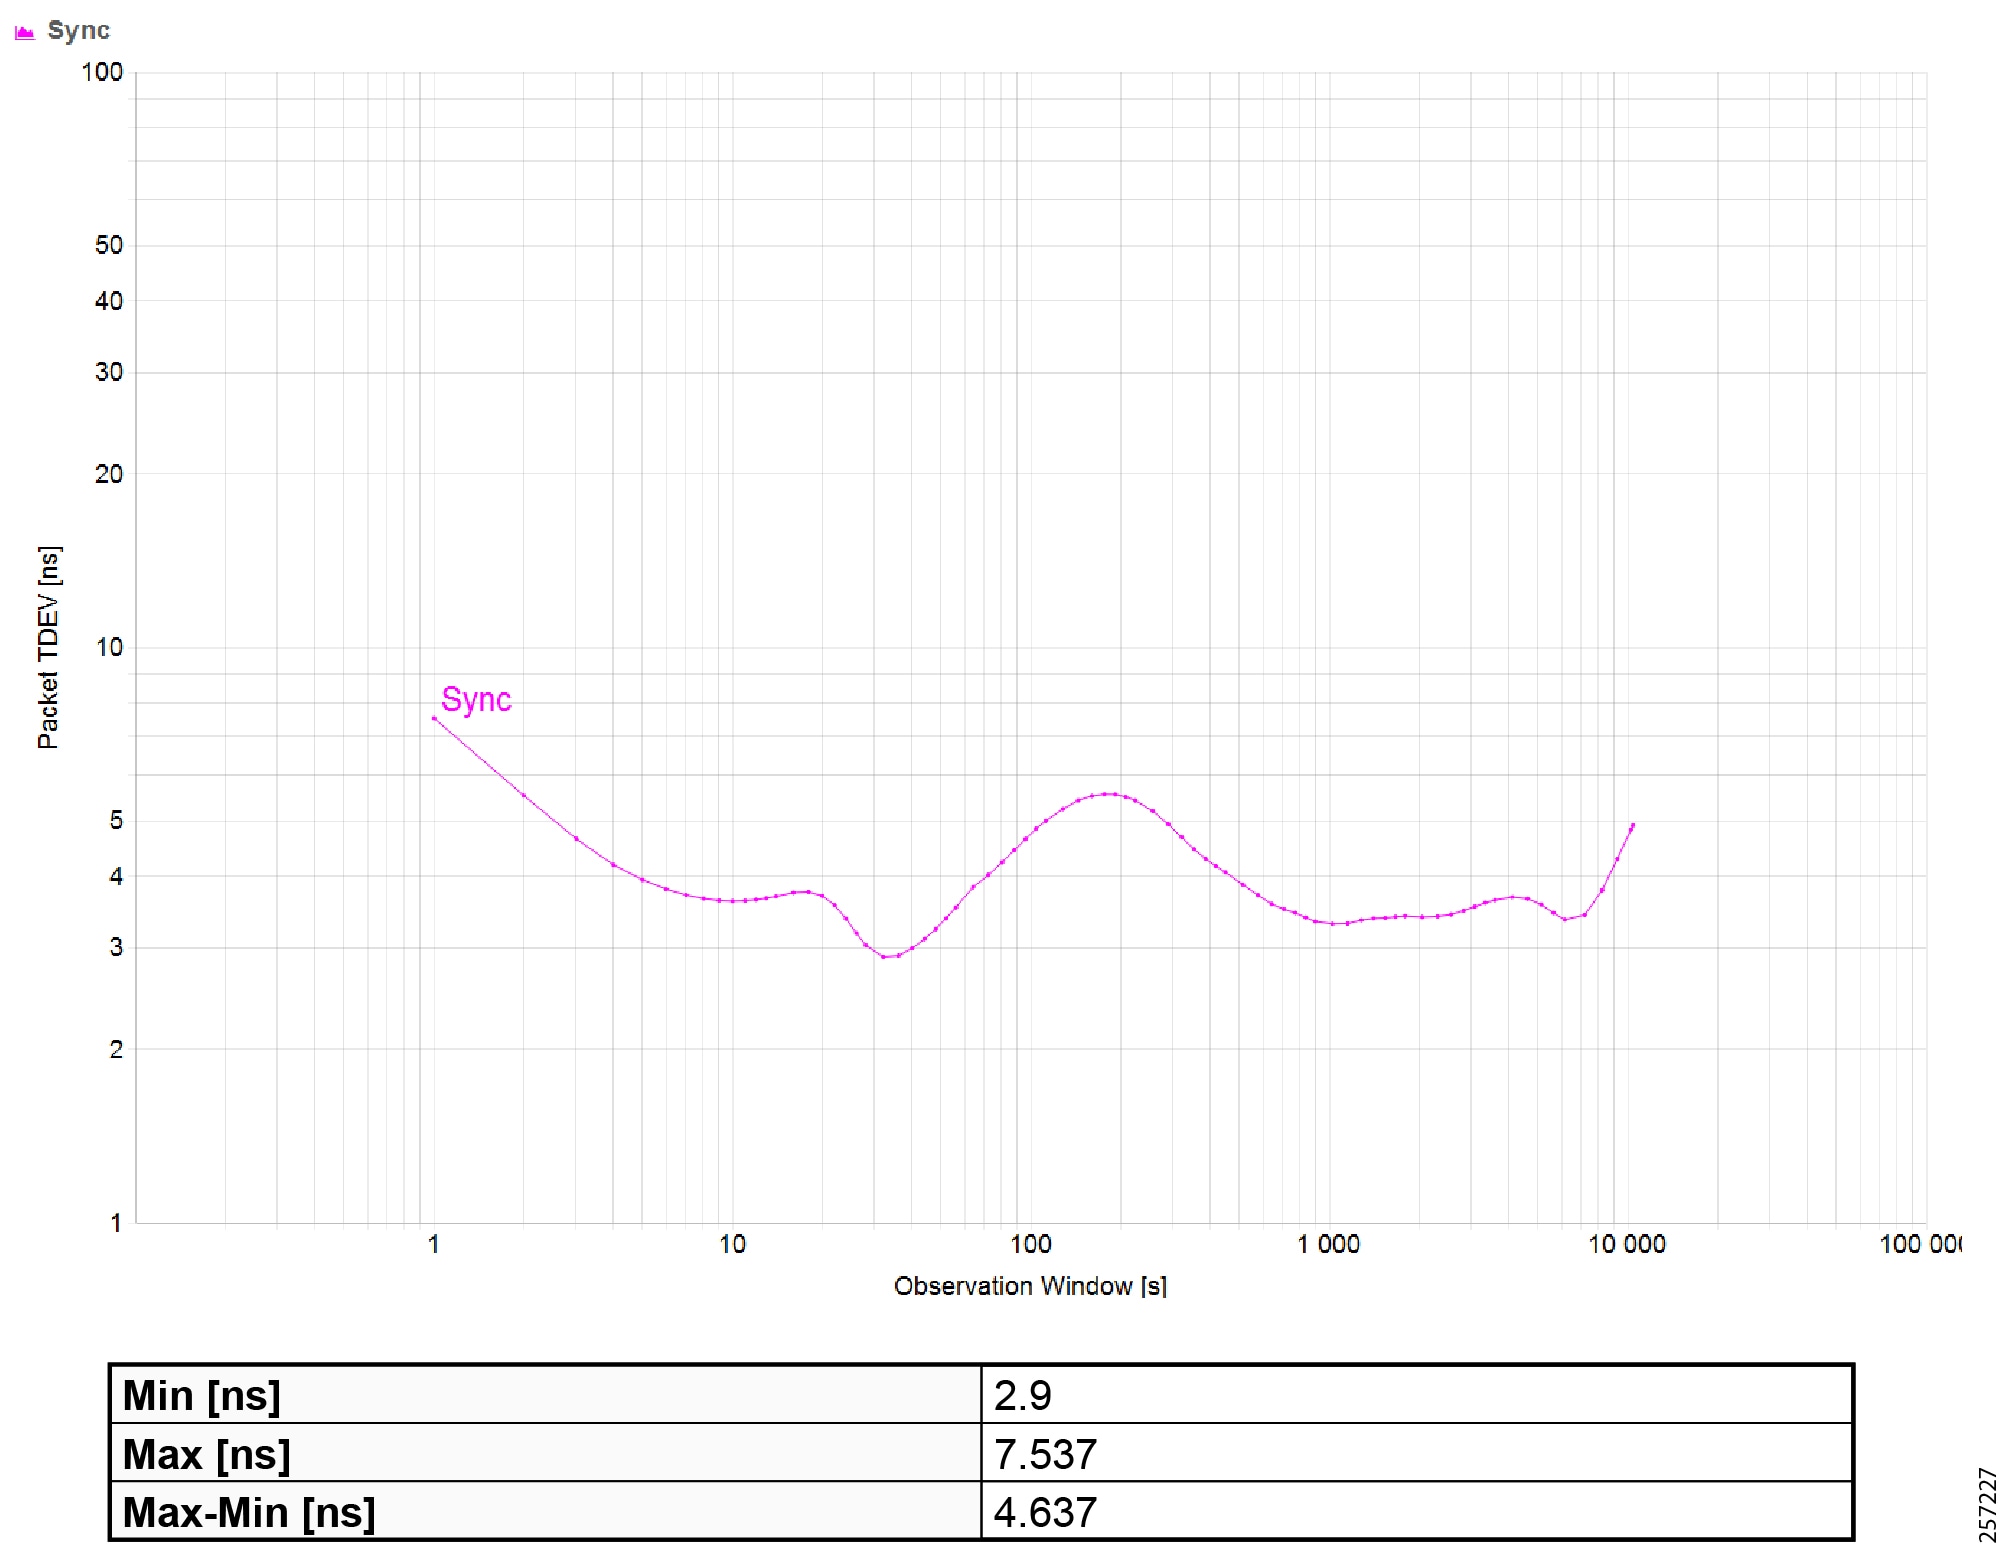
|
|
|
|
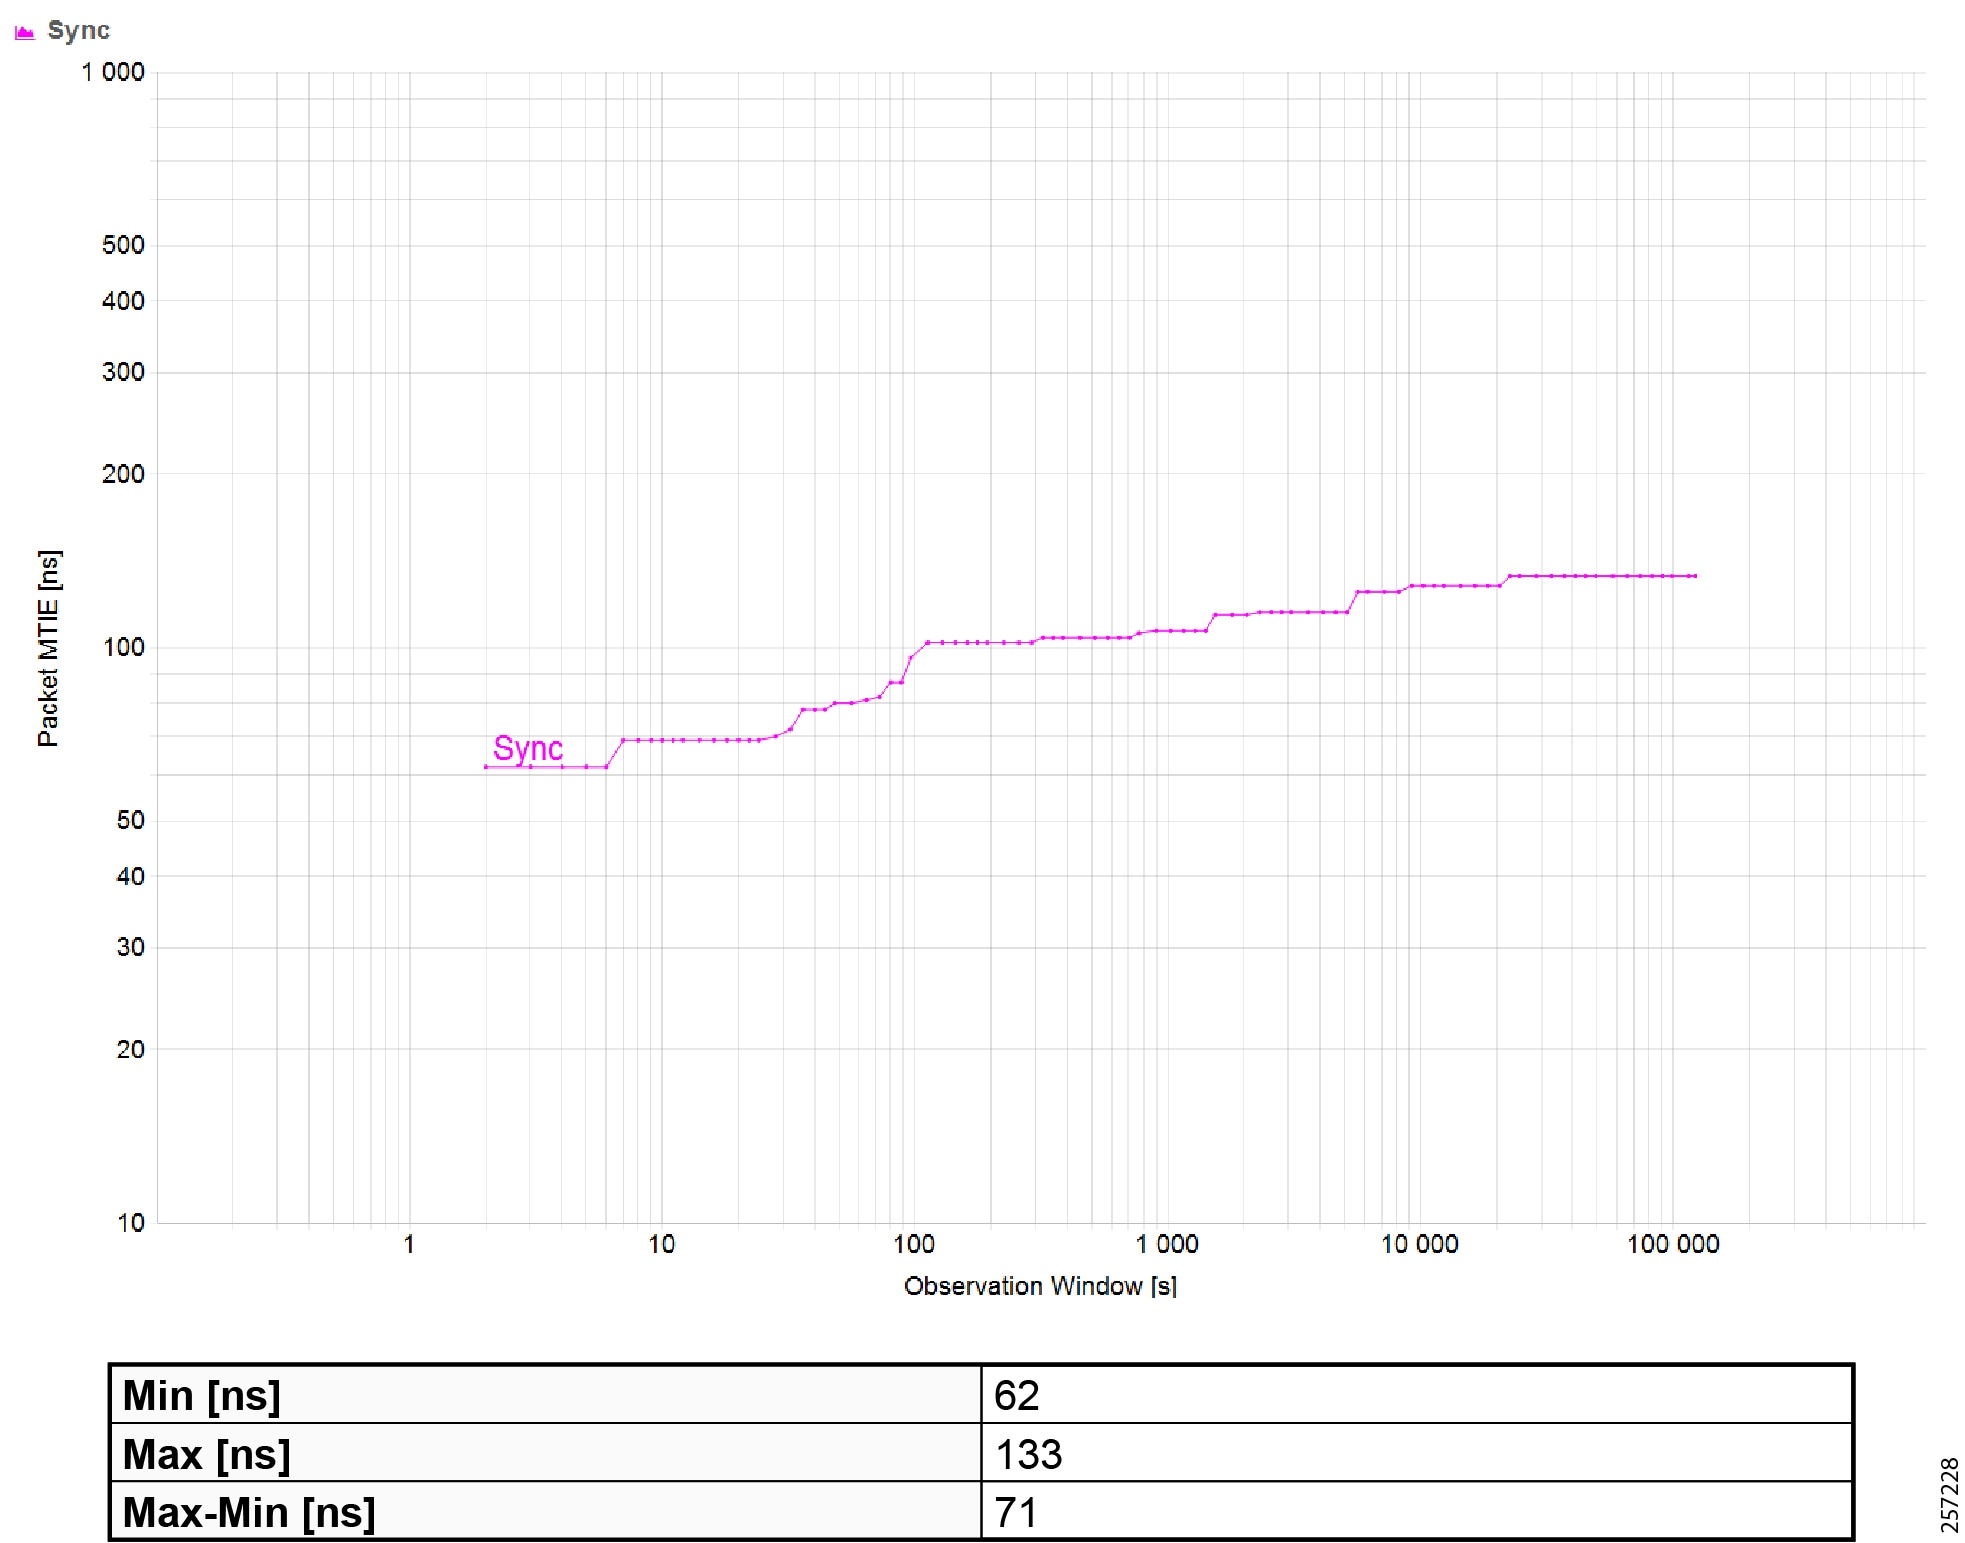
|
|
Maximum Time Interval Error (MTIE) |

|
|
|
|
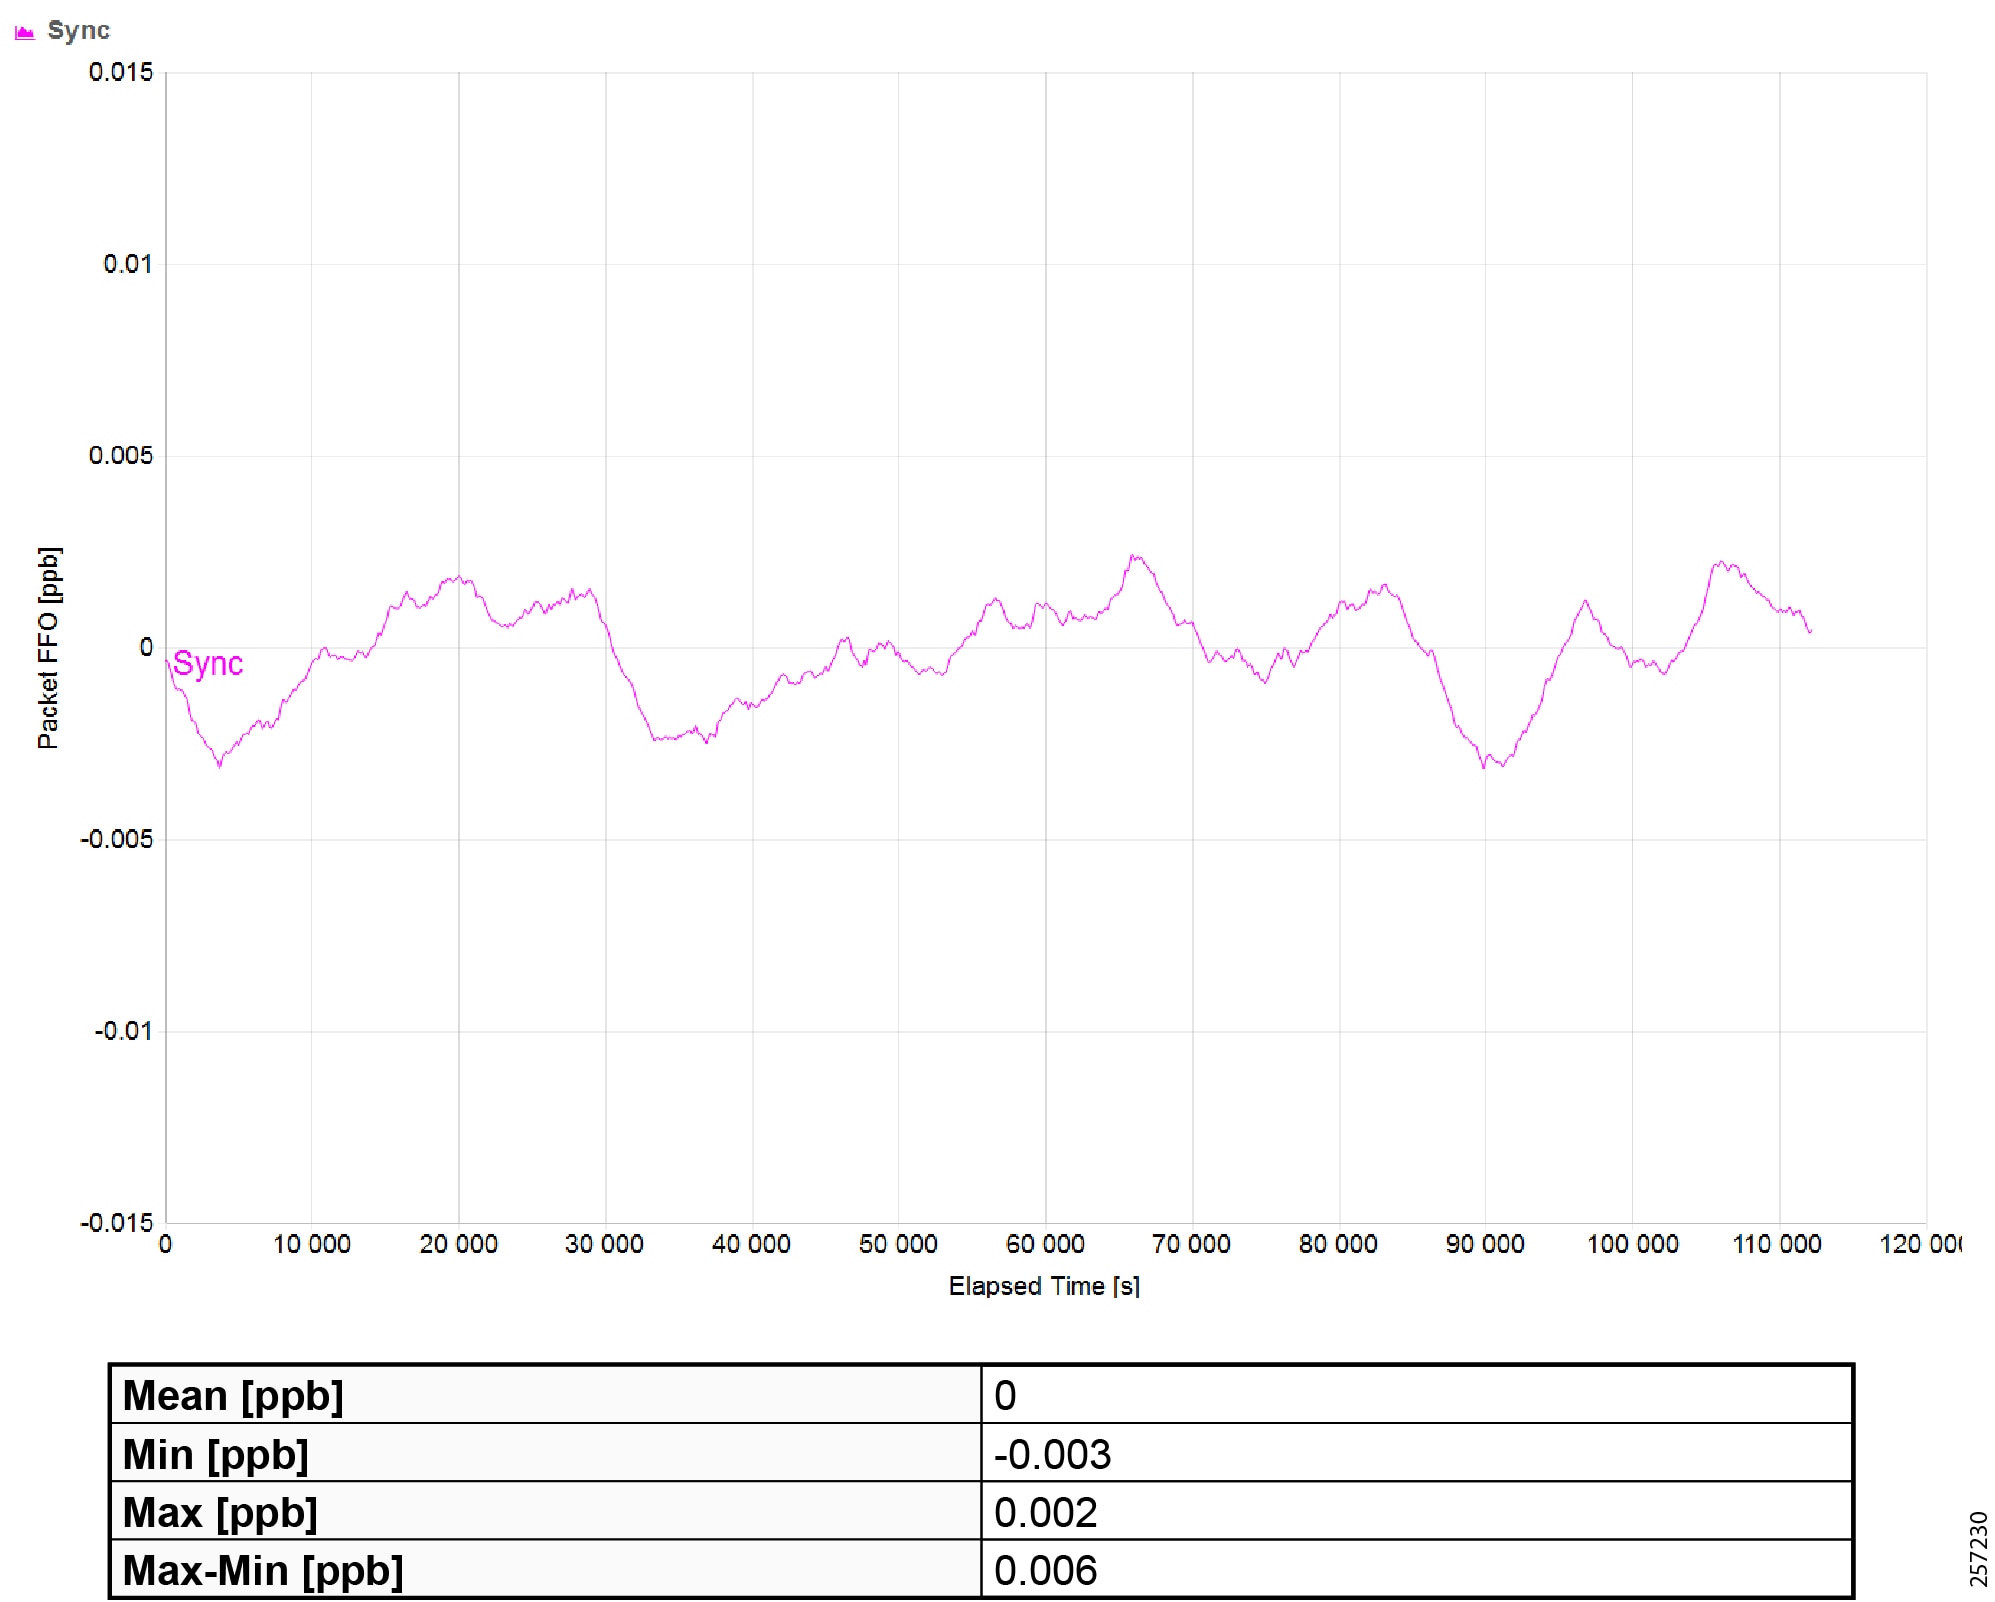
|
|
Troubleshooting the Infrastructure
This section includes the following major topics:
■![]() TrustSec Troubleshooting Tips on Cisco Switches
TrustSec Troubleshooting Tips on Cisco Switches
■![]() Cisco ISE Troubleshooting Tips
Cisco ISE Troubleshooting Tips
■![]() Cisco NetFlow Troubleshooting Tips
Cisco NetFlow Troubleshooting Tips
■![]() Troubleshooting Cisco Cyber Vision
Troubleshooting Cisco Cyber Vision
■![]() Site-wide Precision Time Protocol Troubleshooting
Site-wide Precision Time Protocol Troubleshooting
TrustSec Troubleshooting Tips on Cisco Switches
The following section describes certain show commands that can be executed to view potential sources of problems related to Cisco TrustSec.
Note: An IT engineer should have some expertise in TrustSec in order to troubleshoot any problems that are discovered. For complete information on Cisco TrustSec troubleshooting tips, refer to the following URL:
https://community.cisco.com/t5/security-documents/trustsec-troubleshooting-guide/ta-p/3647576
Cisco IE Switch is Unable to Register with Cisco ISE and Download the SGT Table Information
This is the first step and it is possible that the IT security administrator might missed or entered incorrect TrustSec credentials on the switch or in ISE. Issue the following command:
The PAC key must match between the Cisco ISE and the switch. If there is a mismatch, you must re-configure the key, which will force a new PAC provisioning in the switch. To verify the PAC is installed:
Verify that RADIUS is Operational from the Switch
Verify the CTS Server Configuration
The command to verify the cts server-list is shown below:
Verify the Downloaded SGT Mappings
IACS Asset is Unable to Authenticate to Cisco ISE
This section describes how to troubleshoot when an IACS device is unable to authenticate to Cisco ISE.
Verify the Authentication and Authorization State of IACS Assets on the Switch
Verify Cisco Cyber Vision has Discovered the IACS Asset
Figure 50 Cisco Cyber Vision Discovering IACS Asset
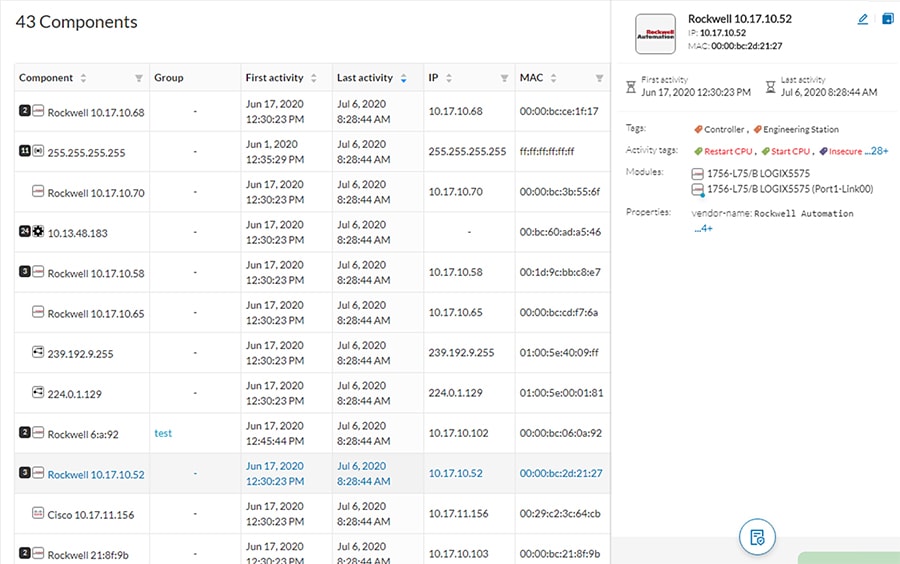
Verify the pxGrid Service is Enabled on Cisco ISE
From the Cisco ISE web UI, navigate to Administration -> Deployment. Check the checkbox of the appropriate PSN and click Edit. Verify the pxGrid check box is checked.
Figure 51 Verifying that the pxGrid Service is Enabled at Cisco ISE
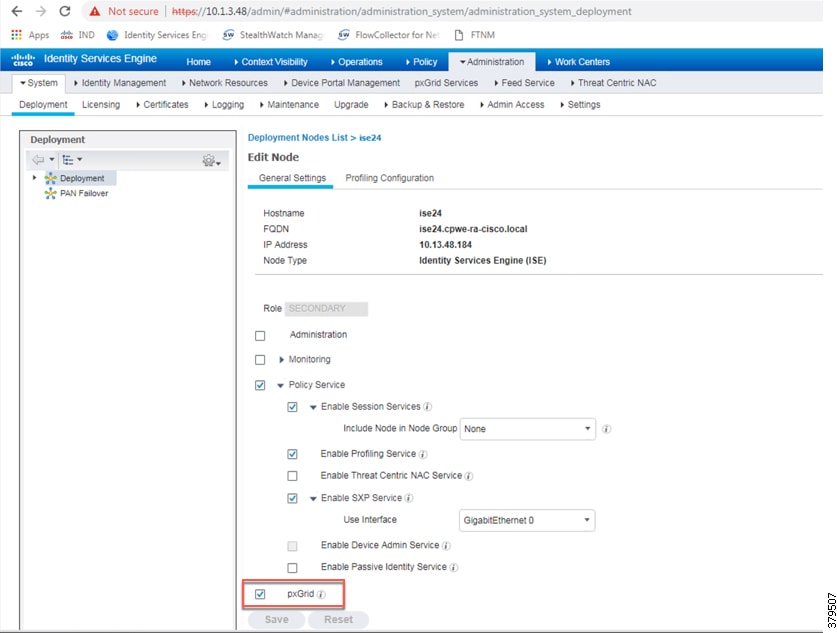
The next step is to verify if Cisco ISE has the IACS asset in the endpoint database.
Figure 52 Cisco ISE has Learned the IACS Asset
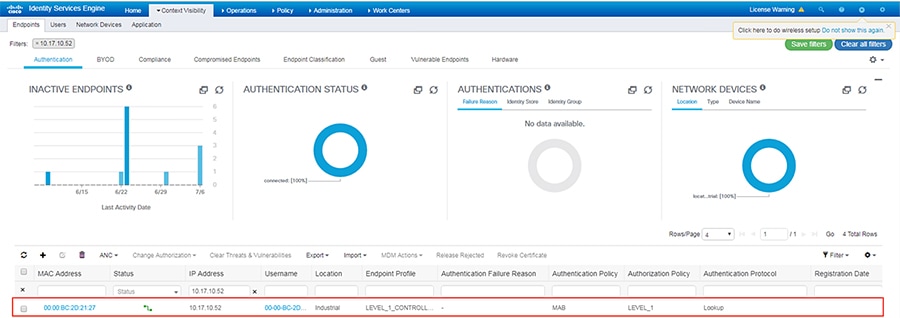
Verify that Profiling Policies are Configured Correctly
ISE profiles the IACS assets based on the profiling policy. If conditions in the profiling policy are not configured correctly, then ISE will not be able to profile the IACS asset.
Verify that Authentication and Authorization Policies are Configured Correctly in Cisco ISE
To assign an SGT to an IACS asset, the authentication and authorization policy conditions must match to the IACS device attributes.
Verify the pxGrid Probe is Enabled on the PSN
From the Cisco ISE web UI, navigate to Administration -> Deployment. Check the checkbox of the appropriate PSN and click Edit. Click the Profiling Configuration tab, then verify the pxGrid check box is checked
Figure 53 Verifying that pxGrid Probe is Enabled on the PSN
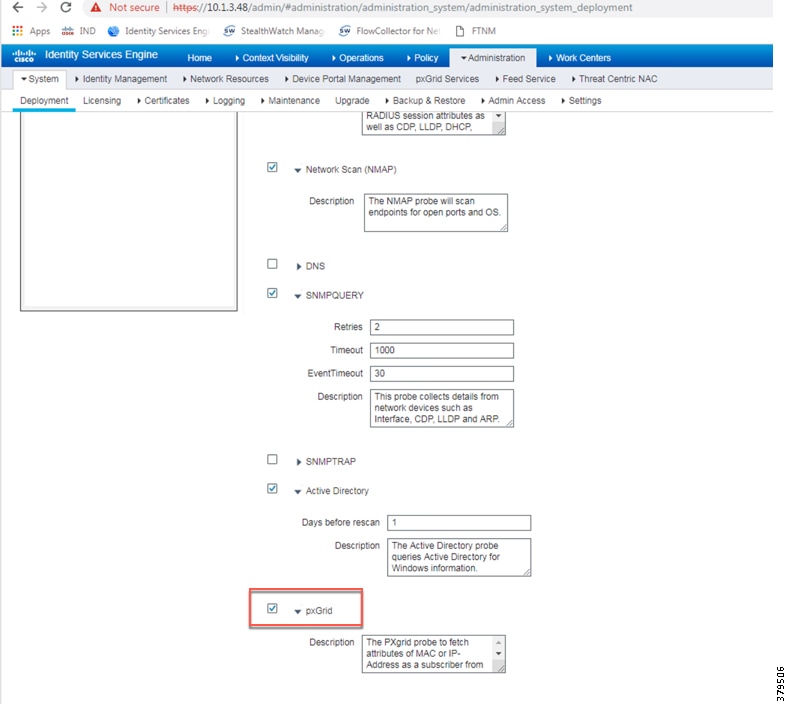
Verify Authentication and Authorization from RADIUS Live Logs
From the ISE web UI, navigate to Operations -> RADIUS -> Live Logs to view a list of devices that went through the authentication and authorization process.
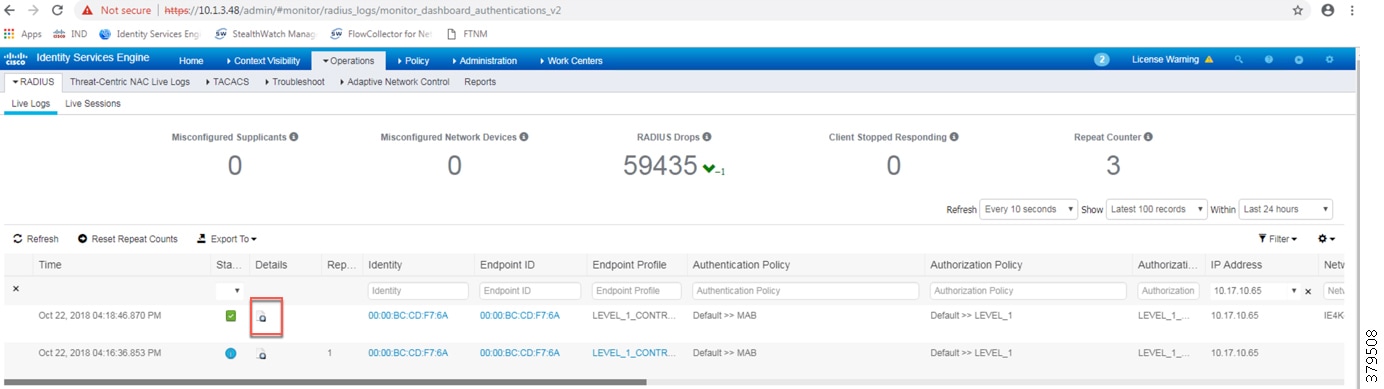
Click the icon in the Details column to view information about the asset and the RADIUS process.
Figure 55 Authentication and Authorization Results of an IACS Asset
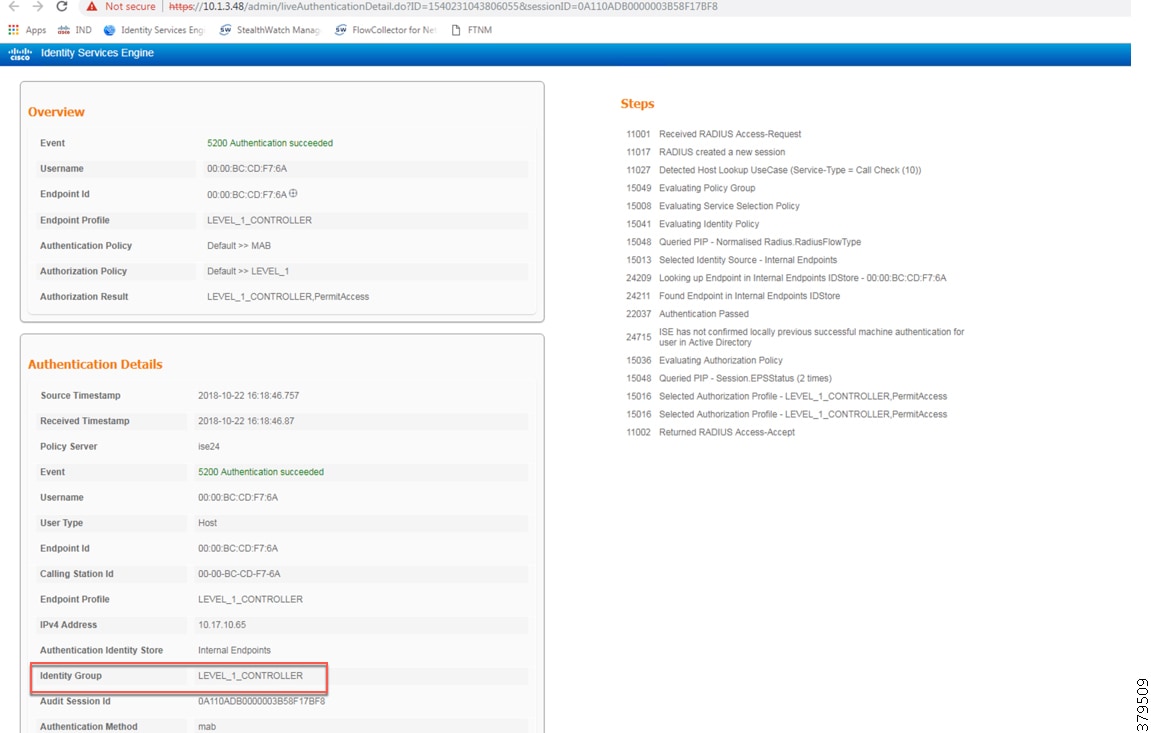
Distribution Switch is not Enforcing the Policy Correctly
Verify the SXP Connection between the Cisco ISE and the Switch
In addition, from the Cisco ISE web UI, navigate to Work Centers -> TrustSec -> SXP and verify the SXP status.
Figure 56 Verifying the SXP Status in ISE
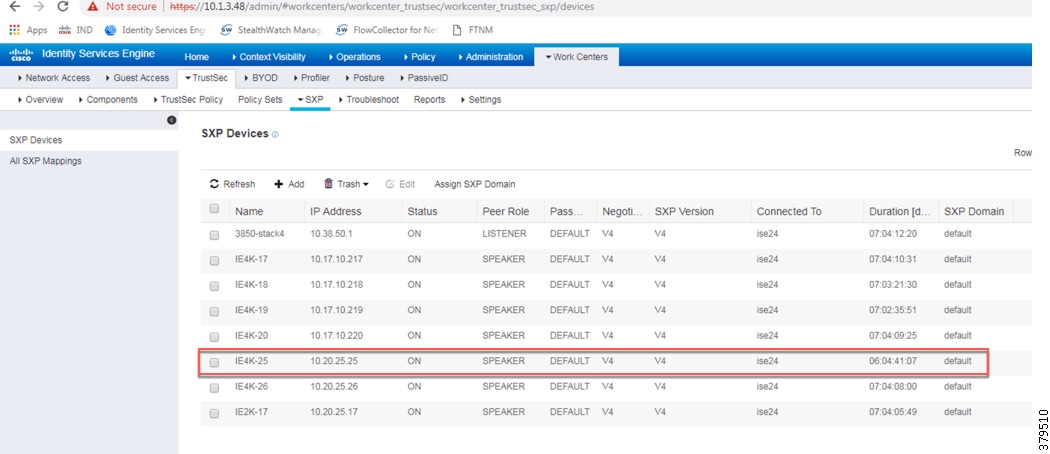
Verify Cisco ISE has Received the SGT-IP Mapping Information through the SXP Tunnel
Figure 57 Verifying the SXP Status of a Switch at ISE
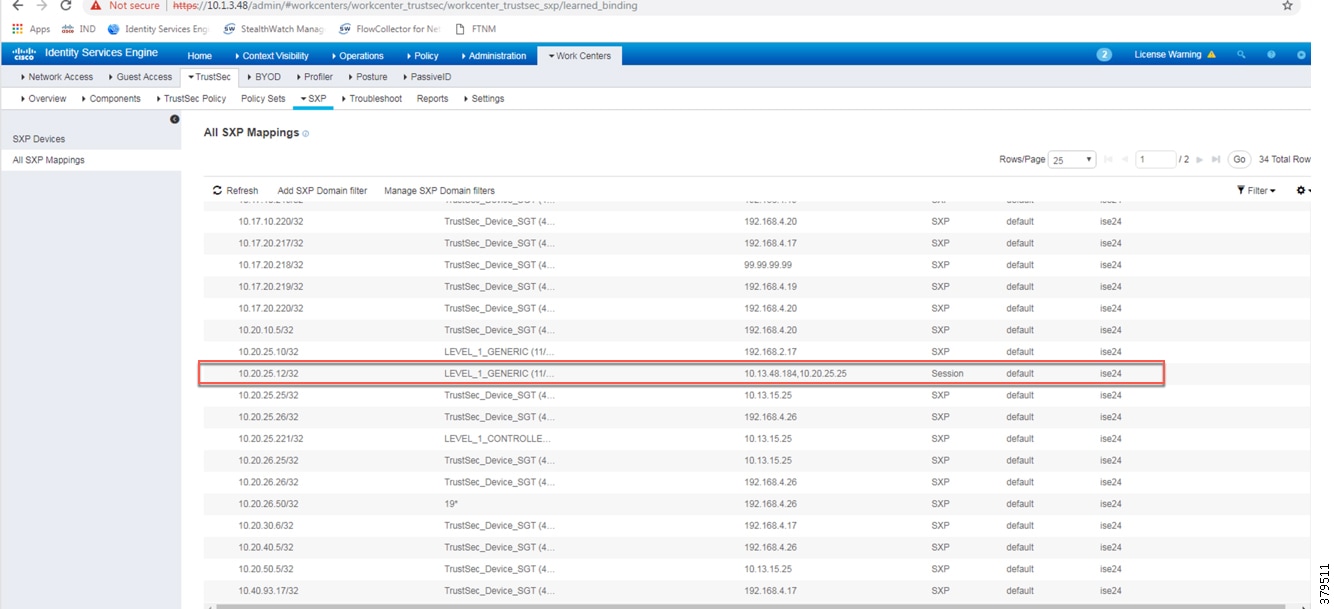
Verify the Distribution Switch has Received SGT Mappings through SXP
Verify that Policy Matrix is Downloaded to the Distribution Switch
Cisco ISE Troubleshooting Tips
The following section provides high level troubleshooting information to assist in identifying and resolving problems you may encounter when you use the Cisco ISE.
Note: For complete information on Cisco ISE monitoring and troubleshooting tips, refer to the following URL:
https://www.cisco.com/c/en/us/td/docs/security/ise/2-4/admin_guide/b_ise_admin_guide_24/b_ise_admin_guide_24_new_chapter_011001.html
Checking the Status of pxGrid
On the PSN, execute the following command to check the status of the pxGrid:
Verify the pxGrid Certificate on the PSN
From the ISE web UI, navigate to Administration -> System -> Certificates. Click the arrow button of the PSN to expand its certificate details.
Figure 58 Verifying pxGrid Certificate on the PSN
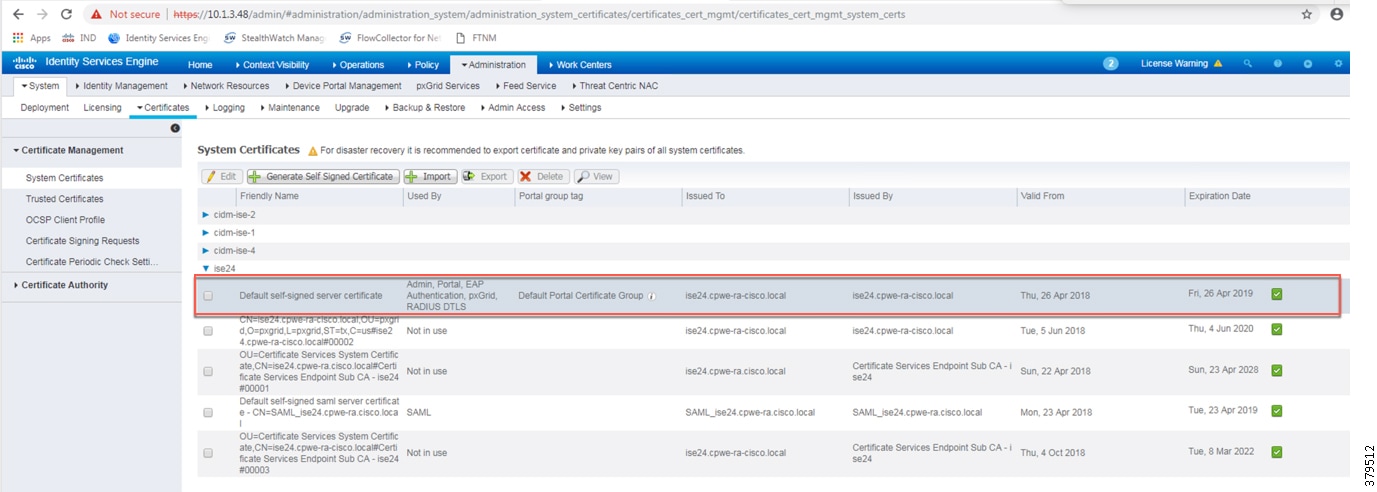
From the ISE web UI, navigate to Administration -> pxGrid Services. Verify Cisco Cyber Vision is registered as client.
Figure 59 Verifying pxGrid Client Status
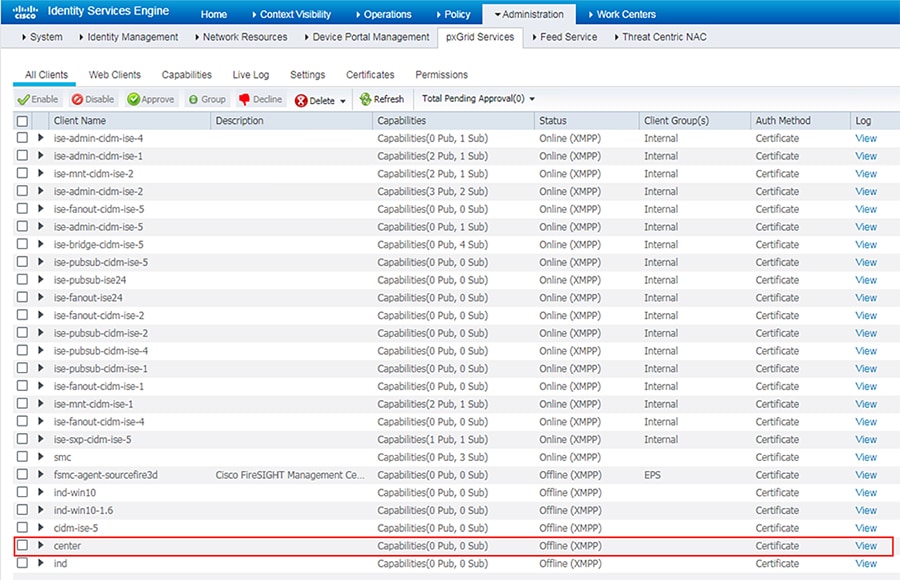
Cisco NetFlow Troubleshooting Tips
This section discusses some useful show commands for troubleshooting NetFlow records and their transmission.
Verify the NetFlow Record Parameters
Verify the Flow Exporter Destination IP Address
Verify the Flow Monitor Configuration
Verify the Flow Monitor is Applied to an Appropriate Interface
Troubleshooting Cisco Cyber Vision
Cisco Cyber Vision Center and ISE pxGrid Communication
To view the live logs of the pxGrid agent running on the Cisco Cyber Vision Center, do the following:
1.![]() Connect to the Cisco Cyber Vision Center over SSH.
Connect to the Cisco Cyber Vision Center over SSH.
3.![]() The scrolling output will display connection details and data attributes sent to pxGrid. An example of a successful connection:
The scrolling output will display connection details and data attributes sent to pxGrid. An example of a successful connection:
Things to check if the pxGrid connection is not successful:
■![]() The Cisco Cyber Vision Center can successfully ping both the IP address and the FQDN of the ISE pxGrid node.
The Cisco Cyber Vision Center can successfully ping both the IP address and the FQDN of the ISE pxGrid node.
■![]() The Cisco Cyber Vision Center certificate is in the ISE Trusted Certificates list.
The Cisco Cyber Vision Center certificate is in the ISE Trusted Certificates list.
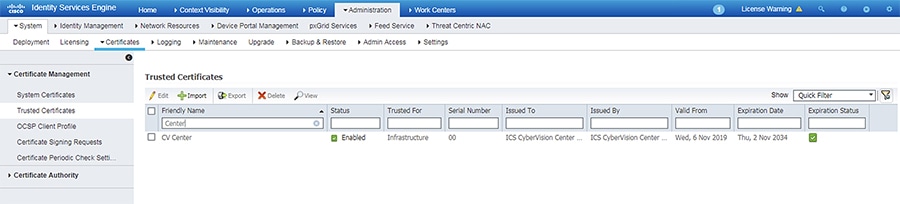
■![]() The Cisco Cyber Vision Center pxGrid certificate was configured correctly (see Cisco ISE Troubleshooting Tips).
The Cisco Cyber Vision Center pxGrid certificate was configured correctly (see Cisco ISE Troubleshooting Tips).
ISE Profiling with Cisco Cyber Vision Attributes
To view the attributes being sent from Cisco Cyber Vision, run the following command on the Cisco Cyber Vision Center CLI:
An example of component attributes:
To view the Cisco Cyber Vision attributes for a particular endpoint in ISE, do the following:
1.![]() From the ISE web UI, navigate to Content Visibility -> Endpoints.
From the ISE web UI, navigate to Content Visibility -> Endpoints.
2.![]() Search for an endpoint and click the link under the MAC Address column.
Search for an endpoint and click the link under the MAC Address column.
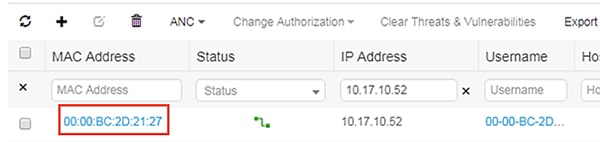
3.![]() Verify the Cisco Cyber Vision attributes are present.
Verify the Cisco Cyber Vision attributes are present.
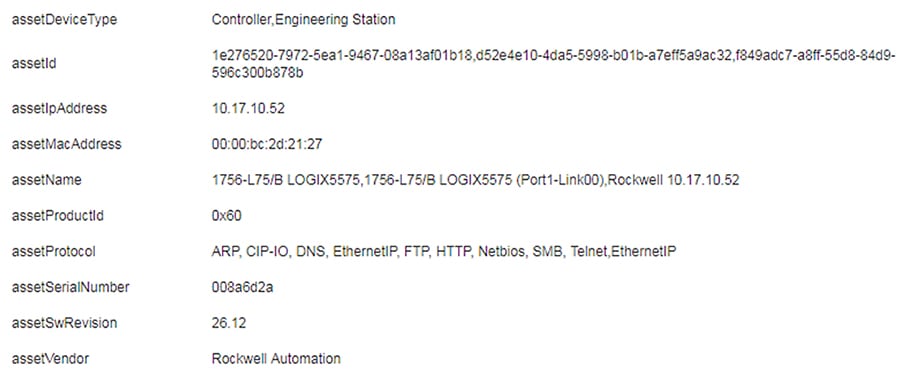
Things to check if the profiling is incorrect or the attributes are not present:
■![]() The profiling policy rules are accurate, including the certainty factor.
The profiling policy rules are accurate, including the certainty factor.
■![]() The endpoint is successfully authenticated to ISE.
The endpoint is successfully authenticated to ISE.
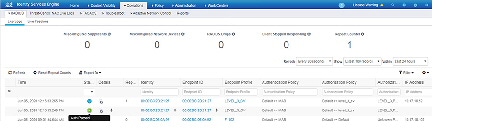
Cisco Cyber Vision Sensor Performance
To view the performance metrics of the Cisco Cyber Vision Sensors, do the following:
1.![]() From the Cisco Cyber Vision Center web UI, click the System Statistics icon at the top right of the page.
From the Cisco Cyber Vision Center web UI, click the System Statistics icon at the top right of the page.
3.![]() On the left side of the page is the list of Cisco Cyber Vision Sensors. Click one of the links to view the performance details for that particular Sensor. This page provides CPU and memory usage, as well as data throughput, including any dropped packets.
On the left side of the page is the list of Cisco Cyber Vision Sensors. Click one of the links to view the performance details for that particular Sensor. This page provides CPU and memory usage, as well as data throughput, including any dropped packets.
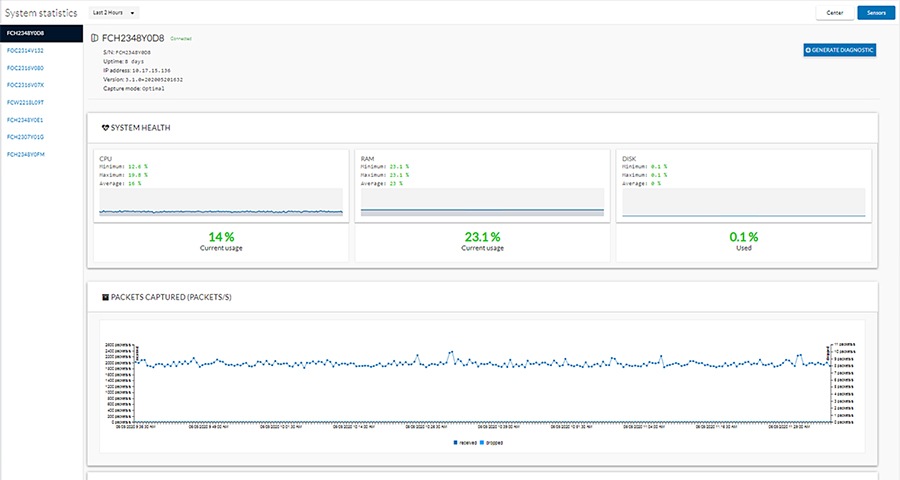
Cisco Cyber Vision Sensor Components
If components are not showing for a particular Cisco Cyber Vision Sensor, check the following:
■![]() The Cisco Cyber Vision Sensor application is running.
The Cisco Cyber Vision Sensor application is running.
–![]() From the switch web UI under Configuration -> Services -> IOx :
From the switch web UI under Configuration -> Services -> IOx :
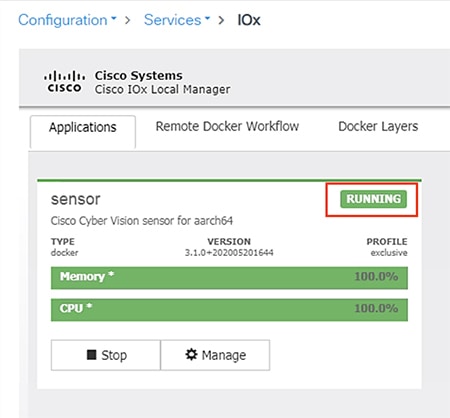
■![]() The switch can ping the Cisco Cyber Vision Center eth 1 interface IP address.
The switch can ping the Cisco Cyber Vision Center eth 1 interface IP address.
■![]() In the Cisco Cyber Vision Center web UI under Admin -> Sensors -> Management, the Status column for the particular Sensor shows as “Connected”.
In the Cisco Cyber Vision Center web UI under Admin -> Sensors -> Management, the Status column for the particular Sensor shows as “Connected”.
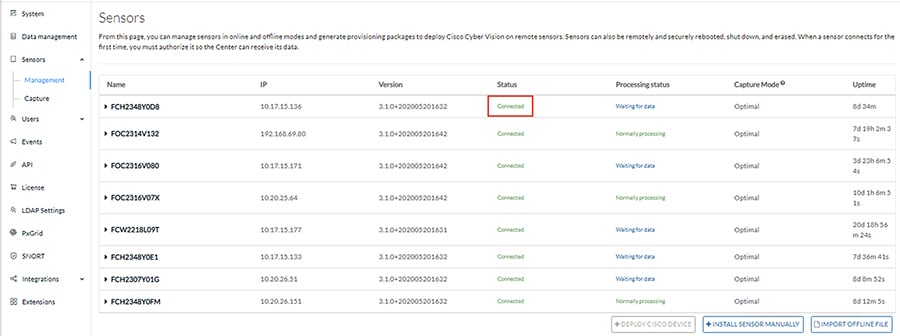
■![]() The switch system time is the same as the Cisco Cyber Vision Center system time.
The switch system time is the same as the Cisco Cyber Vision Center system time.
■![]() The switch ERSPAN configuration has the correct details, including appropriate source interface(s) or VLAN(s).
The switch ERSPAN configuration has the correct details, including appropriate source interface(s) or VLAN(s).
Site-wide Precision Time Protocol Troubleshooting
Syslog:
https://www.cisco.com/c/en/us/td/docs/switches/lan/cisco_ie3000/software/release/12-2_52_se/configuration/guide/ie3000scg/swlog.pdf
Third-party PTP-related Equipment and Application Troubleshooting Resources
Meinberg LANTIME Configuration and Management Manual
https://www.meinbergglobal.com/download/docs/manuals/english/ltos_6-24.pdf
Previous and Related Documentation
This design and implementation guide is an evolution of a significant set of industrial solutions issued by Cisco. In many ways, this document amalgamates many of the concepts, technologies, and requirements that are shared in industrial solutions. The vertical relevance will be maintained, but shared technical aspects are essentially collected and referred to by this document.
■![]() The existing documentation for manufacturing and oil and gas can be found on the Cisco Design Zone for Industry Solutions page:
The existing documentation for manufacturing and oil and gas can be found on the Cisco Design Zone for Industry Solutions page:
https://www.cisco.com/c/en/us/solutions/enterprise/design-zone-industry-solutions/index.html
■![]() The Cisco Catalyst 9300 and Cisco Catalyst 3850 are positioned as the distribution switches where there is a controlled IT environment.
The Cisco Catalyst 9300 and Cisco Catalyst 3850 are positioned as the distribution switches where there is a controlled IT environment.
–![]() Cisco Catalyst 3850 product page:
Cisco Catalyst 3850 product page:
https://www.cisco.com/c/en/us/products/switches/catalyst-3850-series-switches/index.html
–![]() Cisco Catalyst 9000 switching product page:
Cisco Catalyst 9000 switching product page:
https://www.cisco.com/c/en/us/products/switches/catalyst-9000.html
■![]() Cisco Catalyst 3850 StackWise—480 configuration:
Cisco Catalyst 3850 StackWise—480 configuration:
–![]() For Cisco Catalyst 3850
For Cisco Catalyst 3850
https://www.cisco.com/c/en/us/td/docs/switches/lan/catalyst3850/software/release/3se/ha_stack_manager/configuration_guide/b_hastck_3se_3850_cg/b_hastck_3se_3850_cg_chapter_010.html#reference_5415C09868764F0FA05F88897F108139
–![]() For Cisco Catalyst 9300
For Cisco Catalyst 9300
https://www.cisco.com/c/en/us/td/docs/switches/lan/catalyst9300/software/release/16-5/configuration_guide/stck_mgr_ha/b_165_stck_mgr_ha_9300_cg/managing_switch_stacks.html
■![]() Industrial Ethernet switching product page:
Industrial Ethernet switching product page:
https://www.cisco.com/c/en/us/products/switches/industrial-ethernet-switches/index.html
■![]() Cisco IE 3x00 Series Switch
Cisco IE 3x00 Series Switch
https://www.cisco.com/c/en/us/td/docs/switches/lan/cisco_ie3X00/software/16_10/release_note/b_1610_releasenote.html
■![]() Cisco IE 4000, Cisco IE 4010, and Cisco IE 5000:
Cisco IE 4000, Cisco IE 4010, and Cisco IE 5000:
–![]() Switch Software
Switch Software
https://www.cisco.com/c/en/us/td/docs/switches/lan/cisco_ie4010/software/release/15-2_4_EC/configuration/guide/scg-ie4010_5000.html
–![]() Switch Software Smartport configuration
Switch Software Smartport configuration
https://www.cisco.com/c/en/us/td/docs/switches/lan/cisco_ie4010/software/release/15-2_4_EC/configuration/guide/scg-ie4010_5000/swmacro.html
■![]() Cisco Industrial Network Director:
Cisco Industrial Network Director:
–![]() Network Management for Operational Technology in Connected Factory Architectures
Network Management for Operational Technology in Connected Factory Architectures
https://www.cisco.com/c/en/us/td/docs/solutions/Verticals/CPwE/5-1/IND/IND_Connected_Factory_CRD/IND_Connected_Factory_CRD.html
–![]() IEC 61588 Precision clock synchronization protocol for networked measurement and control systems
IEC 61588 Precision clock synchronization protocol for networked measurement and control systems
http://s1.nonlinear.ir/epublish/standard/iec/onybyone/61588.pdf
| https://www.cisco.com/c/en/us/solutions/enterprise/design-zone-manufacturing/landing_ettf.html |
Solution to assist manufacturers seeking to integrate or upgrade their Industrial Automation and Control System (IACS) networks to standard Ethernet and IP networking technologies. |
|
| https://www.cisco.com/c/en/us/solutions/industries/manufacturing/connected-factory/connected-factory-profinet.html |
Solution for PROFINET-based industrial environments to integrate Cisco Industrial Ethernet switches into the automation network. |
|
| https://www.cisco.com/c/en/us/td/docs/solutions/Verticals/MELCO/CC-Link_Connected_Factory.html |
Solution for CC-Link IE-based industrial environments to integrate Cisco Industrial Ethernet switches into the automation network. |
|
| https://www.cisco.com/c/en/us/solutions/industries/manufacturing/connected-machines.html |
Enable rapid and repeatable machine connectivity, providing business improvements such as overall equipment effectiveness (OEE) and machine monitoring. |
|
Connected Factory—Network Management for Operational Technology https://www.cisco.com/c/en/us/td/docs/solutions/Verticals/CPwE/5-1/IND/IND_Connected_Factory_CRD.html |
Discusses the use of Cisco's Industrial Network Director application for monitoring industrial network assets and discovering automation devices within the context of the Connected Factory solution. |
|
Connected Pipeline—Control Center https://www.cisco.com/c/en/us/solutions/enterprise/design-zone-manufacturing/connected-pipeline-control-center.html |
Secure, virtualized Control Center design for Oil & Gas pipeline operators, including secure remote access and operational support |
|
Connected Pipeline—Operational Telecoms https://www.cisco.com/c/en/us/solutions/enterprise/design-zone-manufacturing/connected-pipeline-operational-telecoms.html |
Best practice, secure, design guidance for Oil & Gas pipeline wide area networks and pipeline station networks. This includes networks between Control Centers, from Control Centers to pipeline stations, between pipeline stations, and inside pipeline stations |
|
Connected Refinery and Processing Facility https://www.cisco.com/c/en/us/solutions/enterprise/design-zone-manufacturing/connected-refinery-processing-facility.html |
Best practice, secure design guidance leveraging industrial wireless and mobility for next generation refining and processing |
 Feedback