APIC GUI Overview

This chapter contains the following sections:

Overview of the GUI

The APIC GUI is a browser-based graphical interface for configuring and monitoring the ACI fabric. The GUI is organized to provide hierarchical navigation to all components, logical and physical, of the overall system. The primary control regions of the GUI are shown in the following figure.

Figure 1. APIC GUI Regions

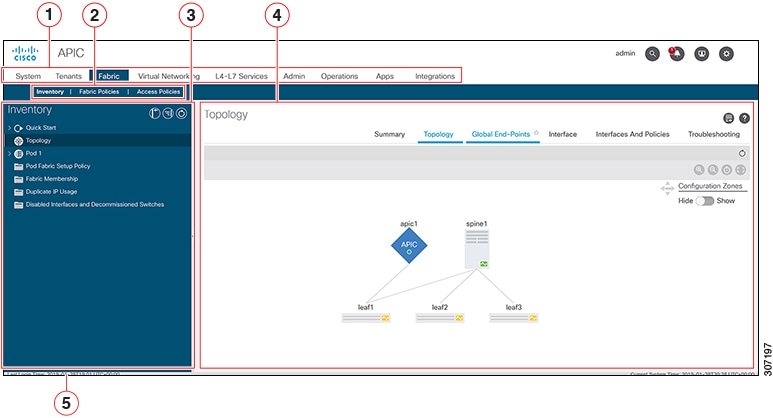
The functions of these regions are described in the following links:

  1. Menu bar and tool icons—See Menu Bar and Submenu Bar

  2. Submenu bar—See Menu Bar and Submenu Bar

  3. Navigation pane—See Navigation Pane

  4. Work pane—See Work Pane

  5. Last Login—Displays the date and time of the last instance of the current user's login.

  6. Integrations—See Integrations Tab

As you operate the GUI to make configuration changes and retrieve information, the GUI communicates with the underlying operating system by exchanging REST API messages. You can observe these API messages using the API Inspector tool described in Viewing an API Interchange in the GUI.

Menu Bar and Submenu Bar

The menu bar is displayed across the top of the APIC GUI. The menu bar provides access to the main configuration tabs, along with access to tools such as search, notifications, and preferences. Immediately below the menu bar is the submenu bar, which presents specific configuration areas for each selected menu bar tab. The submenu bar tabs are different for each menu bar tab and might also differ depending upon your specific configuration or privilege level.


Tip


In the APIC GUI configuration instructions, you will see notation such as Fabric > Fabric Policies. In this example, you are asked to click the Fabric tab in the menu bar followed by the Fabric Policies tab in the submenu bar.


At the far right side of the menu bar are the following menu bar tools:

Menu Bar Tools

Description

username

The name of the currently logged in local user.

Search

Alerts

User Profile and Preferences

System Tools

The individual menu bar tabs and tools are described in the following sections.

Menu Bar Tabs

System Tab

Use the System tab to collect and display a summary of the overall system health, its history, and a table of system-level faults.

In addition, the System tab provides the following functions:

  • You can configure global system policies in the System Settings submenu.

  • You can view your licensing status in the Smart Licensing submenu.

  • You can view user sessions in the Active Sessions submenu.

Tenants Tab

Use the Tenants tab in the menu bar to perform tenant management. The submenu bar provides a list of all tenants, an Add Tenant link, and links to three built-in tenants plus up to two of the most recently used tenants.

  • A tenant contains policies that enable qualified users domain-based access control. Qualified users can access privileges such as tenant administration and networking administration.

  • A user requires read/write privileges for accessing and configuring policies in a domain. A tenant user can have specific privileges into one or more domains.

  • In a multitenancy environment, a tenant provides group user access privileges so that resources are isolated from one another (such as for endpoint groups and networking). These privileges also enable different users to manage different tenants.

The built-in tenants are:

  • The common tenant is preconfigured for defining policies that provide common behavior for all the tenants in the fabric. A policy defined in the common tenant is usable by any tenant.

  • The infra tenant is preconfigured for configuration related to the fabric infrastructure

  • The mgmt tenant is preconfigured for inband and out-of-band connectivity configurations of hosts and fabric nodes (leafs, spines, and controllers).


Note


For Layer 2 configuration of ports, you can type into the node and path fields to filter ports.


Fabric Tab

The Fabric tab contains the following tabs in the submenu bar:
  • Inventory tab—Displays the individual components of the fabric.

  • Fabric Policies tab—Displays the monitoring and troubleshooting policies and fabric protocol settings or fabric maximum transmission unit (MTU) settings.

  • Access Policies tab—Displays the access policies that apply to the edge ports of the system. These ports are on the leaf switches that communicate externally.

Virtual Networking Tab

Use the Virtual Networking tab to view and configure the inventory of the various virtual machine (VM) managers. You can configure and create various management domains under which connections to individual management systems (such as VMware vCenters or VMware vShield) can be configured. Use the Inventory tab in the submenu bar to view the hypervisors and VMs that are managed by these VM management systems (also referred to as controllers in API).

L4-L7 Services Tab

Use the L4-L7 Services tab to perform services such as importing packages that define Layer 4 to Layer 7 devices such as a firewall, SSL offload, load balancer, context switch, SSL termination device, or intrusion prevention system (IPS). In the Inventory submenu tab, you can view existing Layer 4 to Layer 7 devices registered with the controller. The Packages submenu tab allows you to import L4-L7 device packages, which are used to define, configure, and monitor a network service device.

Admin Tab

Use the Admin tab to perform administrative functions such as authentication, authorization, and accounting functions, scheduling policies, retaining and purging records, upgrading firmware, and controlling features such as syslog, Call Home, and SNMP.

Operations Tab

The Operations tab provides the following built-in tools for planning and monitoring fabric resources.
  • Visibility & Troubleshooting—Shows the location of specified end points in the fabric and displays the traffic path, including any L4-L7 devices.

  • Capacity Dashboard—Displays the available capacity of configurable resources such as end points, bridge domains, tenants, and contexts.

  • EP Tracker—Enables you to view virtual and bare metal endpoint connections and disconnections to leaf switches and FEXes.

  • Visualization—Provides visualization of traffic maps.

Apps Tab

The Apps tab displays all the applications installed or uploaded to APIC. The tab allows an APIC administrator to upload, enable, upgrade, install, or uninstall a packaged application in APIC.

Integrations Tab

Use the Integrations tab to view all third-party integrations.

Menu Bar Tools

Search

Click the Search icon to display the search field. The search field enables you to locate objects by name or other distinctive fields.

Figure 2. Search

The search function allows the use of wildcards (*).

Alerts

Click the alert menu bar icon to view a list of active alerts. When system alerts are available, a numeric badge will appear on the alert icon indicating the number of active alerts. When critical system notifications are available, the alert icon will blink red. To view the alerts, click the following icon.

Figure 3. Alerts

To disable blinking of the alert icon, remove all critical alerts from the alert list. A disabled Close button on a critical alert indicates that you must first resolve the underlying issue before the alert can be cleared.

User Profile and Preferences

To configure settings and preferences for the logged in user, click the following menu bar icon and select an item from the drop-down list.

Figure 4. User Profile and Preferences

The following selections are available:

  • Favorites—Display links to menus bookmarked by the user.

    Menus that display the Favorites icon () can be bookmarked by clicking the icon.

  • Change My Password—Change the password of the currently logged in local user.

  • Change My SSH Keys—Change the user's public SSH key used for certificate-based login.

  • Change My X509 Certificate—Change the user's X.509-format certificate for login.

  • View My Permissions—Display the user's role-based read and write privileges for domains and accessible objects.

  • Settings—Change general GUI settings.

    • Remember Tree Selection—Enable the GUI to keep the navigation tree expanded when returning to a window. For example, if you enable this property and expand the navigation tree in the Tenants tab, click on the Fabric tab, then return to the Tenants tab, the tree will remain expanded.

    • Preserve Tree Divider Position—Enable the GUI to keep the position of the tree divider after dragging the tree divider to the desired location.

    • Disable Notification on Success—Suppress the success dialog box notification.

    • Disable Deployment Warning at Login—Disable the Deployment Warning dialog box when logging in. See Deployment Warning and Policy Usage Information.

    • Default Page Size for Tables—Set the GUI table size.

    • Show All UI Sections—Display hidden UI configuration options.

    • Show What's New at Login—Display splash screen at login, showing recent features.

    • Enable Single-Browser Session (SBS)—Allows logging in to the APIC GUI and then opening additional browser tabs or windows to the same APIC without being required to log in from each new tab or window. See Single-Browser Session Management.

  • Change Deployment Settings—Enable and set the scope of the deployment notification. See Deployment Warning and Policy Usage Information.

  • Logout—Exit the APIC configuration GUI.

System Tools

To access the system tools, click the following menu bar icon and select an item from the drop-down list.

Figure 5. System Tools

The following selections are available:

  • Help—Display the online help.

  • Documentation—Display links to API documentation and to the APIC documentation home page.

  • Show API Inspector—Open the API Inspector, which is a built-in tool of the APIC that allows you to view the internal API messages between the GUI and the APIC operating system to execute tasks. For more information, see Viewing an API Interchange in the GUI.

  • Start Remote Logging—Forward logging information to a remote URL.

  • Object Store Browser—Open the Managed Object Browser, or Visore, which is a utility built into APIC that provides a graphical view of the managed objects (MOs) using a browser.

  • Show Debug Info—Open a status bar at the bottom of the GUI to display information such as current managed object (MO) and system time. When the status bar is open, this selection changes to Hide Debug Info.

  • Config Sync Issues

  • About—Display the APIC version.


Note


Global system settings are configured in System > System Settings.


Navigation Pane

Use the Navigation pane, which is on the left side of the APIC GUI below the submenu bar, to navigate to all elements of the submenu category.

For each submenu category, the Navigation pane is organized as a hierarchical tree of objects, logical and physical, related to that category. These objects typically represent ports, policies, or groupings of other objects. When you select an object in the Navigation pane, details of the object display in the Work pane.

When you right-click an object in the Navigation pane, you might be presented with a menu of possible actions related to the object, such as one or more of the following actions:

  • Delete—Delete the object.

  • Create <type of object>—Create a new object.

  • Save as...—Download the object and its properties in JSON or XML format to a local file.

  • Post...—Export the object and its properties to an existing local file.

  • Share—Displays the URL of the object. You can copy the URL and send it to others.

  • Open In Object Store Browser—Open the object in Visore, a built-in utility that displays an object and its properties. This information may be useful in troubleshooting or for developing API tools.

  • Clone—Create a copy of the object. This action is useful for deriving a new contract or policy based on an existing contract or policy.


Note


If any container in the Navigation pane, for example Application Profiles under a Tenant, contains more than 40 profiles, you cannot click on a profile and expand it in the Navigation pane. You must select the desired profile from the Work pane and expand it.

Work Pane

Use the Work pane, which is on the right side of the APIC GUI, to display details about the component that you selected in the Navigation pane.

The Work pane includes the following elements:

  • A content area that displays tabs. These tabs enable you to access information that is related to the component that you chose in the Navigation pane. The tabs displayed in the content area depend upon the selected component.

  • A link to context-sensitive online help that is represented by a question mark icon in the upper right corner.

  • For some components, a link to conceptual information related to the component, represented by a list icon in the upper right corner.

  • You can bookmark almost any page, which enables you to go back to that page easily by choosing the bookmark from your list of bookmarks.

    Bookmarked links are accessible from the User Profile and Preferences icon in the Menu Bar.

  • You can mark a tab as the "favorite" on a page. Whenever you navigate to that page, that tab will be the default tab that is displayed. This feature is enabled only for the tabs in the Work pane; you cannot mark a menu bar tab as a favorite.

Common Pages in the Work Pane

In addition to displaying specific task menus, the Work pane also displays several types of special-purpose menus described in this section.

Quick Start Pages

Many APIC menu and submenu tabs open an initial Quick Start page, which summarizes the purpose of the tab, provides links to step-by-step instructions and videos for commonly-used procedures, and provides shortcut links to commonly-used subsections within the tab. An overall Quick Start page at System > QuickStart assists you in performing common and basic procedures, providing step-by-step instructions, available concept information, and links to main functional areas in the GUI.

Dashboard Pages

Dashboard pages provide at-a-glance summaries of the status of the ACI system and major system components, including health score trends, components with below-threshold health scores, and fault counts. You can configure health score thresholds to determine when components will appear in the dashboard. The system dashboard page at System > Dashboard summarizes the health of the overall ACI system, while switch dashboard pages at Fabric > Inventory > Pod n > component > Dashboard summarize the health and faults of each spine and leaf switch.

Summary Pages

Many top-level folders in the Navigation pane display tile-based Summary pages in the Work pane that link to subfolders. Some Summary pages, such as those in Fabric > Inventory > Pod n, contain tiles summarizing major components along with brief health and fault information for each component. Other Summary pages, such as those in Fabric > Fabric Policies > Policies, contain tiles that describe the configuration areas served by the contained folders.

Personalizing the Interface

Naming the APIC GUI

An ACI controller cluster comprises three or more APICs. In some cases, it might be helpful to know which APIC you are viewing. Perform the following steps to add a custom name to the heading of the APIC GUI.

Procedure


Step 1

On the APIC menu bar, choose System > System Settings.

Step 2

In the Navigation pane, click APIC Identification Preferences.

Step 3

In the work pane, type the desired APIC name in the GUI Alias box.

Step 4

Click Submit.

The APIC name appears in parentheses at the top left of the GUI.

Adding a Login Banner to the CLI or GUI

You can define banners to be displayed when the user is prompted to log in to the CLI or GUI. The CLI banner is a simple text string to be printed at the terminal before the password prompt. You can define a banner for the APIC CLI and a separate banner for the switch CLI. The GUI banner displays at the APIC URL before user login authentication. The GUI banner is defined as a URL of a site hosting the desired HTML.

Procedure


Step 1

On the APIC menu bar, choose System > System Settings.

Step 2

In the Navigation pane, click APIC Identification Preferences.

Step 3

In the work pane, complete the following fields as desired:

  1. To configure an APIC CLI banner, type the banner text into the Controller CLI Banner textbox.

  2. To configure a switch CLI banner, type the banner text into the Switch CLI Banner textbox.

  3. To configure an APIC GUI banner, type the URL of a site hosting the desired HTML into the GUI Banner (URL) textbox.

    Note


    The URL site owner must allow the site to be placed in an iFrame to display the informational banner. If the owner of the site sets the x-frame-option to deny or sameorigin, the site the URL points to will not appear.

Step 4

Click Submit.


Single-Browser Session Management

Beginning with Cisco APIC Release 4.0(1), you can log in to the APIC GUI and then open additional browser tabs or windows to the same APIC without being required to log in from each new tab or window. This behavior is disabled by default and can be enabled by checking the Enable Single-Browser Session (SBS) checkbox in the User Profile and Preferences > Settings menu from the main menu bar tools.

If you want to log in to APIC from different tabs or windows of a browser using different credentials, make sure the single-browser session management feature is disabled.

Deployment Warning and Policy Usage Information

By configuring Deployment Warning Settings, you can enable the automatic display of policy usage information whenever you modify or delete policies that might affect other resources or policies. The policy usage information allows you to identify which resources and policies are being used by the policy that you are currently modifying or deleting. Tables display the nodes where the given policy is used and other policies that use this policy. By default, usage information is displayed within a dialog box whenever you attempt to modify a policy. Also, at any time, you can click the Show Usage button at the bottom of the screen to view the same information.

The Deployment Warning Settings dialog box allows you to enable and alter the scope of deployment notification that displays policy usage information. You can access this dialog box by selecting Change Deployment Settings in the menu bar tool User Settings and Preferences drop-down list or through a button on the Policy Usage Information dialog box.

When the Policy tab is selected in the upper right corner of the Deployment Warning Settings dialog box, you can configure the following policy options:

  • (Global) Show Deployment Warning on Delete/Modify—Enable the Deployment Warning notification for every policy deletion or modification across the APIC.

  • (Local) Show Deployment Warning on Delete/Modify—Set the rule for the Deployment Warning notification for specific policy configuration.

    • Use Global Settings—Use the setting selected for (Global) Show Deployment Warning on Delete/Modify.

    • Yes—Display the Deployment Warning notification before submitting configuration modifications on any policy change. Valid for this browser session only.

    • No—Do not display the Deployment Warning notification before submitting configuration modifications on any policy change. Valid for this browser session only.

When the History tab is selected in the upper right corner of the Deployment Warning Settings dialog box, you can view tables of Events and Audit Log entries for previous deployment warnings.

Graphical Configuration of Ports

The APIC GUI provides a graphical method for configuring ports, port channels, and virtual port channels on the leaf switches in the fabric, configure ports for dynamic breakout, and link interfaces to FEX switches. This configuration capability is present in the following GUI locations:

  • Fabric > Inventory > Topology

  • Fabric > Inventory > Pod

  • Fabric > Inventory > Pod > Leaf

  • Fabric > Inventory > Pod > Spine

In the Work pane's Interface tab, click on the + button (at the top left), select one or more switches to configure, and click Add Selected. To select multiple switches, use Ctrl+Click or Shift+Click.

The switches are graphically displayed with their ports and links. If you have configured a breakout port, a block containing the sub ports is displayed below the leaf diagram.


Note


If you accessed the Interface tab from a leaf switch, the leaf switch is automatically added.

Select the interfaces to configure. When interfaces are selected, the available configuration buttons appear. Depending on the number of selected interfaces and where they are located, you can then click one of the following buttons at the top of the page:

  • L2—Layer 2. Visible when you click one or more leaf interfaces on the switch diagrams.

  • PC—Port Channel. Visible when you click one or more leaf interfaces on the switch diagrams.

  • VPC—Virtual Port Channel. Visible when you click at least one interface on two switch diagrams.

  • FEX—Fabric Extender. Visible when you click one or more leaf interfaces on the switch diagrams.

  • Breakout—Breakout mode. Visible when you click one or more leaf interfaces on the switch diagrams.

  • Fabric—Add policies to a fabric interface. Visible when you click a port that is eligible to be a fabric port.

  • Uplink and Downlink—Convert eligible uplinks to downlinks and vice versa.

  • Spine—Visible when you click one or more leaf interfaces on the switch diagrams.

Viewing an API Interchange in the GUI

When you perform a task in the APIC graphical user interface (GUI), the GUI creates and sends internal API messages to the operating system to execute the task. By using the API Inspector, which is a built-in tool of the APIC, you can view and copy these API messages. A network administrator can replicate these messages in order to automate key operations, or you can use the messages as examples to develop external applications that will use the API.

Procedure


Step 1

Log in to the APIC GUI.

Step 2

In the upper right corner of the APIC window, click the System Tools icon to view the drop-down list.

Step 3

In the drop-down list, choose the Show API Inspector.

The API Inspector opens in a new browser window.

Step 4

In the Filters toolbar of the API Inspector window, choose the types of API log messages to display.

The displayed messages are color-coded according to the selected message types. This table shows the available message types:

Name Description
trace Displays trace messages.
debug Displays debug messages. This type includes most API commands and responses.
info Displays informational messages.
warn Displays warning messages.
error Displays error messages.
fatal Displays fatal messages.
all Checking this checkbox causes all other checkboxes to become checked. Unchecking any other checkbox causes this checkbox to be unchecked.

Step 5

In the Search toolbar, you can search the displayed messages for an exact string or by a regular expression.

This table shows the search controls:

Name Description
Search In this text box, enter a string for a direct search or enter a regular expression for a regex search. As you type, the first matched field in the log list is highlighted.
Reset Click this button to clear the contents of the Search text box.
Regex Check this checkbox to use the contents of the Search text box as a regular expression for a search.
Match case Check this checkbox to make the search case sensitive.
Disable Check this checkbox to disable the search and clear the highlighting of search matches in the log list.
Next Click this button to cause the log list to scroll to the next matched entry. This button appears only when a search is active.
Previous Click this button to cause the log list to scroll to the previous matched entry. This button appears only when a search is active.
Filter Check this checkbox to hide nonmatched lines. This checkbox appears only when a search is active.
Highlight all Check this checkbox to highlight all matched fields. This checkbox appears only when a search is active.

Step 6

In the Options toolbar, you can arrange the displayed messages.

This table shows the available options:

Name Description
Log Check this checkbox to enable logging.
Wrap Check this checkbox to enable wrapping of lines to avoid horizontal scrolling of the log list
Newest at the top Check this checkbox to display log entries in reverse chronological order.
Scroll to latest Check this checkbox to scroll immediately to the latest log entry.
Clear Click this button to clear the log list.
Close Click this button to close the API Inspector.

Example

This example shows two debug messages in the API Inspector window:


13:13:36 DEBUG - method: GET url: http://192.0.20.123/api/class/infraInfra.json 
response: {"imdata":[{"infraInfra":{"attributes":{"instanceId":"0:0","childAction":"",
"dn":"uni/infra","lcOwn":"local","name":"","replTs":"never","status":""}}}]}

13:13:40 DEBUG - method: GET url: http://192.0.20.123/api/class/l3extDomP.json?
query-target=subtree&subscription=yes 
response: {"subscriptionId":"72057598349672459","imdata":[]} 

GUI Icons

Table 1. Frequently Displayed Icons in the APIC GUI
Icons Description

Search

Alerts

User Profile and Preferences

System Tools

Bookmark this page

Displays online help information for the current menu page

Displays concept information for the current menu page

Quick Start

Plays a Quick Start video

Displays a Quick Start procedure

Link to related section

Topology

Pod

Collapse Tree View

Expand Tree View

Collapse All Nodes

Displays a drop-down list of actions

Refresh the displayed information

Download to a file

Upload a file

Fault, Statistics, and Health Level Icons

Table 2. Severity Levels of Faults Displayed in the APIC GUI
Icons Description

Critical—This icon displays a fault level with critical severity.

Major—This icon displays a fault level with major severity.

Minor—This icon displays a fault level with minor severity.

Warning—This icon displays a fault level that requires a warning.