Topology
The Topology window displays color-encoded nodes and links that correspond to various network elements, including switches, links, fabric extenders, port-channel configurations, virtual port-channels, and more. For information about each of these elements, hover your cursor over the corresponding element. Also, click a node or the line for a link. A slide-in pane appears from the right side of the window. This pane displays detailed information about either the switch or the link.
 Note |
You can open multiple tabs simultaneously and can function side by side to facilitate comparison and troubleshooting. |
Status
The color coding of each node and link corresponds to its state. The colors and what they indicate are described in the following list:
-
Green: Indicates that the element is in good health and functioning as intended.
-
Yellow: Indicates that the element is in warning state and requires attention to prevent any further problems.
-
Red: Indicates that the element is in critical state and requires immediate attention.
-
Gray: Indicates lack of information to identify the element or the element has been discovered.
Note
-
In the Topology window, FEX appears in gray (Unknown or n/a) because health is not calculated for FEX.
Similarly, in the Fabric Builder topology window there is no configuration sync status for the FEX and it appears as n/a.)
-
After moving a cable from one port to another port, the old fabric link is retained in the Topology window, and it is shown in the red color indicating that the link is down. The port movements are not updated in the Topology window. You need to rediscover the switch for the updated ports to be displayed in DCNM.
-
-
Black: Indicates that the element is down.
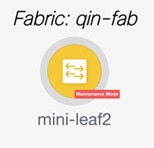
Starting from Cisco DCNM Release 11.4(1), if a switch is in maintenance mode, a Maintenance Mode badge is displayed next to the switch. If a switch is in migration mode, a Migration Mode badge is displayed next to the switch.
Scope
You can search the topology based on the scope. The default scopes available from the SCOPE drop-down list is: DEFAULT_LAN
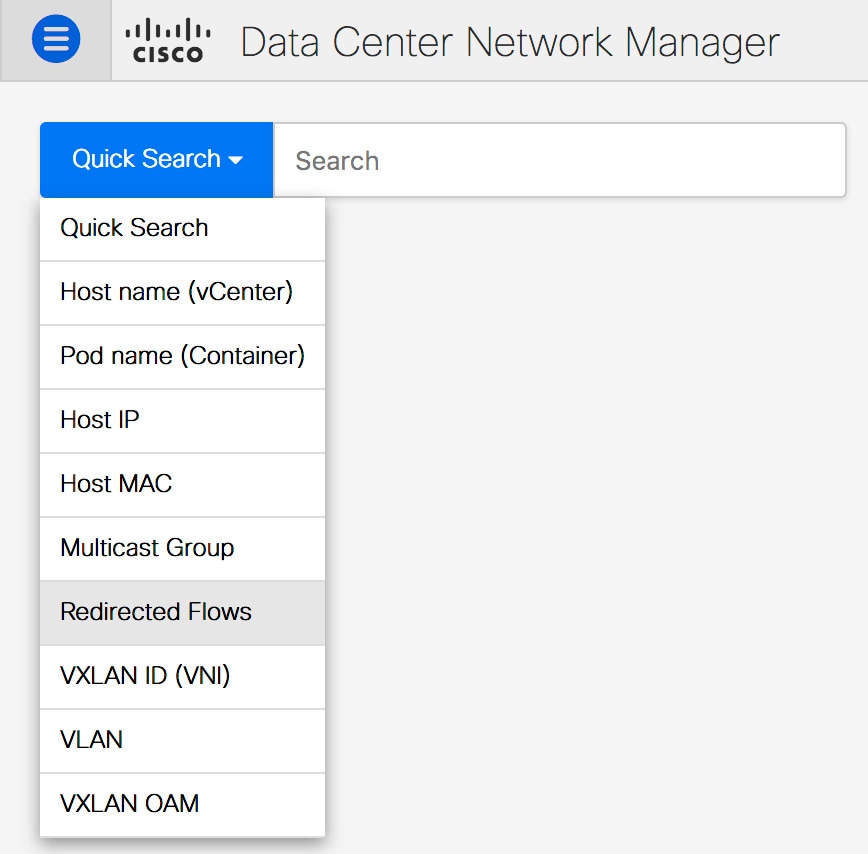
The following search options are available for DEFAULT_LAN:
-
Quick Search
-
Host name (vCenter)
-
Host IP
-
Host MAC
-
Multicast Group
-
VXLAN ID (VNI)
-
VLAN
-
FabricPath
-
VXLAN OAM
Searching
When the number of nodes is large, it quickly becomes difficult to locate the intended switches and links. You can quickly find switches and links by performing a search. You are also able to search for VM tracker and generic setups. Searching feature enables you to see which leaf the host is connected to.
The following searches are available:
Note |
By default, Quick Search is selected. |
Quick Search
Quick Search enables you to search for devices by name, IP address, model, serial number, and switch role. As you enter a search parameter in the Search field, the corresponding switches are highlighted in the topology. To perform a search for multiple nodes and links, separate multiple keywords using a comma, for example, ABCD12345, N7K, sw-dc4-12345, core, 172.23.45.67. Cisco DCNM supports wildcard searches too. If you know a serial number or switch name partially, you can build a search based on these partial terms that are preceded by an asterisk, for example, ABCD*, sw*12345, core, and so on.
To limit the scope of your search to a parameter, enter the parameter name followed by a space and the parameter in the Search field, for example, name=sw*12345, serialNumber=ABCD12345, and so on.
Host name (vCenter)
The host name search enables you to search for hosts by using vCenter.
Pod Name (Container)
You can also click on the Pod List to view the information regarding all the pods running on the selected Cluster. If Cluster Selection is All, all the pods running on all the clusters in your topology is displayed. You can also export the Pod List data for further analysis.
Host IP
You can search the topology using host IP addresses. The Host IP searches the switches in the scope to locate the hosts that match the IP address that you enter in the Search field. The Host IP search supports IPv4 address. From the Search drop-down list, choose Host IP to search the topology using the IP Address of the host device. Enter a host IP address in the Search field and press Enter. Click Details to view the corresponding host details.
Host MAC
You can search a topology using host MAC addresses. The Host MAC searches the switches in the scope to locate the hosts that match the MAC address that you enter in the Search field. From the Search drop-down list, choose Host MAC to search the topology using a host MAC address. Enter a host MAC address in the Search field and press Enter. Click Details to view the corresponding host details.
Multicast Group
The Multicast Group search is limited to the VXLAN context, VXLAN tunnel endpoint or VTEP switches, to get VXLAN IDs (VNIs) associated with this multicast address.
Select the Multicast Group search from the drop-down list, enter a multicast address in the search field, and press Enter. Click the Details link next to the search field to get the detailed multicast address table. The table displays switches, which have the searched multicast address configured on them, along with associated VNI, VNI status, and mapped VLAN.
You can also hover over switches that are highlighted to view details about the search you have performed.
Redirected Flows
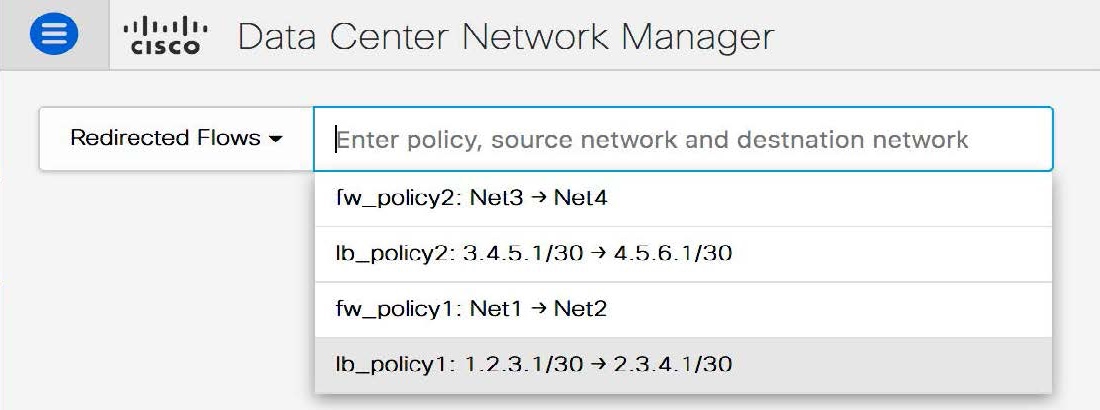
After the physical attachment of a service node to the fabric is defined, select Redirected Flow from the Quick Search drop-down list in the Topology window.
You can select a policy from the drop-down list or initiate a search by entering a policy name, source network and destination network in the search field. The search field is auto-populated based on your input.
Based on the input in the search field, the switches are highlighted on the topology window. The switches, on which the source and destination network have been attached and the flow has been redirected, are highlighted on the topology window. The service node is shown as connected by a dotted line to the leaf switch on the topology window. Hover over the dotted line to get more information about the interface. Click a switch to display the redirected flows which are initiated, redirected to, or terminated on that switch. Click Show more flows to display the Service Flows window that has information about all the redirected flows.

Click Details in the Service Flows window to display attachment details.


VXLAN ID (VNI)
The VXLAN ID or the VNI search lets you search the topology by VNI. Select the VXLAN ID (VNI) search from the drop-down list. Enter a VNI in the search field and press Enter. Click the Details link next to the search field to view the detailed VNI table. The table displays the switches that have VNI configured on them along with associated multicast address, VNI status, and mapped VLAN.
VLAN
Search by a given VLAN ID. VLAN search provides the search for the VLAN configured on the switch or the links. If STP is enabled, then it provides information that is related to the STP protocol and the STP information for links.
VXLAN OAM
You can track details such as reachability and actual path of the flows in a VXLAN EVPN based-fabric topology by choosing the VXLAN OAM option from the Search drop-down list or by entering VXLAN OAM in the Search field. This displays the Switch to switch and Host to host tabs. DCNM highlights the route on the topology between the source and destination switch for these two options.
The Switch to switch option provides the VXLAN OAM ping and traceroute test results for the VTEP-to-VTEP use-case. Provide the following values to enable search by using the Switch to switch option:
-
From the Source Switch drop-down list, choose the source switch.
-
From the Destination Switch drop-down list, choose the destination switch.
-
From the VRF drop-down list, choose or enter the VRF details.
-
Check the All Path Included check box to include all the paths in the search results.
The Host to host option provides the VXLAN OAM pathtrace results for the exact path that is taken by a given flow from the VTEP or switch that is connected to the source host to VTEP or switch that is connected to the destination host. For the Host to host use-case, there are two suboptions:
-
VRF or SVI for a network is instantiated on the switches in the VXLAN EVPN fabric. In such a scenario, the IP address information of the end hosts is required.
-
Layer 2 configuration for a given network is instantiated on the switches in the VXLAN EVPN fabric. In such a scenario, both the MAC and IP address information of the end hosts are required.
Provide the following values to enable search using the Host to host option:
-
In the Source IP field, enter the IP address of the source host.
-
In the Destination IP field, enter the IP address of the destination host.
-
In the VRF field, choose VRF from the drop-down list or enter the VRF name that is associated with the hosts.
-
(Optional) In the Source Port field, choose Layer 4 source port number from the drop-down list or enter its value.
-
(Optional) In the Destination Port field, choose destination port number or enter its value.
-
(Optional) In the Protocol field, choose the protocol value from the drop-down list or enter its value. This is the Layer 4 protocol, usually TCP or UDP.
-
Click the Interchange/Swap Source and Destination IPs (and MACs if applicable) icon to interchange the source and destination IP addresses. This interchange allows a quick trace of the reverse path without reentering the host IP addresses or MAC addresses.
-
Check the Layer-2 only check box to search the VXLAN-EVPN fabric that is deployed in Layer 2 only mode for some networks, that is, Layer 2 VNIs. Note that no SVIs or VRFs should be instantiated in the fabric for these networks when you use this search option.
Enter values for the following additional fields:
Show Panel
You can choose to view your topology based on the following options:
-
Auto Refresh: Check this check box to automatically refresh the topology.
-
Switch Health: Check this check box to view the switch's health status.
-
FEX: Check this check box to view the Fabric Extender.
From Cisco NX-OS Release 11.4(1), if you uncheck this check box, FEX devices are hidden in the Fabric Builder topology window as well. To view FEX in Fabric Builder, you need to check this check box. This option is applicable for all fabrics and it is saved per session or until you log out of DCNM. If you log out and log in to DCNM, the FEX option is reset to default, that is, enabled by default. For more information, see Creating a New VXLAN BGP EVPN Fabric.
Note
The FEX feature is available only on LAN devices. Therefore, checking this check box displays only the Cisco Nexus switches that support FEX.
Note
FEX is also not supported on Cisco Nexus 1000V devices. Therefore, such devices will not be displayed in the topology when you check the FEX check box.
-
Links: Check this check box to view links in the topology. The following options are available:
-
Errors Only: Click this radio button to view only links with errors.
-
All: Click this radio button to view all the links in the topology.
-
VPC Only: Check this check box to view only vPC peer-links and vPCs.
-
Bandwidth: Check this check box to view the color coding based on the bandwidth that is consumed by the links.
-
-
OTV: Check this check box to show the Overlay Transport Virtualization (OTV) topology with the cloud icon and the dotted links from the OTV edge devices. Hovering the cursor over the cloud and the links shows the relevant information for OTV topology, such as control group, extended VLANs, and so on. The OTV search field appears below the filter field. Use the OTV search field to search the shown OTV topology that is based on Overlay ID and Extended VLAN ID. The searched virtual links based on the Overlay ID and Extended VLAN ID are marked green.
A Details link appears after you check the OTV check box. Clicking the link shows the OTV topology data. The Overlay Network column shows whether the particular topology is multicast based or unicast based. The Edge Device column displays the edge switches in the particular OTV topology. The other columns display the corresponding overlay interface, extended VLANs, join interface, and data group information.
-
UI controls: Check the check box to show or hide the various controls on the Topology window.
-
Compute: Check the check box to enable the compute visibility on the Topology window.
-
Refresh: You can also perform a topology refresh by clicking the Refresh icon in the upper-right corner of this panel.
Layouts
The topology supports different layouts along with a Save Layout option that remembers how you positioned your topology.
-
Hierarchical and Hierarchical Left-Right: Provide an architectural view of your topology. Various switch roles can be defined that will draw the nodes on how you configure your CLOS topology.
Note
When running a large-scale setup, being able to easily view all your switches on a leaf-tier can become difficult. To mitigate this, DCNM splits your leaf-tier every 16 switches.
-
Random: Nodes are placed randomly on the window. DCNM tries to make a guess and intelligently place nodes that belong together in close proximity.
-
Circular and Tiered-Circular: Draw nodes in a circular or concentric circular pattern.
-
Custom saved layout: Nodes can be dragged around according to your preference. After you position as required, click Save to retain the positions. The next time you come to the topology, DCNM will draw the nodes based on your last saved layout positions.
Before a layout is chosen, DCNM checks if a custom layout is applied. If a custom layout is applied, DCNM uses it. If a custom layout is not applied, DCNM checks if switches exist at different tiers, and chooses the Hierarchical layout or the Hierarchical Left-Right layout. Force-directed layout is chosen if all the other layouts fail.
Zooming, Panning, and Dragging
You can zoom in and zoom out using the controls that are provided at the bottom left of the windows or by using your mouse's wheel.
To pan, click and hold anywhere in the whitespace and drag the cursor up, down, left, or right.
To drag switches, click, hold, and move the cursor around the whitespace region of the topology.
In VXLAN (standalone, MSD, and MSD member) fabrics and external fabrics, discovered links or connections (via CDP) to non-DCNM managed switches are represented by a cloud labelled Undiscovered.
Undiscovered Cloud Display
In the Topology screen, you can see an Undiscovered cloud at the top part of the image.
Note |
The Undiscovered cloud is hidden by default. You can display the Undiscovered cloud by clicking the Cloud icon (at the bottom left part of the screen). |
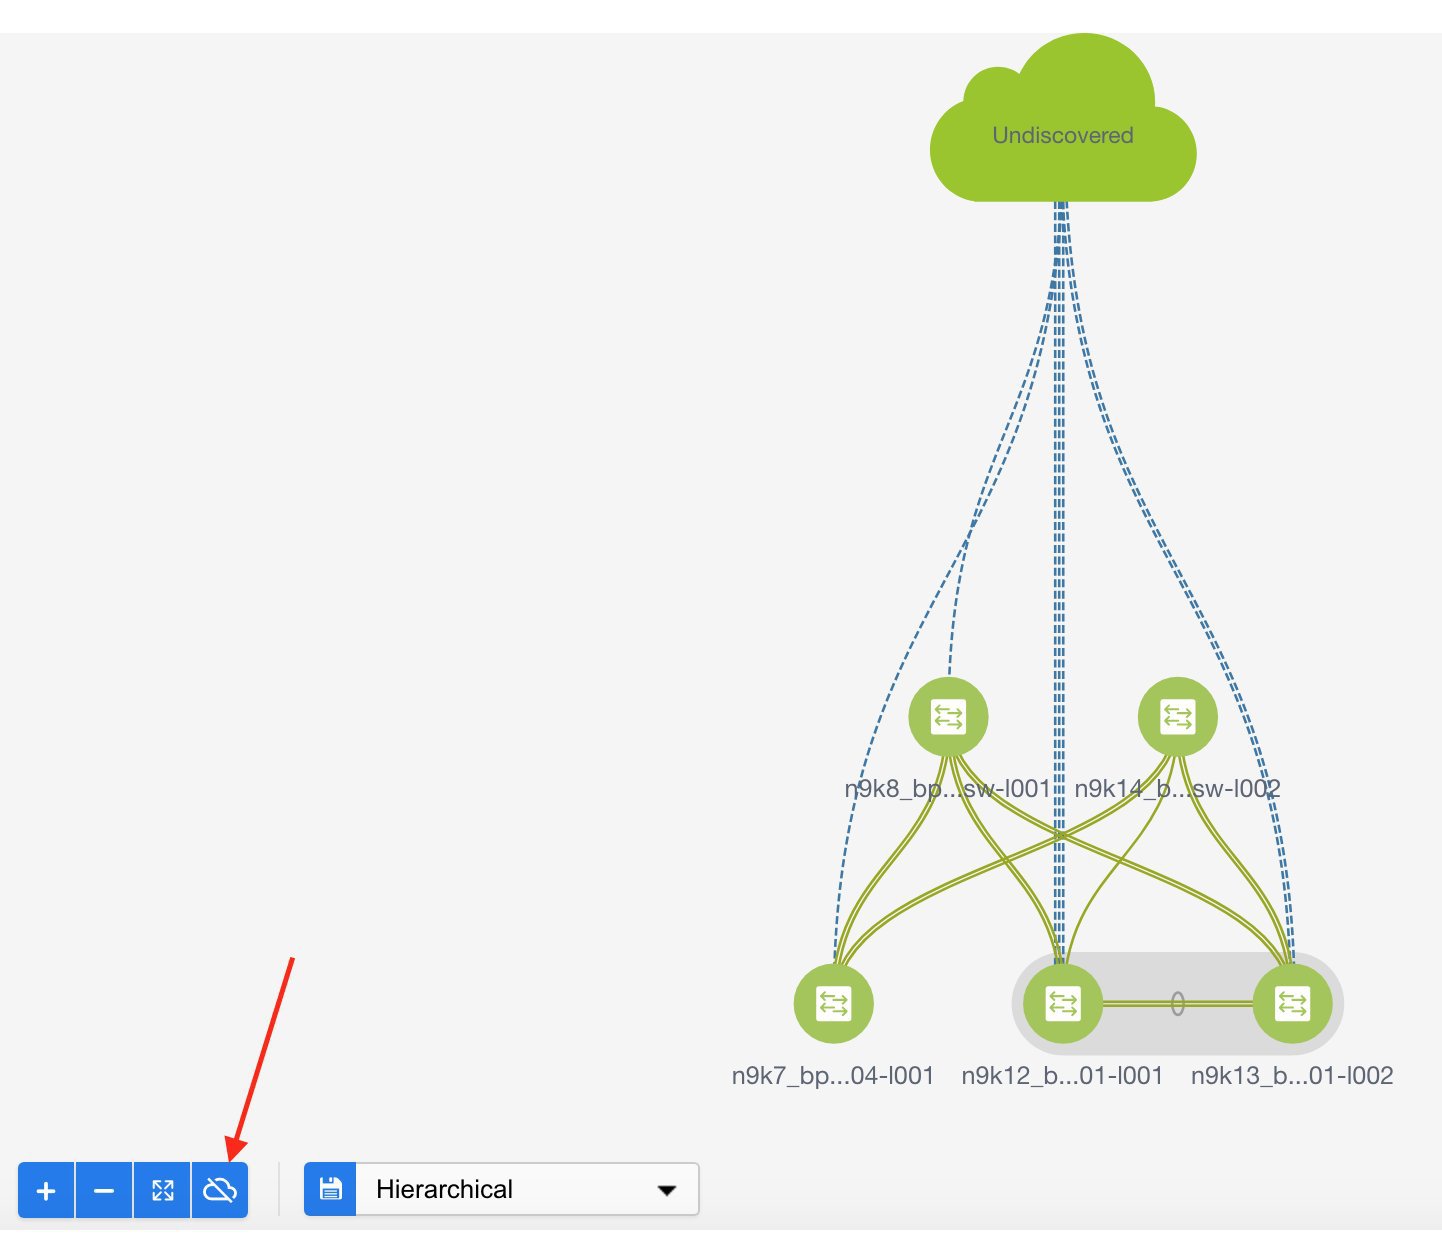
Click again to stop the Undiscovered cloud from being displayed. You can see that the Undiscovered cloud and its links to the fabric devices are not displayed.

Click the Cloud icon again to display the Undiscovered cloud.
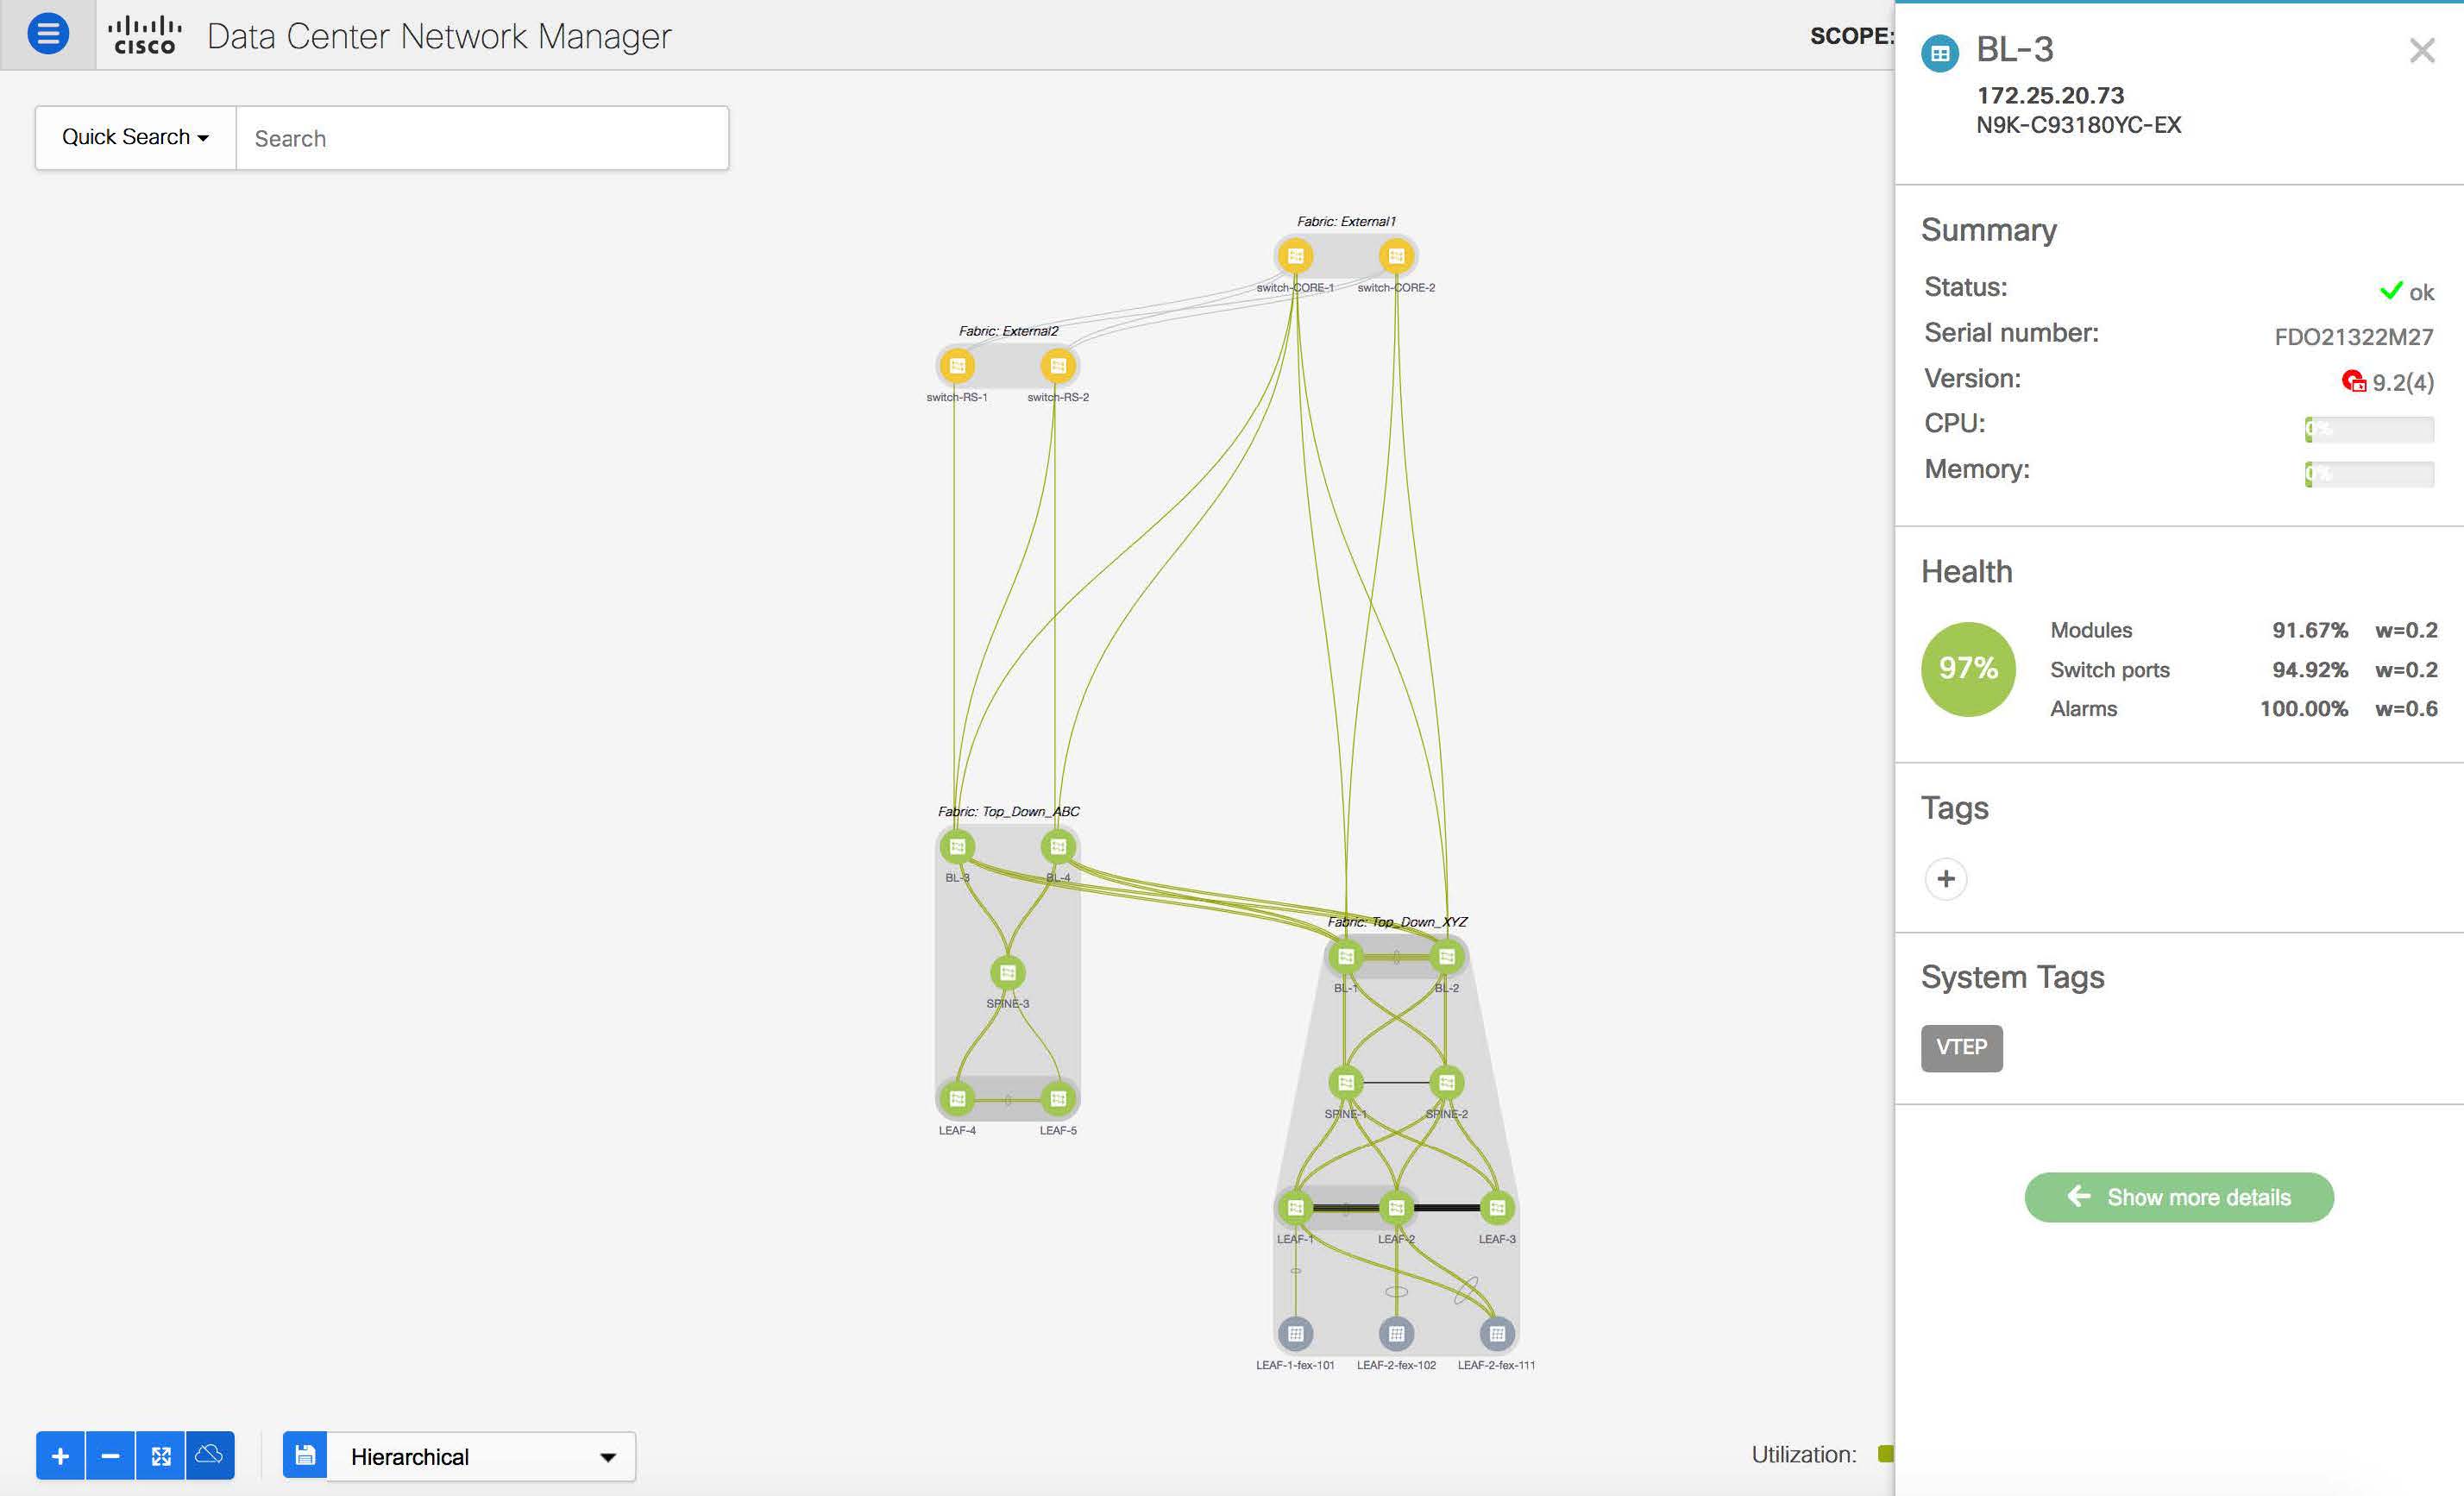
Switch Slide-Out Panel
You can click on the switch to display the configured switch name, IP address, switch model, and other summary information such as status, serial number, health, last-polled CPU utilization, and last-polled memory utilization.
Beacon
This button will be shown for switches that support the beacon command. After beaconing starts, the button will show a countdown. By default, the beaconing will stop after 60 seconds, but you can stop it immediately by clicking Stop Beacon.
Note |
The default time can be configured in server.properties file. Search for beacon.turnOff.time. The time value is in milliseconds. Note that this requires a server restart to take effect. |
Tagging
Tagging is a powerful yet easy way to organize your switches. Tags can be virtually any string, for example, building 6, floor 2, rack 7, problem switch, and Justin debugging.
Use the search functionality to perform searches based on tags.
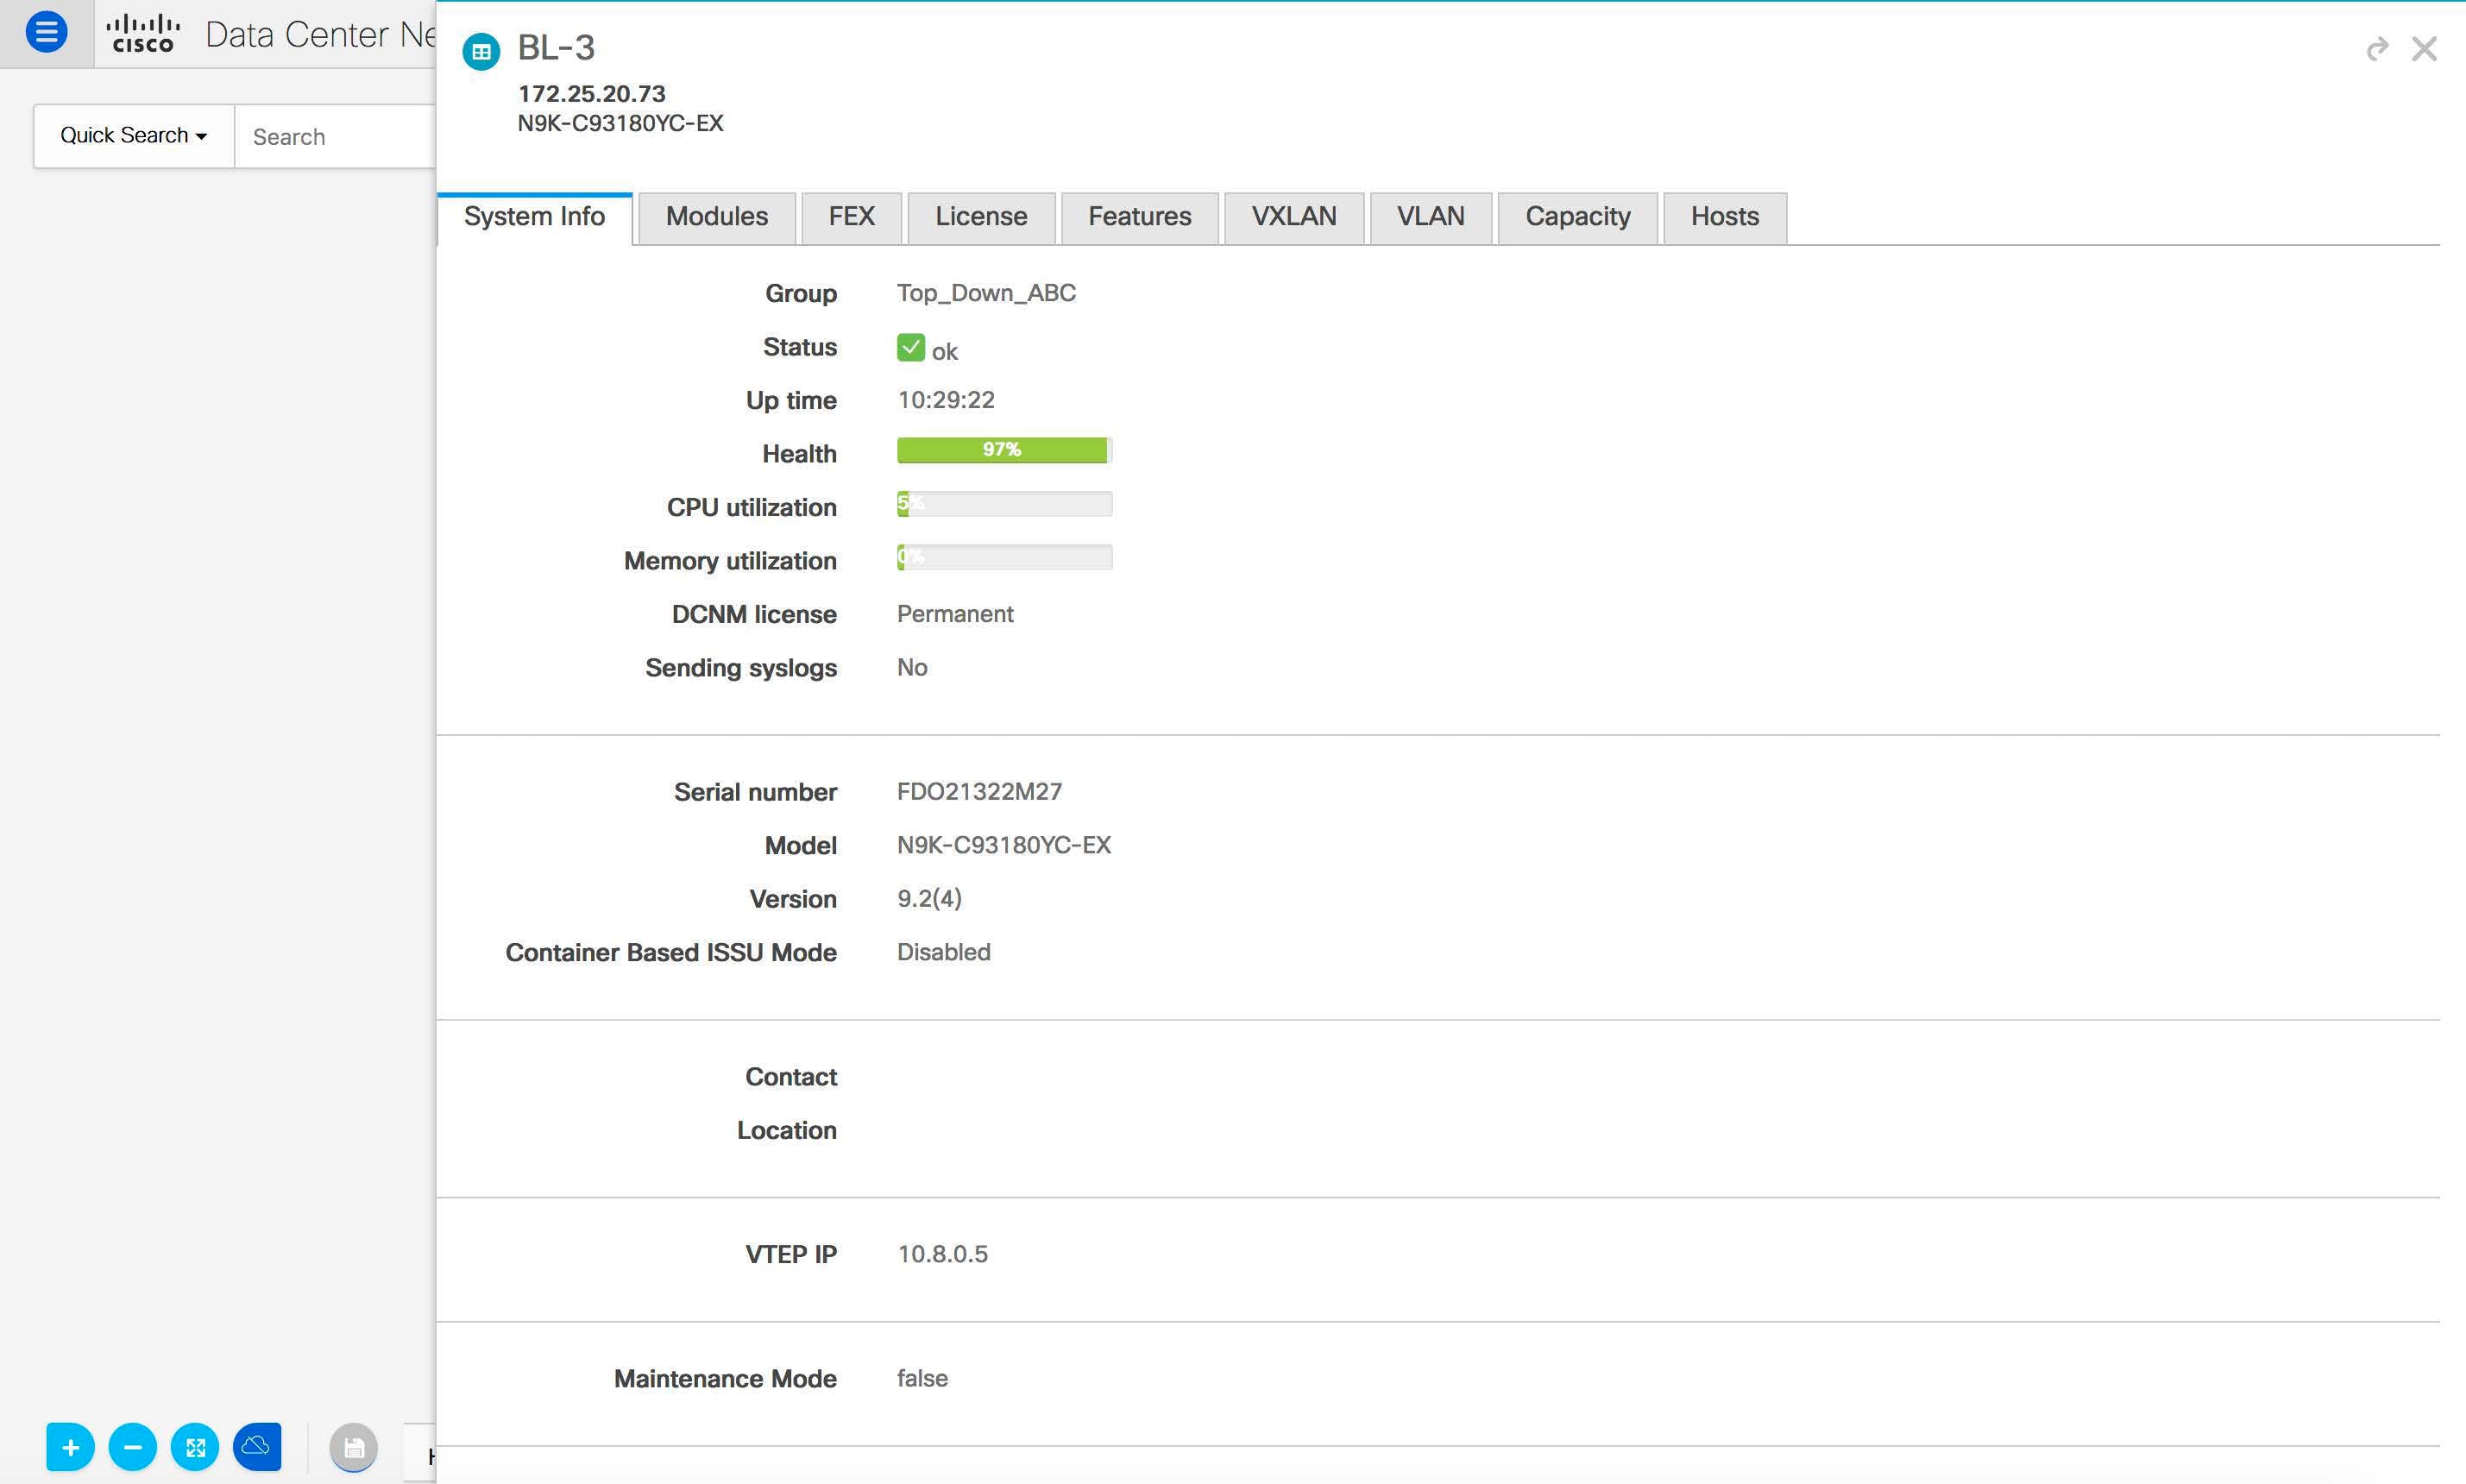
More Details
Click Show more details to display more information under the following tabs: System Info, Modules, FEX, License, Features, VXLAN, VLAN, Capacity and Hosts.
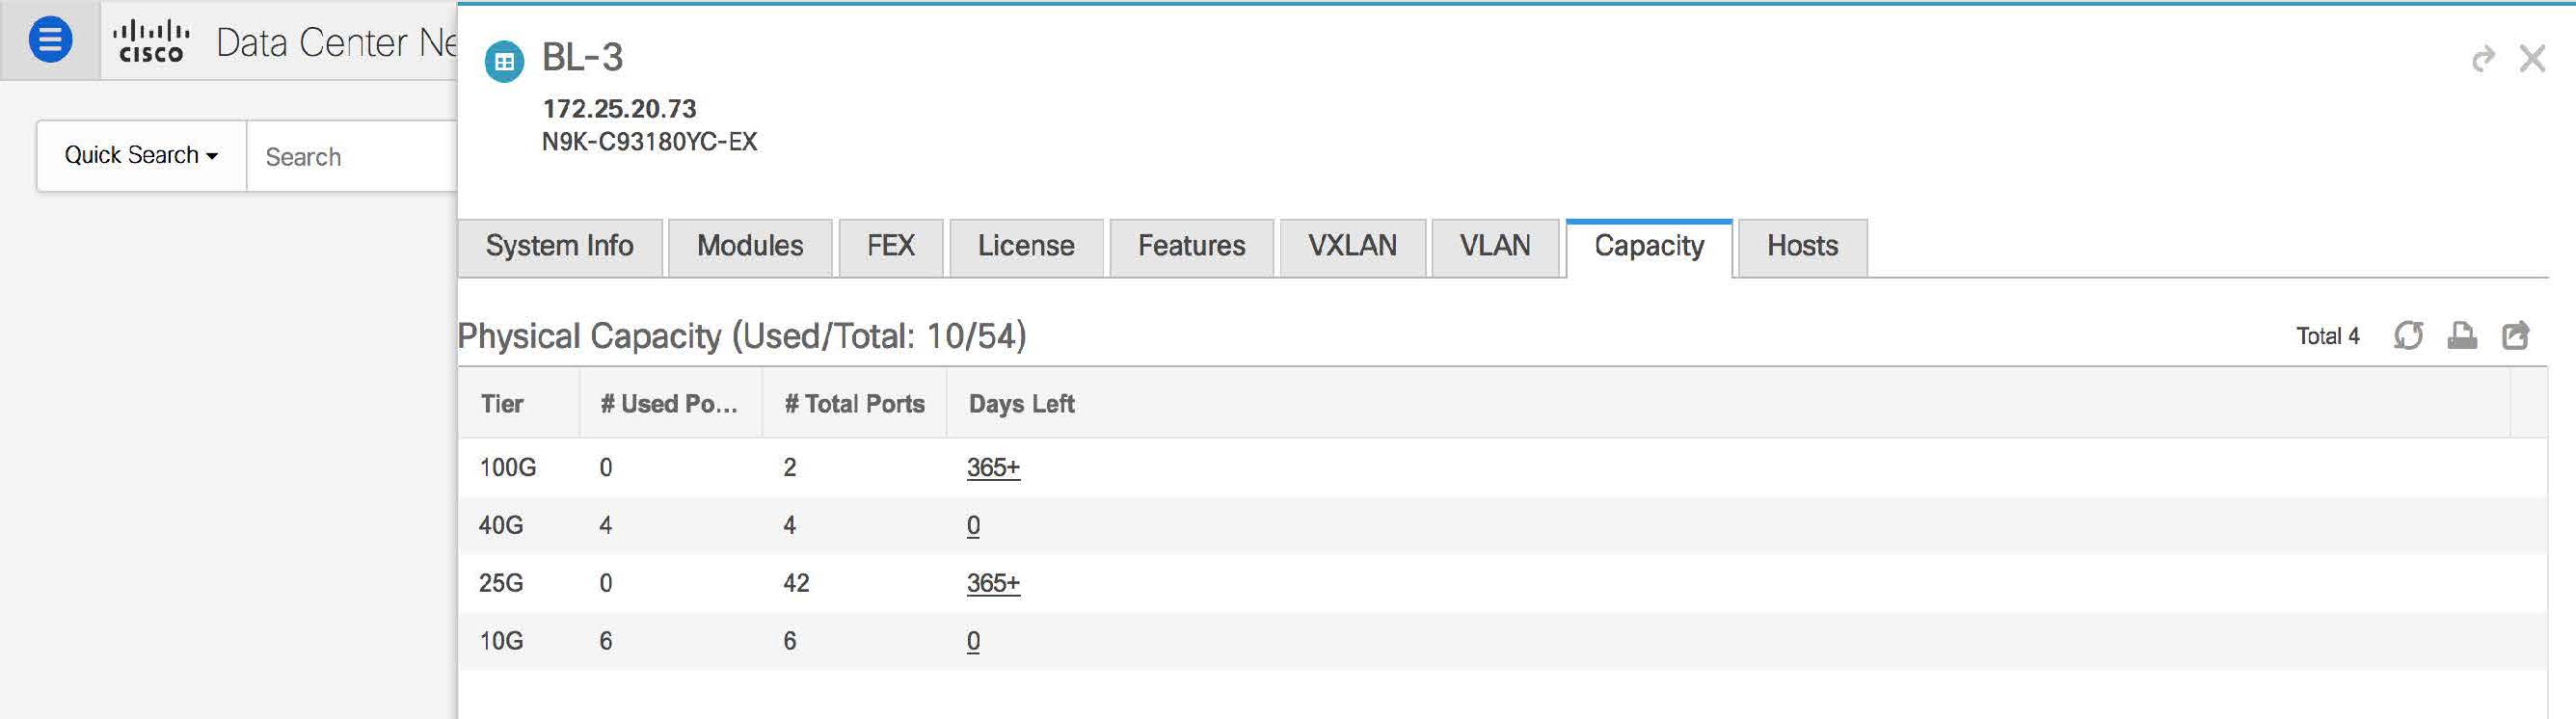
Starting from Cisco DCNM Release 11.4(1), the 400G tier has also been added to the Physical Capacity table under the Capacity tab. However, the Physical Capacity table under the Capacity tab will only show information about the physical ports that are present on the switch. For example, if the switch does not have a 400G physical port, the 400G tier is not displayed in the Physical Capacity table.
Link Slide-Out Panel
You can click a link to view the status and the port or switches that describe the link.
24-Hour Traffic
This feature requires Performance Monitoring to be turned ON. When Performance Monitoring is ON, traffic information is collected and the aggregate information is displayed along with a graph showing traffic utilization.
Container Orchestrator
From Release 11.3(1), Cisco DCNM allows you to configure Container Orchestrator. This feature allows you to visualize Kubernetes cluster as Container Orchestrator with the Cisco DCNM.
Ensure that you have successfully configured the VMM on Cisco DCNM before enabling Container Orchestrator Visualization feature. However, you do not need VMM for Bare-metal based Kubernetes cluster.
The Container visualization begins only after the first Kubernetes cluster is added to the container orchestrator. The information that is received from Kubernetes is appropriately organized and displayed on the main Topology window. An extra menu item labeled Containers appears on the Show pane.
At any point of time, click on any component in the Topology to view all the network paths between the selected component and fabric.
The following image details all the various features for Container Orchestrator Visualization on Cisco DCNM.
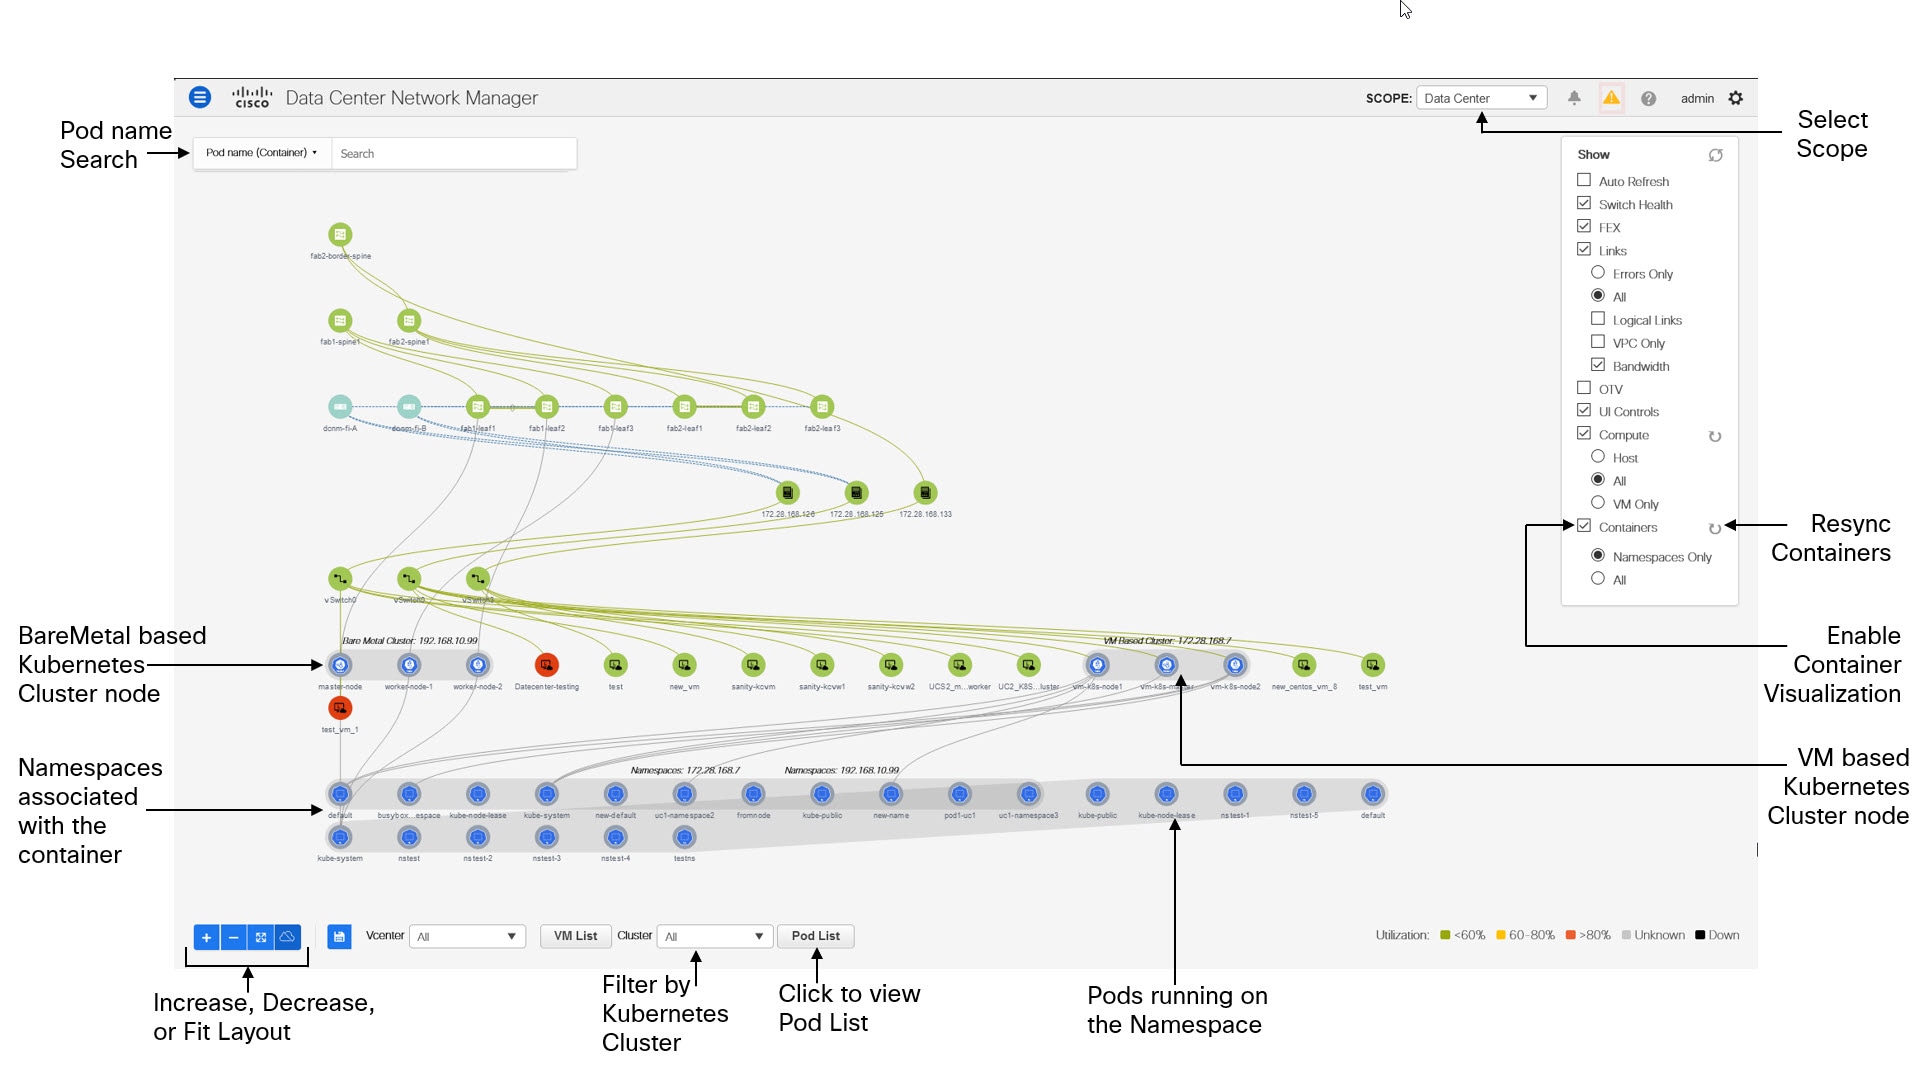
You can view the Container Orchestrator visualization based on the following important options:
-
Refresh: Click on this icon to refresh the topology data.
-
Auto Refresh: Select this checkbox to refresh the topology automatically.
-
Switch Health: Select this checkbox to view the switch health status.
-
Links: Select this check box to view links in the topology. The following options are available:
-
Errors Only: Click this radio button to view only links with errors.
-
All: Click this radio button to view all the links in the topology.
-
VPC Only: Check this check box to view only vPC peer-links and vPCs.
-
Bandwidth: Check this check box to view the color coding based on the bandwidth that is consumed by the links.
-
-
UI controls: Select this check box to show all the various controls on the Topology window.
-
Compute: Check the check box to enable the VCenter Compute Visualization.
-
Select Host to display the Compute hosts.
-
Select All to display all the compute nodes.
-
Select VM Only to display only the VMs.
Resync to resynchronize the topology by clicking the Resync icon located next to Compute in the Show panel.
-
-
Containers: Check the check box to display the containers.
-
By default, Namespaces only is selected to display only the Namespaces in the Kubernetes cluster
-
Select All to view both Namespaces and Pods associated with the namespaces.
-
-
Resync: You can also resynchronize the topology by clicking the Resync icon located next to Containers in the Show panel.
We recommend that you wait for few minutes before resynchronizing the Containers, after Compute Resync is complete.
Using the UI Controls on Container Orchestrator Visualization
After you enable Containers on the Show panel, the cluster nodes are displayed with their Namespaces associations. For VM based Kubernetes cluster, based on the Compute selection (Hosts or VM Only or All), the topology displays the Kubernetes Clusters and associated Namespaces. For Bare-metal based Kubernetes cluster, compute selection is not required.
The ![]() icon indicates the Kubernetes nodes. The Kubernetes installation type
and IP address are displayed on the Kubernetes
Cluster. The
icon indicates the Kubernetes nodes. The Kubernetes installation type
and IP address are displayed on the Kubernetes
Cluster. The ![]() icon indicates the Namespaces in the Kubernetes Cluster, and the
icon indicates the Namespaces in the Kubernetes Cluster, and the
![]() icon indicates the Pods associated with the Namespace.
icon indicates the Pods associated with the Namespace.
Kubernetes Clusters are of two types:
-
VM based Kubernetes clusters are hosted on the VCenter.
-
Kubernetes installed on Bare-metal, which is directly connected to a Switch.
On the UI Controls, from the Cluster Selection drop-down list, you can select one cluster to view the Container Visualization on that Cluster.

The topology now displays the Container Visualization only for the selected Cluster. Note that the other Kubernetes Clusters icon changes to the VM icon.
Note |
Ensure that you select the FEX checkbox when you're viewing Compute nodes. The Hosts or VMs behind the FEX will be dangling, otherwise. |

Double-click on the Nodes to view details about the node. A side panel appears, showing the Node Summary. Click Show More Details to view MetaData, Specifications, and Status information for the selected node.
Metadata tab consists of Kubernetes node or Pod name. Specifications tab include the desired design or configuration of the node or the Pod. Status tab indicates the running state information of the node or the pod.

Double-click on the Namespaces to view the pods running on it. Double click on the Namespace again, to collapse the Pods associated with the Namespace.
Select All under the Containers on the Show panel to view all the Pods running on all the Namespaces. If there are more than 200 Pods, a new cropped view of the Topology is displayed with 5 Namespaces per Cluster, and 5 Pods per Namespace, to avoid rendering delays. An indicator appears to indicate that the Topology is cropped. You must view the Pod list to see the complete Topology details. You can also export the Pod List data for further analysis.

Double-click on the Pods to view details about the pod. A side panel appears, showing the Pod Summary. Click Show More Details to view MetaData, Specifications, and Status information for selected pod, specific to the Namespace to which it is connected.

Note |
Ensure that you select the FEX checkbox when you're viewing Container nodes. The Hosts or VMs behind the FEX will be dangling, otherwise. |
You can also click on the Pod List to view the information regarding all the pods running on the selected Cluster. If Cluster Selection is All, all the pods running on all the clusters in your topology is displayed. You can also export the Pod List data for further analysis.
Pod Name (Container) Topology Search
You can locate the Pods using the Topology Search. From the Topology Search drop-down list, select Pod name (Container) Search type. In the Search field, enter the pod name. The pods and the namespace to which is connected in highlighted in the Topology.
Note |
The Pod search is partial unless you enter the exact name of the Pod. All the pods starting with the search string are highlighted. |

 Feedback