- Overview of UCS Blade Server Diagnostics
- Getting Started with Cisco UCS Blade Server Diagnostics
- Using the Cisco UCS Blade Server Diagnostics User Interface
- Using Cisco UCS Blade Server Diagnostics Test Components
- Viewing Server Information
- Running Diagnostic Tests Using the GUI
- Running Diagnostics Tests Using the CLI
- Viewing Logs
- Command Reference for the CLI
Using the Cisco UCS Blade Server Diagnostics User Interface
This chapter contains the following sections:
Understanding the UCS Blade Server Diagnostics Graphical User Interface
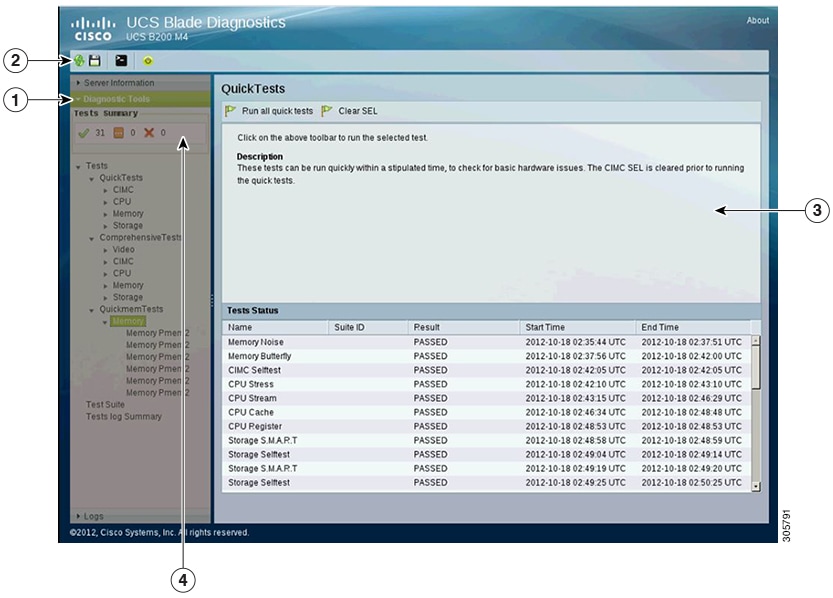
The following figure explains the UI components of the diagnostics tool.
|
1 |
Navigation pane |
|
2 |
Toolbar |
|
3 |
Content pane |
|
4 |
Tests Summary panel |
|
Navigation pane |
Displays the options that you can choose, such as Server Information, Diagnostic Tools, or Logs. |
|
Toolbar |
Displays the quick icons on the top-left corner of the window. The options displayed are Save Logs, Enter CLI mode, and Refresh. |
|
Content pane |
Displays the details about an option that you choose in the Navigation pane, for example, the details about a server, information about all the tests within a test suite, or log details. Displays on the right side of the GUI. In the lower part of the Contents pane, the tests results are displayed in the Test Status area. |
|
Tests Summary panel |
Displays a quick summary of all the tests that are completed successfully, tests in queue, and tests that failed. This component is visible only when you choose the Diagnostic Tools option in the Navigation pane. |
| Server Information | Overview | Displays server properties, such as the manufacturer name and product name, and Server Summary, CPU Processors, and CPU Cores. | ||
| Inventory | Displays detailed information about CPUs, Memory, IO, Storage, BIOS, CIMC, and PCI. | |||
| Status | Displays the health of the subsystems on your server such as CPUs, memory, storage, Peripheral Component Interconnect (PCI) devices, BIOS, and CIMC. | |||
| Sensors | Displays current sensor
readings, such as memory temperature and error codes (ECC), from Intelligent
Platform Management Interface (IPMI).
|
|||
|
Diagnostic Tools |
Enables you to run various types of diagnostic tests to detect server failures. For more information about Diagnostic Tools, see chapter Diagnostic Tools of Cisco UCS Server Configuration Utility, Release 4.0(13) User Guide at https://www.cisco.com/c/en/us/td/docs/unified_computing/ucs/sw/ucsscu/user/guide/413/Cisco_UCS_SCU_User_Guide_4_13.html. |
|||
|
Logs |
For more information about Logs, see chapter Viewing Logs of Cisco UCS Server Configuration Utility, Release 4.0(13) User Guide at https://www.cisco.com/c/en/us/td/docs/unified_computing/ucs/sw/ucsscu/user/guide/413/Cisco_UCS_SCU_User_Guide_4_13.html. |
| Toolbar Icon | Name | Function |
|---|---|---|
|
|
Save Logs |
Saves logs to a USB drive. |
|
|
Refresh |
Refreshes the content area, if supported. |
|
|
Enter CLI mode |
Returns to the CLI mode. |
|
|
Reboot |
Reboot the server. |


 Feedback